Immigrants from Latin America vs Immigrants from Uganda Female Poverty Among 25-34 Year Olds
COMPARE
Immigrants from Latin America
Immigrants from Uganda
Female Poverty Among 25-34 Year Olds
Female Poverty Among 25-34 Year Olds Comparison
Immigrants from Latin America
Immigrants from Uganda
16.0%
FEMALE POVERTY AMONG 25-34 YEAR OLDS
0.0/ 100
METRIC RATING
281st/ 347
METRIC RANK
13.5%
FEMALE POVERTY AMONG 25-34 YEAR OLDS
53.0/ 100
METRIC RATING
170th/ 347
METRIC RANK
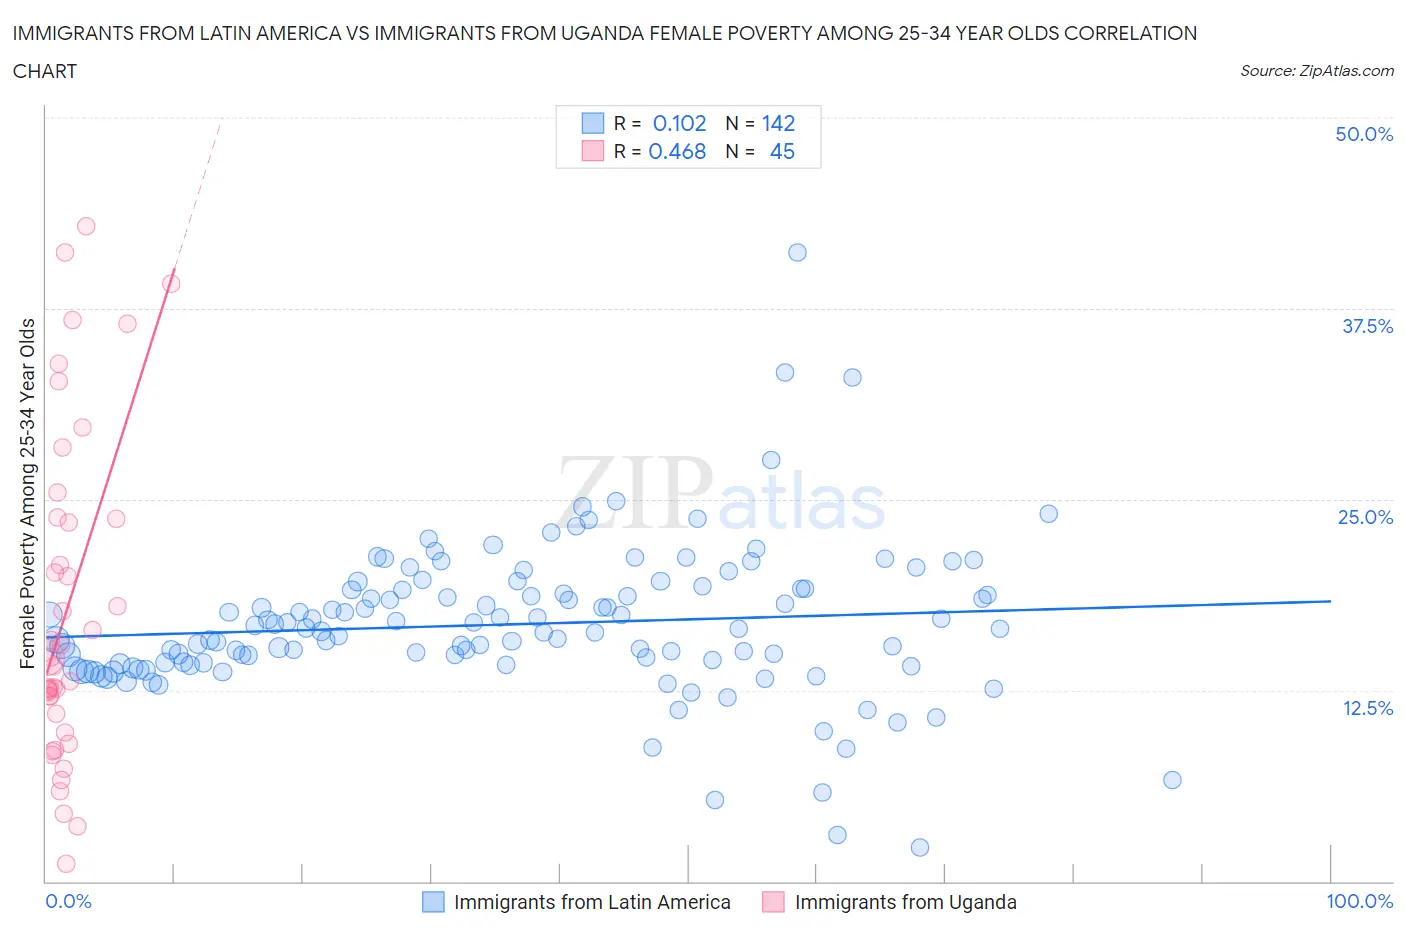
Immigrants from Latin America vs Immigrants from Uganda Female Poverty Among 25-34 Year Olds Correlation Chart
The statistical analysis conducted on geographies consisting of 540,358,744 people shows a poor positive correlation between the proportion of Immigrants from Latin America and poverty level among females between the ages 25 and 34 in the United States with a correlation coefficient (R) of 0.102 and weighted average of 16.0%. Similarly, the statistical analysis conducted on geographies consisting of 125,339,935 people shows a moderate positive correlation between the proportion of Immigrants from Uganda and poverty level among females between the ages 25 and 34 in the United States with a correlation coefficient (R) of 0.468 and weighted average of 13.5%, a difference of 18.5%.
Female Poverty Among 25-34 Year Olds Correlation Summary
| Measurement | Immigrants from Latin America | Immigrants from Uganda |
| Minimum | 2.2% | 1.2% |
| Maximum | 41.2% | 42.9% |
| Range | 38.9% | 41.7% |
| Mean | 16.8% | 17.8% |
| Median | 16.4% | 14.6% |
| Interquartile 25% (IQ1) | 14.2% | 10.4% |
| Interquartile 75% (IQ3) | 19.1% | 23.8% |
| Interquartile Range (IQR) | 4.9% | 13.4% |
| Standard Deviation (Sample) | 5.0% | 10.7% |
| Standard Deviation (Population) | 4.9% | 10.6% |
Similar Demographics by Female Poverty Among 25-34 Year Olds
Demographics Similar to Immigrants from Latin America by Female Poverty Among 25-34 Year Olds
In terms of female poverty among 25-34 year olds, the demographic groups most similar to Immigrants from Latin America are Bangladeshi (15.9%, a difference of 0.51%), Aleut (16.1%, a difference of 0.66%), French American Indian (15.9%, a difference of 0.67%), Fijian (15.9%, a difference of 0.67%), and Bahamian (16.1%, a difference of 0.69%).
| Demographics | Rating | Rank | Female Poverty Among 25-34 Year Olds |
| Immigrants | Caribbean | 0.0 /100 | #274 | Tragic 15.7% |
| Immigrants | Azores | 0.0 /100 | #275 | Tragic 15.8% |
| Immigrants | Zaire | 0.0 /100 | #276 | Tragic 15.8% |
| Immigrants | Micronesia | 0.0 /100 | #277 | Tragic 15.8% |
| French American Indians | 0.0 /100 | #278 | Tragic 15.9% |
| Fijians | 0.0 /100 | #279 | Tragic 15.9% |
| Bangladeshis | 0.0 /100 | #280 | Tragic 15.9% |
| Immigrants | Latin America | 0.0 /100 | #281 | Tragic 16.0% |
| Aleuts | 0.0 /100 | #282 | Tragic 16.1% |
| Bahamians | 0.0 /100 | #283 | Tragic 16.1% |
| Shoshone | 0.0 /100 | #284 | Tragic 16.2% |
| Immigrants | Bahamas | 0.0 /100 | #285 | Tragic 16.3% |
| Cape Verdeans | 0.0 /100 | #286 | Tragic 16.3% |
| Americans | 0.0 /100 | #287 | Tragic 16.4% |
| Guatemalans | 0.0 /100 | #288 | Tragic 16.4% |
Demographics Similar to Immigrants from Uganda by Female Poverty Among 25-34 Year Olds
In terms of female poverty among 25-34 year olds, the demographic groups most similar to Immigrants from Uganda are South American Indian (13.5%, a difference of 0.090%), Immigrants from Costa Rica (13.5%, a difference of 0.090%), Kenyan (13.5%, a difference of 0.10%), Immigrants from Oceania (13.5%, a difference of 0.25%), and Samoan (13.5%, a difference of 0.32%).
| Demographics | Rating | Rank | Female Poverty Among 25-34 Year Olds |
| British | 63.5 /100 | #163 | Good 13.4% |
| Swiss | 61.7 /100 | #164 | Good 13.4% |
| Basques | 59.3 /100 | #165 | Average 13.4% |
| Belgians | 58.9 /100 | #166 | Average 13.4% |
| Immigrants | Bosnia and Herzegovina | 58.6 /100 | #167 | Average 13.4% |
| Immigrants | Afghanistan | 57.7 /100 | #168 | Average 13.4% |
| Samoans | 56.8 /100 | #169 | Average 13.5% |
| Immigrants | Uganda | 53.0 /100 | #170 | Average 13.5% |
| South American Indians | 51.9 /100 | #171 | Average 13.5% |
| Immigrants | Costa Rica | 51.9 /100 | #172 | Average 13.5% |
| Kenyans | 51.8 /100 | #173 | Average 13.5% |
| Immigrants | Oceania | 50.0 /100 | #174 | Average 13.5% |
| Bermudans | 46.8 /100 | #175 | Average 13.6% |
| Yugoslavians | 45.0 /100 | #176 | Average 13.6% |
| Venezuelans | 44.6 /100 | #177 | Average 13.6% |