Ottawa vs Immigrants from Uganda Female Poverty Among 25-34 Year Olds
COMPARE
Ottawa
Immigrants from Uganda
Female Poverty Among 25-34 Year Olds
Female Poverty Among 25-34 Year Olds Comparison
Ottawa
Immigrants from Uganda
17.1%
FEMALE POVERTY AMONG 25-34 YEAR OLDS
0.0/ 100
METRIC RATING
309th/ 347
METRIC RANK
13.5%
FEMALE POVERTY AMONG 25-34 YEAR OLDS
53.0/ 100
METRIC RATING
170th/ 347
METRIC RANK
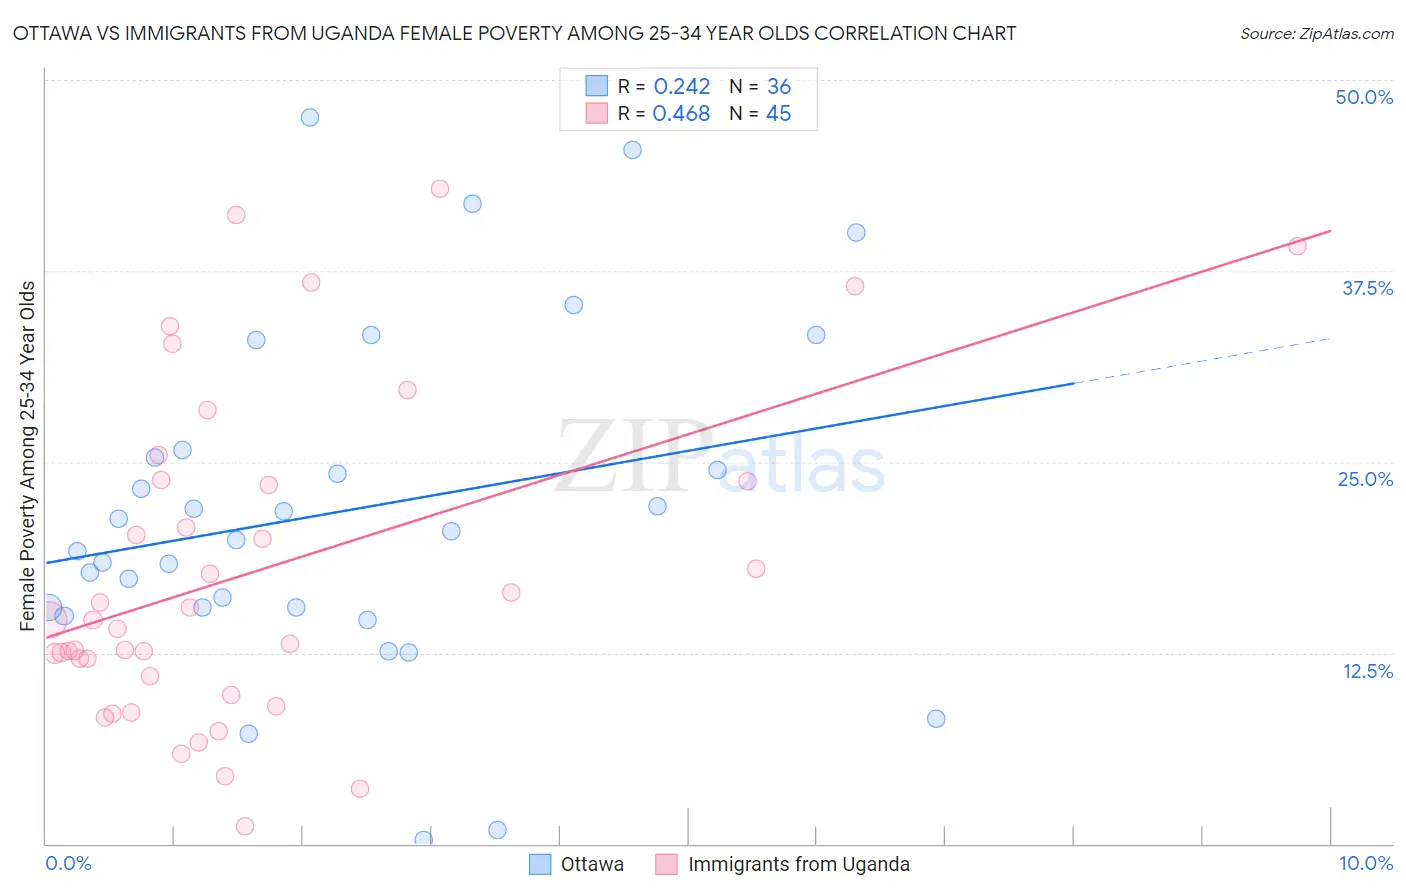
Ottawa vs Immigrants from Uganda Female Poverty Among 25-34 Year Olds Correlation Chart
The statistical analysis conducted on geographies consisting of 49,772,862 people shows a weak positive correlation between the proportion of Ottawa and poverty level among females between the ages 25 and 34 in the United States with a correlation coefficient (R) of 0.242 and weighted average of 17.1%. Similarly, the statistical analysis conducted on geographies consisting of 125,339,935 people shows a moderate positive correlation between the proportion of Immigrants from Uganda and poverty level among females between the ages 25 and 34 in the United States with a correlation coefficient (R) of 0.468 and weighted average of 13.5%, a difference of 26.7%.
Female Poverty Among 25-34 Year Olds Correlation Summary
| Measurement | Ottawa | Immigrants from Uganda |
| Minimum | 0.24% | 1.2% |
| Maximum | 47.6% | 42.9% |
| Range | 47.3% | 41.7% |
| Mean | 21.8% | 17.8% |
| Median | 20.2% | 14.6% |
| Interquartile 25% (IQ1) | 15.5% | 10.4% |
| Interquartile 75% (IQ3) | 25.5% | 23.8% |
| Interquartile Range (IQR) | 10.1% | 13.4% |
| Standard Deviation (Sample) | 11.2% | 10.7% |
| Standard Deviation (Population) | 11.0% | 10.6% |
Similar Demographics by Female Poverty Among 25-34 Year Olds
Demographics Similar to Ottawa by Female Poverty Among 25-34 Year Olds
In terms of female poverty among 25-34 year olds, the demographic groups most similar to Ottawa are African (17.0%, a difference of 0.30%), Cherokee (17.2%, a difference of 0.47%), Yaqui (17.0%, a difference of 0.50%), Chickasaw (17.0%, a difference of 0.52%), and Immigrants from Honduras (17.3%, a difference of 0.95%).
| Demographics | Rating | Rank | Female Poverty Among 25-34 Year Olds |
| Alaska Natives | 0.0 /100 | #302 | Tragic 16.8% |
| Immigrants | Mexico | 0.0 /100 | #303 | Tragic 16.8% |
| Hondurans | 0.0 /100 | #304 | Tragic 16.9% |
| Immigrants | Cabo Verde | 0.0 /100 | #305 | Tragic 16.9% |
| Chickasaw | 0.0 /100 | #306 | Tragic 17.0% |
| Yaqui | 0.0 /100 | #307 | Tragic 17.0% |
| Africans | 0.0 /100 | #308 | Tragic 17.0% |
| Ottawa | 0.0 /100 | #309 | Tragic 17.1% |
| Cherokee | 0.0 /100 | #310 | Tragic 17.2% |
| Immigrants | Honduras | 0.0 /100 | #311 | Tragic 17.3% |
| Iroquois | 0.0 /100 | #312 | Tragic 17.5% |
| Colville | 0.0 /100 | #313 | Tragic 17.5% |
| Immigrants | Dominican Republic | 0.0 /100 | #314 | Tragic 17.6% |
| Yakama | 0.0 /100 | #315 | Tragic 17.6% |
| Dominicans | 0.0 /100 | #316 | Tragic 17.6% |
Demographics Similar to Immigrants from Uganda by Female Poverty Among 25-34 Year Olds
In terms of female poverty among 25-34 year olds, the demographic groups most similar to Immigrants from Uganda are South American Indian (13.5%, a difference of 0.090%), Immigrants from Costa Rica (13.5%, a difference of 0.090%), Kenyan (13.5%, a difference of 0.10%), Immigrants from Oceania (13.5%, a difference of 0.25%), and Samoan (13.5%, a difference of 0.32%).
| Demographics | Rating | Rank | Female Poverty Among 25-34 Year Olds |
| British | 63.5 /100 | #163 | Good 13.4% |
| Swiss | 61.7 /100 | #164 | Good 13.4% |
| Basques | 59.3 /100 | #165 | Average 13.4% |
| Belgians | 58.9 /100 | #166 | Average 13.4% |
| Immigrants | Bosnia and Herzegovina | 58.6 /100 | #167 | Average 13.4% |
| Immigrants | Afghanistan | 57.7 /100 | #168 | Average 13.4% |
| Samoans | 56.8 /100 | #169 | Average 13.5% |
| Immigrants | Uganda | 53.0 /100 | #170 | Average 13.5% |
| South American Indians | 51.9 /100 | #171 | Average 13.5% |
| Immigrants | Costa Rica | 51.9 /100 | #172 | Average 13.5% |
| Kenyans | 51.8 /100 | #173 | Average 13.5% |
| Immigrants | Oceania | 50.0 /100 | #174 | Average 13.5% |
| Bermudans | 46.8 /100 | #175 | Average 13.6% |
| Yugoslavians | 45.0 /100 | #176 | Average 13.6% |
| Venezuelans | 44.6 /100 | #177 | Average 13.6% |