Chickasaw vs Jamaican Seniors Poverty Over the Age of 75
COMPARE
Chickasaw
Jamaican
Seniors Poverty Over the Age of 75
Seniors Poverty Over the Age of 75 Comparison
Chickasaw
Jamaicans
11.6%
SENIORS POVERTY OVER THE AGE OF 75
90.2/ 100
METRIC RATING
105th/ 347
METRIC RANK
15.1%
SENIORS POVERTY OVER THE AGE OF 75
0.0/ 100
METRIC RATING
288th/ 347
METRIC RANK
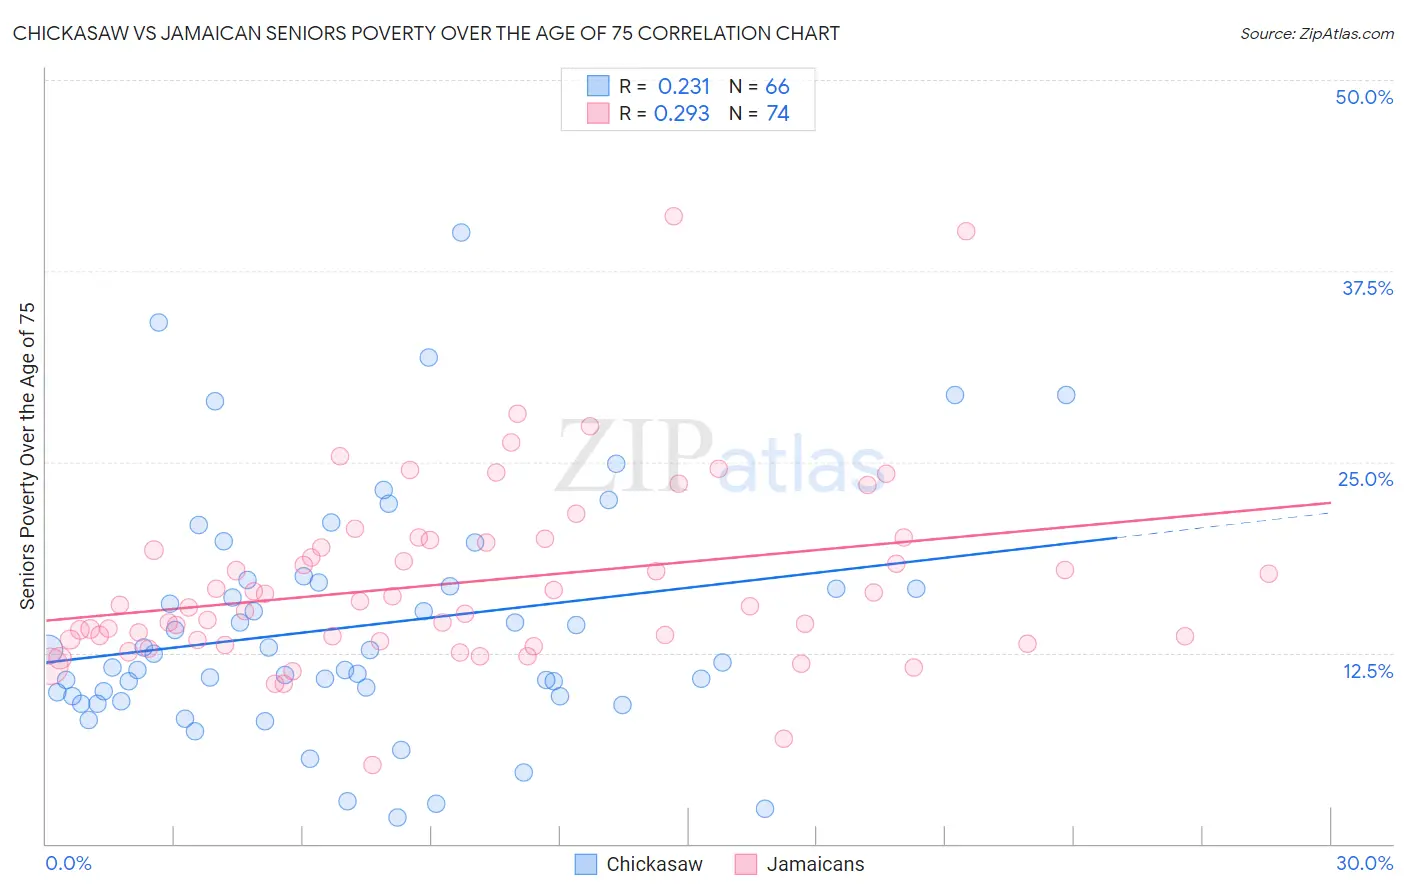
Chickasaw vs Jamaican Seniors Poverty Over the Age of 75 Correlation Chart
The statistical analysis conducted on geographies consisting of 146,762,079 people shows a weak positive correlation between the proportion of Chickasaw and poverty level among seniors over the age of 75 in the United States with a correlation coefficient (R) of 0.231 and weighted average of 11.6%. Similarly, the statistical analysis conducted on geographies consisting of 363,692,137 people shows a weak positive correlation between the proportion of Jamaicans and poverty level among seniors over the age of 75 in the United States with a correlation coefficient (R) of 0.293 and weighted average of 15.1%, a difference of 30.1%.
Seniors Poverty Over the Age of 75 Correlation Summary
| Measurement | Chickasaw | Jamaican |
| Minimum | 1.7% | 5.1% |
| Maximum | 40.0% | 41.1% |
| Range | 38.3% | 35.9% |
| Mean | 14.2% | 17.1% |
| Median | 12.2% | 15.6% |
| Interquartile 25% (IQ1) | 9.6% | 13.4% |
| Interquartile 75% (IQ3) | 17.1% | 19.7% |
| Interquartile Range (IQR) | 7.5% | 6.3% |
| Standard Deviation (Sample) | 7.7% | 6.1% |
| Standard Deviation (Population) | 7.7% | 6.0% |
Similar Demographics by Seniors Poverty Over the Age of 75
Demographics Similar to Chickasaw by Seniors Poverty Over the Age of 75
In terms of seniors poverty over the age of 75, the demographic groups most similar to Chickasaw are Immigrants from Singapore (11.6%, a difference of 0.010%), Immigrants from Kuwait (11.6%, a difference of 0.060%), Russian (11.6%, a difference of 0.080%), Guamanian/Chamorro (11.6%, a difference of 0.10%), and Jordanian (11.6%, a difference of 0.14%).
| Demographics | Rating | Rank | Seniors Poverty Over the Age of 75 |
| Immigrants | Japan | 91.9 /100 | #98 | Exceptional 11.6% |
| Immigrants | Ethiopia | 91.7 /100 | #99 | Exceptional 11.6% |
| Syrians | 91.1 /100 | #100 | Exceptional 11.6% |
| Jordanians | 90.8 /100 | #101 | Exceptional 11.6% |
| Guamanians/Chamorros | 90.6 /100 | #102 | Exceptional 11.6% |
| Immigrants | Kuwait | 90.5 /100 | #103 | Exceptional 11.6% |
| Immigrants | Singapore | 90.3 /100 | #104 | Exceptional 11.6% |
| Chickasaw | 90.2 /100 | #105 | Exceptional 11.6% |
| Russians | 89.9 /100 | #106 | Excellent 11.6% |
| Immigrants | Oceania | 89.4 /100 | #107 | Excellent 11.7% |
| Turks | 89.4 /100 | #108 | Excellent 11.7% |
| South Africans | 89.3 /100 | #109 | Excellent 11.7% |
| Immigrants | Jordan | 88.7 /100 | #110 | Excellent 11.7% |
| Burmese | 88.7 /100 | #111 | Excellent 11.7% |
| Immigrants | Bolivia | 88.4 /100 | #112 | Excellent 11.7% |
Demographics Similar to Jamaicans by Seniors Poverty Over the Age of 75
In terms of seniors poverty over the age of 75, the demographic groups most similar to Jamaicans are Immigrants from Belize (15.2%, a difference of 0.26%), Immigrants from the Azores (15.2%, a difference of 0.28%), Paiute (15.2%, a difference of 0.29%), Colville (15.2%, a difference of 0.48%), and Immigrants from Guatemala (15.1%, a difference of 0.60%).
| Demographics | Rating | Rank | Seniors Poverty Over the Age of 75 |
| Belizeans | 0.0 /100 | #281 | Tragic 14.8% |
| Immigrants | Senegal | 0.0 /100 | #282 | Tragic 14.8% |
| Guatemalans | 0.0 /100 | #283 | Tragic 14.8% |
| Cheyenne | 0.0 /100 | #284 | Tragic 14.9% |
| Immigrants | Mexico | 0.0 /100 | #285 | Tragic 14.9% |
| Immigrants | Central America | 0.0 /100 | #286 | Tragic 15.0% |
| Immigrants | Guatemala | 0.0 /100 | #287 | Tragic 15.1% |
| Jamaicans | 0.0 /100 | #288 | Tragic 15.1% |
| Immigrants | Belize | 0.0 /100 | #289 | Tragic 15.2% |
| Immigrants | Azores | 0.0 /100 | #290 | Tragic 15.2% |
| Paiute | 0.0 /100 | #291 | Tragic 15.2% |
| Colville | 0.0 /100 | #292 | Tragic 15.2% |
| Apache | 0.0 /100 | #293 | Tragic 15.3% |
| Immigrants | Jamaica | 0.0 /100 | #294 | Tragic 15.3% |
| U.S. Virgin Islanders | 0.0 /100 | #295 | Tragic 15.4% |