Brazilian vs Cambodian Child Poverty Among Girls Under 16

COMPARE

Brazilian
Race
Ancestry
AfghanAfricanAlaska NativeAlaskan AthabascanAlbanianAleutAlsatianAmericanApacheArabArapahoArgentineanArmenianAssyrian/Chaldean/SyriacAustralianAustrianBahamianBangladeshiBarbadianBasqueBelgianBelizeanBermudanBhutaneseBlackfeetBolivianBrazilianBritishBritish West IndianBulgarianBurmeseCajunCanadianCape VerdeanCarpatho RusynCelticCentral AmericanCentral American IndianCherokeeCheyenneChickasawChileanChineseChippewaChoctawColombianColvilleComancheCosta RicanCreeCreekCroatianCrowCubanCypriotCzechCzechoslovakianDanishDelawareDominicanDutchDutch West IndianEastern EuropeanEcuadorianEgyptianEnglishEstonianEthiopianEuropeanFijianFilipinoFinnishFrenchFrench American IndianFrench CanadianGermanGerman RussianGhanaianGreekGuamanian/ChamorroGuatemalanGuyaneseHaitianHmongHonduranHopiHoumaHungarianIcelanderIndian (Asian)IndonesianInupiatIranianIraqiIrishIroquoisIsraeliItalianJamaicanJapaneseJordanianKenyanKiowaKoreanLaotianLatvianLebaneseLiberianLithuanianLumbeeLuxembourgerMacedonianMalaysianMalteseMarshalleseMenomineeMexicanMexican American IndianMongolianMoroccanNative HawaiianNavajoNepaleseNew ZealanderNicaraguanNigerianNorthern EuropeanNorwegianOkinawanOsageOttawaPaiutePakistaniPalestinianPanamanianParaguayanPennsylvania GermanPeruvianPimaPolishPortuguesePotawatomiPuebloPuerto RicanPuget Sound SalishRomanianRussianSalvadoranSamoanScandinavianScotch-IrishScottishSeminoleSenegaleseSerbianShoshoneSierra LeoneanSiouxSlavicSlovakSloveneSomaliSouth AfricanSouth AmericanSouth American IndianSoviet UnionSpaniardSpanishSpanish AmericanSpanish American IndianSri LankanSubsaharan AfricanSudaneseSwedishSwissSyrianTaiwaneseThaiTlingit-HaidaTohono O'OdhamTonganTrinidadian and TobagonianTsimshianTurkishU.S. Virgin IslanderUgandanUkrainianUruguayanUteVenezuelanVietnameseWelshWest IndianYakamaYaquiYugoslavianYumanYup'ikZimbabwean
Immigration
NonimmigrantsImmigrantsAfghanistanAfricaAlbaniaArgentinaArmeniaAsiaAustraliaAustriaBahamasBangladeshBarbadosBelarusBelgiumBelizeBoliviaBosnia and HerzegovinaBrazilBulgariaBurma/MyanmarCabo VerdeCambodiaCameroonCanadaCaribbeanCentral AmericaChileChinaColombiaCongoCosta RicaCroatiaCubaCzechoslovakiaDenmarkDominicaDominican RepublicEastern AfricaEastern AsiaEastern EuropeEcuadorEgyptEl SalvadorEnglandEritreaEthiopiaEuropeFijiFranceGermanyGhanaGreeceGrenadaGuatemalaGuyanaHaitiHondurasHong KongHungaryIndiaIndonesiaIranIraqIrelandIsraelItalyJamaicaJapanJordanKazakhstanKenyaKoreaKuwaitLaosLatin AmericaLatviaLebanonLiberiaLithuaniaMalaysiaMexicoMicronesiaMiddle AfricaMoldovaMoroccoNepalNetherlandsNicaraguaNigeriaNorth AmericaNorth MacedoniaNorthern AfricaNorthern EuropeNorwayOceaniaPakistanPanamaPeruPhilippinesPolandPortugalRomaniaRussiaSaudi ArabiaScotlandSenegalSerbiaSierra LeoneSingaporeSomaliaSouth AfricaSouth AmericaSouth Central AsiaSouth Eastern AsiaSouthern EuropeSpainSri LankaSt. Vincent and the GrenadinesSudanSwedenSwitzerlandSyriaTaiwanThailandTrinidad and TobagoTurkeyUgandaUkraineUruguayUzbekistanVenezuelaVietnamWest IndiesWestern AfricaWestern AsiaWestern EuropeYemenZaireZimbabweAzores
Cambodian
Race
Ancestry
AfghanAfricanAlaska NativeAlaskan AthabascanAlbanianAleutAlsatianAmericanApacheArabArapahoArgentineanArmenianAssyrian/Chaldean/SyriacAustralianAustrianBahamianBangladeshiBarbadianBasqueBelgianBelizeanBermudanBhutaneseBlackfeetBolivianBritishBritish West IndianBulgarianBurmeseCajunCambodianCanadianCape VerdeanCarpatho RusynCelticCentral AmericanCentral American IndianCherokeeCheyenneChickasawChileanChineseChippewaChoctawColombianColvilleComancheCosta RicanCreeCreekCroatianCrowCubanCypriotCzechCzechoslovakianDanishDelawareDominicanDutchDutch West IndianEastern EuropeanEcuadorianEgyptianEnglishEstonianEthiopianEuropeanFijianFilipinoFinnishFrenchFrench American IndianFrench CanadianGermanGerman RussianGhanaianGreekGuamanian/ChamorroGuatemalanGuyaneseHaitianHmongHonduranHopiHoumaHungarianIcelanderIndian (Asian)IndonesianInupiatIranianIraqiIrishIroquoisIsraeliItalianJamaicanJapaneseJordanianKenyanKiowaKoreanLaotianLatvianLebaneseLiberianLithuanianLumbeeLuxembourgerMacedonianMalaysianMalteseMarshalleseMenomineeMexicanMexican American IndianMongolianMoroccanNative HawaiianNavajoNepaleseNew ZealanderNicaraguanNigerianNorthern EuropeanNorwegianOkinawanOsageOttawaPaiutePakistaniPalestinianPanamanianParaguayanPennsylvania GermanPeruvianPimaPolishPortuguesePotawatomiPuebloPuerto RicanPuget Sound SalishRomanianRussianSalvadoranSamoanScandinavianScotch-IrishScottishSeminoleSenegaleseSerbianShoshoneSierra LeoneanSiouxSlavicSlovakSloveneSomaliSouth AfricanSouth AmericanSouth American IndianSoviet UnionSpaniardSpanishSpanish AmericanSpanish American IndianSri LankanSubsaharan AfricanSudaneseSwedishSwissSyrianTaiwaneseThaiTlingit-HaidaTohono O'OdhamTonganTrinidadian and TobagonianTsimshianTurkishU.S. Virgin IslanderUgandanUkrainianUruguayanUteVenezuelanVietnameseWelshWest IndianYakamaYaquiYugoslavianYumanYup'ikZimbabwean
Immigration
NonimmigrantsImmigrantsAfghanistanAfricaAlbaniaArgentinaArmeniaAsiaAustraliaAustriaBahamasBangladeshBarbadosBelarusBelgiumBelizeBoliviaBosnia and HerzegovinaBrazilBulgariaBurma/MyanmarCabo VerdeCambodiaCameroonCanadaCaribbeanCentral AmericaChileChinaColombiaCongoCosta RicaCroatiaCubaCzechoslovakiaDenmarkDominicaDominican RepublicEastern AfricaEastern AsiaEastern EuropeEcuadorEgyptEl SalvadorEnglandEritreaEthiopiaEuropeFijiFranceGermanyGhanaGreeceGrenadaGuatemalaGuyanaHaitiHondurasHong KongHungaryIndiaIndonesiaIranIraqIrelandIsraelItalyJamaicaJapanJordanKazakhstanKenyaKoreaKuwaitLaosLatin AmericaLatviaLebanonLiberiaLithuaniaMalaysiaMexicoMicronesiaMiddle AfricaMoldovaMoroccoNepalNetherlandsNicaraguaNigeriaNorth AmericaNorth MacedoniaNorthern AfricaNorthern EuropeNorwayOceaniaPakistanPanamaPeruPhilippinesPolandPortugalRomaniaRussiaSaudi ArabiaScotlandSenegalSerbiaSierra LeoneSingaporeSomaliaSouth AfricaSouth AmericaSouth Central AsiaSouth Eastern AsiaSouthern EuropeSpainSri LankaSt. Vincent and the GrenadinesSudanSwedenSwitzerlandSyriaTaiwanThailandTrinidad and TobagoTurkeyUgandaUkraineUruguayUzbekistanVenezuelaVietnamWest IndiesWestern AfricaWestern AsiaWestern EuropeYemenZaireZimbabweAzores
Child Poverty Among Girls Under 16
Income
Poverty
Unemployment
Labor Participation
Family Structure
Vehicle Availability
Education Level
Disability

Child Poverty Among Girls Under 16 Comparison

Brazilians

Cambodians

Excellent
Exceptional
15.4%
CHILD POVERTY AMONG GIRLS UNDER 16
89.6/ 100
METRIC RATING
133rd/ 347
METRIC RANK
14.4%
CHILD POVERTY AMONG GIRLS UNDER 16
98.7/ 100
METRIC RATING
61st/ 347
METRIC RANK

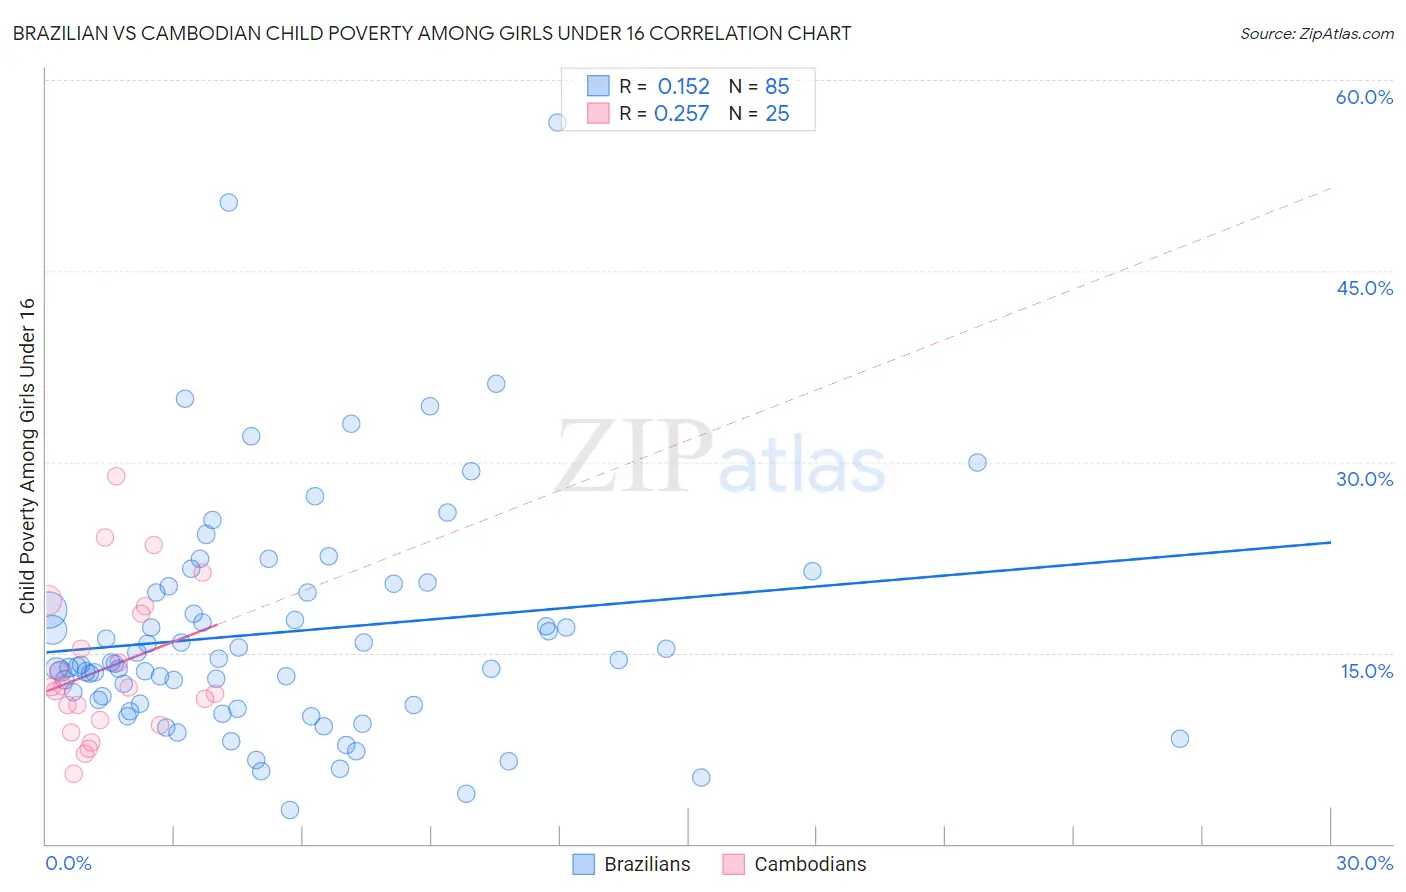
Brazilian vs Cambodian Child Poverty Among Girls Under 16 Correlation Chart

The statistical analysis conducted on geographies consisting of 318,856,218 people shows a poor positive correlation between the proportion of Brazilians and poverty level among girls under the age of 16 in the United States with a correlation coefficient (R) of 0.152 and weighted average of 15.4%. Similarly, the statistical analysis conducted on geographies consisting of 102,087,576 people shows a weak positive correlation between the proportion of Cambodians and poverty level among girls under the age of 16 in the United States with a correlation coefficient (R) of 0.257 and weighted average of 14.4%, a difference of 7.2%.
Brazilian vs Cambodian Child Poverty Among Girls Under 16

Child Poverty Among Girls Under 16 Correlation Summary

MeasurementBrazilianCambodian
Minimum2.7%5.5%
Maximum56.7%28.9%
Range54.0%23.4%
Mean16.6%13.9%
Median14.2%12.2%
Interquartile 25% (IQ1)11.0%9.5%
Interquartile 75% (IQ3)20.0%18.4%
Interquartile Range (IQR)9.0%8.8%
Standard Deviation (Sample)9.2%5.9%
Standard Deviation (Population)9.2%5.8%

Similar Demographics by Child Poverty Among Girls Under 16

Demographics Similar to Brazilians by Child Poverty Among Girls Under 16

In terms of child poverty among girls under 16, the demographic groups most similar to Brazilians are Mongolian (15.4%, a difference of 0.020%), Immigrants from Western Europe (15.4%, a difference of 0.13%), Puget Sound Salish (15.4%, a difference of 0.15%), Immigrants from Spain (15.5%, a difference of 0.16%), and Czechoslovakian (15.5%, a difference of 0.19%).
DemographicsRating | RankChild Poverty Among Girls Under 16
Scottish
91.0
/100
|
#126
Exceptional
15.4%
Immigrants | Norway
90.8
/100
|
#127
Exceptional
15.4%
Albanians
90.5
/100
|
#128
Exceptional
15.4%
Immigrants | South Eastern Asia
90.5
/100
|
#129
Exceptional
15.4%
Puget Sound Salish
90.1
/100
|
#130
Exceptional
15.4%
Immigrants | Western Europe
90.0
/100
|
#131
Exceptional
15.4%
Mongolians
89.7
/100
|
#132
Excellent
15.4%
Brazilians
89.6
/100
|
#133
Excellent
15.4%
Immigrants | Spain
89.1
/100
|
#134
Excellent
15.5%
Czechoslovakians
89.0
/100
|
#135
Excellent
15.5%
Native Hawaiians
89.0
/100
|
#136
Excellent
15.5%
South Africans
88.7
/100
|
#137
Excellent
15.5%
Immigrants | Vietnam
88.2
/100
|
#138
Excellent
15.5%
Armenians
87.9
/100
|
#139
Excellent
15.5%
New Zealanders
87.2
/100
|
#140
Excellent
15.6%

Demographics Similar to Cambodians by Child Poverty Among Girls Under 16

In terms of child poverty among girls under 16, the demographic groups most similar to Cambodians are Polish (14.4%, a difference of 0.0%), Scandinavian (14.4%, a difference of 0.11%), Immigrants from Europe (14.4%, a difference of 0.16%), Zimbabwean (14.4%, a difference of 0.20%), and Immigrants from Bulgaria (14.4%, a difference of 0.26%).
DemographicsRating | RankChild Poverty Among Girls Under 16
Estonians
98.9
/100
|
#54
Exceptional
14.3%
Immigrants | Romania
98.9
/100
|
#55
Exceptional
14.3%
Immigrants | Indonesia
98.9
/100
|
#56
Exceptional
14.4%
Immigrants | Serbia
98.9
/100
|
#57
Exceptional
14.4%
Immigrants | Bulgaria
98.8
/100
|
#58
Exceptional
14.4%
Zimbabweans
98.8
/100
|
#59
Exceptional
14.4%
Poles
98.7
/100
|
#60
Exceptional
14.4%
Cambodians
98.7
/100
|
#61
Exceptional
14.4%
Scandinavians
98.7
/100
|
#62
Exceptional
14.4%
Immigrants | Europe
98.7
/100
|
#63
Exceptional
14.4%
Immigrants | Philippines
98.6
/100
|
#64
Exceptional
14.4%
Immigrants | Sweden
98.6
/100
|
#65
Exceptional
14.5%
Immigrants | Belgium
98.5
/100
|
#66
Exceptional
14.5%
Laotians
98.4
/100
|
#67
Exceptional
14.5%
Immigrants | Argentina
98.3
/100
|
#68
Exceptional
14.6%