Basque vs Immigrants from North America Married-Couple Family Poverty

COMPARE

Basque
Race
Ancestry
AfghanAfricanAlaska NativeAlaskan AthabascanAlbanianAleutAlsatianAmericanApacheArabArapahoArgentineanArmenianAssyrian/Chaldean/SyriacAustralianAustrianBahamianBangladeshiBarbadianBasqueBelgianBelizeanBermudanBhutaneseBlackfeetBolivianBrazilianBritishBritish West IndianBulgarianBurmeseCajunCambodianCanadianCape VerdeanCarpatho RusynCelticCentral AmericanCentral American IndianCherokeeCheyenneChickasawChileanChineseChippewaChoctawColombianColvilleComancheCosta RicanCreeCreekCroatianCrowCubanCypriotCzechCzechoslovakianDanishDelawareDominicanDutchDutch West IndianEastern EuropeanEcuadorianEgyptianEnglishEstonianEthiopianEuropeanFijianFilipinoFinnishFrenchFrench American IndianFrench CanadianGermanGerman RussianGhanaianGreekGuamanian/ChamorroGuatemalanGuyaneseHaitianHmongHonduranHopiHoumaHungarianIcelanderIndian (Asian)IndonesianInupiatIranianIraqiIrishIroquoisIsraeliItalianJamaicanJapaneseJordanianKenyanKiowaKoreanLaotianLatvianLebaneseLiberianLithuanianLumbeeLuxembourgerMacedonianMalaysianMalteseMarshalleseMenomineeMexicanMexican American IndianMongolianMoroccanNative HawaiianNavajoNepaleseNew ZealanderNicaraguanNigerianNorthern EuropeanNorwegianOkinawanOsageOttawaPaiutePakistaniPalestinianPanamanianParaguayanPennsylvania GermanPeruvianPimaPolishPortuguesePotawatomiPuebloPuerto RicanPuget Sound SalishRomanianRussianSalvadoranSamoanScandinavianScotch-IrishScottishSeminoleSenegaleseSerbianShoshoneSierra LeoneanSiouxSlavicSlovakSloveneSomaliSouth AfricanSouth AmericanSouth American IndianSoviet UnionSpaniardSpanishSpanish AmericanSpanish American IndianSri LankanSubsaharan AfricanSudaneseSwedishSwissSyrianTaiwaneseThaiTlingit-HaidaTohono O'OdhamTonganTrinidadian and TobagonianTsimshianTurkishU.S. Virgin IslanderUgandanUkrainianUruguayanUteVenezuelanVietnameseWelshWest IndianYakamaYaquiYugoslavianYumanYup'ikZimbabwean
Immigration
NonimmigrantsImmigrantsAfghanistanAfricaAlbaniaArgentinaArmeniaAsiaAustraliaAustriaBahamasBangladeshBarbadosBelarusBelgiumBelizeBoliviaBosnia and HerzegovinaBrazilBulgariaBurma/MyanmarCabo VerdeCambodiaCameroonCanadaCaribbeanCentral AmericaChileChinaColombiaCongoCosta RicaCroatiaCubaCzechoslovakiaDenmarkDominicaDominican RepublicEastern AfricaEastern AsiaEastern EuropeEcuadorEgyptEl SalvadorEnglandEritreaEthiopiaEuropeFijiFranceGermanyGhanaGreeceGrenadaGuatemalaGuyanaHaitiHondurasHong KongHungaryIndiaIndonesiaIranIraqIrelandIsraelItalyJamaicaJapanJordanKazakhstanKenyaKoreaKuwaitLaosLatin AmericaLatviaLebanonLiberiaLithuaniaMalaysiaMexicoMicronesiaMiddle AfricaMoldovaMoroccoNepalNetherlandsNicaraguaNigeriaNorth MacedoniaNorthern AfricaNorthern EuropeNorwayOceaniaPakistanPanamaPeruPhilippinesPolandPortugalRomaniaRussiaSaudi ArabiaScotlandSenegalSerbiaSierra LeoneSingaporeSomaliaSouth AfricaSouth AmericaSouth Central AsiaSouth Eastern AsiaSouthern EuropeSpainSri LankaSt. Vincent and the GrenadinesSudanSwedenSwitzerlandSyriaTaiwanThailandTrinidad and TobagoTurkeyUgandaUkraineUruguayUzbekistanVenezuelaVietnamWest IndiesWestern AfricaWestern AsiaWestern EuropeYemenZaireZimbabweAzores
Immigrants from North America
Race
Ancestry
AfghanAfricanAlaska NativeAlaskan AthabascanAlbanianAleutAlsatianAmericanApacheArabArapahoArgentineanArmenianAssyrian/Chaldean/SyriacAustralianAustrianBahamianBangladeshiBarbadianBelgianBelizeanBermudanBhutaneseBlackfeetBolivianBrazilianBritishBritish West IndianBulgarianBurmeseCajunCambodianCanadianCape VerdeanCarpatho RusynCelticCentral AmericanCentral American IndianCherokeeCheyenneChickasawChileanChineseChippewaChoctawColombianColvilleComancheCosta RicanCreeCreekCroatianCrowCubanCypriotCzechCzechoslovakianDanishDelawareDominicanDutchDutch West IndianEastern EuropeanEcuadorianEgyptianEnglishEstonianEthiopianEuropeanFijianFilipinoFinnishFrenchFrench American IndianFrench CanadianGermanGerman RussianGhanaianGreekGuamanian/ChamorroGuatemalanGuyaneseHaitianHmongHonduranHopiHoumaHungarianIcelanderIndian (Asian)IndonesianInupiatIranianIraqiIrishIroquoisIsraeliItalianJamaicanJapaneseJordanianKenyanKiowaKoreanLaotianLatvianLebaneseLiberianLithuanianLumbeeLuxembourgerMacedonianMalaysianMalteseMarshalleseMenomineeMexicanMexican American IndianMongolianMoroccanNative HawaiianNavajoNepaleseNew ZealanderNicaraguanNigerianNorthern EuropeanNorwegianOkinawanOsageOttawaPaiutePakistaniPalestinianPanamanianParaguayanPennsylvania GermanPeruvianPimaPolishPortuguesePotawatomiPuebloPuerto RicanPuget Sound SalishRomanianRussianSalvadoranSamoanScandinavianScotch-IrishScottishSeminoleSenegaleseSerbianShoshoneSierra LeoneanSiouxSlavicSlovakSloveneSomaliSouth AfricanSouth AmericanSouth American IndianSoviet UnionSpaniardSpanishSpanish AmericanSpanish American IndianSri LankanSubsaharan AfricanSudaneseSwedishSwissSyrianTaiwaneseThaiTlingit-HaidaTohono O'OdhamTonganTrinidadian and TobagonianTsimshianTurkishU.S. Virgin IslanderUgandanUkrainianUruguayanUteVenezuelanVietnameseWelshWest IndianYakamaYaquiYugoslavianYumanYup'ikZimbabwean
Immigration
NonimmigrantsImmigrantsAfghanistanAfricaAlbaniaArgentinaArmeniaAsiaAustraliaAustriaBahamasBangladeshBarbadosBelarusBelgiumBelizeBoliviaBosnia and HerzegovinaBrazilBulgariaBurma/MyanmarCabo VerdeCambodiaCameroonCanadaCaribbeanCentral AmericaChileChinaColombiaCongoCosta RicaCroatiaCubaCzechoslovakiaDenmarkDominicaDominican RepublicEastern AfricaEastern AsiaEastern EuropeEcuadorEgyptEl SalvadorEnglandEritreaEthiopiaEuropeFijiFranceGermanyGhanaGreeceGrenadaGuatemalaGuyanaHaitiHondurasHong KongHungaryIndiaIndonesiaIranIraqIrelandIsraelItalyJamaicaJapanJordanKazakhstanKenyaKoreaKuwaitLaosLatin AmericaLatviaLebanonLiberiaLithuaniaMalaysiaMexicoMicronesiaMiddle AfricaMoldovaMoroccoNepalNetherlandsNicaraguaNigeriaNorth AmericaNorth MacedoniaNorthern AfricaNorthern EuropeNorwayOceaniaPakistanPanamaPeruPhilippinesPolandPortugalRomaniaRussiaSaudi ArabiaScotlandSenegalSerbiaSierra LeoneSingaporeSomaliaSouth AfricaSouth AmericaSouth Central AsiaSouth Eastern AsiaSouthern EuropeSpainSri LankaSt. Vincent and the GrenadinesSudanSwedenSwitzerlandSyriaTaiwanThailandTrinidad and TobagoTurkeyUgandaUkraineUruguayUzbekistanVenezuelaVietnamWest IndiesWestern AfricaWestern AsiaWestern EuropeYemenZaireZimbabweAzores
Married-Couple Family Poverty
Income
Poverty
Unemployment
Labor Participation
Family Structure
Vehicle Availability
Education Level
Disability

Married-Couple Family Poverty Comparison

Basques

Immigrants from North America

Exceptional
Exceptional
4.6%
MARRIED-COUPLE FAMILY POVERTY
98.5/ 100
METRIC RATING
91st/ 347
METRIC RANK
4.5%
MARRIED-COUPLE FAMILY POVERTY
99.3/ 100
METRIC RATING
71st/ 347
METRIC RANK

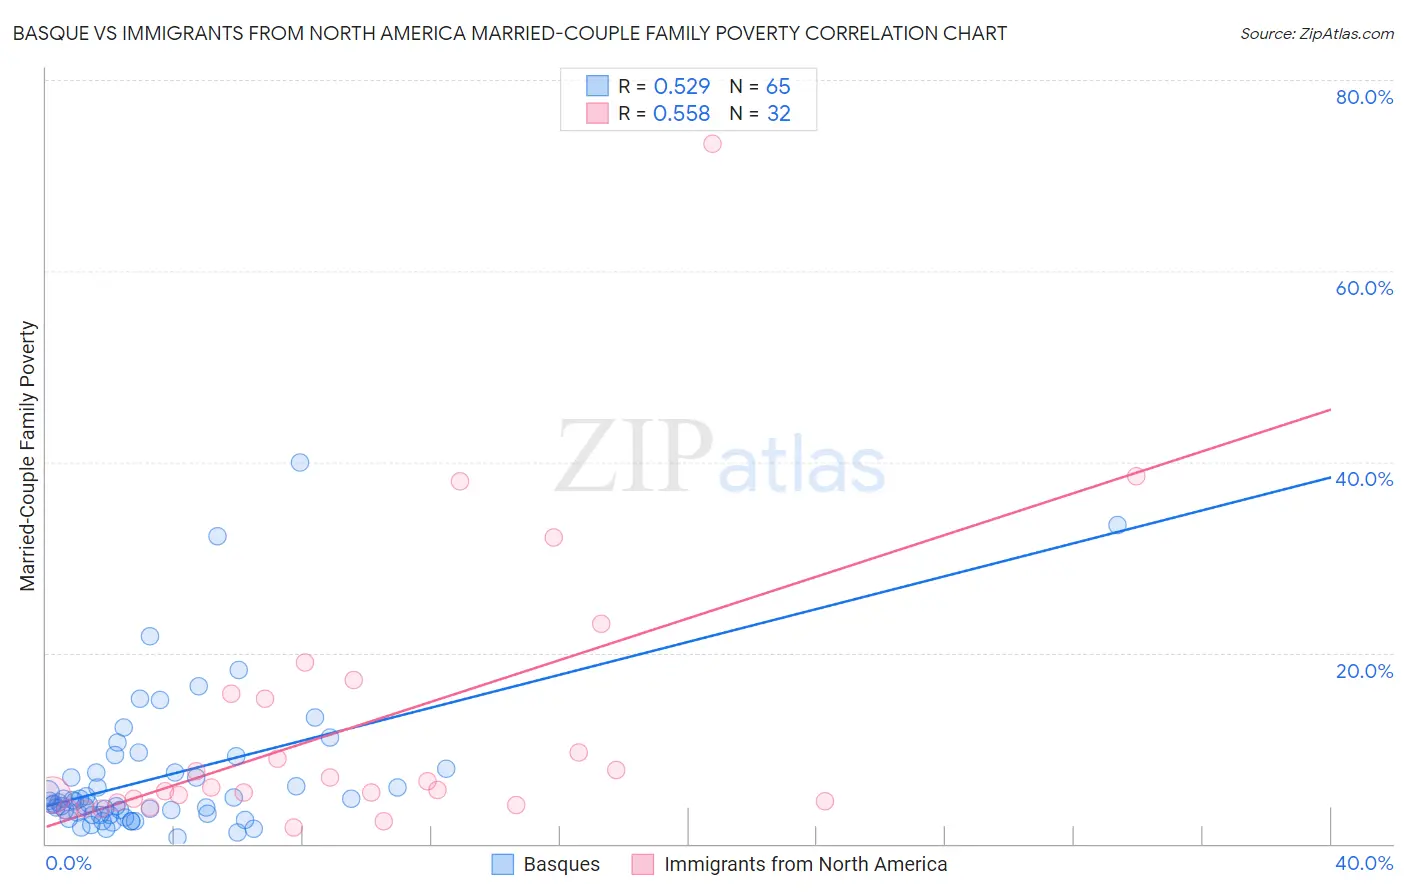
Basque vs Immigrants from North America Married-Couple Family Poverty Correlation Chart

The statistical analysis conducted on geographies consisting of 165,263,383 people shows a substantial positive correlation between the proportion of Basques and poverty level among married-couple families in the United States with a correlation coefficient (R) of 0.529 and weighted average of 4.6%. Similarly, the statistical analysis conducted on geographies consisting of 456,163,835 people shows a substantial positive correlation between the proportion of Immigrants from North America and poverty level among married-couple families in the United States with a correlation coefficient (R) of 0.558 and weighted average of 4.5%, a difference of 2.6%.
Basque vs Immigrants from North America Married-Couple Family Poverty

Married-Couple Family Poverty Correlation Summary

MeasurementBasqueImmigrants from North America
Minimum0.72%1.7%
Maximum40.0%73.3%
Range39.3%71.6%
Mean7.1%12.3%
Median4.4%5.7%
Interquartile 25% (IQ1)3.0%4.4%
Interquartile 75% (IQ3)7.6%15.5%
Interquartile Range (IQR)4.6%11.0%
Standard Deviation (Sample)7.6%14.9%
Standard Deviation (Population)7.6%14.7%

Demographics Similar to Basques and Immigrants from North America by Married-Couple Family Poverty

In terms of married-couple family poverty, the demographic groups most similar to Basques are Immigrants from Switzerland (4.6%, a difference of 0.040%), Immigrants from Czechoslovakia (4.6%, a difference of 0.11%), Bolivian (4.6%, a difference of 0.22%), Immigrants from North Macedonia (4.6%, a difference of 0.32%), and Immigrants from Turkey (4.6%, a difference of 0.40%). Similarly, the demographic groups most similar to Immigrants from North America are Immigrants from England (4.5%, a difference of 0.090%), Ukrainian (4.5%, a difference of 0.22%), Immigrants from Austria (4.5%, a difference of 0.32%), Cambodian (4.5%, a difference of 0.59%), and Immigrants from South Africa (4.5%, a difference of 0.70%).
DemographicsRating | RankMarried-Couple Family Poverty
Immigrants | North America
99.3
/100
|
#71
Exceptional
4.5%
Immigrants | England
99.3
/100
|
#72
Exceptional
4.5%
Ukrainians
99.2
/100
|
#73
Exceptional
4.5%
Immigrants | Austria
99.2
/100
|
#74
Exceptional
4.5%
Cambodians
99.2
/100
|
#75
Exceptional
4.5%
Immigrants | South Africa
99.1
/100
|
#76
Exceptional
4.5%
Immigrants | Latvia
99.1
/100
|
#77
Exceptional
4.5%
Scotch-Irish
99.1
/100
|
#78
Exceptional
4.5%
Immigrants | Iran
99.0
/100
|
#79
Exceptional
4.5%
Icelanders
99.0
/100
|
#80
Exceptional
4.5%
Immigrants | Greece
98.9
/100
|
#81
Exceptional
4.5%
Canadians
98.8
/100
|
#82
Exceptional
4.5%
Immigrants | Denmark
98.8
/100
|
#83
Exceptional
4.6%
Immigrants | Croatia
98.7
/100
|
#84
Exceptional
4.6%
South Africans
98.7
/100
|
#85
Exceptional
4.6%
Immigrants | Turkey
98.6
/100
|
#86
Exceptional
4.6%
Immigrants | North Macedonia
98.6
/100
|
#87
Exceptional
4.6%
Bolivians
98.6
/100
|
#88
Exceptional
4.6%
Immigrants | Czechoslovakia
98.5
/100
|
#89
Exceptional
4.6%
Immigrants | Switzerland
98.5
/100
|
#90
Exceptional
4.6%
Basques
98.5
/100
|
#91
Exceptional
4.6%