Arapaho vs Immigrants from Germany Receiving Food Stamps
COMPARE
Arapaho
Immigrants from Germany
Receiving Food Stamps
Receiving Food Stamps Comparison
Arapaho
Immigrants from Germany
14.1%
RECEIVING FOOD STAMPS
0.3/ 100
METRIC RATING
257th/ 347
METRIC RANK
10.7%
RECEIVING FOOD STAMPS
92.0/ 100
METRIC RATING
132nd/ 347
METRIC RANK
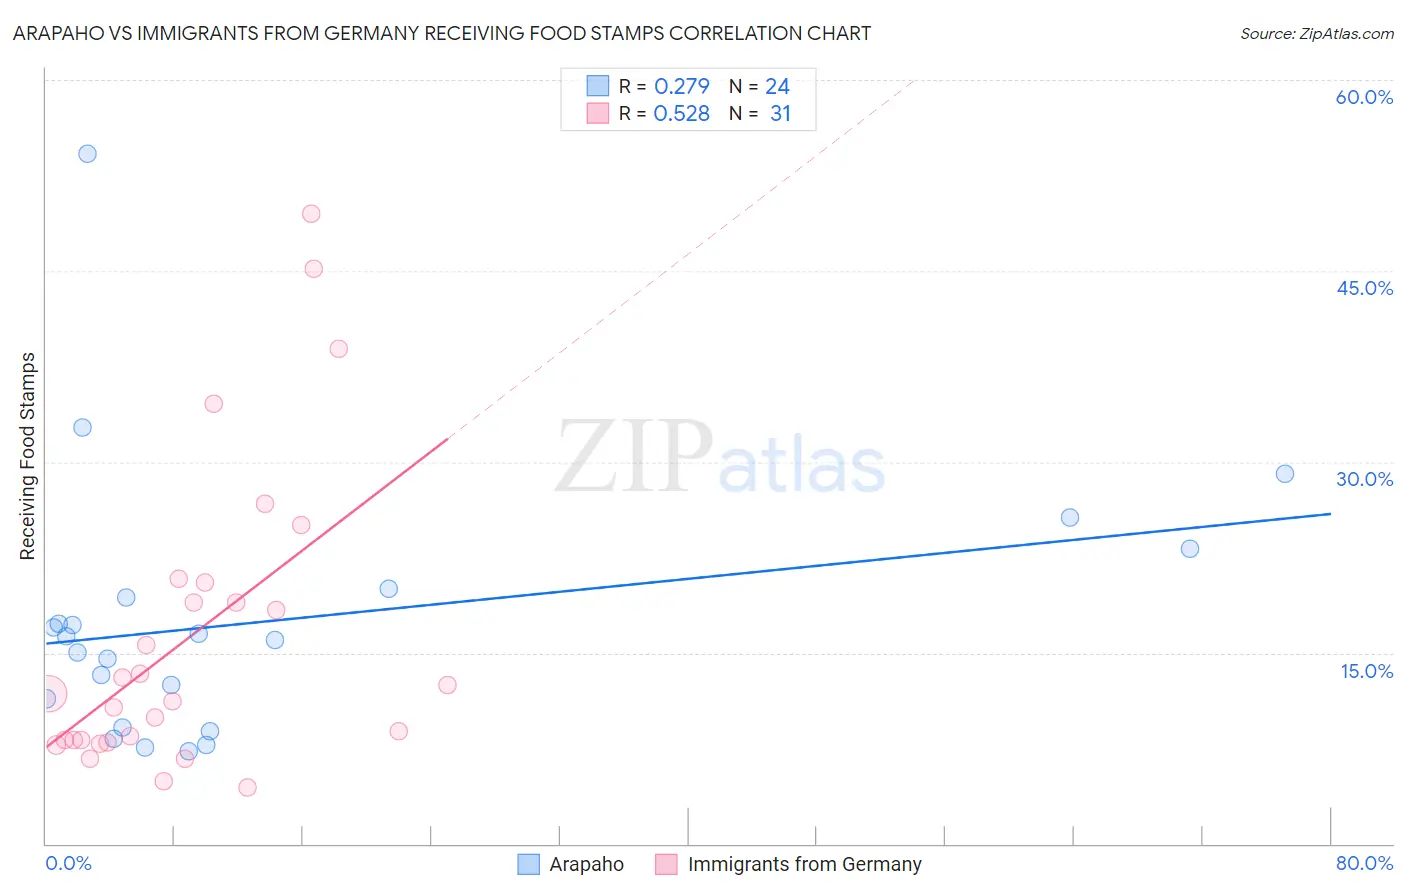
Arapaho vs Immigrants from Germany Receiving Food Stamps Correlation Chart
The statistical analysis conducted on geographies consisting of 29,772,376 people shows a weak positive correlation between the proportion of Arapaho and percentage of population receiving government assistance and/or food stamps in the United States with a correlation coefficient (R) of 0.279 and weighted average of 14.1%. Similarly, the statistical analysis conducted on geographies consisting of 462,380,802 people shows a substantial positive correlation between the proportion of Immigrants from Germany and percentage of population receiving government assistance and/or food stamps in the United States with a correlation coefficient (R) of 0.528 and weighted average of 10.7%, a difference of 31.4%.
Receiving Food Stamps Correlation Summary
| Measurement | Arapaho | Immigrants from Germany |
| Minimum | 7.3% | 4.4% |
| Maximum | 54.2% | 49.5% |
| Range | 46.9% | 45.1% |
| Mean | 17.5% | 16.2% |
| Median | 16.1% | 11.8% |
| Interquartile 25% (IQ1) | 10.2% | 8.1% |
| Interquartile 75% (IQ3) | 19.7% | 20.5% |
| Interquartile Range (IQR) | 9.4% | 12.4% |
| Standard Deviation (Sample) | 10.3% | 11.8% |
| Standard Deviation (Population) | 10.1% | 11.6% |
Similar Demographics by Receiving Food Stamps
Demographics Similar to Arapaho by Receiving Food Stamps
In terms of receiving food stamps, the demographic groups most similar to Arapaho are Immigrants from Ghana (14.1%, a difference of 0.080%), Japanese (14.1%, a difference of 0.10%), Subsaharan African (14.1%, a difference of 0.12%), Marshallese (14.1%, a difference of 0.14%), and Creek (14.1%, a difference of 0.20%).
| Demographics | Rating | Rank | Receiving Food Stamps |
| Immigrants | Cambodia | 0.5 /100 | #250 | Tragic 13.9% |
| Yaqui | 0.5 /100 | #251 | Tragic 13.9% |
| Ghanaians | 0.5 /100 | #252 | Tragic 14.0% |
| Spanish Americans | 0.4 /100 | #253 | Tragic 14.0% |
| Marshallese | 0.3 /100 | #254 | Tragic 14.1% |
| Sub-Saharan Africans | 0.3 /100 | #255 | Tragic 14.1% |
| Japanese | 0.3 /100 | #256 | Tragic 14.1% |
| Arapaho | 0.3 /100 | #257 | Tragic 14.1% |
| Immigrants | Ghana | 0.3 /100 | #258 | Tragic 14.1% |
| Creek | 0.3 /100 | #259 | Tragic 14.1% |
| Central Americans | 0.3 /100 | #260 | Tragic 14.1% |
| Immigrants | Congo | 0.3 /100 | #261 | Tragic 14.1% |
| Paiute | 0.2 /100 | #262 | Tragic 14.3% |
| Immigrants | Portugal | 0.2 /100 | #263 | Tragic 14.3% |
| Immigrants | Uzbekistan | 0.2 /100 | #264 | Tragic 14.3% |
Demographics Similar to Immigrants from Germany by Receiving Food Stamps
In terms of receiving food stamps, the demographic groups most similar to Immigrants from Germany are Israeli (10.7%, a difference of 0.20%), French (10.7%, a difference of 0.20%), Immigrants from Jordan (10.7%, a difference of 0.30%), Yugoslavian (10.7%, a difference of 0.30%), and Immigrants from Ethiopia (10.7%, a difference of 0.31%).
| Demographics | Rating | Rank | Receiving Food Stamps |
| Ukrainians | 92.8 /100 | #125 | Exceptional 10.7% |
| Afghans | 92.6 /100 | #126 | Exceptional 10.7% |
| Immigrants | Ethiopia | 92.6 /100 | #127 | Exceptional 10.7% |
| Immigrants | Jordan | 92.5 /100 | #128 | Exceptional 10.7% |
| Yugoslavians | 92.5 /100 | #129 | Exceptional 10.7% |
| Israelis | 92.4 /100 | #130 | Exceptional 10.7% |
| French | 92.3 /100 | #131 | Exceptional 10.7% |
| Immigrants | Germany | 92.0 /100 | #132 | Exceptional 10.7% |
| Immigrants | Russia | 90.9 /100 | #133 | Exceptional 10.8% |
| Immigrants | Brazil | 90.3 /100 | #134 | Exceptional 10.8% |
| Argentineans | 90.2 /100 | #135 | Exceptional 10.8% |
| Slovaks | 89.8 /100 | #136 | Excellent 10.8% |
| Immigrants | Eastern Europe | 89.8 /100 | #137 | Excellent 10.8% |
| Immigrants | Moldova | 88.5 /100 | #138 | Excellent 10.9% |
| Hmong | 88.4 /100 | #139 | Excellent 10.9% |