Aleut vs British West Indian Receiving Food Stamps
COMPARE
Aleut
British West Indian
Receiving Food Stamps
Receiving Food Stamps Comparison
Aleuts
British West Indians
12.4%
RECEIVING FOOD STAMPS
17.3/ 100
METRIC RATING
205th/ 347
METRIC RANK
17.9%
RECEIVING FOOD STAMPS
0.0/ 100
METRIC RATING
324th/ 347
METRIC RANK
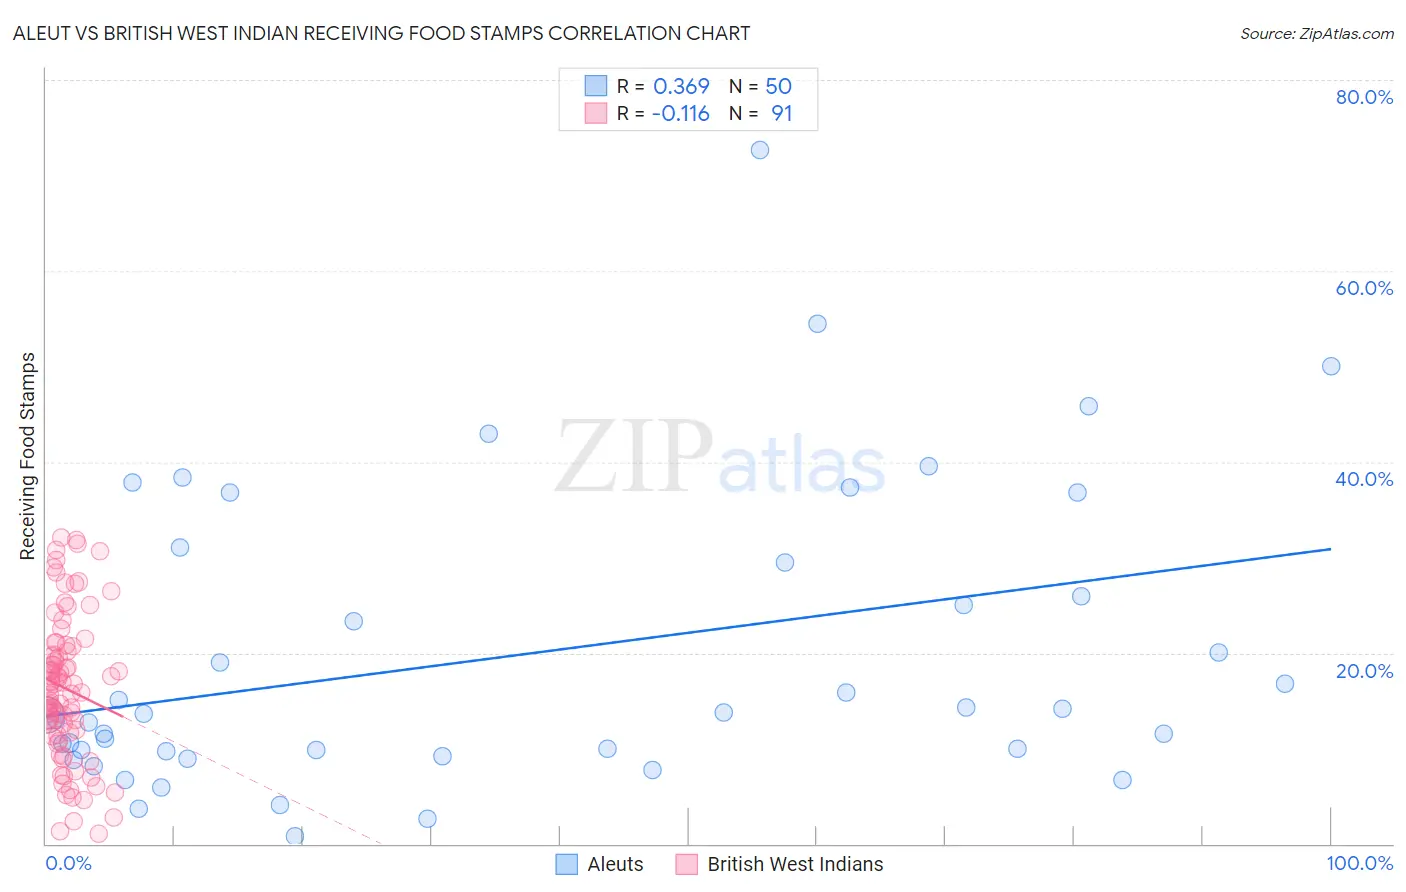
Aleut vs British West Indian Receiving Food Stamps Correlation Chart
The statistical analysis conducted on geographies consisting of 61,758,558 people shows a mild positive correlation between the proportion of Aleuts and percentage of population receiving government assistance and/or food stamps in the United States with a correlation coefficient (R) of 0.369 and weighted average of 12.4%. Similarly, the statistical analysis conducted on geographies consisting of 152,421,558 people shows a poor negative correlation between the proportion of British West Indians and percentage of population receiving government assistance and/or food stamps in the United States with a correlation coefficient (R) of -0.116 and weighted average of 17.9%, a difference of 44.5%.
Receiving Food Stamps Correlation Summary
| Measurement | Aleut | British West Indian |
| Minimum | 0.80% | 1.0% |
| Maximum | 72.7% | 32.1% |
| Range | 71.9% | 31.1% |
| Mean | 19.7% | 16.2% |
| Median | 13.5% | 16.5% |
| Interquartile 25% (IQ1) | 9.7% | 11.3% |
| Interquartile 75% (IQ3) | 29.4% | 20.7% |
| Interquartile Range (IQR) | 19.7% | 9.4% |
| Standard Deviation (Sample) | 15.6% | 7.6% |
| Standard Deviation (Population) | 15.4% | 7.5% |
Similar Demographics by Receiving Food Stamps
Demographics Similar to Aleuts by Receiving Food Stamps
In terms of receiving food stamps, the demographic groups most similar to Aleuts are Immigrants from Thailand (12.4%, a difference of 0.060%), Nonimmigrants (12.4%, a difference of 0.070%), Shoshone (12.4%, a difference of 0.090%), South American (12.4%, a difference of 0.33%), and Immigrants from Venezuela (12.3%, a difference of 0.62%).
| Demographics | Rating | Rank | Receiving Food Stamps |
| Immigrants | Costa Rica | 25.4 /100 | #198 | Fair 12.2% |
| Portuguese | 25.1 /100 | #199 | Fair 12.2% |
| Sierra Leoneans | 23.6 /100 | #200 | Fair 12.2% |
| Ugandans | 22.5 /100 | #201 | Fair 12.2% |
| Immigrants | Venezuela | 20.1 /100 | #202 | Fair 12.3% |
| Shoshone | 17.7 /100 | #203 | Poor 12.4% |
| Immigrants | Nonimmigrants | 17.6 /100 | #204 | Poor 12.4% |
| Aleuts | 17.3 /100 | #205 | Poor 12.4% |
| Immigrants | Thailand | 17.0 /100 | #206 | Poor 12.4% |
| South Americans | 16.0 /100 | #207 | Poor 12.4% |
| Potawatomi | 14.6 /100 | #208 | Poor 12.5% |
| Immigrants | Sierra Leone | 12.9 /100 | #209 | Poor 12.5% |
| Immigrants | Uruguay | 12.8 /100 | #210 | Poor 12.5% |
| Colombians | 10.2 /100 | #211 | Poor 12.6% |
| Malaysians | 8.5 /100 | #212 | Tragic 12.7% |
Demographics Similar to British West Indians by Receiving Food Stamps
In terms of receiving food stamps, the demographic groups most similar to British West Indians are Immigrants from Grenada (17.8%, a difference of 0.59%), Haitian (17.8%, a difference of 0.59%), Immigrants from Haiti (18.2%, a difference of 1.8%), Cuban (18.2%, a difference of 1.9%), and Apache (18.3%, a difference of 2.2%).
| Demographics | Rating | Rank | Receiving Food Stamps |
| Blacks/African Americans | 0.0 /100 | #317 | Tragic 17.2% |
| Menominee | 0.0 /100 | #318 | Tragic 17.2% |
| Immigrants | St. Vincent and the Grenadines | 0.0 /100 | #319 | Tragic 17.2% |
| Immigrants | Nicaragua | 0.0 /100 | #320 | Tragic 17.2% |
| Natives/Alaskans | 0.0 /100 | #321 | Tragic 17.3% |
| Immigrants | Grenada | 0.0 /100 | #322 | Tragic 17.8% |
| Haitians | 0.0 /100 | #323 | Tragic 17.8% |
| British West Indians | 0.0 /100 | #324 | Tragic 17.9% |
| Immigrants | Haiti | 0.0 /100 | #325 | Tragic 18.2% |
| Cubans | 0.0 /100 | #326 | Tragic 18.2% |
| Apache | 0.0 /100 | #327 | Tragic 18.3% |
| Colville | 0.0 /100 | #328 | Tragic 18.3% |
| Immigrants | Dominica | 0.0 /100 | #329 | Tragic 18.4% |
| Pima | 0.0 /100 | #330 | Tragic 19.0% |
| Immigrants | Caribbean | 0.0 /100 | #331 | Tragic 19.6% |