Zip Codes with the Highest Percentage of Population Employed in Life, Physical & Social Science in Reading, PA

RELATED REPORTS & OPTIONS

Life, Physical & Social Science
Population
Families and Households
Female Fertility
Female Fertility (Unmarried)
Race (Community Size)
Race (Percentage)
Ancestry (Community Size)
AfghanAfricanAmericanArabArgentineanArmenianAustralianAustrianBarbadianBelgianBhutaneseBlackfeetBrazilianBritishBritish West IndianBurmeseCanadianCentral AmericanCentral American IndianCherokeeChileanColombianCroatianCubanCzechCzechoslovakianDanishDominicanDutchEastern EuropeanEcuadorianEnglishEthiopianEuropeanFilipinoFinnishFrenchFrench CanadianGermanGhanaianGreekGuatemalanGuyaneseHaitianHonduranHungarianIndian (Asian)IranianIrishIroquoisItalianJamaicanKoreanLatvianLebaneseLithuanianMalaysianMexicanMexican American IndianMoroccanNative HawaiianNicaraguanNigerianNorthern EuropeanNorwegianPakistaniPalestinianPanamanianPennsylvania GermanPeruvianPolishPortuguesePuerto RicanRomanianRussianSalvadoranScandinavianScotch-IrishScottishSlavicSlovakSloveneSouth AmericanSpaniardSpanishSri LankanSubsaharan AfricanSwedishSwissSyrianThaiTrinidadian and TobagonianTurkishU.S. Virgin IslanderUkrainianVenezuelanWelshWest IndianYugoslavian
Ancestry (Percentage)
AfghanAfricanAmericanArabArgentineanArmenianAustralianAustrianBarbadianBelgianBhutaneseBlackfeetBrazilianBritishBritish West IndianBurmeseCanadianCentral AmericanCentral American IndianCherokeeChileanColombianCroatianCubanCzechCzechoslovakianDanishDominicanDutchEastern EuropeanEcuadorianEnglishEthiopianEuropeanFilipinoFinnishFrenchFrench CanadianGermanGhanaianGreekGuatemalanGuyaneseHaitianHonduranHungarianIndian (Asian)IranianIrishIroquoisItalianJamaicanKoreanLatvianLebaneseLithuanianMalaysianMexicanMexican American IndianMoroccanNative HawaiianNicaraguanNigerianNorthern EuropeanNorwegianPakistaniPalestinianPanamanianPennsylvania GermanPeruvianPolishPortuguesePuerto RicanRomanianRussianSalvadoranScandinavianScotch-IrishScottishSlavicSlovakSloveneSouth AmericanSpaniardSpanishSri LankanSubsaharan AfricanSwedishSwissSyrianThaiTrinidadian and TobagonianTurkishU.S. Virgin IslanderUkrainianVenezuelanWelshWest IndianYugoslavian
Immigrant Origin (Total)
Immigrant Origin (Percentage)
Income
Income (Families)
Income (Households)
Poverty
Poverty (Families)
Unemployment
Employment Occupations
Employment Industries
Employer Class
Commute Time
Commute Means
School Enrollment
Education by Degree Field
Occupancy
Finances
Physical Characteristics
Reading
Compare Zip Codes
Comparison Subject

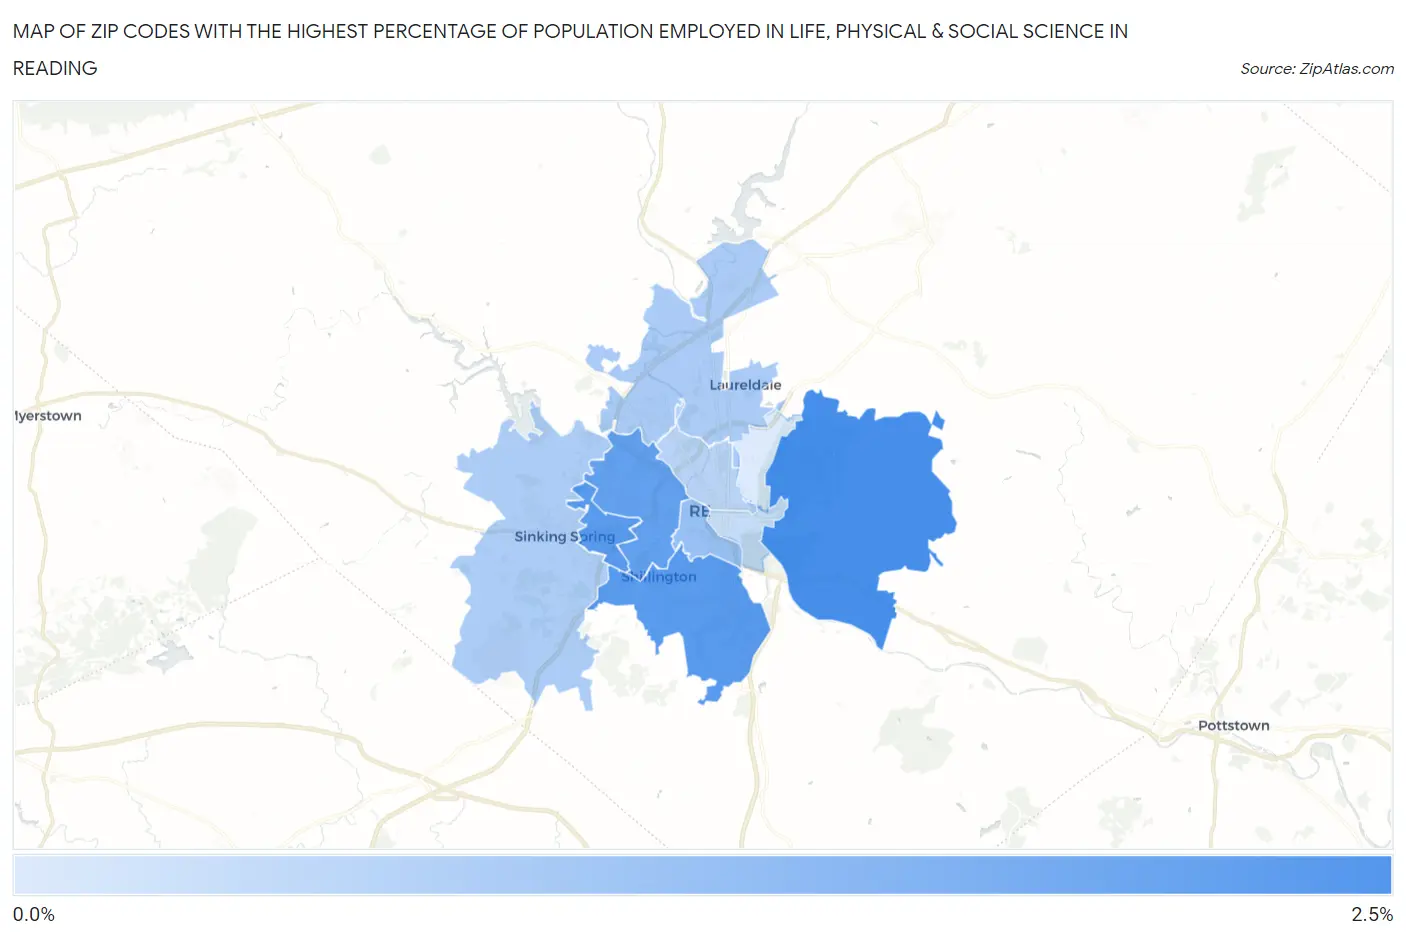
Map of Zip Codes with the Highest Percentage of Population Employed in Life, Physical & Social Science in Reading

0.0%
2.5%
Zip Codes with the Highest Percentage of Population Employed in Life, Physical & Social Science in Reading Map

Zip Codes with the Highest Percentage of Population Employed in Life, Physical & Social Science in Reading, PA

Zip Code % Employed vs State vs National
1.196062.3%1.2%(+1.04)#1471.1%(+1.17)#3,044
2.196092.0%1.2%(+0.791)#1871.1%(+0.922)#3,647
3.196072.0%1.2%(+0.777)#1921.1%(+0.908)#3,691
4.196101.9%1.2%(+0.631)#2091.1%(+0.763)#4,125
5.196111.0%1.2%(-0.186)#4601.1%(-0.054)#8,734
6.196050.77%1.2%(-0.452)#5961.1%(-0.320)#11,300
7.196080.75%1.2%(-0.471)#6011.1%(-0.340)#11,497
8.196010.59%1.2%(-0.636)#7021.1%(-0.505)#13,467
9.196020.36%1.2%(-0.864)#8631.1%(-0.733)#16,311
10.196040.029%1.2%(-1.19)#1,0221.1%(-1.06)#19,399

Common Questions

What are the Top 5 Zip Codes with the Highest Percentage of Population Employed in Life, Physical & Social Science in Reading, PA?
Top 5 Zip Codes with the Highest Percentage of Population Employed in Life, Physical & Social Science in Reading, PA are:
#1
2.3%
#2
2.0%
#3
2.0%
#4
1.9%
#5
1.0%
What zip code has the Highest Percentage of Population Employed in Life, Physical & Social Science in Reading, PA?
19606 has the Highest Percentage of Population Employed in Life, Physical & Social Science in Reading, PA with 2.3%.
What is the Percentage of Population Employed in Life, Physical & Social Science in Reading, PA?
Percentage of Population Employed in Life, Physical & Social Science in Reading is 0.40%.
What is the Percentage of Population Employed in Life, Physical & Social Science in Pennsylvania?
Percentage of Population Employed in Life, Physical & Social Science in Pennsylvania is 1.2%.
What is the Percentage of Population Employed in Life, Physical & Social Science in the United States?
Percentage of Population Employed in Life, Physical & Social Science in the United States is 1.1%.