Zip Codes with the Highest Percentage of Households with Income Above $100,000 in Chambersburg, PA
RELATED REPORTS & OPTIONS
Household Income | $100k+
Chambersburg
Compare Zip Codes
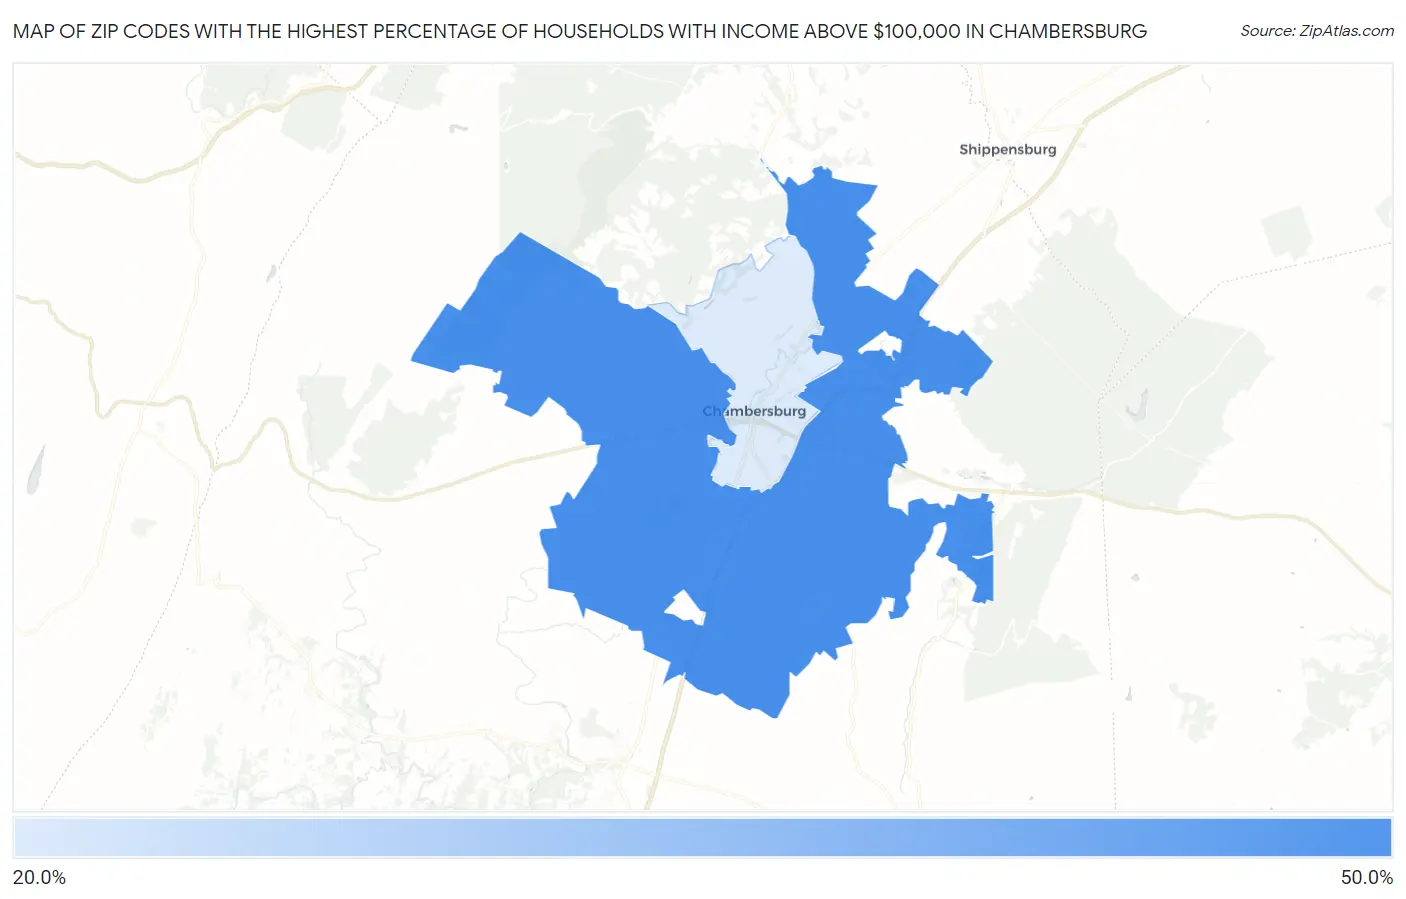
Map of Zip Codes with the Highest Percentage of Households with Income Above $100,000 in Chambersburg
0.0%
50.0%
Zip Codes with the Highest Percentage of Households with Income Above $100,000 in Chambersburg, PA
| Zip Code | Households with Income > $100k | vs State | vs National | |
| 1. | 17202 | 45.7% | 35.9%(+9.80)#306 | 37.3%(+8.40)#6,325 |
| 2. | 17201 | 21.2% | 35.9%(-14.7)#1,326 | 37.3%(-16.1)#23,070 |
1
Common Questions
What are the Top Zip Codes with the Highest Percentage of Households with Income Above $100,000 in Chambersburg, PA?
Top Zip Codes with the Highest Percentage of Households with Income Above $100,000 in Chambersburg, PA are:
What zip code has the Highest Percentage of Households with Income Above $100,000 in Chambersburg, PA?
17202 has the Highest Percentage of Households with Income Above $100,000 in Chambersburg, PA with 45.7%.
What is the Percentage of Households with Income Above $100,000 in Pennsylvania?
Percentage of Households with Income Above $100,000 in Pennsylvania is 35.9%.
What is the Percentage of Households with Income Above $100,000 in the United States?
Percentage of Households with Income Above $100,000 in the United States is 37.3%.