Zip Codes with the Highest Percentage of Population Employed in Architecture & Engineering in Utica, NY
RELATED REPORTS & OPTIONS
Architecture & Engineering
Utica
Compare Zip Codes
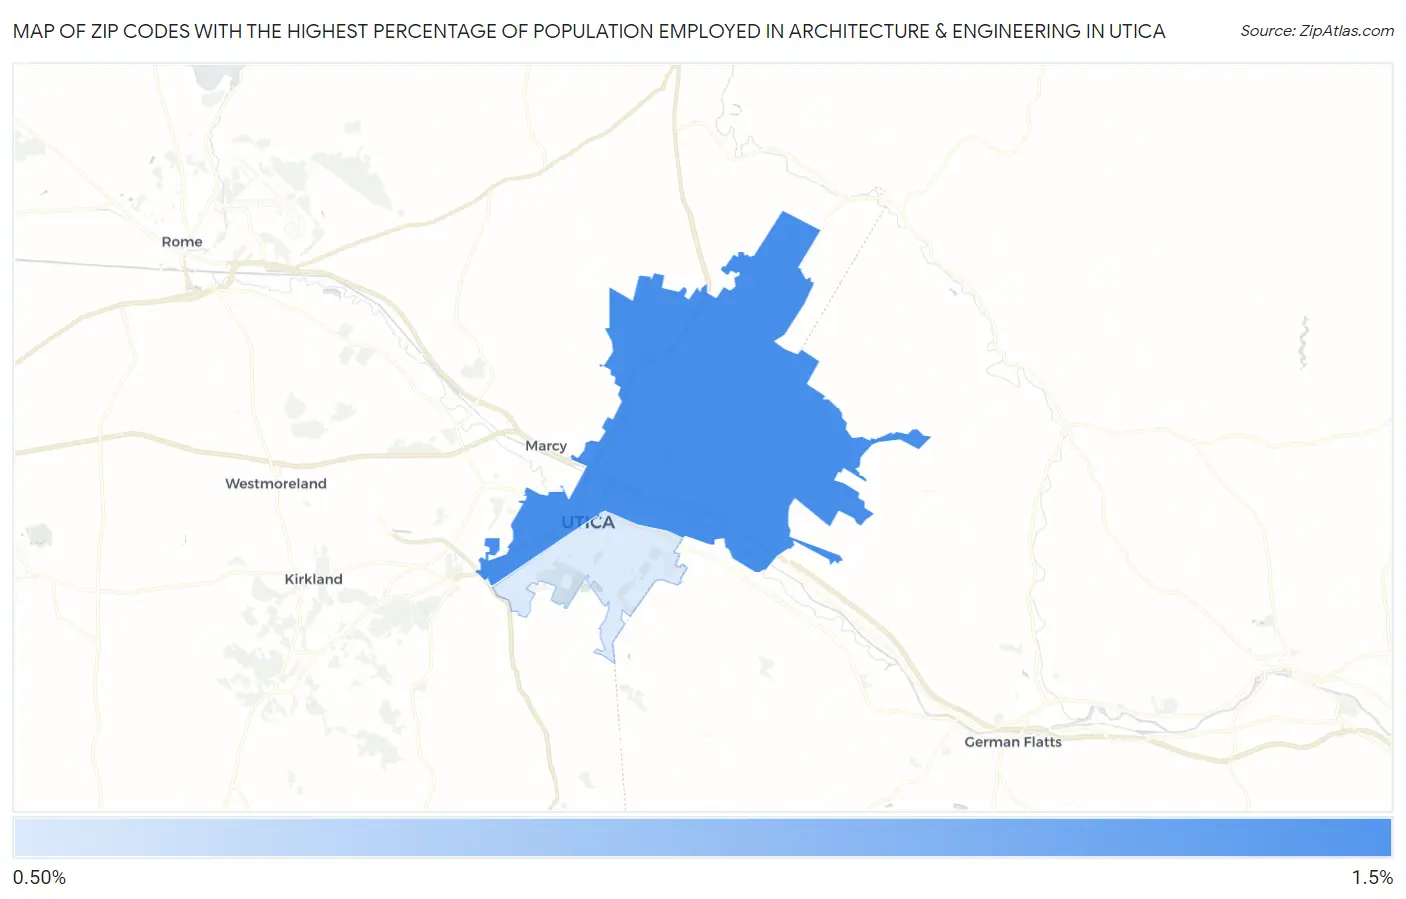
Map of Zip Codes with the Highest Percentage of Population Employed in Architecture & Engineering in Utica
0.0%
1.5%
Zip Codes with the Highest Percentage of Population Employed in Architecture & Engineering in Utica, NY
| Zip Code | % Employed | vs State | vs National | |
| 1. | 13502 | 1.5% | 1.6%(-0.133)#732 | 2.1%(-0.672)#13,042 |
| 2. | 13501 | 1.0% | 1.6%(-0.590)#971 | 2.1%(-1.13)#16,466 |
1
Common Questions
What are the Top Zip Codes with the Highest Percentage of Population Employed in Architecture & Engineering in Utica, NY?
Top Zip Codes with the Highest Percentage of Population Employed in Architecture & Engineering in Utica, NY are:
What zip code has the Highest Percentage of Population Employed in Architecture & Engineering in Utica, NY?
13502 has the Highest Percentage of Population Employed in Architecture & Engineering in Utica, NY with 1.5%.
What is the Percentage of Population Employed in Architecture & Engineering in Utica, NY?
Percentage of Population Employed in Architecture & Engineering in Utica is 1.2%.
What is the Percentage of Population Employed in Architecture & Engineering in New York?
Percentage of Population Employed in Architecture & Engineering in New York is 1.6%.
What is the Percentage of Population Employed in Architecture & Engineering in the United States?
Percentage of Population Employed in Architecture & Engineering in the United States is 2.1%.