Zip Codes with the Highest Percentage of Population Employed in Accommodation & Food Services in Utica, NY
RELATED REPORTS & OPTIONS
Accommodation & Food Services
Utica
Compare Zip Codes
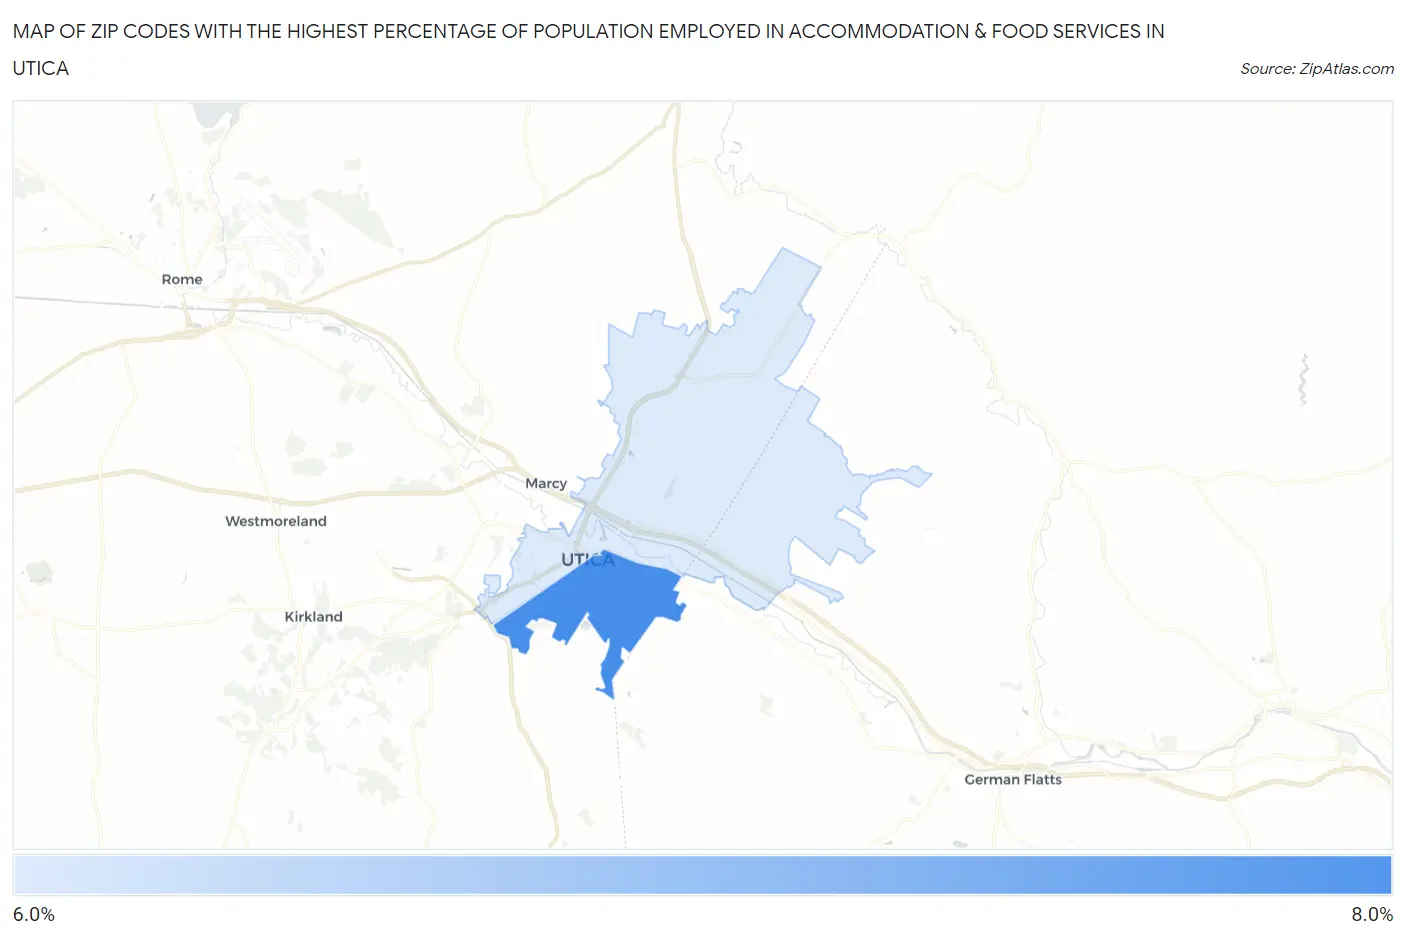
Map of Zip Codes with the Highest Percentage of Population Employed in Accommodation & Food Services in Utica
0.0%
8.0%
Zip Codes with the Highest Percentage of Population Employed in Accommodation & Food Services in Utica, NY
| Zip Code | % Employed | vs State | vs National | |
| 1. | 13501 | 7.6% | 6.2%(+1.45)#412 | 6.9%(+0.731)#8,724 |
| 2. | 13502 | 6.7% | 6.2%(+0.570)#528 | 6.9%(-0.147)#11,097 |
1
Common Questions
What are the Top Zip Codes with the Highest Percentage of Population Employed in Accommodation & Food Services in Utica, NY?
Top Zip Codes with the Highest Percentage of Population Employed in Accommodation & Food Services in Utica, NY are:
What zip code has the Highest Percentage of Population Employed in Accommodation & Food Services in Utica, NY?
13501 has the Highest Percentage of Population Employed in Accommodation & Food Services in Utica, NY with 7.6%.
What is the Percentage of Population Employed in Accommodation & Food Services in Utica, NY?
Percentage of Population Employed in Accommodation & Food Services in Utica is 7.7%.
What is the Percentage of Population Employed in Accommodation & Food Services in New York?
Percentage of Population Employed in Accommodation & Food Services in New York is 6.2%.
What is the Percentage of Population Employed in Accommodation & Food Services in the United States?
Percentage of Population Employed in Accommodation & Food Services in the United States is 6.9%.