Zip Codes with the Highest Percentage of Population Employed in Administrative & Support Services in Pahrump, NV
RELATED REPORTS & OPTIONS
Administrative & Support Services
Pahrump
Compare Zip Codes
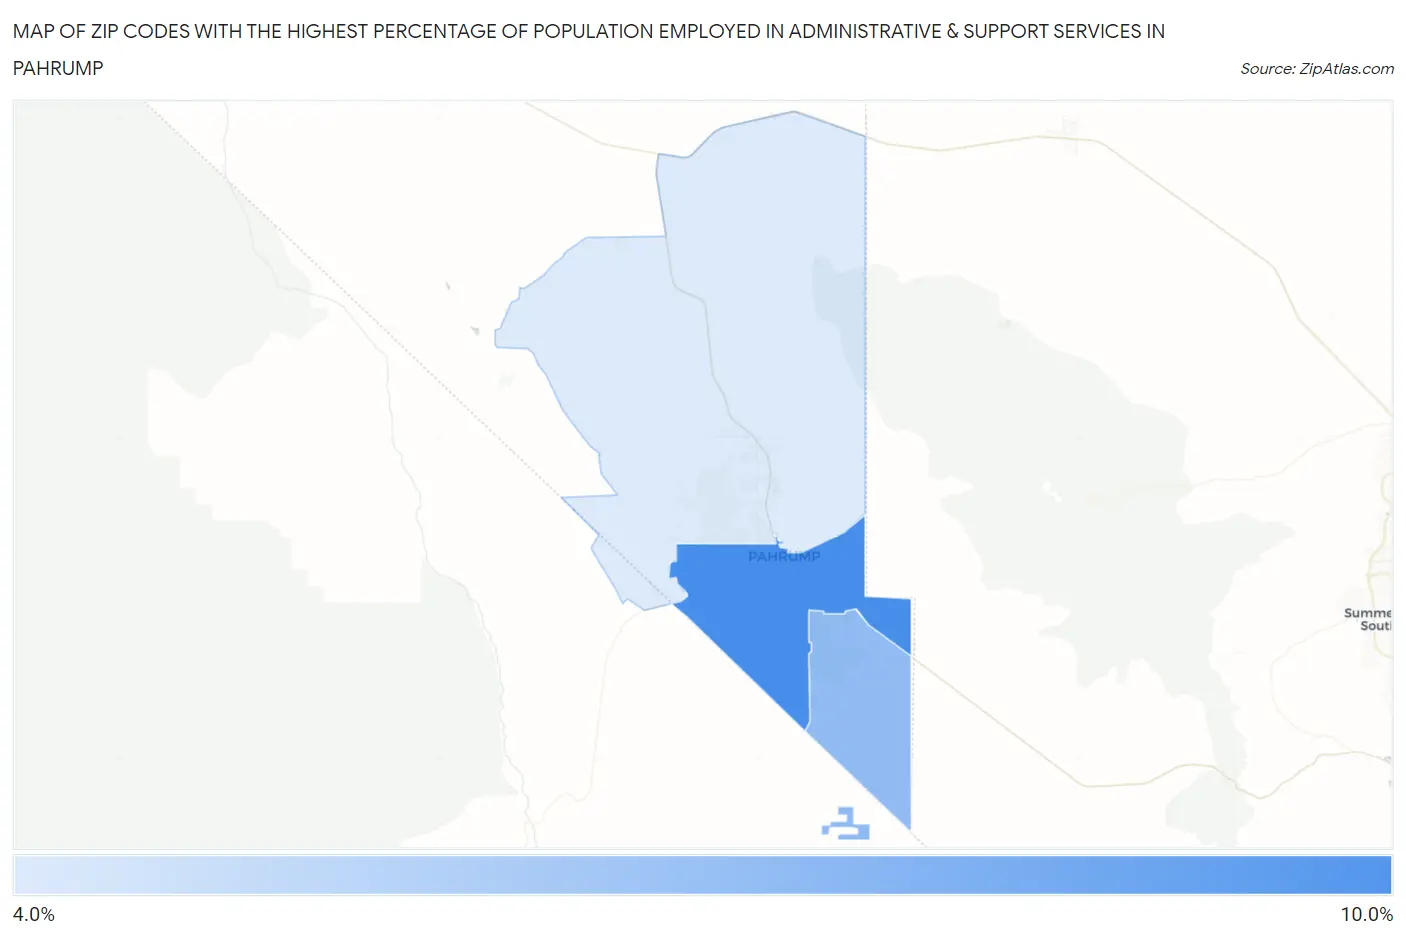
Map of Zip Codes with the Highest Percentage of Population Employed in Administrative & Support Services in Pahrump
0.0%
10.0%
Zip Codes with the Highest Percentage of Population Employed in Administrative & Support Services in Pahrump, NV
| Zip Code | % Employed | vs State | vs National | |
| 1. | 89048 | 8.4% | 5.5%(+2.86)#19 | 4.1%(+4.23)#2,040 |
| 2. | 89061 | 6.4% | 5.5%(+0.865)#41 | 4.1%(+2.23)#4,108 |
| 3. | 89060 | 4.4% | 5.5%(-1.11)#72 | 4.1%(+0.257)#9,054 |
1
Common Questions
What are the Top Zip Codes with the Highest Percentage of Population Employed in Administrative & Support Services in Pahrump, NV?
Top Zip Codes with the Highest Percentage of Population Employed in Administrative & Support Services in Pahrump, NV are:
What zip code has the Highest Percentage of Population Employed in Administrative & Support Services in Pahrump, NV?
89048 has the Highest Percentage of Population Employed in Administrative & Support Services in Pahrump, NV with 8.4%.
What is the Percentage of Population Employed in Administrative & Support Services in Pahrump, NV?
Percentage of Population Employed in Administrative & Support Services in Pahrump is 6.9%.
What is the Percentage of Population Employed in Administrative & Support Services in Nevada?
Percentage of Population Employed in Administrative & Support Services in Nevada is 5.5%.
What is the Percentage of Population Employed in Administrative & Support Services in the United States?
Percentage of Population Employed in Administrative & Support Services in the United States is 4.1%.