Zip Codes with the Highest Percentage of Population Employed in Administrative & Support Services in North Las Vegas, NV
RELATED REPORTS & OPTIONS
Administrative & Support Services
North Las Vegas
Compare Zip Codes
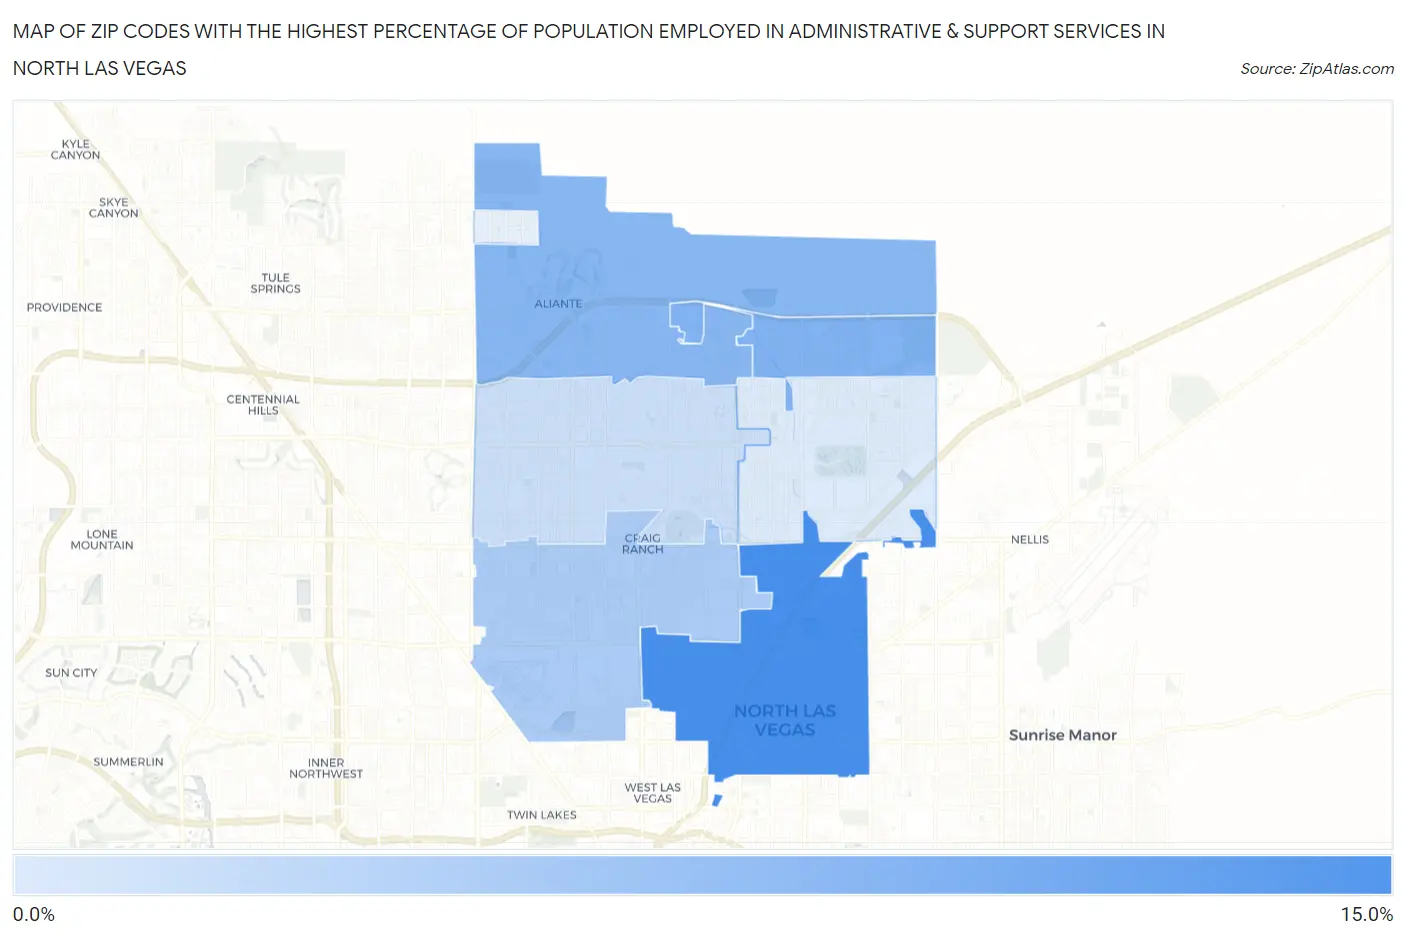
Map of Zip Codes with the Highest Percentage of Population Employed in Administrative & Support Services in North Las Vegas
0.0%
15.0%
Zip Codes with the Highest Percentage of Population Employed in Administrative & Support Services in North Las Vegas, NV
| Zip Code | % Employed | vs State | vs National | |
| 1. | 89030 | 12.0% | 5.5%(+6.49)#3 | 4.1%(+7.86)#845 |
| 2. | 89086 | 8.6% | 5.5%(+3.11)#17 | 4.1%(+4.48)#1,896 |
| 3. | 89084 | 8.2% | 5.5%(+2.71)#21 | 4.1%(+4.08)#2,126 |
| 4. | 89032 | 6.2% | 5.5%(+0.689)#42 | 4.1%(+2.06)#4,397 |
| 5. | 89031 | 4.4% | 5.5%(-1.07)#71 | 4.1%(+0.293)#8,907 |
| 6. | 89081 | 3.4% | 5.5%(-2.14)#100 | 4.1%(-0.773)#13,563 |
1
Common Questions
What are the Top 5 Zip Codes with the Highest Percentage of Population Employed in Administrative & Support Services in North Las Vegas, NV?
Top 5 Zip Codes with the Highest Percentage of Population Employed in Administrative & Support Services in North Las Vegas, NV are:
What zip code has the Highest Percentage of Population Employed in Administrative & Support Services in North Las Vegas, NV?
89030 has the Highest Percentage of Population Employed in Administrative & Support Services in North Las Vegas, NV with 12.0%.
What is the Percentage of Population Employed in Administrative & Support Services in North Las Vegas, NV?
Percentage of Population Employed in Administrative & Support Services in North Las Vegas is 6.4%.
What is the Percentage of Population Employed in Administrative & Support Services in Nevada?
Percentage of Population Employed in Administrative & Support Services in Nevada is 5.5%.
What is the Percentage of Population Employed in Administrative & Support Services in the United States?
Percentage of Population Employed in Administrative & Support Services in the United States is 4.1%.