Zip Codes with the Highest Percentage of Population Employed in Computer & Mathematics in Pahrump, NV
RELATED REPORTS & OPTIONS
Computer & Mathematics
Pahrump
Compare Zip Codes
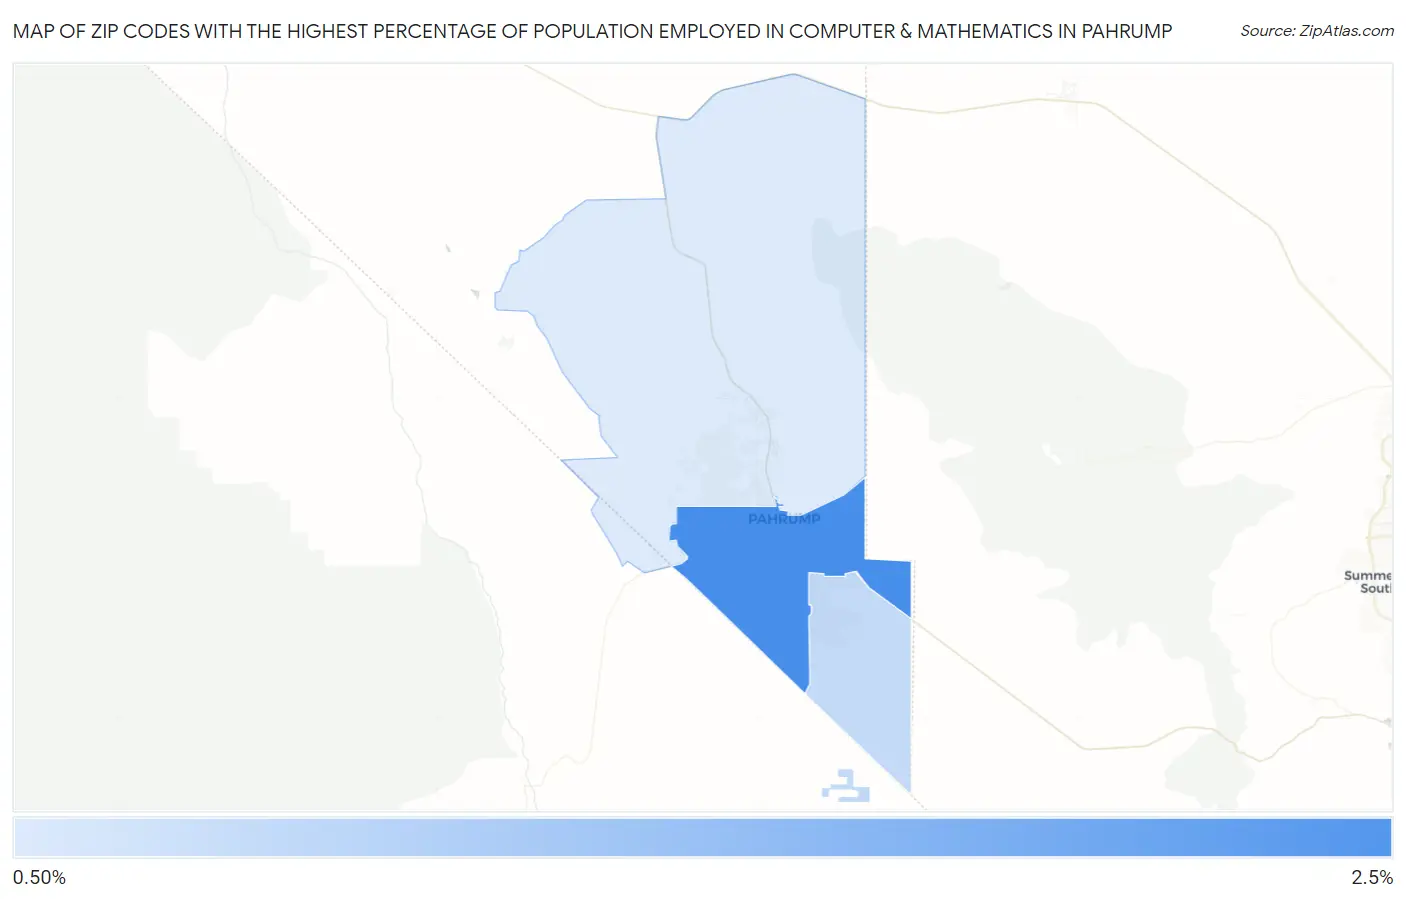
Map of Zip Codes with the Highest Percentage of Population Employed in Computer & Mathematics in Pahrump
0.0%
2.5%
Zip Codes with the Highest Percentage of Population Employed in Computer & Mathematics in Pahrump, NV
| Zip Code | % Employed | vs State | vs National | |
| 1. | 89048 | 2.3% | 2.3%(-0.028)#50 | 3.5%(-1.22)#10,439 |
| 2. | 89061 | 0.86% | 2.3%(-1.47)#96 | 3.5%(-2.67)#18,290 |
| 3. | 89060 | 0.56% | 2.3%(-1.77)#106 | 3.5%(-2.97)#20,123 |
1
Common Questions
What are the Top Zip Codes with the Highest Percentage of Population Employed in Computer & Mathematics in Pahrump, NV?
Top Zip Codes with the Highest Percentage of Population Employed in Computer & Mathematics in Pahrump, NV are:
What zip code has the Highest Percentage of Population Employed in Computer & Mathematics in Pahrump, NV?
89048 has the Highest Percentage of Population Employed in Computer & Mathematics in Pahrump, NV with 2.3%.
What is the Percentage of Population Employed in Computer & Mathematics in Pahrump, NV?
Percentage of Population Employed in Computer & Mathematics in Pahrump is 1.6%.
What is the Percentage of Population Employed in Computer & Mathematics in Nevada?
Percentage of Population Employed in Computer & Mathematics in Nevada is 2.3%.
What is the Percentage of Population Employed in Computer & Mathematics in the United States?
Percentage of Population Employed in Computer & Mathematics in the United States is 3.5%.