Zip Codes with the Highest Percentage of Population with a Degree in Visual and Performing Arts in Gardnerville, NV
RELATED REPORTS & OPTIONS
Visual and Performing Arts
Gardnerville
Compare Zip Codes
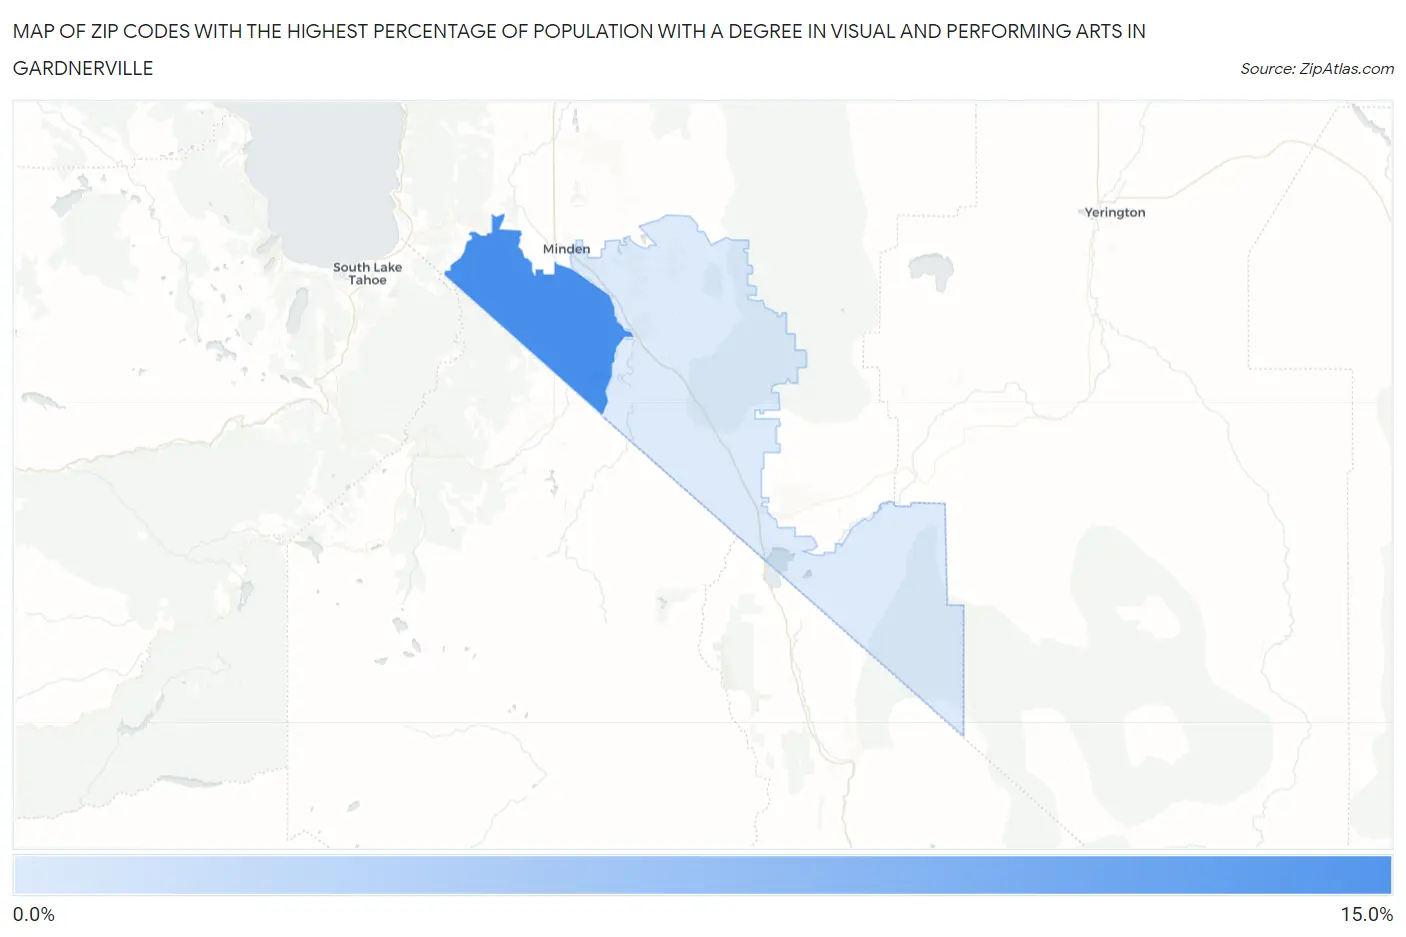
Map of Zip Codes with the Highest Percentage of Population with a Degree in Visual and Performing Arts in Gardnerville
0.0%
15.0%
Zip Codes with the Highest Percentage of Population with a Degree in Visual and Performing Arts in Gardnerville, NV
| Zip Code | % Graduates | vs State | vs National | |
| 1. | 89460 | 10.5% | 3.8%(+6.66)#9 | 4.3%(+6.20)#1,694 |
| 2. | 89410 | 2.8% | 3.8%(-0.950)#77 | 4.3%(-1.41)#13,319 |
1
Common Questions
What are the Top Zip Codes with the Highest Percentage of Population with a Degree in Visual and Performing Arts in Gardnerville, NV?
Top Zip Codes with the Highest Percentage of Population with a Degree in Visual and Performing Arts in Gardnerville, NV are:
What zip code has the Highest Percentage of Population with a Degree in Visual and Performing Arts in Gardnerville, NV?
89460 has the Highest Percentage of Population with a Degree in Visual and Performing Arts in Gardnerville, NV with 10.5%.
What is the Percentage of Population with a Degree in Visual and Performing Arts in Gardnerville, NV?
Percentage of Population with a Degree in Visual and Performing Arts in Gardnerville is 3.4%.
What is the Percentage of Population with a Degree in Visual and Performing Arts in Nevada?
Percentage of Population with a Degree in Visual and Performing Arts in Nevada is 3.8%.
What is the Percentage of Population with a Degree in Visual and Performing Arts in the United States?
Percentage of Population with a Degree in Visual and Performing Arts in the United States is 4.3%.