Zip Codes with the Highest Percentage of Population Employed in Architecture & Engineering in Roswell, NM
RELATED REPORTS & OPTIONS
Architecture & Engineering
Roswell
Compare Zip Codes
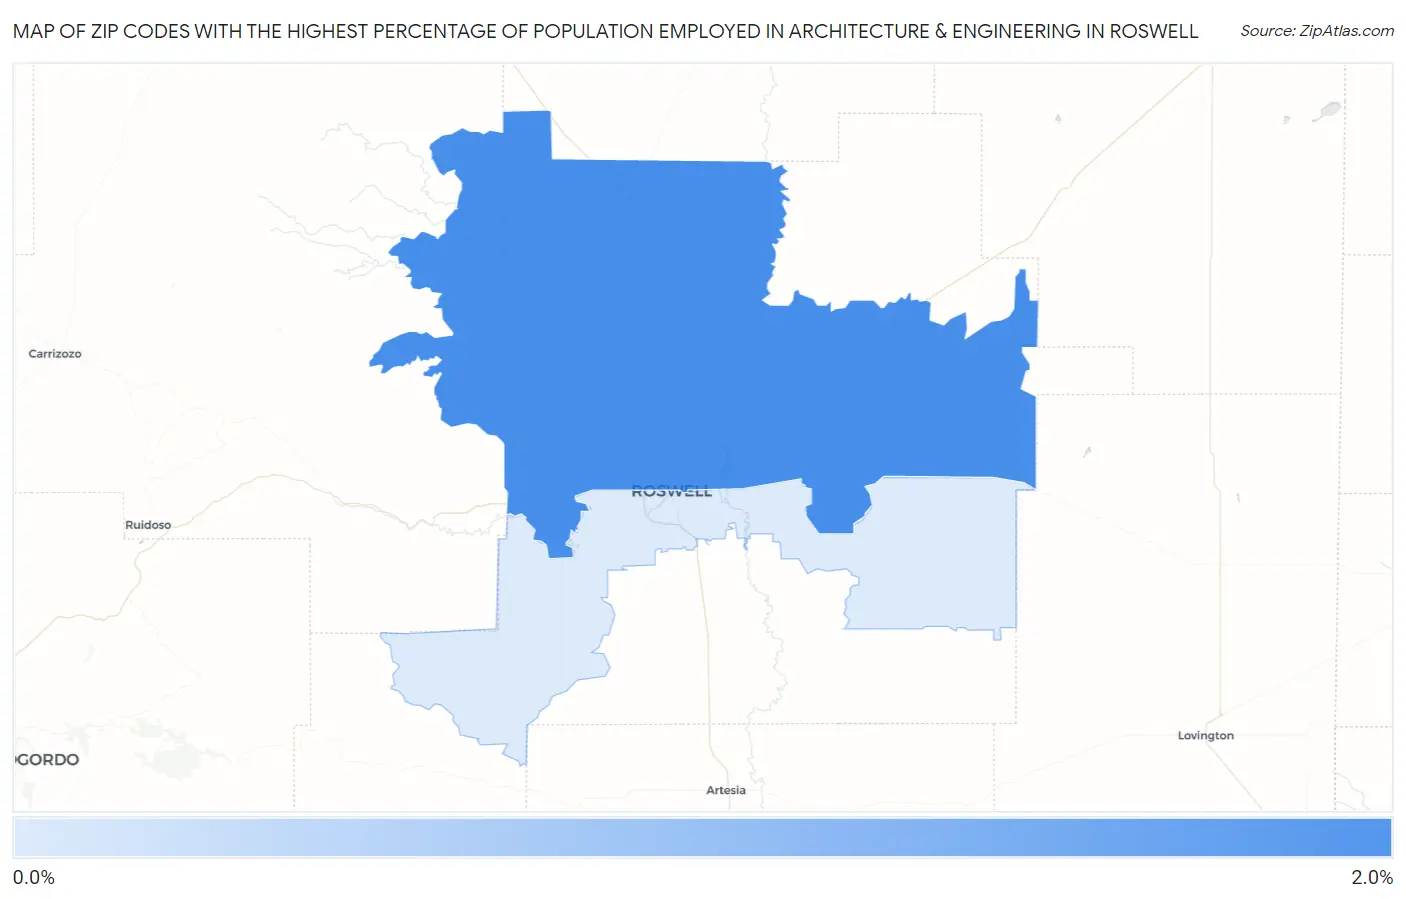
Map of Zip Codes with the Highest Percentage of Population Employed in Architecture & Engineering in Roswell
0.0%
2.0%
Zip Codes with the Highest Percentage of Population Employed in Architecture & Engineering in Roswell, NM
| Zip Code | % Employed | vs State | vs National | |
| 1. | 88201 | 2.0% | 2.5%(-0.518)#68 | 2.1%(-0.150)#9,616 |
| 2. | 88203 | 0.98% | 2.5%(-1.54)#98 | 2.1%(-1.17)#16,751 |
1
Common Questions
What are the Top Zip Codes with the Highest Percentage of Population Employed in Architecture & Engineering in Roswell, NM?
Top Zip Codes with the Highest Percentage of Population Employed in Architecture & Engineering in Roswell, NM are:
What zip code has the Highest Percentage of Population Employed in Architecture & Engineering in Roswell, NM?
88201 has the Highest Percentage of Population Employed in Architecture & Engineering in Roswell, NM with 2.0%.
What is the Percentage of Population Employed in Architecture & Engineering in Roswell, NM?
Percentage of Population Employed in Architecture & Engineering in Roswell is 1.0%.
What is the Percentage of Population Employed in Architecture & Engineering in New Mexico?
Percentage of Population Employed in Architecture & Engineering in New Mexico is 2.5%.
What is the Percentage of Population Employed in Architecture & Engineering in the United States?
Percentage of Population Employed in Architecture & Engineering in the United States is 2.1%.