Zip Codes with the Highest Percentage of Families with Income Below $10,000 in Roswell, NM
RELATED REPORTS & OPTIONS
Family Income | $0-10k
Roswell
Compare Zip Codes
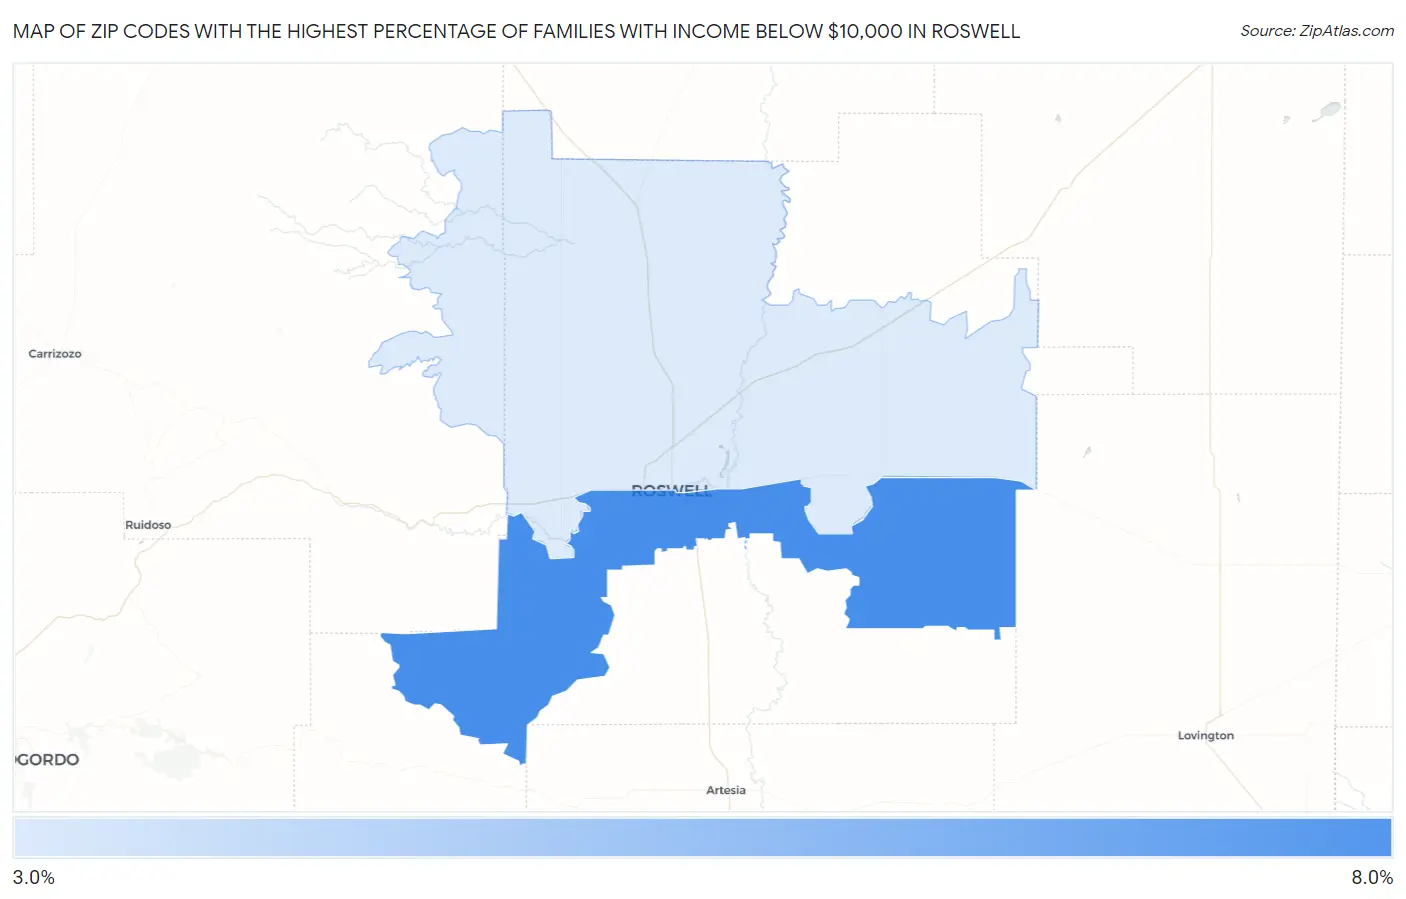
Map of Zip Codes with the Highest Percentage of Families with Income Below $10,000 in Roswell
0.0%
8.0%
Zip Codes with the Highest Percentage of Families with Income Below $10,000 in Roswell, NM
| Zip Code | Families with Income < $10k | vs State | vs National | |
| 1. | 88203 | 6.9% | 4.6%(+2.30)#78 | 3.1%(+3.80)#3,698 |
| 2. | 88201 | 3.2% | 4.6%(-1.40)#136 | 3.1%(+0.100)#10,472 |
1
Common Questions
What are the Top Zip Codes with the Highest Percentage of Families with Income Below $10,000 in Roswell, NM?
Top Zip Codes with the Highest Percentage of Families with Income Below $10,000 in Roswell, NM are:
What zip code has the Highest Percentage of Families with Income Below $10,000 in Roswell, NM?
88203 has the Highest Percentage of Families with Income Below $10,000 in Roswell, NM with 6.9%.
What is the Percentage of Families with Income Below $10,000 in Roswell, NM?
Percentage of Families with Income Below $10,000 in Roswell is 5.5%.
What is the Percentage of Families with Income Below $10,000 in New Mexico?
Percentage of Families with Income Below $10,000 in New Mexico is 4.6%.
What is the Percentage of Families with Income Below $10,000 in the United States?
Percentage of Families with Income Below $10,000 in the United States is 3.1%.