Zip Codes with the Highest Percentage of Population Taking Taxi / Cab to Work in Roswell, NM
RELATED REPORTS & OPTIONS
Taxi / Cab
Roswell
Compare Zip Codes
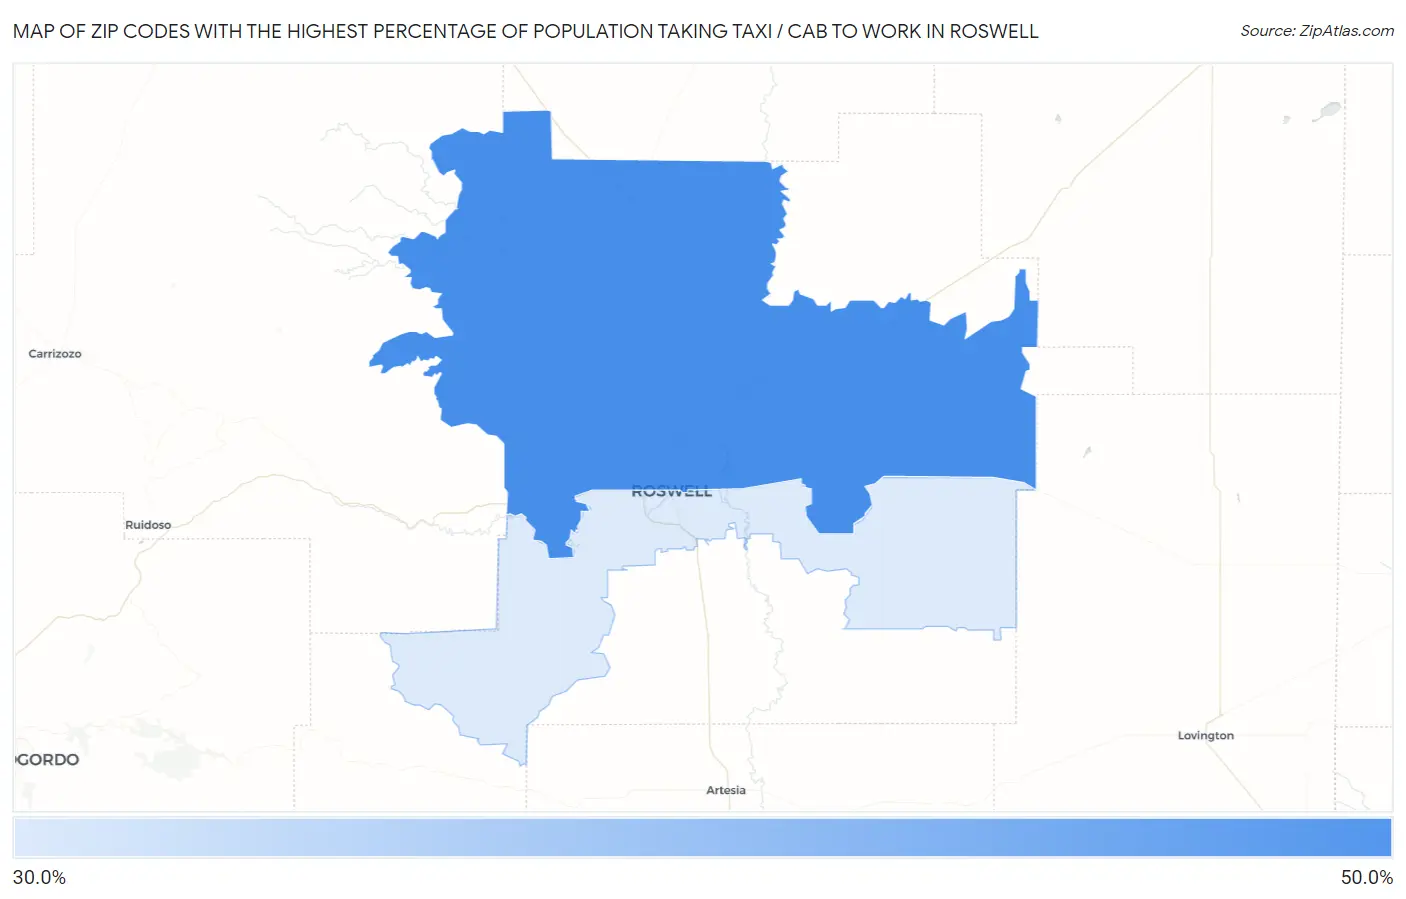
Map of Zip Codes with the Highest Percentage of Population Taking Taxi / Cab to Work in Roswell
0.0%
50.0%
Zip Codes with the Highest Percentage of Population Taking Taxi / Cab to Work in Roswell, NM
| Zip Code | % Take Taxi / Cab | vs State | vs National | |
| 1. | 88201 | 42.2% | 40.5%(+1.70)#37 | 38.2%(+4.00)#5,663 |
| 2. | 88203 | 33.6% | 40.5%(-6.90)#59 | 38.2%(-4.60)#9,524 |
1
Common Questions
What are the Top Zip Codes with the Highest Percentage of Population Taking Taxi / Cab to Work in Roswell, NM?
Top Zip Codes with the Highest Percentage of Population Taking Taxi / Cab to Work in Roswell, NM are:
What zip code has the Highest Percentage of Population Taking Taxi / Cab to Work in Roswell, NM?
88201 has the Highest Percentage of Population Taking Taxi / Cab to Work in Roswell, NM with 42.2%.
What is the Percentage of Population Taking Taxi / Cab to Work in Roswell, NM?
Percentage of Population Taking Taxi / Cab to Work in Roswell is 38.8%.
What is the Percentage of Population Taking Taxi / Cab to Work in New Mexico?
Percentage of Population Taking Taxi / Cab to Work in New Mexico is 40.5%.
What is the Percentage of Population Taking Taxi / Cab to Work in the United States?
Percentage of Population Taking Taxi / Cab to Work in the United States is 38.2%.