Zip Codes with the Highest Percentage of Population Employed in Agriculture, Fishing & Hunting in Bellevue, NE
RELATED REPORTS & OPTIONS
Agriculture, Fishing & Hunting
Bellevue
Compare Zip Codes
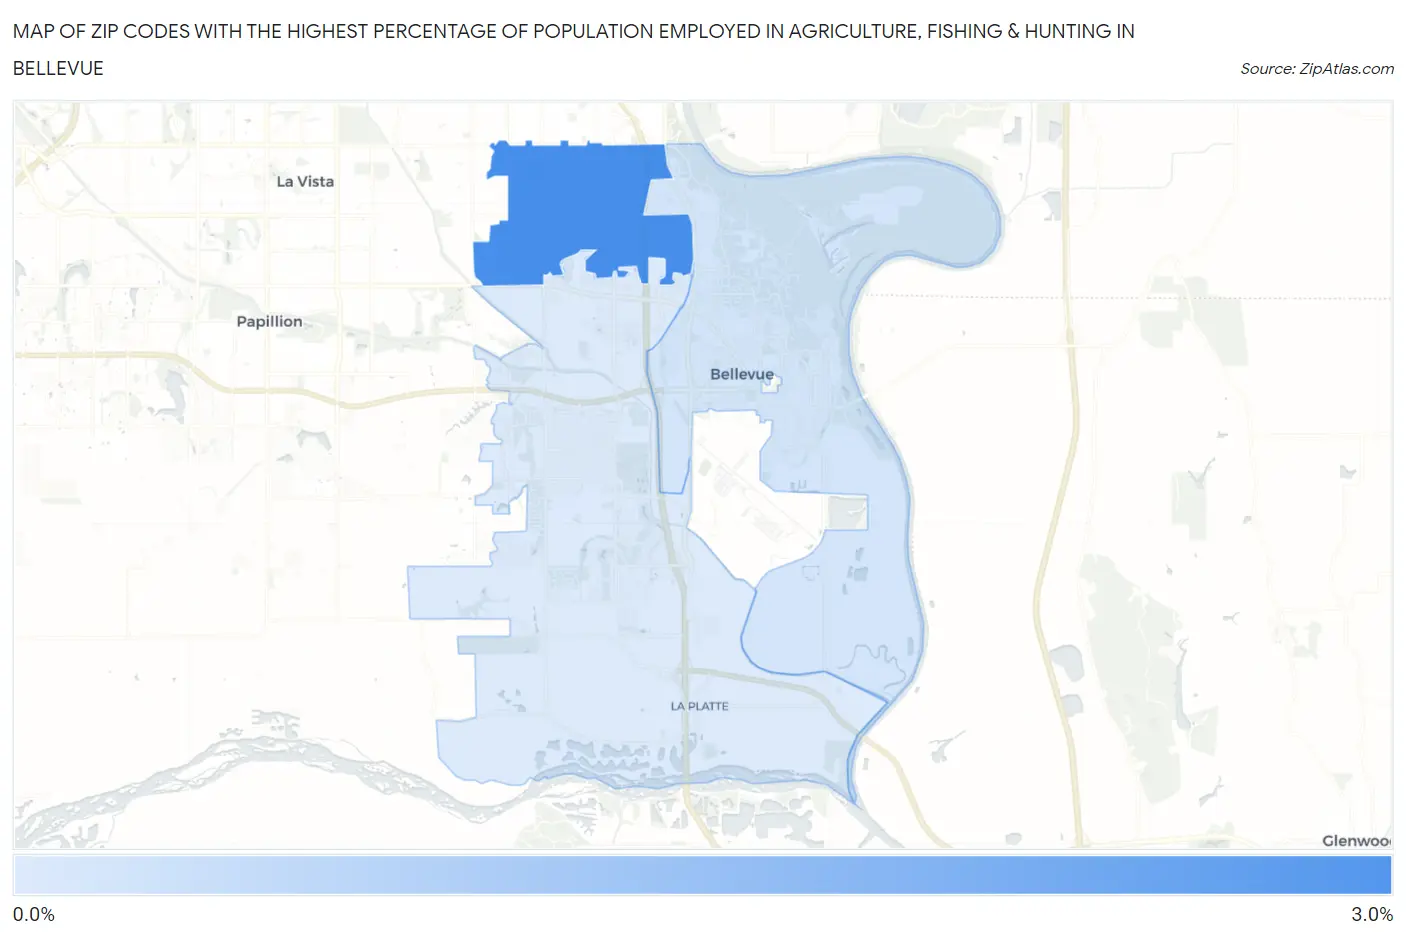
Map of Zip Codes with the Highest Percentage of Population Employed in Agriculture, Fishing & Hunting in Bellevue
0.0%
3.0%
Zip Codes with the Highest Percentage of Population Employed in Agriculture, Fishing & Hunting in Bellevue, NE
| Zip Code | % Employed | vs State | vs National | |
| 1. | 68147 | 2.7% | 4.1%(-1.43)#458 | 1.2%(+1.51)#11,104 |
| 2. | 68005 | 0.63% | 4.1%(-3.51)#529 | 1.2%(-0.567)#18,255 |
| 3. | 68123 | 0.50% | 4.1%(-3.64)#535 | 1.2%(-0.694)#19,240 |
1
Common Questions
What are the Top Zip Codes with the Highest Percentage of Population Employed in Agriculture, Fishing & Hunting in Bellevue, NE?
Top Zip Codes with the Highest Percentage of Population Employed in Agriculture, Fishing & Hunting in Bellevue, NE are:
What zip code has the Highest Percentage of Population Employed in Agriculture, Fishing & Hunting in Bellevue, NE?
68147 has the Highest Percentage of Population Employed in Agriculture, Fishing & Hunting in Bellevue, NE with 2.7%.
What is the Percentage of Population Employed in Agriculture, Fishing & Hunting in Bellevue, NE?
Percentage of Population Employed in Agriculture, Fishing & Hunting in Bellevue is 0.98%.
What is the Percentage of Population Employed in Agriculture, Fishing & Hunting in Nebraska?
Percentage of Population Employed in Agriculture, Fishing & Hunting in Nebraska is 4.1%.
What is the Percentage of Population Employed in Agriculture, Fishing & Hunting in the United States?
Percentage of Population Employed in Agriculture, Fishing & Hunting in the United States is 1.2%.