Hide A Way Lake, MS
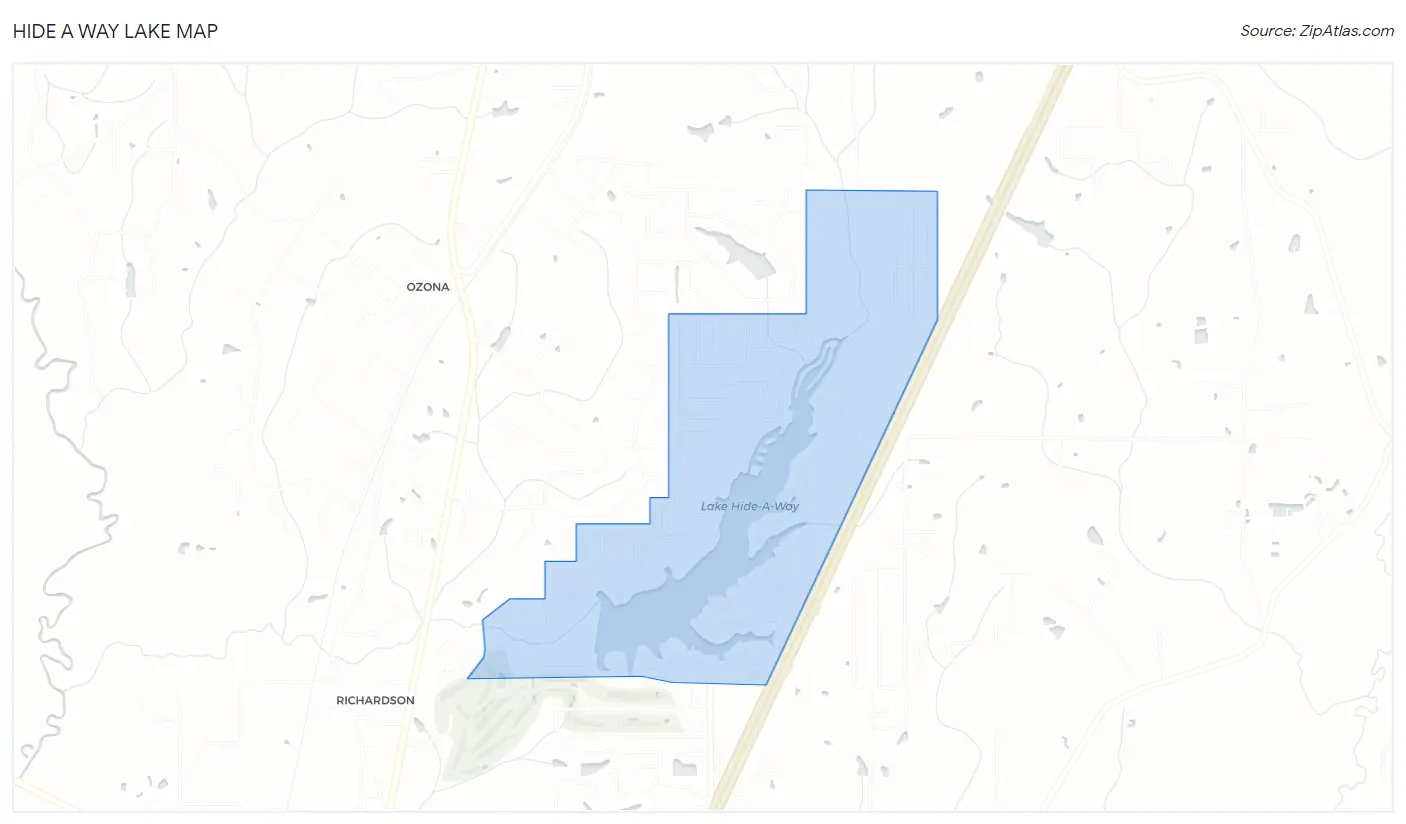
Hide A Way Lake Map
Hide A Way Lake Overview
2,194
TOTAL POPULATION
1,010
MALE POPULATION
1,184
FEMALE POPULATION
85.30
MALES / 100 FEMALES
117.23
FEMALES / 100 MALES
54.1
MEDIAN AGE
3.0
AVG FAMILY SIZE
2.4
AVG HOUSEHOLD SIZE
$43,336
PER CAPITA INCOME
$92,428
AVG FAMILY INCOME
$78,529
AVG HOUSEHOLD INCOME
0.42
INEQUALITY / GINI INDEX
1,312
LABOR FORCE [ PEOPLE ]
66.8%
PERCENT IN LABOR FORCE
10.1%
UNEMPLOYMENT RATE
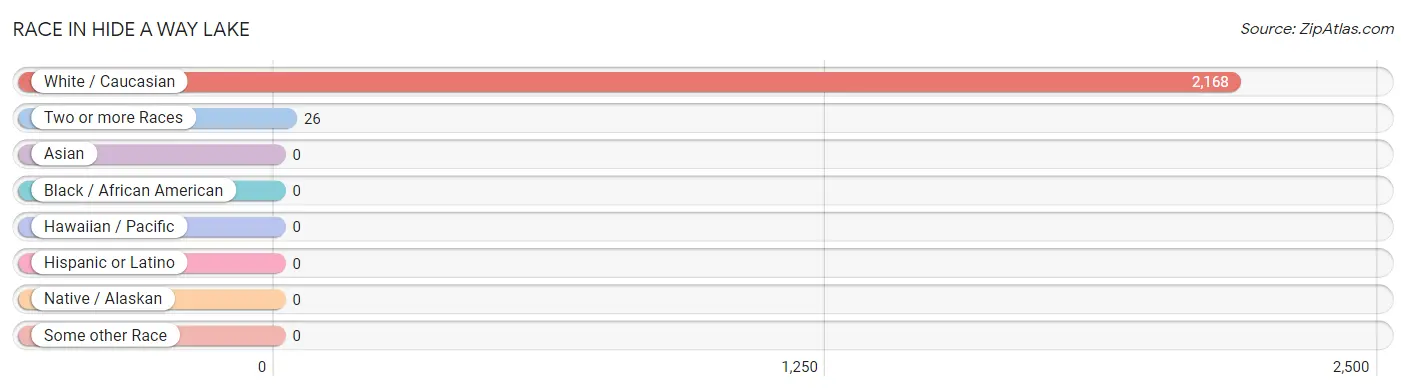
Race in Hide A Way Lake
The most populous races in Hide A Way Lake are White / Caucasian (2,168 | 98.8%), and Two or more Races (26 | 1.2%).
| Race | # Population | % Population |
| Asian | 0 | 0.0% |
| Black / African American | 0 | 0.0% |
| Hawaiian / Pacific | 0 | 0.0% |
| Hispanic or Latino | 0 | 0.0% |
| Native / Alaskan | 0 | 0.0% |
| White / Caucasian | 2,168 | 98.8% |
| Two or more Races | 26 | 1.2% |
| Some other Race | 0 | 0.0% |
| Total | 2,194 | 100.0% |
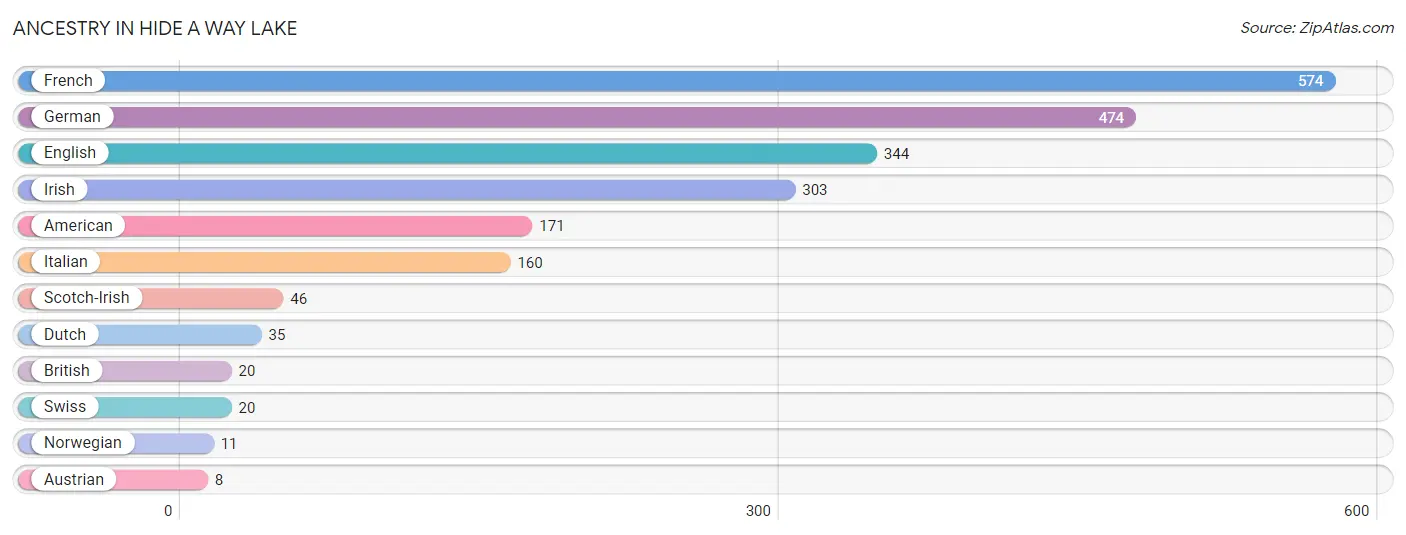
Ancestry in Hide A Way Lake
The most populous ancestries reported in Hide A Way Lake are French (574 | 26.2%), German (474 | 21.6%), English (344 | 15.7%), Irish (303 | 13.8%), and American (171 | 7.8%), together accounting for 85.0% of all Hide A Way Lake residents.
| Ancestry | # Population | % Population |
| American | 171 | 7.8% |
| Austrian | 8 | 0.4% |
| British | 20 | 0.9% |
| Dutch | 35 | 1.6% |
| English | 344 | 15.7% |
| French | 574 | 26.2% |
| German | 474 | 21.6% |
| Irish | 303 | 13.8% |
| Italian | 160 | 7.3% |
| Norwegian | 11 | 0.5% |
| Scotch-Irish | 46 | 2.1% |
| Swiss | 20 | 0.9% | View All 12 Rows |
Immigrants in Hide A Way Lake

| Immigration Origin | # Population | % Population | View All 0 Rows |
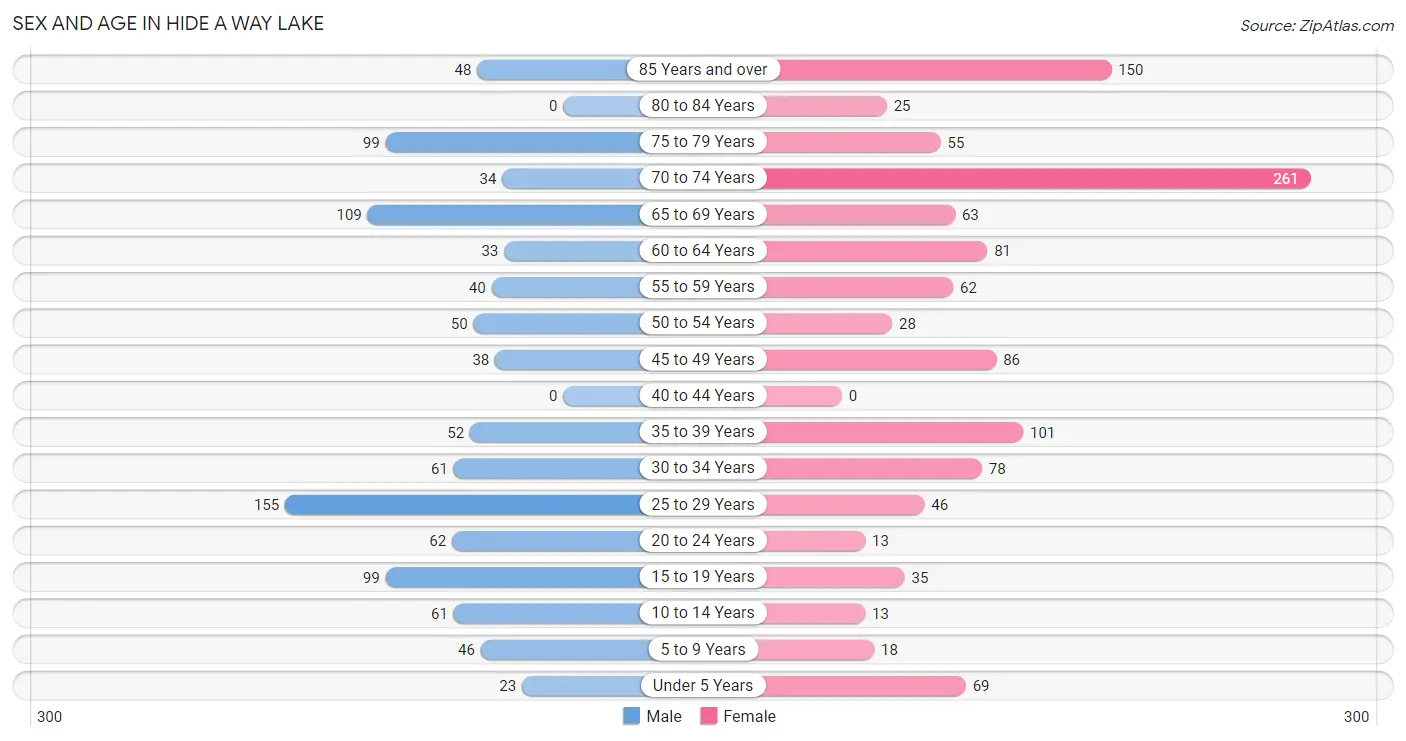
Sex and Age in Hide A Way Lake
Sex and Age in Hide A Way Lake
The most populous age groups in Hide A Way Lake are 25 to 29 Years (155 | 15.3%) for men and 70 to 74 Years (261 | 22.0%) for women.
| Age Bracket | Male | Female |
| Under 5 Years | 23 (2.3%) | 69 (5.8%) |
| 5 to 9 Years | 46 (4.5%) | 18 (1.5%) |
| 10 to 14 Years | 61 (6.0%) | 13 (1.1%) |
| 15 to 19 Years | 99 (9.8%) | 35 (3.0%) |
| 20 to 24 Years | 62 (6.1%) | 13 (1.1%) |
| 25 to 29 Years | 155 (15.3%) | 46 (3.9%) |
| 30 to 34 Years | 61 (6.0%) | 78 (6.6%) |
| 35 to 39 Years | 52 (5.1%) | 101 (8.5%) |
| 40 to 44 Years | 0 (0.0%) | 0 (0.0%) |
| 45 to 49 Years | 38 (3.8%) | 86 (7.3%) |
| 50 to 54 Years | 50 (5.0%) | 28 (2.4%) |
| 55 to 59 Years | 40 (4.0%) | 62 (5.2%) |
| 60 to 64 Years | 33 (3.3%) | 81 (6.8%) |
| 65 to 69 Years | 109 (10.8%) | 63 (5.3%) |
| 70 to 74 Years | 34 (3.4%) | 261 (22.0%) |
| 75 to 79 Years | 99 (9.8%) | 55 (4.6%) |
| 80 to 84 Years | 0 (0.0%) | 25 (2.1%) |
| 85 Years and over | 48 (4.8%) | 150 (12.7%) |
| Total | 1,010 (100.0%) | 1,184 (100.0%) |
Families and Households in Hide A Way Lake
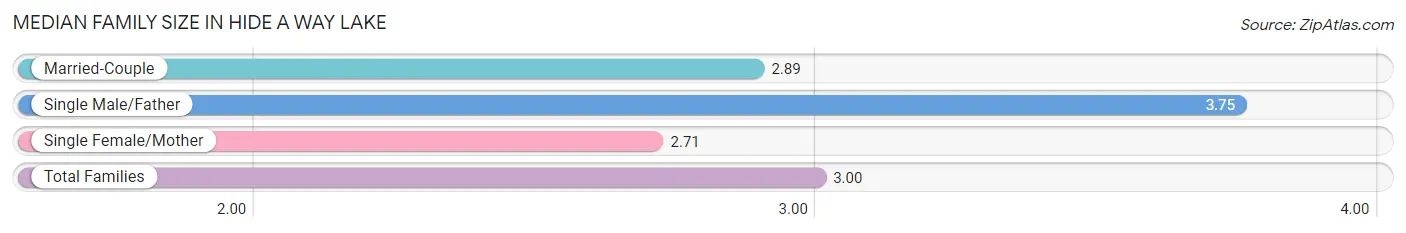
Median Family Size in Hide A Way Lake
The median family size in Hide A Way Lake is 3.00 persons per family, with single male/father families (88 | 14.5%) accounting for the largest median family size of 3.75 persons per family. On the other hand, single female/mother families (45 | 7.4%) represent the smallest median family size with 2.71 persons per family.
| Family Type | # Families | Family Size |
| Married-Couple | 472 (78.0%) | 2.89 |
| Single Male/Father | 88 (14.5%) | 3.75 |
| Single Female/Mother | 45 (7.4%) | 2.71 |
| Total Families | 605 (100.0%) | 3.00 |
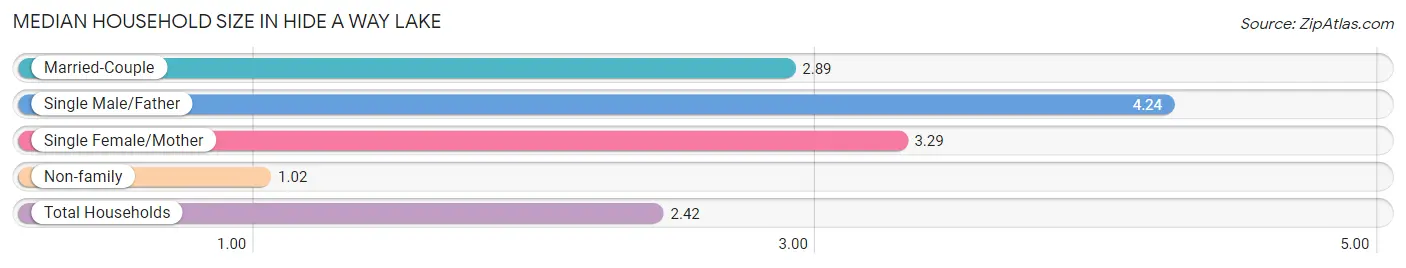
Median Household Size in Hide A Way Lake
The median household size in Hide A Way Lake is 2.42 persons per household, with single male/father households (88 | 9.7%) accounting for the largest median household size of 4.24 persons per household. non-family households (301 | 33.2%) represent the smallest median household size with 1.02 persons per household.
| Household Type | # Households | Household Size |
| Married-Couple | 472 (52.1%) | 2.89 |
| Single Male/Father | 88 (9.7%) | 4.24 |
| Single Female/Mother | 45 (5.0%) | 3.29 |
| Non-family | 301 (33.2%) | 1.02 |
| Total Households | 906 (100.0%) | 2.42 |
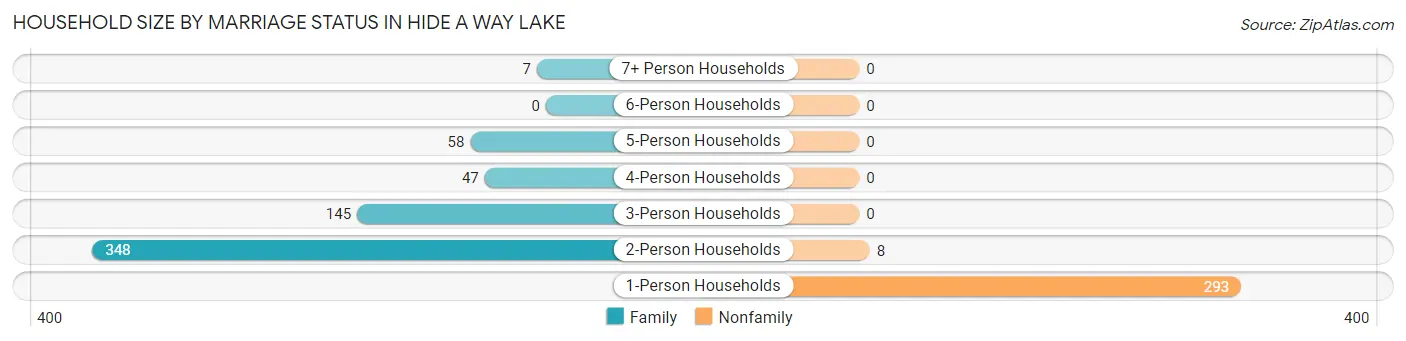
Household Size by Marriage Status in Hide A Way Lake
Out of a total of 906 households in Hide A Way Lake, 605 (66.8%) are family households, while 301 (33.2%) are nonfamily households. The most numerous type of family households are 2-person households, comprising 348, and the most common type of nonfamily households are 1-person households, comprising 293.
| Household Size | Family Households | Nonfamily Households |
| 1-Person Households | - | 293 (32.3%) |
| 2-Person Households | 348 (38.4%) | 8 (0.9%) |
| 3-Person Households | 145 (16.0%) | 0 (0.0%) |
| 4-Person Households | 47 (5.2%) | 0 (0.0%) |
| 5-Person Households | 58 (6.4%) | 0 (0.0%) |
| 6-Person Households | 0 (0.0%) | 0 (0.0%) |
| 7+ Person Households | 7 (0.8%) | 0 (0.0%) |
| Total | 605 (66.8%) | 301 (33.2%) |
Female Fertility in Hide A Way Lake
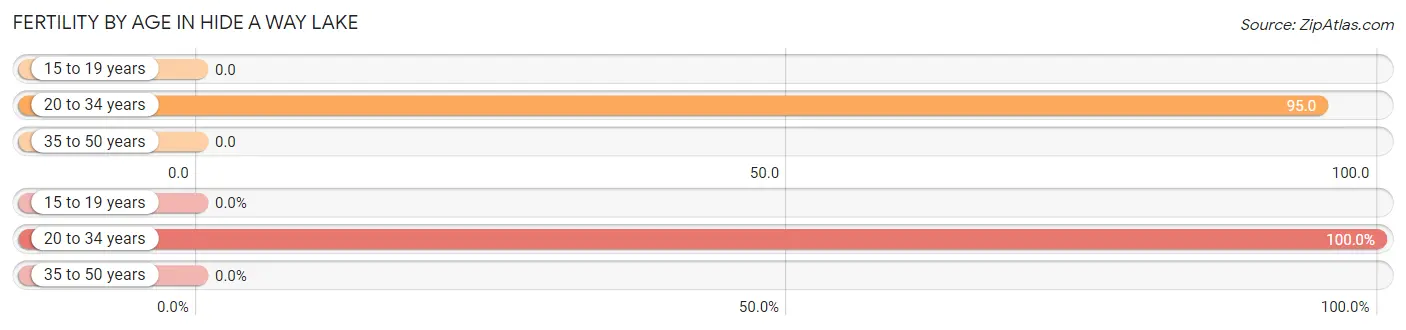
Fertility by Age in Hide A Way Lake
Average fertility rate in Hide A Way Lake is 36.0 births per 1,000 women. Women in the age bracket of 20 to 34 years have the highest fertility rate with 95.0 births per 1,000 women. Women in the age bracket of 20 to 34 years acount for 100.0% of all women with births.
| Age Bracket | Women with Births | Births / 1,000 Women |
| 15 to 19 years | 0 (0.0%) | 0.0 |
| 20 to 34 years | 13 (100.0%) | 95.0 |
| 35 to 50 years | 0 (0.0%) | 0.0 |
| Total | 13 (100.0%) | 36.0 |
Fertility by Age by Marriage Status in Hide A Way Lake
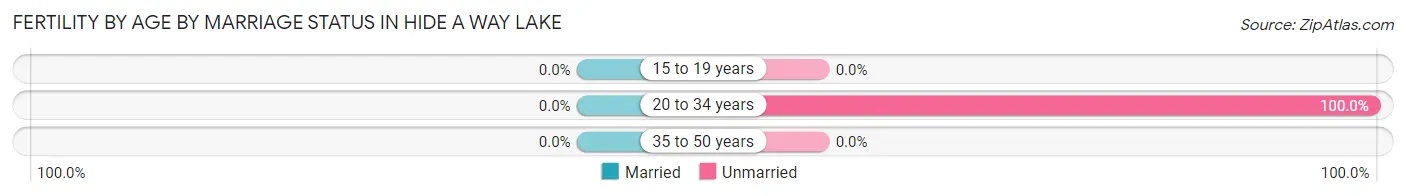
| Age Bracket | Married | Unmarried |
| 15 to 19 years | 0 (0.0%) | 0 (0.0%) |
| 20 to 34 years | 0 (0.0%) | 13 (100.0%) |
| 35 to 50 years | 0 (0.0%) | 0 (0.0%) |
| Total | 0 (0.0%) | 13 (100.0%) |
Fertility by Education in Hide A Way Lake
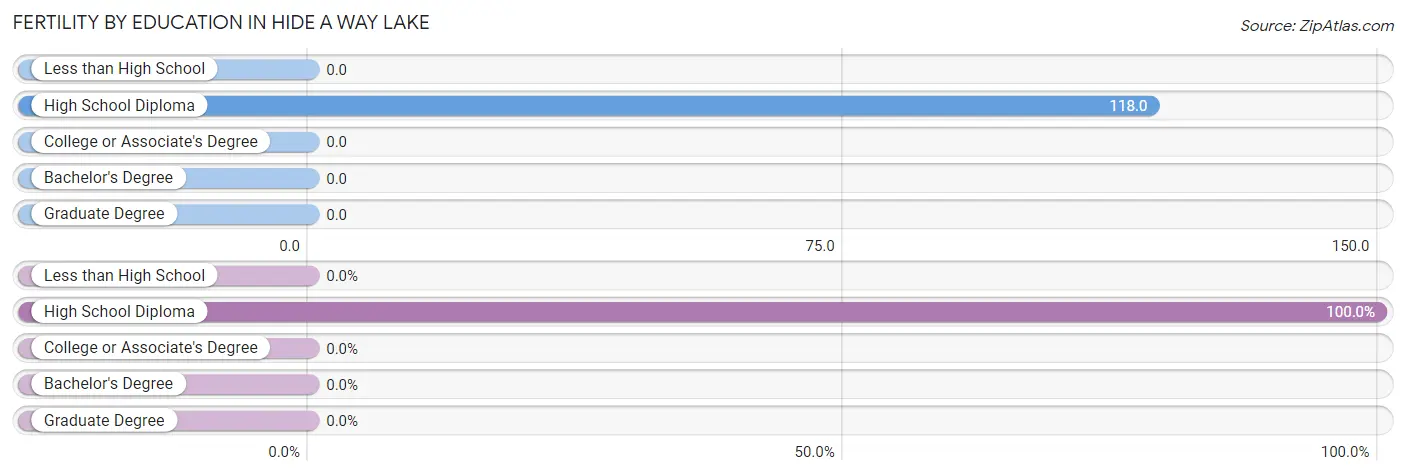
| Educational Attainment | Women with Births | Births / 1,000 Women |
| Less than High School | 0 (0.0%) | 0.0 |
| High School Diploma | 13 (100.0%) | 118.0 |
| College or Associate's Degree | 0 (0.0%) | 0.0 |
| Bachelor's Degree | 0 (0.0%) | 0.0 |
| Graduate Degree | 0 (0.0%) | 0.0 |
| Total | 13 (100.0%) | 36.0 |
Fertility by Education by Marriage Status in Hide A Way Lake
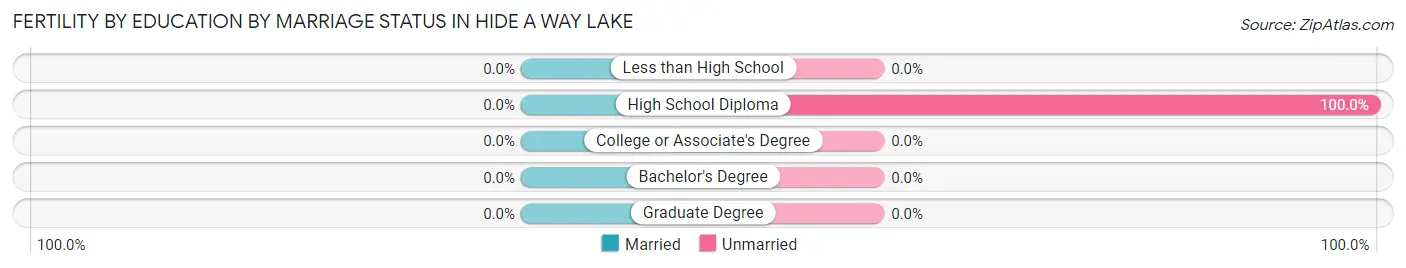
| Educational Attainment | Married | Unmarried |
| Less than High School | 0 (0.0%) | 0 (0.0%) |
| High School Diploma | 0 (0.0%) | 13 (100.0%) |
| College or Associate's Degree | 0 (0.0%) | 0 (0.0%) |
| Bachelor's Degree | 0 (0.0%) | 0 (0.0%) |
| Graduate Degree | 0 (0.0%) | 0 (0.0%) |
| Total | 0 (0.0%) | 13 (100.0%) |
Income in Hide A Way Lake
Income Overview in Hide A Way Lake
Per Capita Income in Hide A Way Lake is $43,336, while median incomes of families and households are $92,428 and $78,529 respectively.
| Characteristic | Number | Measure |
| Per Capita Income | 2,194 | $43,336 |
| Median Family Income | 605 | $92,428 |
| Mean Family Income | 605 | $125,195 |
| Median Household Income | 906 | $78,529 |
| Mean Household Income | 906 | $98,644 |
| Income Deficit | 605 | $0 |
| Wage / Income Gap (%) | 2,194 | 0.00% |
| Wage / Income Gap ($) | 2,194 | 100.00¢ per $1 |
| Gini / Inequality Index | 2,194 | 0.42 |
Earnings by Sex in Hide A Way Lake
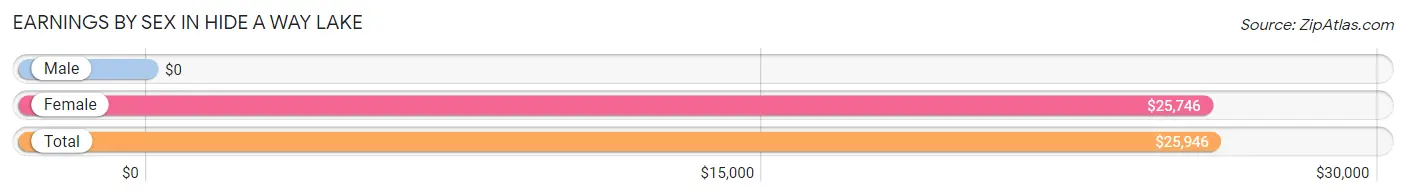
| Sex | Number | Average Earnings |
| Male | 629 (46.9%) | $0 |
| Female | 712 (53.1%) | $25,746 |
| Total | 1,341 (100.0%) | $25,946 |
Earnings by Sex by Income Bracket in Hide A Way Lake
The most common earnings brackets in Hide A Way Lake are $5,000 to $7,499 for men (145 | 23.1%) and $25,000 to $29,999 for women (189 | 26.5%).
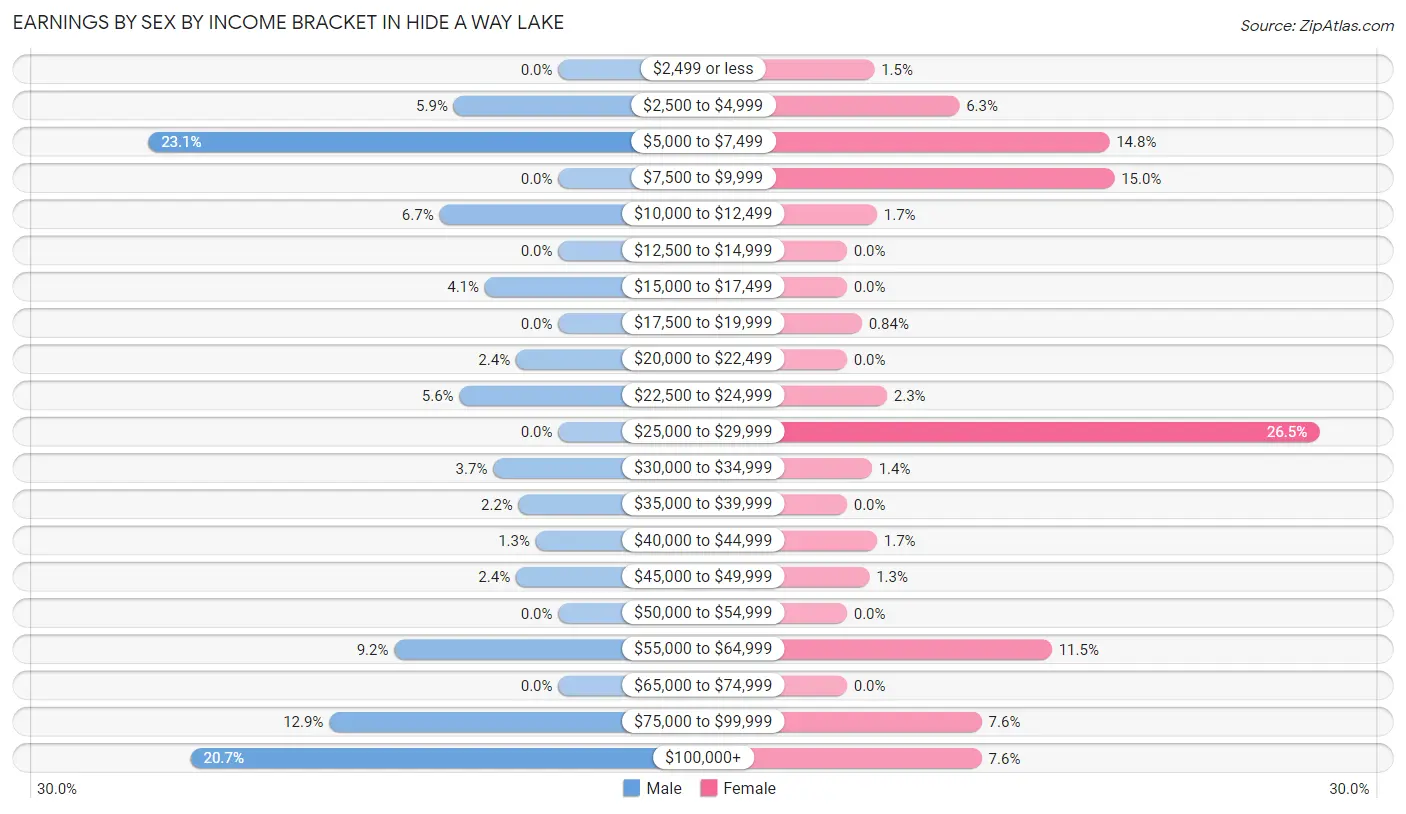
| Income | Male | Female |
| $2,499 or less | 0 (0.0%) | 11 (1.5%) |
| $2,500 to $4,999 | 37 (5.9%) | 45 (6.3%) |
| $5,000 to $7,499 | 145 (23.1%) | 105 (14.7%) |
| $7,500 to $9,999 | 0 (0.0%) | 107 (15.0%) |
| $10,000 to $12,499 | 42 (6.7%) | 12 (1.7%) |
| $12,500 to $14,999 | 0 (0.0%) | 0 (0.0%) |
| $15,000 to $17,499 | 26 (4.1%) | 0 (0.0%) |
| $17,500 to $19,999 | 0 (0.0%) | 6 (0.8%) |
| $20,000 to $22,499 | 15 (2.4%) | 0 (0.0%) |
| $22,500 to $24,999 | 35 (5.6%) | 16 (2.2%) |
| $25,000 to $29,999 | 0 (0.0%) | 189 (26.5%) |
| $30,000 to $34,999 | 23 (3.7%) | 10 (1.4%) |
| $35,000 to $39,999 | 14 (2.2%) | 0 (0.0%) |
| $40,000 to $44,999 | 8 (1.3%) | 12 (1.7%) |
| $45,000 to $49,999 | 15 (2.4%) | 9 (1.3%) |
| $50,000 to $54,999 | 0 (0.0%) | 0 (0.0%) |
| $55,000 to $64,999 | 58 (9.2%) | 82 (11.5%) |
| $65,000 to $74,999 | 0 (0.0%) | 0 (0.0%) |
| $75,000 to $99,999 | 81 (12.9%) | 54 (7.6%) |
| $100,000+ | 130 (20.7%) | 54 (7.6%) |
| Total | 629 (100.0%) | 712 (100.0%) |
Earnings by Sex by Educational Attainment in Hide A Way Lake
Average earnings in Hide A Way Lake are $49,333 for men and $25,898 for women, a difference of 47.5%. Men with an educational attainment of graduate degree enjoy the highest average annual earnings of $173,075, while those with college or associate's degree education earn the least with $24,536. Women with an educational attainment of bachelor's degree earn the most with the average annual earnings of $85,417, while those with high school diploma education have the smallest earnings of $25,363.
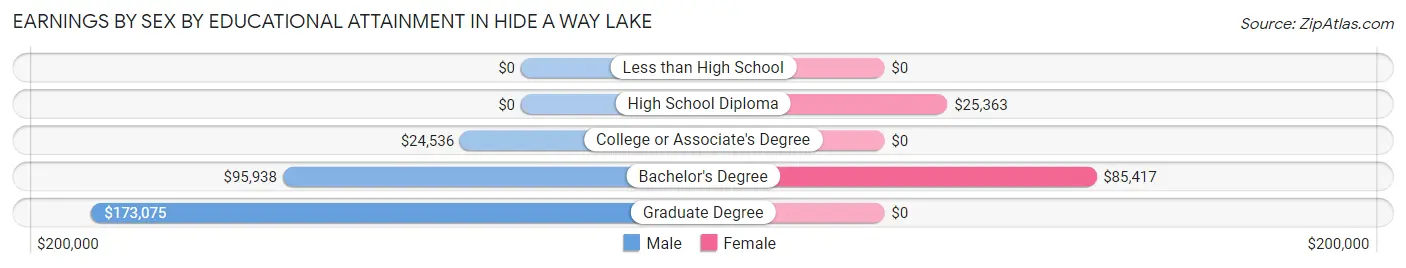
| Educational Attainment | Male Income | Female Income |
| Less than High School | - | - |
| High School Diploma | - | - |
| College or Associate's Degree | $24,536 | $0 |
| Bachelor's Degree | $95,938 | $85,417 |
| Graduate Degree | $173,075 | $0 |
| Total | $49,333 | $25,898 |
Family Income in Hide A Way Lake
Family Income Brackets in Hide A Way Lake
According to the Hide A Way Lake family income data, there are 152 families falling into the $100,000 to $149,999 income range, which is the most common income bracket and makes up 25.1% of all families.
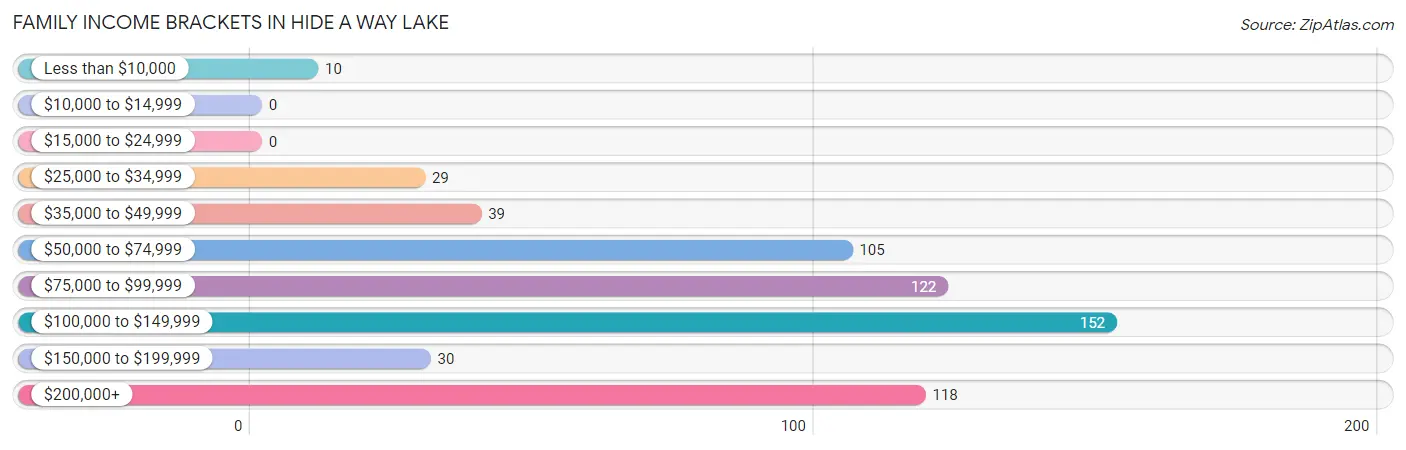
| Income Bracket | # Families | % Families |
| Less than $10,000 | 10 | 1.7% |
| $10,000 to $14,999 | 0 | 0.0% |
| $15,000 to $24,999 | 0 | 0.0% |
| $25,000 to $34,999 | 29 | 4.8% |
| $35,000 to $49,999 | 39 | 6.4% |
| $50,000 to $74,999 | 105 | 17.4% |
| $75,000 to $99,999 | 122 | 20.2% |
| $100,000 to $149,999 | 152 | 25.1% |
| $150,000 to $199,999 | 30 | 5.0% |
| $200,000+ | 118 | 19.5% |
Family Income by Famaliy Size in Hide A Way Lake
3-person families (157 | 26.0%) account for the highest median family income in Hide A Way Lake with $122,228 per family, while 2-person families (369 | 61.0%) have the highest median income of $55,194 per family member.
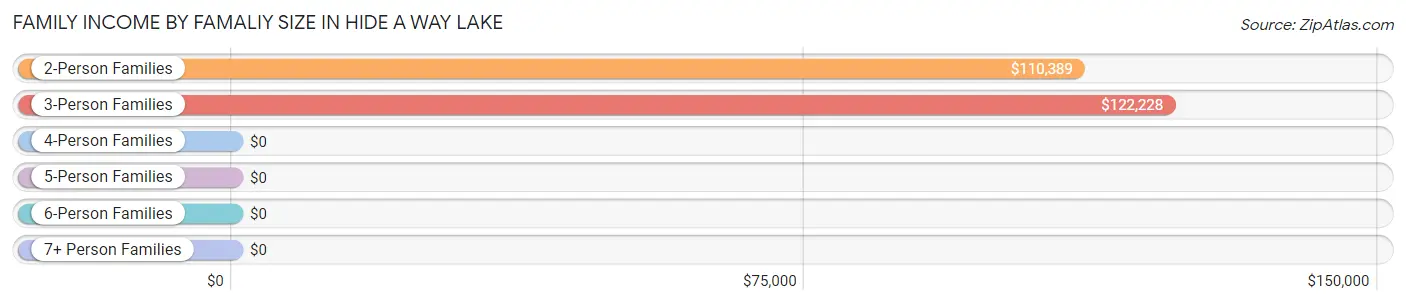
| Income Bracket | # Families | Median Income |
| 2-Person Families | 369 (61.0%) | $110,389 |
| 3-Person Families | 157 (26.0%) | $122,228 |
| 4-Person Families | 14 (2.3%) | $0 |
| 5-Person Families | 58 (9.6%) | $0 |
| 6-Person Families | 0 (0.0%) | $0 |
| 7+ Person Families | 7 (1.2%) | $0 |
| Total | 605 (100.0%) | $92,428 |
Family Income by Number of Earners in Hide A Way Lake
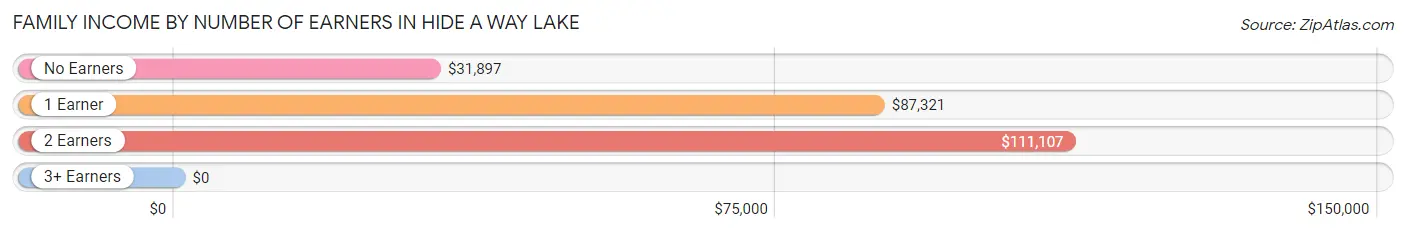
| Number of Earners | # Families | Median Income |
| No Earners | 64 (10.6%) | $31,897 |
| 1 Earner | 123 (20.3%) | $87,321 |
| 2 Earners | 362 (59.8%) | $111,107 |
| 3+ Earners | 56 (9.3%) | $0 |
| Total | 605 (100.0%) | $92,428 |
Household Income in Hide A Way Lake
Household Income Brackets in Hide A Way Lake
With 150 households falling in the category, the $100,000 to $149,999 income range is the most frequent in Hide A Way Lake, accounting for 16.6% of all households. In contrast, only 18 households (2.0%) fall into the less than $10,000 income bracket, making it the least populous group.
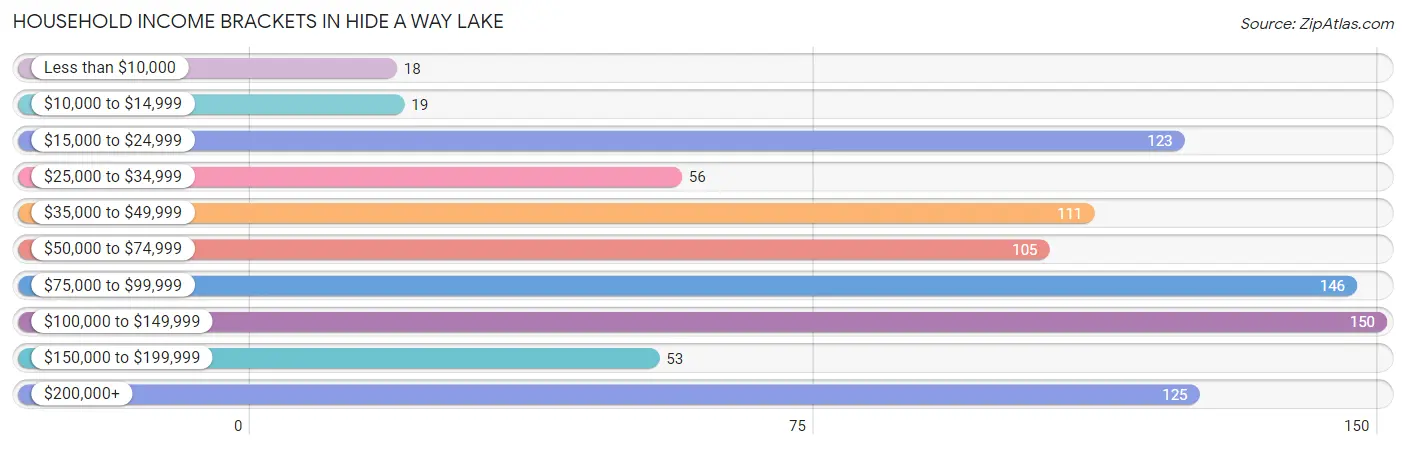
| Income Bracket | # Households | % Households |
| Less than $10,000 | 18 | 2.0% |
| $10,000 to $14,999 | 19 | 2.1% |
| $15,000 to $24,999 | 123 | 13.6% |
| $25,000 to $34,999 | 56 | 6.2% |
| $35,000 to $49,999 | 111 | 12.3% |
| $50,000 to $74,999 | 105 | 11.6% |
| $75,000 to $99,999 | 146 | 16.1% |
| $100,000 to $149,999 | 150 | 16.6% |
| $150,000 to $199,999 | 53 | 5.8% |
| $200,000+ | 125 | 13.8% |
Household Income by Householder Age in Hide A Way Lake
The median household income in Hide A Way Lake is $78,529, with the highest median household income of $100,595 found in the 45 to 64 years age bracket for the primary householder. A total of 240 households (26.5%) fall into this category.
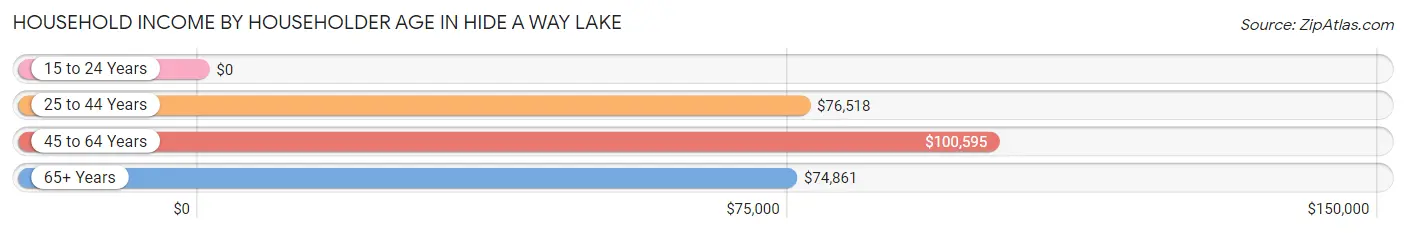
| Income Bracket | # Households | Median Income |
| 15 to 24 Years | 0 (0.0%) | $0 |
| 25 to 44 Years | 133 (14.7%) | $76,518 |
| 45 to 64 Years | 240 (26.5%) | $100,595 |
| 65+ Years | 533 (58.8%) | $74,861 |
| Total | 906 (100.0%) | $78,529 |
Poverty in Hide A Way Lake
Income Below Poverty by Sex and Age in Hide A Way Lake
With 1.0% poverty level for males and 5.3% for females among the residents of Hide A Way Lake, 55 to 64 year old males and 12 to 14 year old females are the most vulnerable to poverty, with 10 males (13.7%) and 13 females (100.0%) in their respective age groups living below the poverty level.
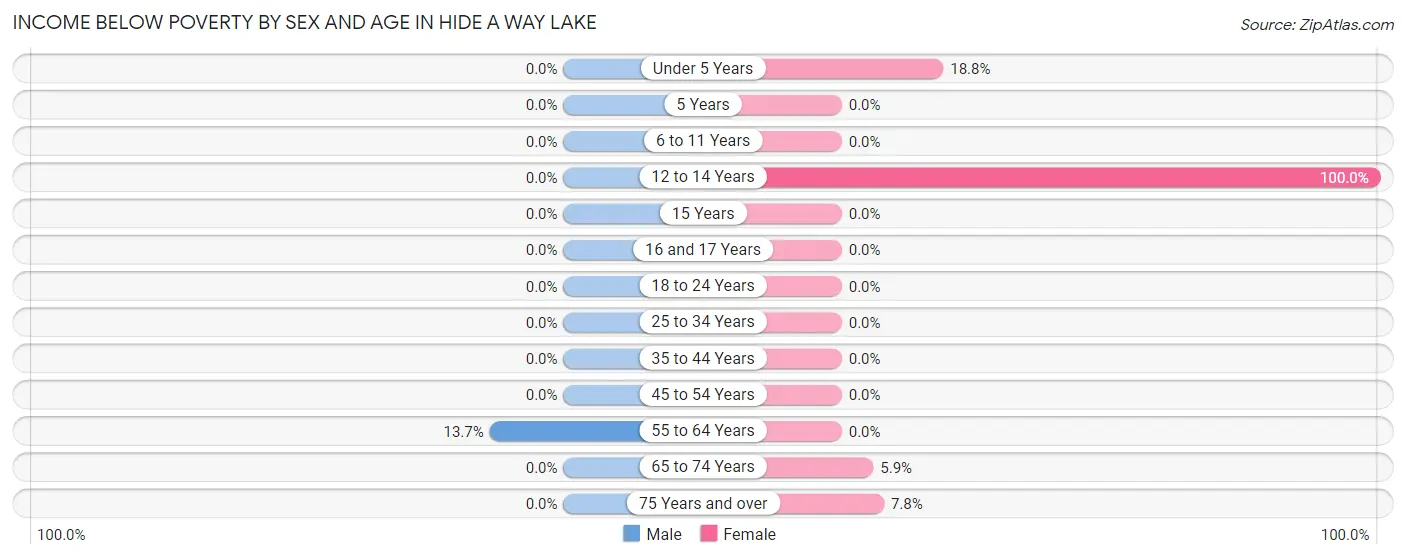
| Age Bracket | Male | Female |
| Under 5 Years | 0 (0.0%) | 13 (18.8%) |
| 5 Years | 0 (0.0%) | 0 (0.0%) |
| 6 to 11 Years | 0 (0.0%) | 0 (0.0%) |
| 12 to 14 Years | 0 (0.0%) | 13 (100.0%) |
| 15 Years | 0 (0.0%) | 0 (0.0%) |
| 16 and 17 Years | 0 (0.0%) | 0 (0.0%) |
| 18 to 24 Years | 0 (0.0%) | 0 (0.0%) |
| 25 to 34 Years | 0 (0.0%) | 0 (0.0%) |
| 35 to 44 Years | 0 (0.0%) | 0 (0.0%) |
| 45 to 54 Years | 0 (0.0%) | 0 (0.0%) |
| 55 to 64 Years | 10 (13.7%) | 0 (0.0%) |
| 65 to 74 Years | 0 (0.0%) | 19 (5.9%) |
| 75 Years and over | 0 (0.0%) | 18 (7.8%) |
| Total | 10 (1.0%) | 63 (5.3%) |
Income Above Poverty by Sex and Age in Hide A Way Lake
According to the poverty statistics in Hide A Way Lake, males aged under 5 years and females aged 6 to 11 years are the age groups that are most secure financially, with 100.0% of males and 100.0% of females in these age groups living above the poverty line.
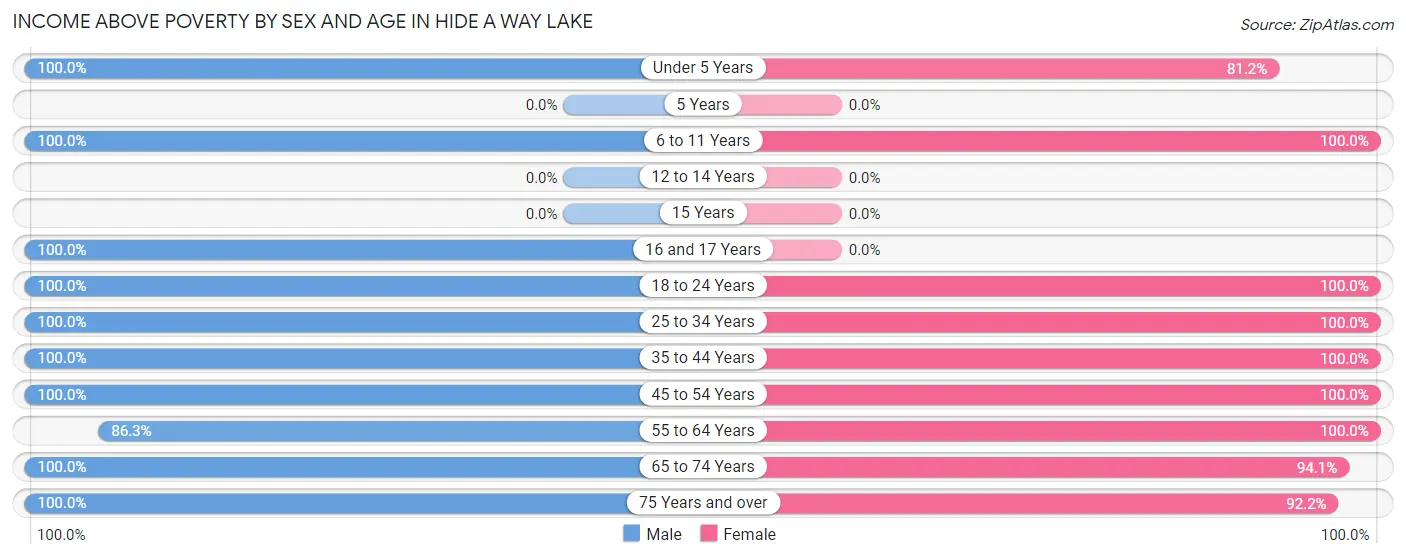
| Age Bracket | Male | Female |
| Under 5 Years | 23 (100.0%) | 56 (81.2%) |
| 5 Years | 0 (0.0%) | 0 (0.0%) |
| 6 to 11 Years | 107 (100.0%) | 18 (100.0%) |
| 12 to 14 Years | 0 (0.0%) | 0 (0.0%) |
| 15 Years | 0 (0.0%) | 0 (0.0%) |
| 16 and 17 Years | 16 (100.0%) | 0 (0.0%) |
| 18 to 24 Years | 145 (100.0%) | 48 (100.0%) |
| 25 to 34 Years | 216 (100.0%) | 124 (100.0%) |
| 35 to 44 Years | 52 (100.0%) | 101 (100.0%) |
| 45 to 54 Years | 88 (100.0%) | 114 (100.0%) |
| 55 to 64 Years | 63 (86.3%) | 143 (100.0%) |
| 65 to 74 Years | 143 (100.0%) | 305 (94.1%) |
| 75 Years and over | 147 (100.0%) | 212 (92.2%) |
| Total | 1,000 (99.0%) | 1,121 (94.7%) |
Income Below Poverty Among Married-Couple Families in Hide A Way Lake
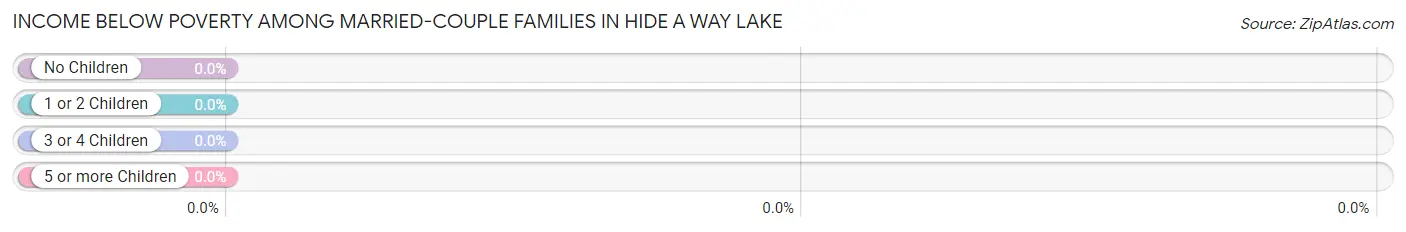
| Children | Above Poverty | Below Poverty |
| No Children | 393 (100.0%) | 0 (0.0%) |
| 1 or 2 Children | 14 (100.0%) | 0 (0.0%) |
| 3 or 4 Children | 65 (100.0%) | 0 (0.0%) |
| 5 or more Children | 0 (0.0%) | 0 (0.0%) |
| Total | 472 (100.0%) | 0 (0.0%) |
Income Below Poverty Among Single-Parent Households in Hide A Way Lake
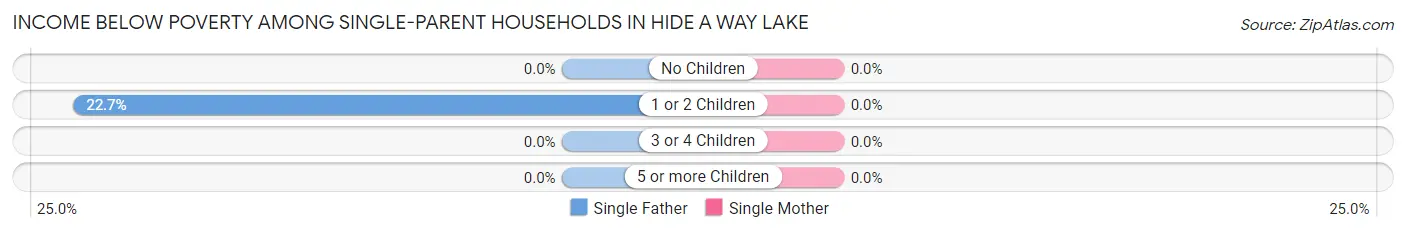
| Children | Single Father | Single Mother |
| No Children | 0 (0.0%) | 0 (0.0%) |
| 1 or 2 Children | 10 (22.7%) | 0 (0.0%) |
| 3 or 4 Children | 0 (0.0%) | 0 (0.0%) |
| 5 or more Children | 0 (0.0%) | 0 (0.0%) |
| Total | 10 (11.4%) | 0 (0.0%) |
Income Below Poverty Among Married-Couple vs Single-Parent Households in Hide A Way Lake
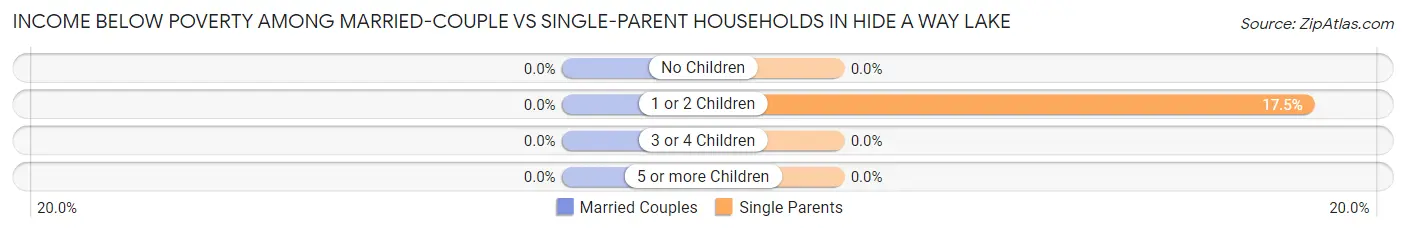
| Children | Married-Couple Families | Single-Parent Households |
| No Children | 0 (0.0%) | 0 (0.0%) |
| 1 or 2 Children | 0 (0.0%) | 10 (17.5%) |
| 3 or 4 Children | 0 (0.0%) | 0 (0.0%) |
| 5 or more Children | 0 (0.0%) | 0 (0.0%) |
| Total | 0 (0.0%) | 10 (7.5%) |
Employment Characteristics in Hide A Way Lake
Employment by Class of Employer in Hide A Way Lake
Among the 1,071 employed individuals in Hide A Way Lake, private company employees (854 | 79.7%), not-for-profit organizations (73 | 6.8%), and federal government employees (65 | 6.1%) make up the most common classes of employment.
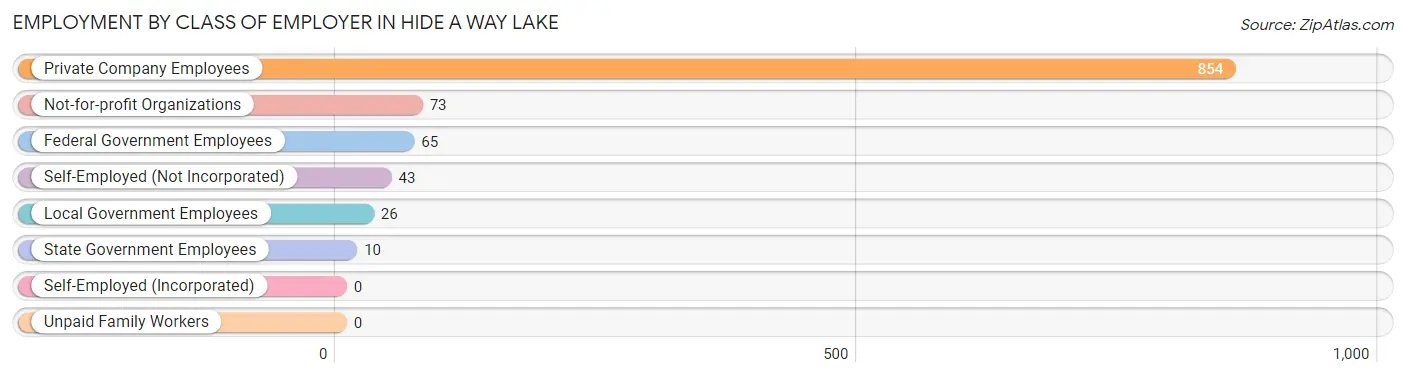
| Employer Class | # Employees | % Employees |
| Private Company Employees | 854 | 79.7% |
| Self-Employed (Incorporated) | 0 | 0.0% |
| Self-Employed (Not Incorporated) | 43 | 4.0% |
| Not-for-profit Organizations | 73 | 6.8% |
| Local Government Employees | 26 | 2.4% |
| State Government Employees | 10 | 0.9% |
| Federal Government Employees | 65 | 6.1% |
| Unpaid Family Workers | 0 | 0.0% |
| Total | 1,071 | 100.0% |
Employment Status by Age in Hide A Way Lake
According to the labor force statistics for Hide A Way Lake, out of the total population over 16 years of age (1,964), 66.8% or 1,312 individuals are in the labor force, with 10.1% or 133 of them unemployed. The age group with the highest labor force participation rate is 25 to 29 years, with 100.0% or 201 individuals in the labor force. Within the labor force, the 20 to 24 years age range has the highest percentage of unemployed individuals, with 70.5% or 31 of them being unemployed.
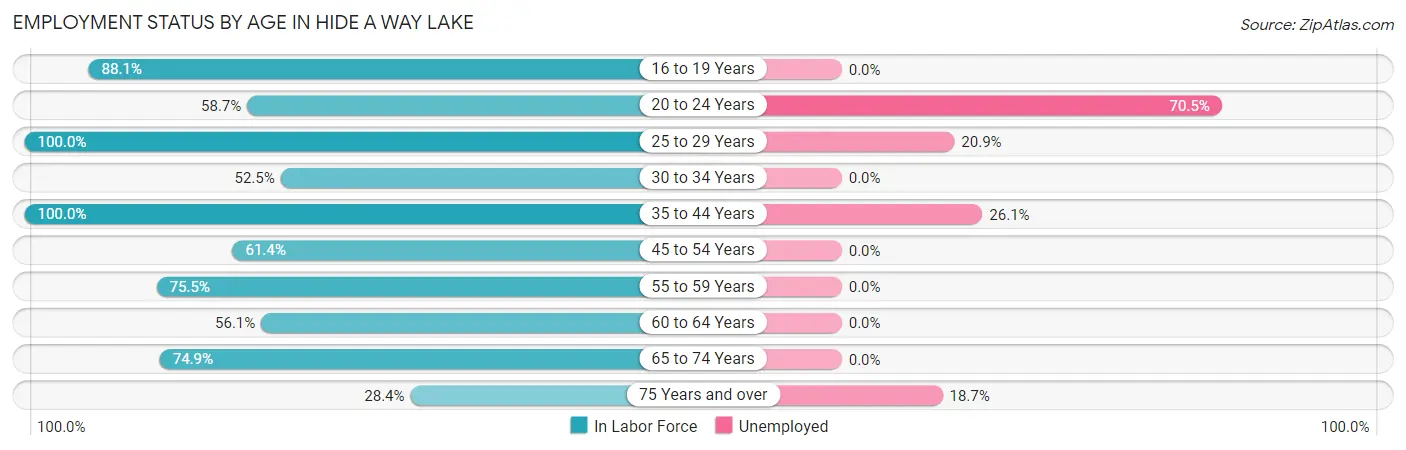
| Age Bracket | In Labor Force | Unemployed |
| 16 to 19 Years | 118 (88.1%) | 0 (0.0%) |
| 20 to 24 Years | 44 (58.7%) | 31 (70.5%) |
| 25 to 29 Years | 201 (100.0%) | 42 (20.9%) |
| 30 to 34 Years | 73 (52.5%) | 0 (0.0%) |
| 35 to 44 Years | 153 (100.0%) | 40 (26.1%) |
| 45 to 54 Years | 124 (61.4%) | 0 (0.0%) |
| 55 to 59 Years | 77 (75.5%) | 0 (0.0%) |
| 60 to 64 Years | 64 (56.1%) | 0 (0.0%) |
| 65 to 74 Years | 350 (74.9%) | 0 (0.0%) |
| 75 Years and over | 107 (28.4%) | 20 (18.7%) |
| Total | 1,312 (66.8%) | 133 (10.1%) |
Employment Status by Educational Attainment in Hide A Way Lake
According to labor force statistics for Hide A Way Lake, 76.0% of individuals (692) out of the total population between 25 and 64 years of age (911) are in the labor force, with 11.8% or 82 of them being unemployed. The group with the highest labor force participation rate are those with the educational attainment of bachelor's degree or higher, with 86.9% or 166 individuals in the labor force. Within the labor force, individuals with college / associate degree education have the highest percentage of unemployment, with 24.2% or 56 of them being unemployed.
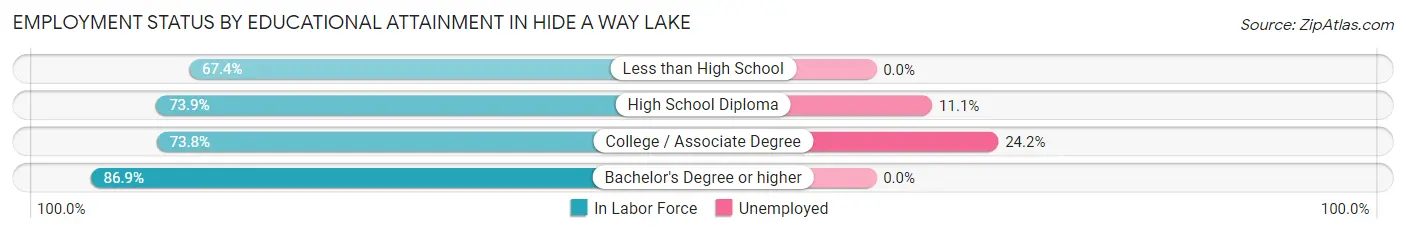
| Educational Attainment | In Labor Force | Unemployed |
| Less than High School | 60 (67.4%) | 0 (0.0%) |
| High School Diploma | 235 (73.9%) | 35 (11.1%) |
| College / Associate Degree | 231 (73.8%) | 76 (24.2%) |
| Bachelor's Degree or higher | 166 (86.9%) | 0 (0.0%) |
| Total | 692 (76.0%) | 107 (11.8%) |
Employment Occupations by Sex in Hide A Way Lake
Management, Business, Science and Arts Occupations
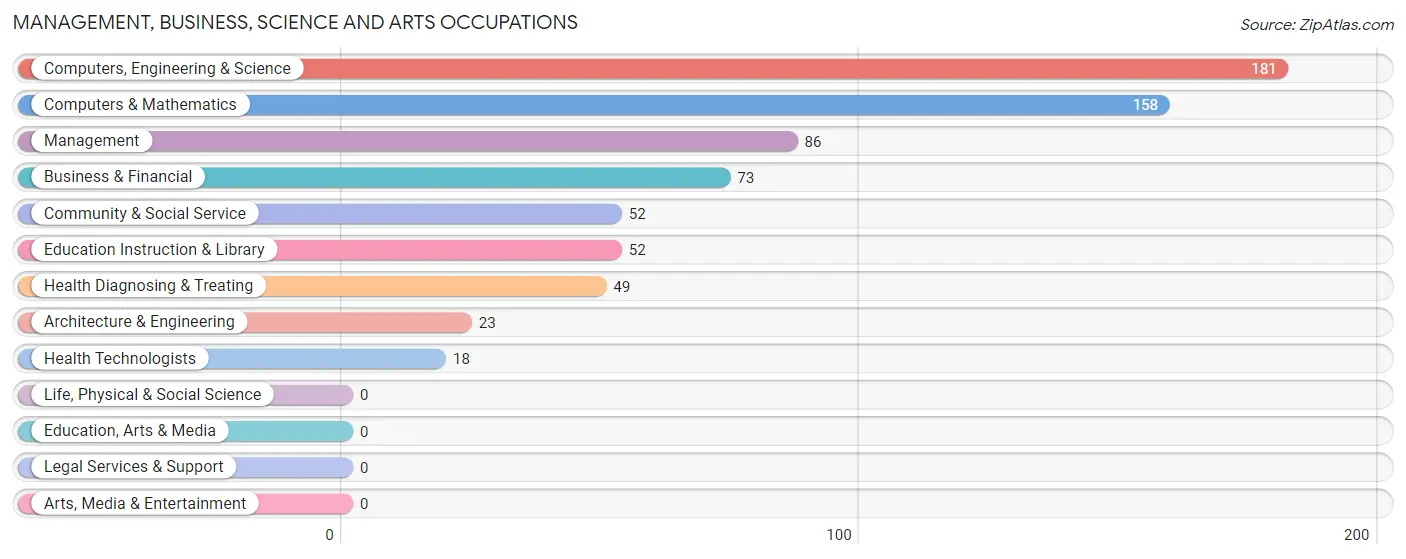
The most common Management, Business, Science and Arts occupations in Hide A Way Lake are Computers, Engineering & Science (181 | 15.4%), Computers & Mathematics (158 | 13.4%), Management (86 | 7.3%), Business & Financial (73 | 6.2%), and Community & Social Service (52 | 4.4%).
Management, Business, Science and Arts Occupations by Sex
Within the Management, Business, Science and Arts occupations in Hide A Way Lake, the most male-oriented occupations are Health Technologists (66.7%), Computers & Mathematics (60.8%), and Computers, Engineering & Science (53.0%), while the most female-oriented occupations are Business & Financial (100.0%), Architecture & Engineering (100.0%), and Community & Social Service (100.0%).
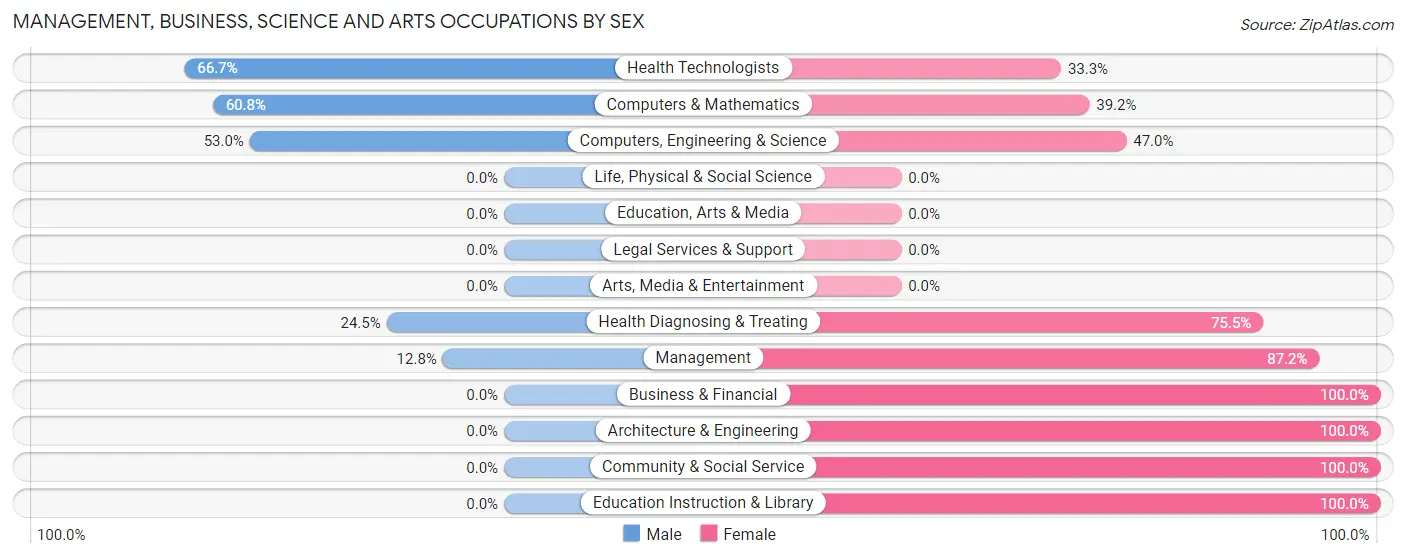
| Occupation | Male | Female |
| Management | 11 (12.8%) | 75 (87.2%) |
| Business & Financial | 0 (0.0%) | 73 (100.0%) |
| Computers, Engineering & Science | 96 (53.0%) | 85 (47.0%) |
| Computers & Mathematics | 96 (60.8%) | 62 (39.2%) |
| Architecture & Engineering | 0 (0.0%) | 23 (100.0%) |
| Life, Physical & Social Science | 0 (0.0%) | 0 (0.0%) |
| Community & Social Service | 0 (0.0%) | 52 (100.0%) |
| Education, Arts & Media | 0 (0.0%) | 0 (0.0%) |
| Legal Services & Support | 0 (0.0%) | 0 (0.0%) |
| Education Instruction & Library | 0 (0.0%) | 52 (100.0%) |
| Arts, Media & Entertainment | 0 (0.0%) | 0 (0.0%) |
| Health Diagnosing & Treating | 12 (24.5%) | 37 (75.5%) |
| Health Technologists | 12 (66.7%) | 6 (33.3%) |
| Total (Category) | 119 (27.0%) | 322 (73.0%) |
| Total (Overall) | 532 (45.2%) | 646 (54.8%) |
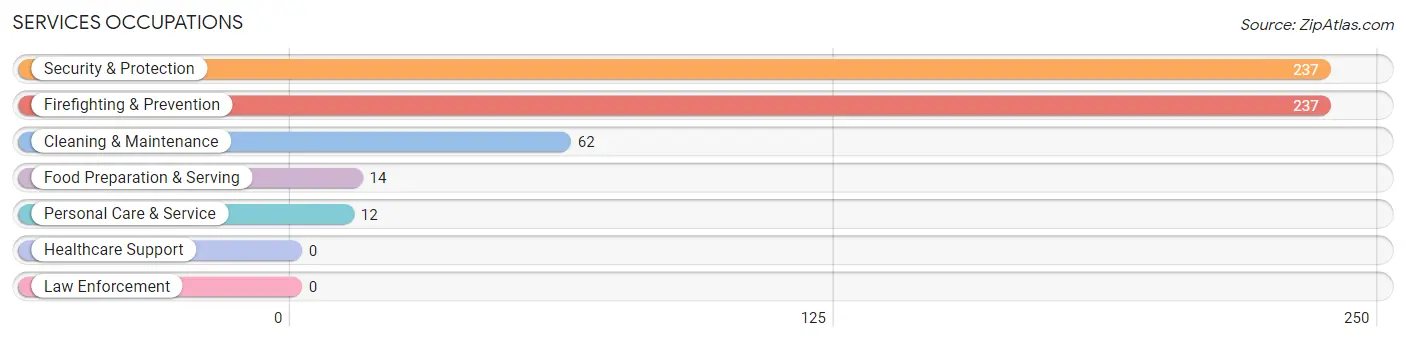
Services Occupations
The most common Services occupations in Hide A Way Lake are Security & Protection (237 | 20.1%), Firefighting & Prevention (237 | 20.1%), Cleaning & Maintenance (62 | 5.3%), Food Preparation & Serving (14 | 1.2%), and Personal Care & Service (12 | 1.0%).
Services Occupations by Sex
Within the Services occupations in Hide A Way Lake, the most male-oriented occupations are Food Preparation & Serving (100.0%), Personal Care & Service (100.0%), and Security & Protection (36.7%), while the most female-oriented occupations are Cleaning & Maintenance (75.8%), Security & Protection (63.3%), and Firefighting & Prevention (63.3%).
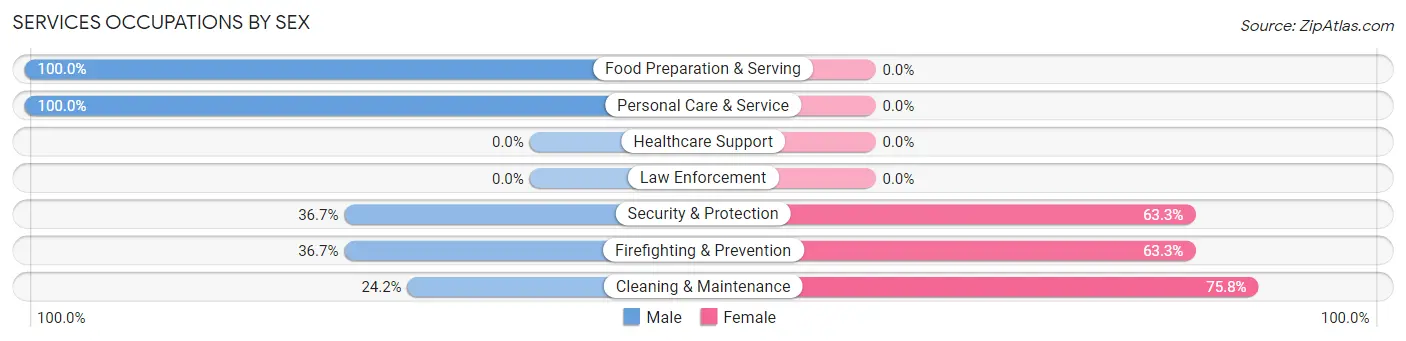
| Occupation | Male | Female |
| Healthcare Support | 0 (0.0%) | 0 (0.0%) |
| Security & Protection | 87 (36.7%) | 150 (63.3%) |
| Firefighting & Prevention | 87 (36.7%) | 150 (63.3%) |
| Law Enforcement | 0 (0.0%) | 0 (0.0%) |
| Food Preparation & Serving | 14 (100.0%) | 0 (0.0%) |
| Cleaning & Maintenance | 15 (24.2%) | 47 (75.8%) |
| Personal Care & Service | 12 (100.0%) | 0 (0.0%) |
| Total (Category) | 128 (39.4%) | 197 (60.6%) |
| Total (Overall) | 532 (45.2%) | 646 (54.8%) |
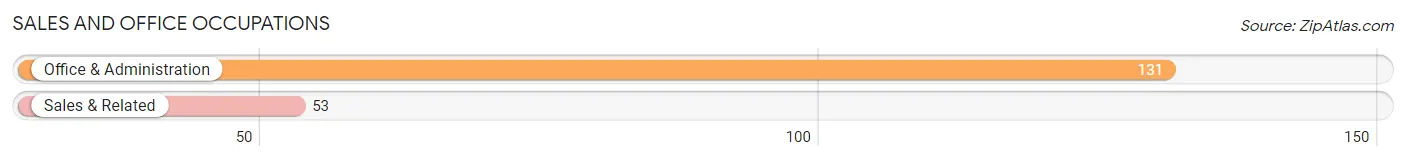
Sales and Office Occupations
The most common Sales and Office occupations in Hide A Way Lake are Office & Administration (131 | 11.1%), and Sales & Related (53 | 4.5%).
Sales and Office Occupations by Sex
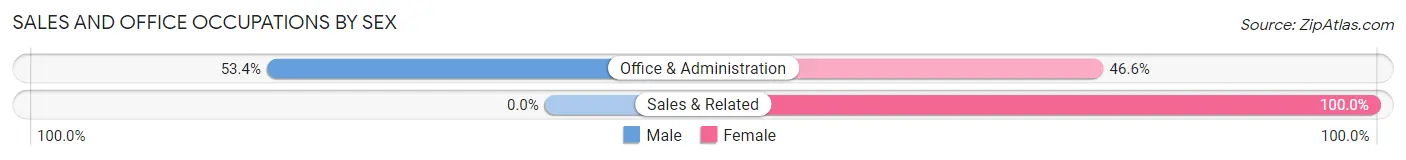
| Occupation | Male | Female |
| Sales & Related | 0 (0.0%) | 53 (100.0%) |
| Office & Administration | 70 (53.4%) | 61 (46.6%) |
| Total (Category) | 70 (38.0%) | 114 (62.0%) |
| Total (Overall) | 532 (45.2%) | 646 (54.8%) |
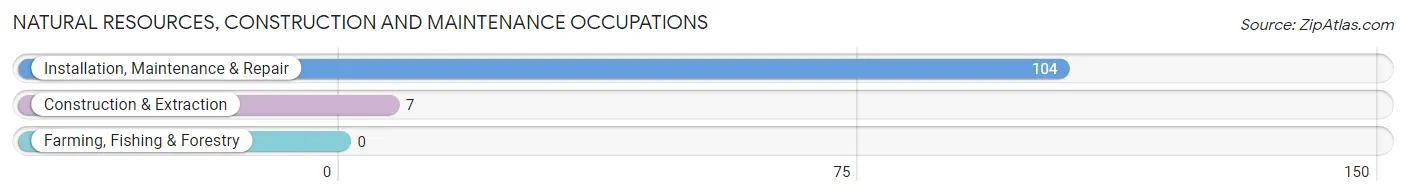
Natural Resources, Construction and Maintenance Occupations
The most common Natural Resources, Construction and Maintenance occupations in Hide A Way Lake are Installation, Maintenance & Repair (104 | 8.8%), and Construction & Extraction (7 | 0.6%).
Natural Resources, Construction and Maintenance Occupations by Sex
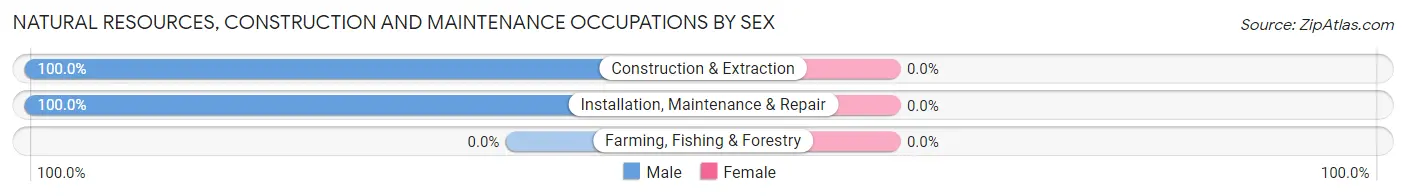
| Occupation | Male | Female |
| Farming, Fishing & Forestry | 0 (0.0%) | 0 (0.0%) |
| Construction & Extraction | 7 (100.0%) | 0 (0.0%) |
| Installation, Maintenance & Repair | 104 (100.0%) | 0 (0.0%) |
| Total (Category) | 111 (100.0%) | 0 (0.0%) |
| Total (Overall) | 532 (45.2%) | 646 (54.8%) |
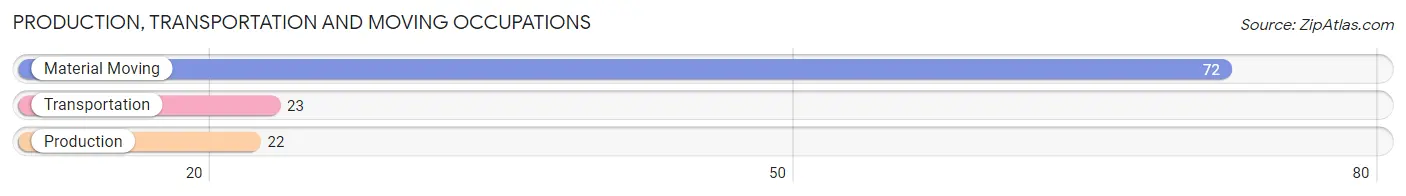
Production, Transportation and Moving Occupations
The most common Production, Transportation and Moving occupations in Hide A Way Lake are Material Moving (72 | 6.1%), Transportation (23 | 1.9%), and Production (22 | 1.9%).
Production, Transportation and Moving Occupations by Sex
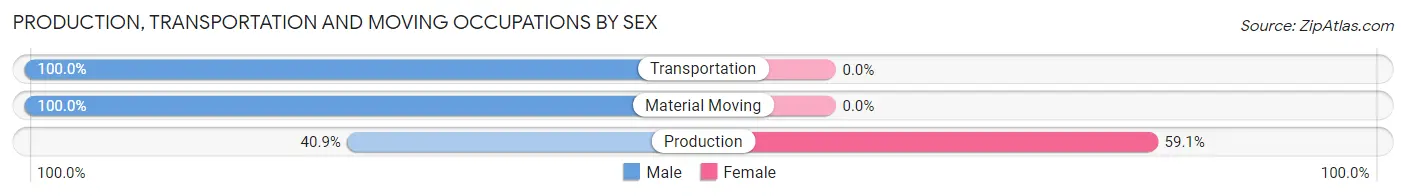
| Occupation | Male | Female |
| Production | 9 (40.9%) | 13 (59.1%) |
| Transportation | 23 (100.0%) | 0 (0.0%) |
| Material Moving | 72 (100.0%) | 0 (0.0%) |
| Total (Category) | 104 (88.9%) | 13 (11.1%) |
| Total (Overall) | 532 (45.2%) | 646 (54.8%) |
Employment Industries by Sex in Hide A Way Lake
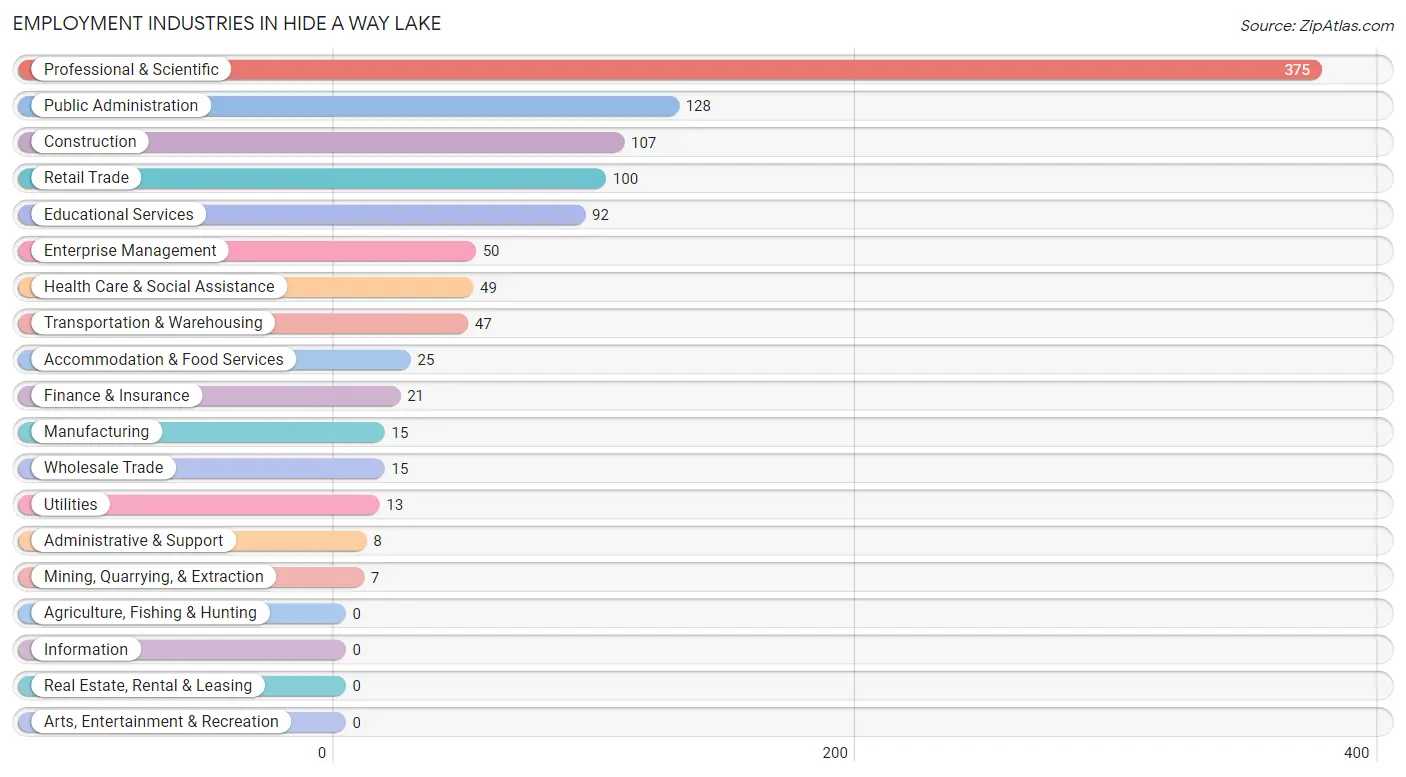
Employment Industries in Hide A Way Lake
The major employment industries in Hide A Way Lake include Professional & Scientific (375 | 31.8%), Public Administration (128 | 10.9%), Construction (107 | 9.1%), Retail Trade (100 | 8.5%), and Educational Services (92 | 7.8%).
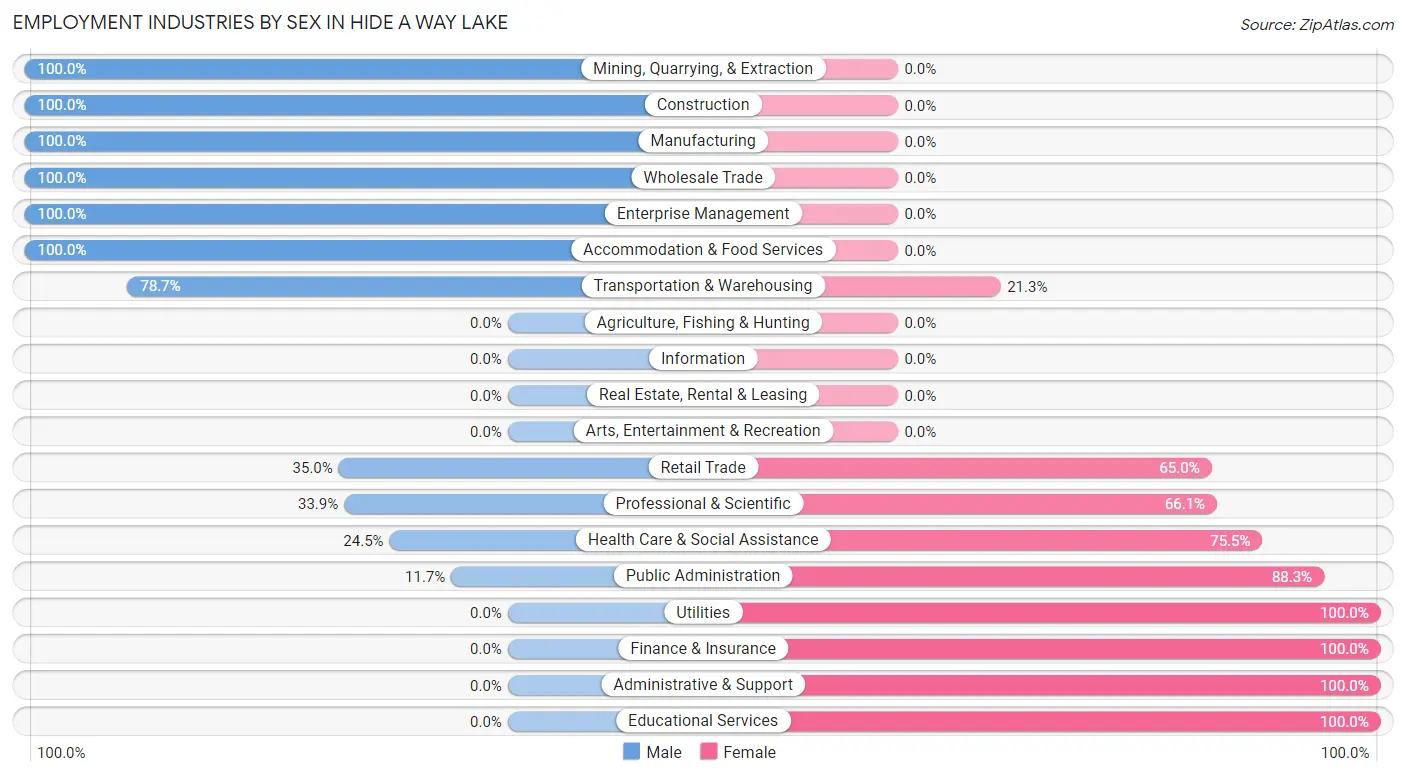
Employment Industries by Sex in Hide A Way Lake
The Hide A Way Lake industries that see more men than women are Mining, Quarrying, & Extraction (100.0%), Construction (100.0%), and Manufacturing (100.0%), whereas the industries that tend to have a higher number of women are Utilities (100.0%), Finance & Insurance (100.0%), and Administrative & Support (100.0%).
| Industry | Male | Female |
| Agriculture, Fishing & Hunting | 0 (0.0%) | 0 (0.0%) |
| Mining, Quarrying, & Extraction | 7 (100.0%) | 0 (0.0%) |
| Construction | 107 (100.0%) | 0 (0.0%) |
| Manufacturing | 15 (100.0%) | 0 (0.0%) |
| Wholesale Trade | 15 (100.0%) | 0 (0.0%) |
| Retail Trade | 35 (35.0%) | 65 (65.0%) |
| Transportation & Warehousing | 37 (78.7%) | 10 (21.3%) |
| Utilities | 0 (0.0%) | 13 (100.0%) |
| Information | 0 (0.0%) | 0 (0.0%) |
| Finance & Insurance | 0 (0.0%) | 21 (100.0%) |
| Real Estate, Rental & Leasing | 0 (0.0%) | 0 (0.0%) |
| Professional & Scientific | 127 (33.9%) | 248 (66.1%) |
| Enterprise Management | 50 (100.0%) | 0 (0.0%) |
| Administrative & Support | 0 (0.0%) | 8 (100.0%) |
| Educational Services | 0 (0.0%) | 92 (100.0%) |
| Health Care & Social Assistance | 12 (24.5%) | 37 (75.5%) |
| Arts, Entertainment & Recreation | 0 (0.0%) | 0 (0.0%) |
| Accommodation & Food Services | 25 (100.0%) | 0 (0.0%) |
| Public Administration | 15 (11.7%) | 113 (88.3%) |
| Total | 532 (45.2%) | 646 (54.8%) |
Education in Hide A Way Lake
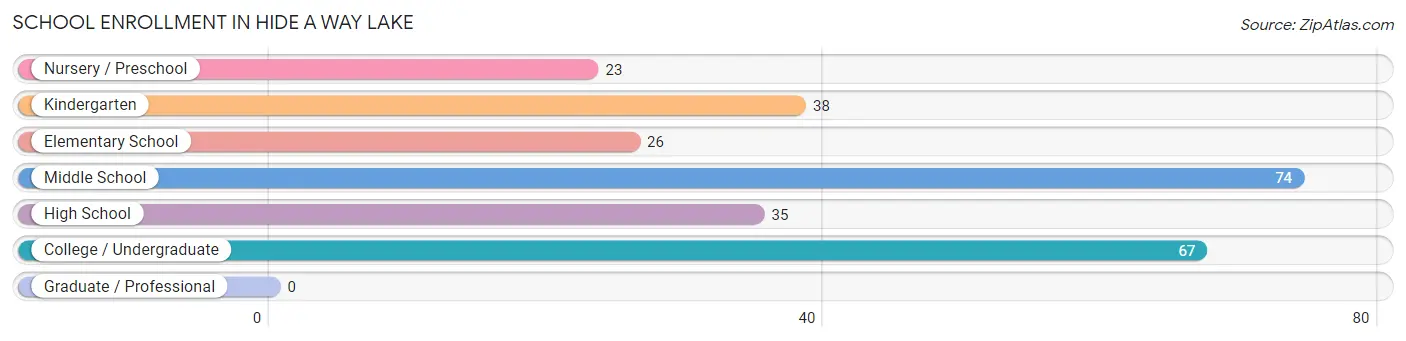
School Enrollment in Hide A Way Lake
The most common levels of schooling among the 263 students in Hide A Way Lake are middle school (74 | 28.1%), college / undergraduate (67 | 25.5%), and kindergarten (38 | 14.4%).
| School Level | # Students | % Students |
| Nursery / Preschool | 23 | 8.7% |
| Kindergarten | 38 | 14.4% |
| Elementary School | 26 | 9.9% |
| Middle School | 74 | 28.1% |
| High School | 35 | 13.3% |
| College / Undergraduate | 67 | 25.5% |
| Graduate / Professional | 0 | 0.0% |
| Total | 263 | 100.0% |
School Enrollment by Age by Funding Source in Hide A Way Lake
Out of a total of 263 students who are enrolled in schools in Hide A Way Lake, 122 (46.4%) attend a private institution, while the remaining 141 (53.6%) are enrolled in public schools. The age group of 3 to 4 year olds has the highest likelihood of being enrolled in private schools, with 23 (100.0% in the age bracket) enrolled. Conversely, the age group of 15 to 17 year olds has the lowest likelihood of being enrolled in a private school, with 16 (100.0% in the age bracket) attending a public institution.
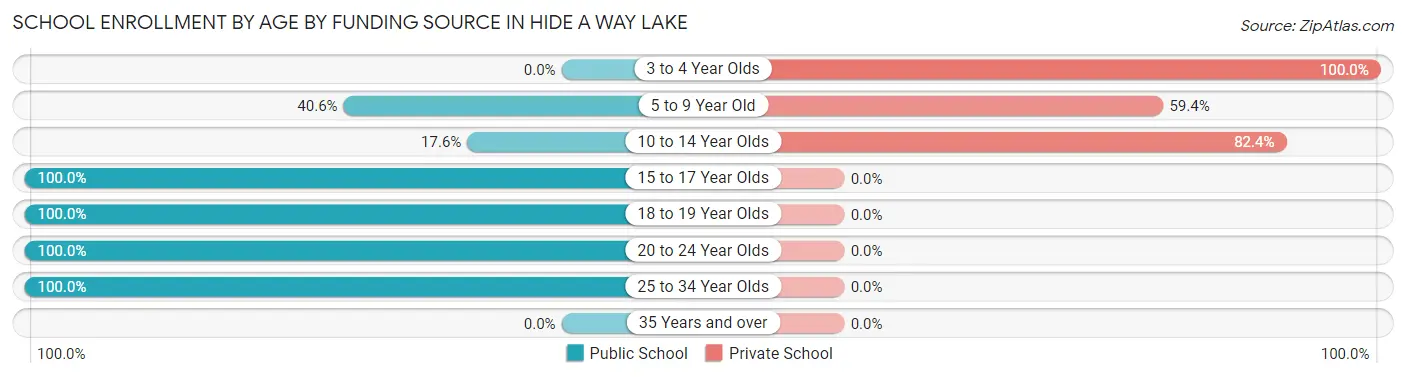
| Age Bracket | Public School | Private School |
| 3 to 4 Year Olds | 0 (0.0%) | 23 (100.0%) |
| 5 to 9 Year Old | 26 (40.6%) | 38 (59.4%) |
| 10 to 14 Year Olds | 13 (17.6%) | 61 (82.4%) |
| 15 to 17 Year Olds | 16 (100.0%) | 0 (0.0%) |
| 18 to 19 Year Olds | 35 (100.0%) | 0 (0.0%) |
| 20 to 24 Year Olds | 31 (100.0%) | 0 (0.0%) |
| 25 to 34 Year Olds | 20 (100.0%) | 0 (0.0%) |
| 35 Years and over | 0 (0.0%) | 0 (0.0%) |
| Total | 141 (53.6%) | 122 (46.4%) |
Educational Attainment by Field of Study in Hide A Way Lake
Engineering (110 | 23.8%), business (94 | 20.3%), multidisciplinary studies (62 | 13.4%), education (46 | 9.9%), and computers & mathematics (36 | 7.8%) are the most common fields of study among 463 individuals in Hide A Way Lake who have obtained a bachelor's degree or higher.
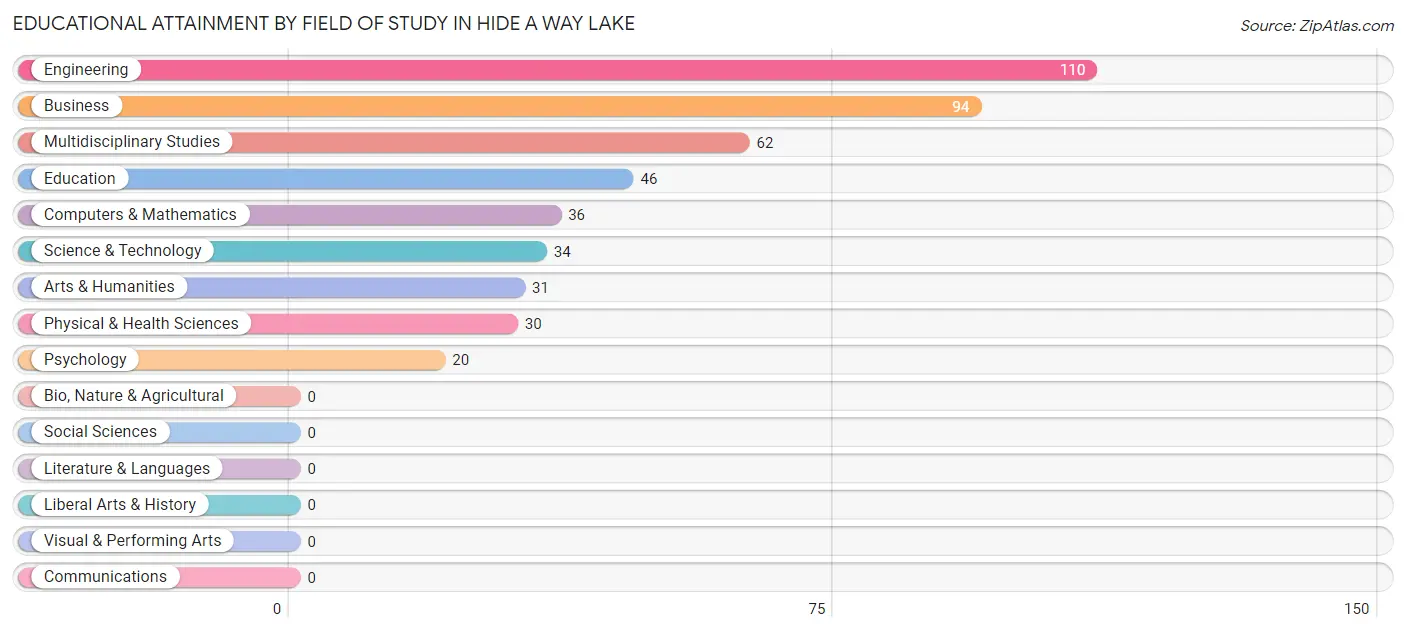
| Field of Study | # Graduates | % Graduates |
| Computers & Mathematics | 36 | 7.8% |
| Bio, Nature & Agricultural | 0 | 0.0% |
| Physical & Health Sciences | 30 | 6.5% |
| Psychology | 20 | 4.3% |
| Social Sciences | 0 | 0.0% |
| Engineering | 110 | 23.8% |
| Multidisciplinary Studies | 62 | 13.4% |
| Science & Technology | 34 | 7.3% |
| Business | 94 | 20.3% |
| Education | 46 | 9.9% |
| Literature & Languages | 0 | 0.0% |
| Liberal Arts & History | 0 | 0.0% |
| Visual & Performing Arts | 0 | 0.0% |
| Communications | 0 | 0.0% |
| Arts & Humanities | 31 | 6.7% |
| Total | 463 | 100.0% |
Transportation & Commute in Hide A Way Lake
Vehicle Availability by Sex in Hide A Way Lake
The most prevalent vehicle ownership categories in Hide A Way Lake are males with 2 vehicles (279, accounting for 52.4%) and females with 2 vehicles (310, making up 51.8%).
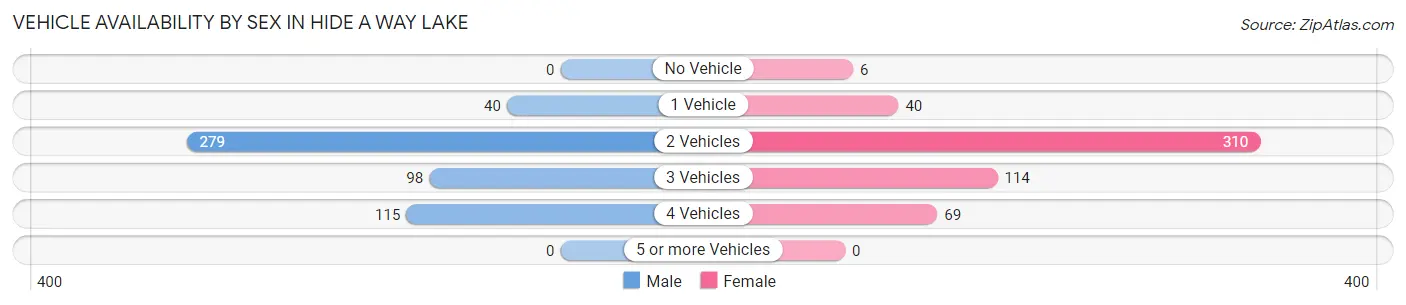
| Vehicles Available | Male | Female |
| No Vehicle | 0 (0.0%) | 6 (1.1%) |
| 1 Vehicle | 40 (7.5%) | 40 (7.4%) |
| 2 Vehicles | 279 (52.4%) | 310 (57.5%) |
| 3 Vehicles | 98 (18.4%) | 114 (21.1%) |
| 4 Vehicles | 115 (21.6%) | 69 (12.8%) |
| 5 or more Vehicles | 0 (0.0%) | 0 (0.0%) |
| Total | 532 (100.0%) | 539 (100.0%) |
Commute Time in Hide A Way Lake
The most frequently occuring commute durations in Hide A Way Lake are 20 to 24 minutes (250 commuters, 27.9%), 60 to 89 minutes (182 commuters, 20.3%), and 15 to 19 minutes (144 commuters, 16.1%).
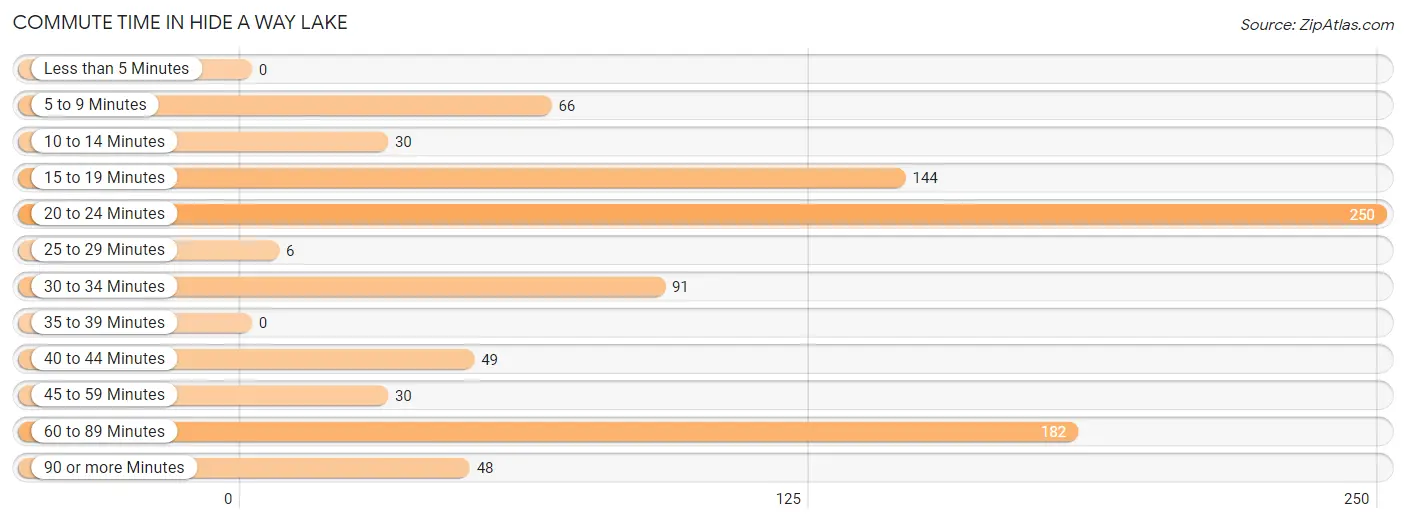
| Commute Time | # Commuters | % Commuters |
| Less than 5 Minutes | 0 | 0.0% |
| 5 to 9 Minutes | 66 | 7.4% |
| 10 to 14 Minutes | 30 | 3.4% |
| 15 to 19 Minutes | 144 | 16.1% |
| 20 to 24 Minutes | 250 | 27.9% |
| 25 to 29 Minutes | 6 | 0.7% |
| 30 to 34 Minutes | 91 | 10.2% |
| 35 to 39 Minutes | 0 | 0.0% |
| 40 to 44 Minutes | 49 | 5.5% |
| 45 to 59 Minutes | 30 | 3.4% |
| 60 to 89 Minutes | 182 | 20.3% |
| 90 or more Minutes | 48 | 5.4% |
Commute Time by Sex in Hide A Way Lake
The most common commute times in Hide A Way Lake are 60 to 89 minutes (115 commuters, 25.1%) for males and 20 to 24 minutes (163 commuters, 37.3%) for females.
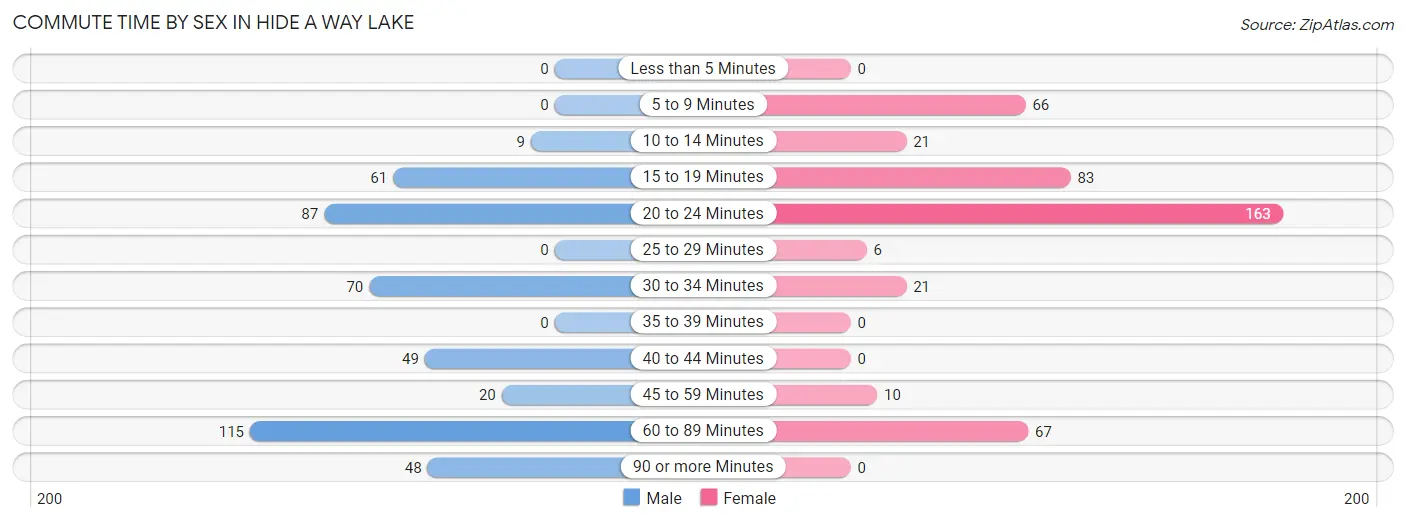
| Commute Time | Male | Female |
| Less than 5 Minutes | 0 (0.0%) | 0 (0.0%) |
| 5 to 9 Minutes | 0 (0.0%) | 66 (15.1%) |
| 10 to 14 Minutes | 9 (2.0%) | 21 (4.8%) |
| 15 to 19 Minutes | 61 (13.3%) | 83 (19.0%) |
| 20 to 24 Minutes | 87 (19.0%) | 163 (37.3%) |
| 25 to 29 Minutes | 0 (0.0%) | 6 (1.4%) |
| 30 to 34 Minutes | 70 (15.2%) | 21 (4.8%) |
| 35 to 39 Minutes | 0 (0.0%) | 0 (0.0%) |
| 40 to 44 Minutes | 49 (10.7%) | 0 (0.0%) |
| 45 to 59 Minutes | 20 (4.4%) | 10 (2.3%) |
| 60 to 89 Minutes | 115 (25.1%) | 67 (15.3%) |
| 90 or more Minutes | 48 (10.5%) | 0 (0.0%) |
Time of Departure to Work by Sex in Hide A Way Lake
The most frequent times of departure to work in Hide A Way Lake are 12:00 PM to 3:59 PM (164, 35.7%) for males and 6:00 AM to 6:29 AM (164, 37.5%) for females.
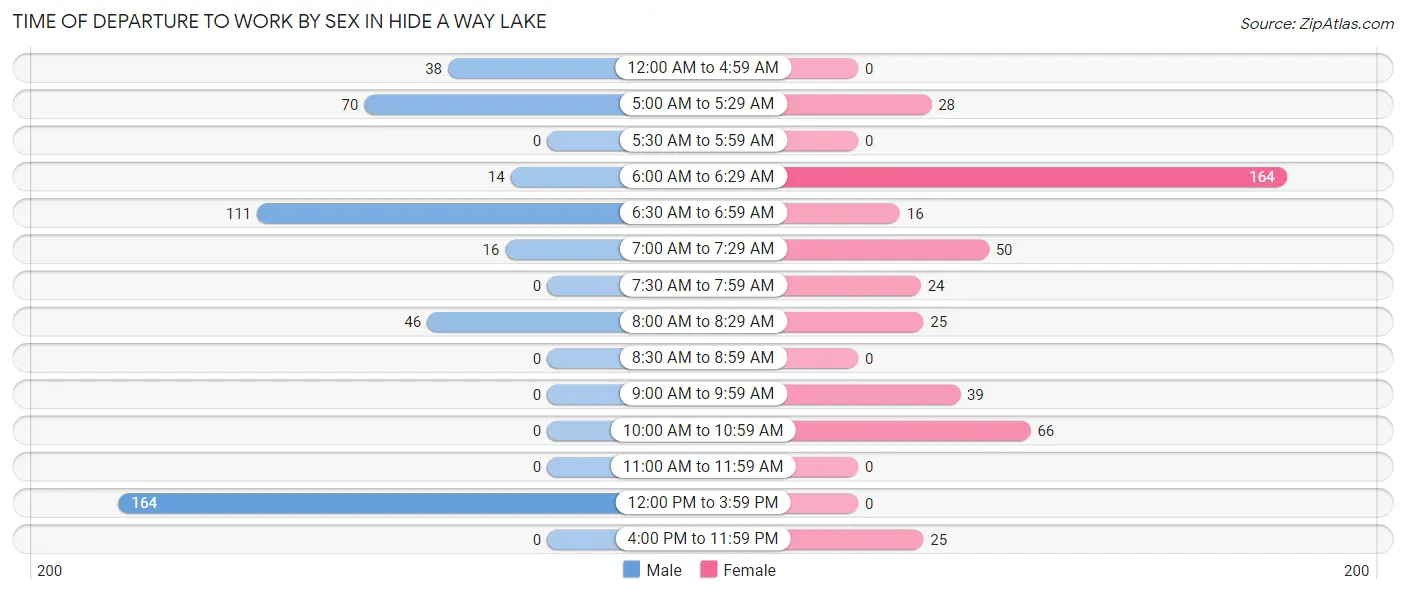
| Time of Departure | Male | Female |
| 12:00 AM to 4:59 AM | 38 (8.3%) | 0 (0.0%) |
| 5:00 AM to 5:29 AM | 70 (15.2%) | 28 (6.4%) |
| 5:30 AM to 5:59 AM | 0 (0.0%) | 0 (0.0%) |
| 6:00 AM to 6:29 AM | 14 (3.0%) | 164 (37.5%) |
| 6:30 AM to 6:59 AM | 111 (24.2%) | 16 (3.7%) |
| 7:00 AM to 7:29 AM | 16 (3.5%) | 50 (11.4%) |
| 7:30 AM to 7:59 AM | 0 (0.0%) | 24 (5.5%) |
| 8:00 AM to 8:29 AM | 46 (10.0%) | 25 (5.7%) |
| 8:30 AM to 8:59 AM | 0 (0.0%) | 0 (0.0%) |
| 9:00 AM to 9:59 AM | 0 (0.0%) | 39 (8.9%) |
| 10:00 AM to 10:59 AM | 0 (0.0%) | 66 (15.1%) |
| 11:00 AM to 11:59 AM | 0 (0.0%) | 0 (0.0%) |
| 12:00 PM to 3:59 PM | 164 (35.7%) | 0 (0.0%) |
| 4:00 PM to 11:59 PM | 0 (0.0%) | 25 (5.7%) |
| Total | 459 (100.0%) | 437 (100.0%) |
Housing Occupancy in Hide A Way Lake
Occupancy by Ownership in Hide A Way Lake
Of the total 906 dwellings in Hide A Way Lake, owner-occupied units account for 906 (100.0%), while renter-occupied units make up 0 (0.0%).
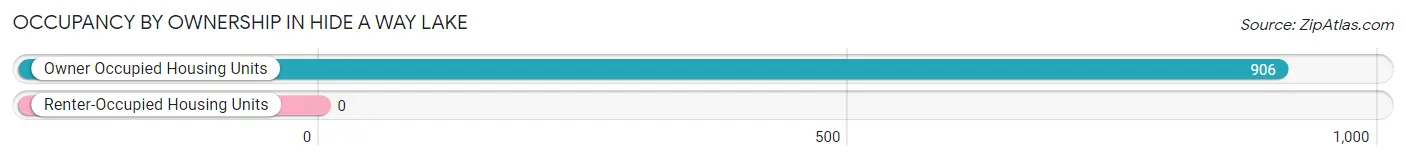
| Occupancy | # Housing Units | % Housing Units |
| Owner Occupied Housing Units | 906 | 100.0% |
| Renter-Occupied Housing Units | 0 | 0.0% |
| Total Occupied Housing Units | 906 | 100.0% |
Occupancy by Household Size in Hide A Way Lake
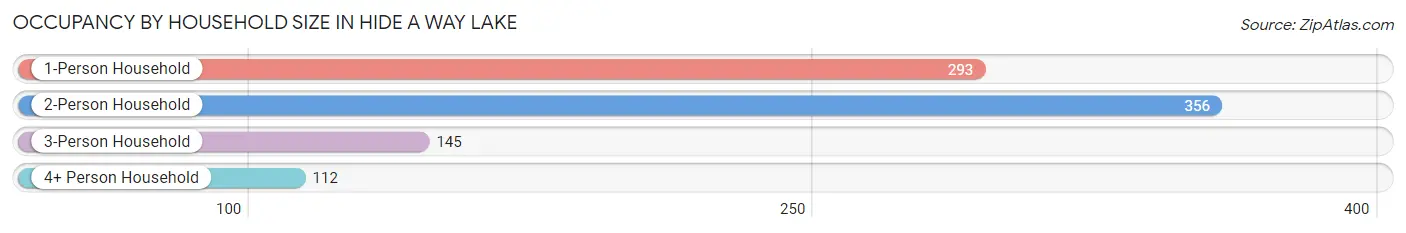
| Household Size | # Housing Units | % Housing Units |
| 1-Person Household | 293 | 32.3% |
| 2-Person Household | 356 | 39.3% |
| 3-Person Household | 145 | 16.0% |
| 4+ Person Household | 112 | 12.4% |
| Total Housing Units | 906 | 100.0% |
Occupancy by Ownership by Household Size in Hide A Way Lake
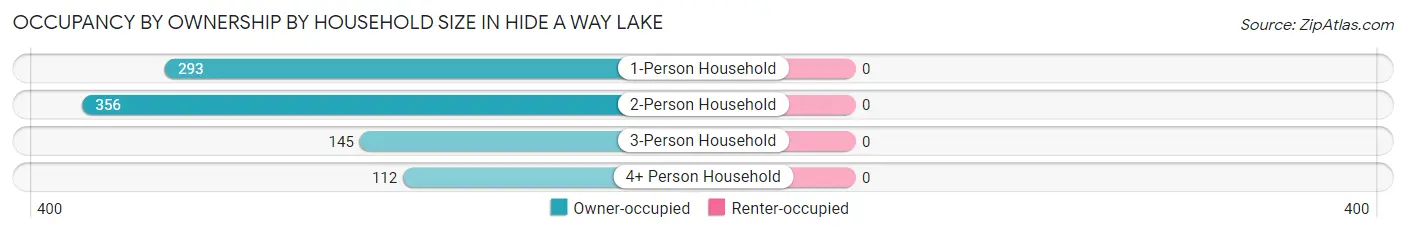
| Household Size | Owner-occupied | Renter-occupied |
| 1-Person Household | 293 (100.0%) | 0 (0.0%) |
| 2-Person Household | 356 (100.0%) | 0 (0.0%) |
| 3-Person Household | 145 (100.0%) | 0 (0.0%) |
| 4+ Person Household | 112 (100.0%) | 0 (0.0%) |
| Total Housing Units | 906 (100.0%) | 0 (0.0%) |
Occupancy by Educational Attainment in Hide A Way Lake
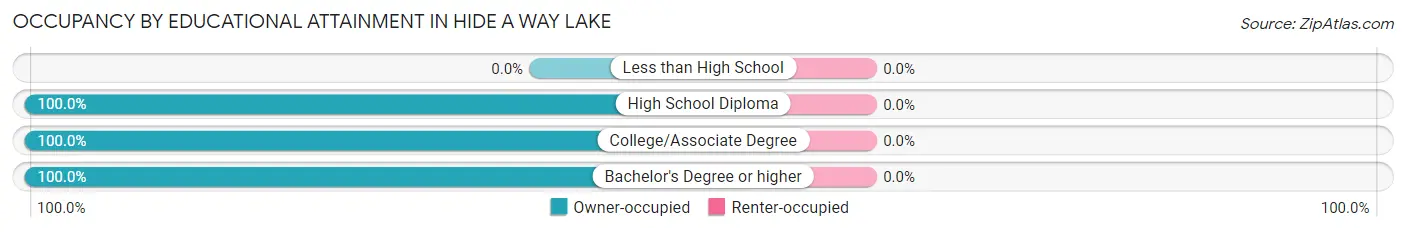
| Household Size | Owner-occupied | Renter-occupied |
| Less than High School | 0 (0.0%) | 0 (0.0%) |
| High School Diploma | 464 (100.0%) | 0 (0.0%) |
| College/Associate Degree | 256 (100.0%) | 0 (0.0%) |
| Bachelor's Degree or higher | 186 (100.0%) | 0 (0.0%) |
Occupancy by Age of Householder in Hide A Way Lake
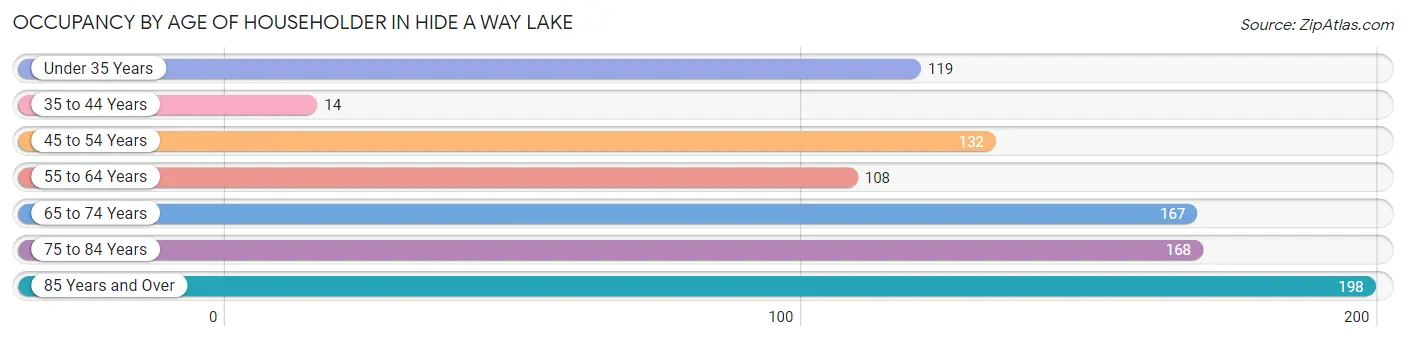
| Age Bracket | # Households | % Households |
| Under 35 Years | 119 | 13.1% |
| 35 to 44 Years | 14 | 1.5% |
| 45 to 54 Years | 132 | 14.6% |
| 55 to 64 Years | 108 | 11.9% |
| 65 to 74 Years | 167 | 18.4% |
| 75 to 84 Years | 168 | 18.5% |
| 85 Years and Over | 198 | 21.8% |
| Total | 906 | 100.0% |
Housing Finances in Hide A Way Lake
Median Income by Occupancy in Hide A Way Lake
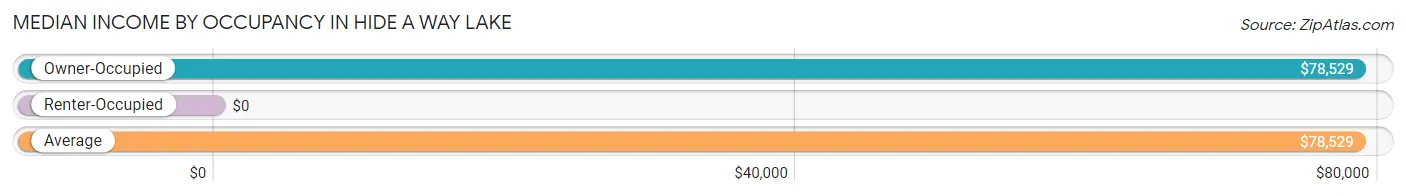
| Occupancy Type | # Households | Median Income |
| Owner-Occupied | 906 (100.0%) | $78,529 |
| Renter-Occupied | 0 (0.0%) | $0 |
| Average | 906 (100.0%) | $78,529 |
Occupancy by Householder Income Bracket in Hide A Way Lake
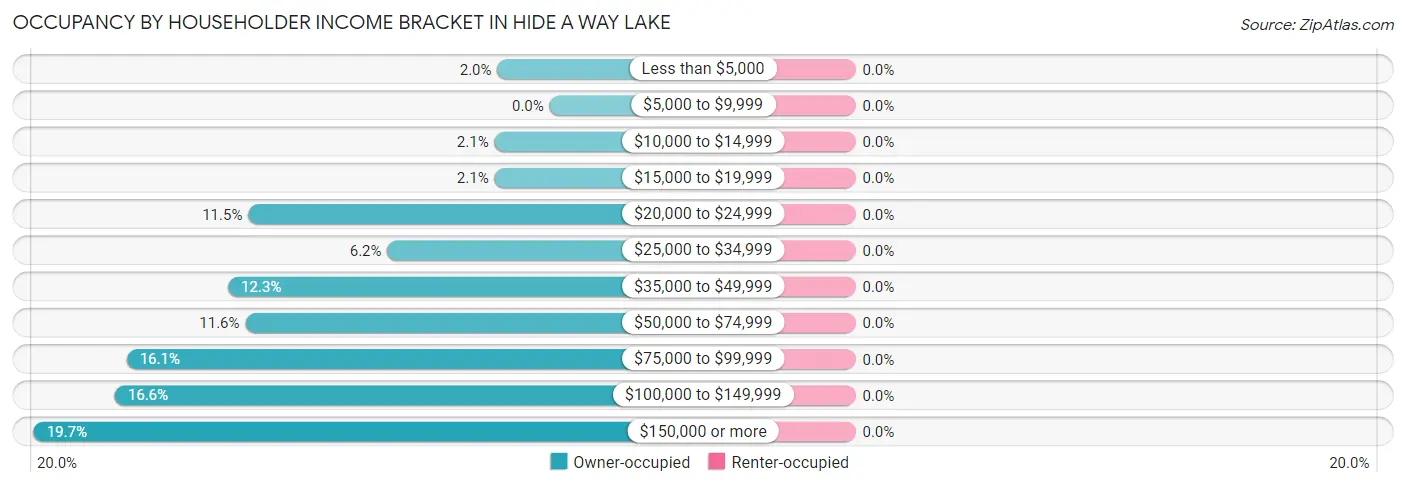
| Income Bracket | Owner-occupied | Renter-occupied |
| Less than $5,000 | 18 (2.0%) | 0 (0.0%) |
| $5,000 to $9,999 | 0 (0.0%) | 0 (0.0%) |
| $10,000 to $14,999 | 19 (2.1%) | 0 (0.0%) |
| $15,000 to $19,999 | 19 (2.1%) | 0 (0.0%) |
| $20,000 to $24,999 | 104 (11.5%) | 0 (0.0%) |
| $25,000 to $34,999 | 56 (6.2%) | 0 (0.0%) |
| $35,000 to $49,999 | 111 (12.2%) | 0 (0.0%) |
| $50,000 to $74,999 | 105 (11.6%) | 0 (0.0%) |
| $75,000 to $99,999 | 146 (16.1%) | 0 (0.0%) |
| $100,000 to $149,999 | 150 (16.6%) | 0 (0.0%) |
| $150,000 or more | 178 (19.7%) | 0 (0.0%) |
| Total | 906 (100.0%) | 0 (0.0%) |
Monthly Housing Cost Tiers in Hide A Way Lake
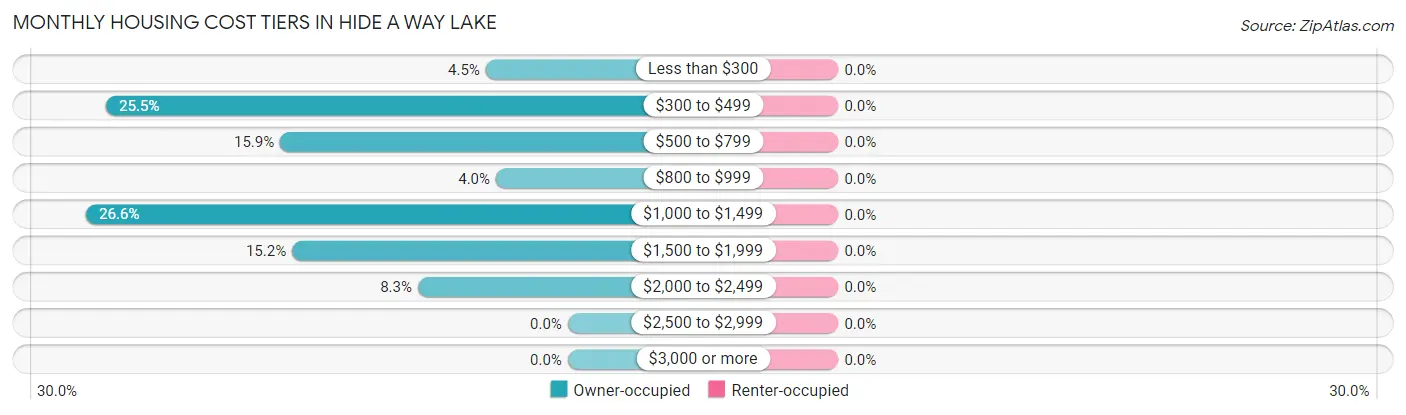
| Monthly Cost | Owner-occupied | Renter-occupied |
| Less than $300 | 41 (4.5%) | 0 (0.0%) |
| $300 to $499 | 231 (25.5%) | 0 (0.0%) |
| $500 to $799 | 144 (15.9%) | 0 (0.0%) |
| $800 to $999 | 36 (4.0%) | 0 (0.0%) |
| $1,000 to $1,499 | 241 (26.6%) | 0 (0.0%) |
| $1,500 to $1,999 | 138 (15.2%) | 0 (0.0%) |
| $2,000 to $2,499 | 75 (8.3%) | 0 (0.0%) |
| $2,500 to $2,999 | 0 (0.0%) | 0 (0.0%) |
| $3,000 or more | 0 (0.0%) | 0 (0.0%) |
| Total | 906 (100.0%) | 0 (0.0%) |
Physical Housing Characteristics in Hide A Way Lake
Housing Structures in Hide A Way Lake
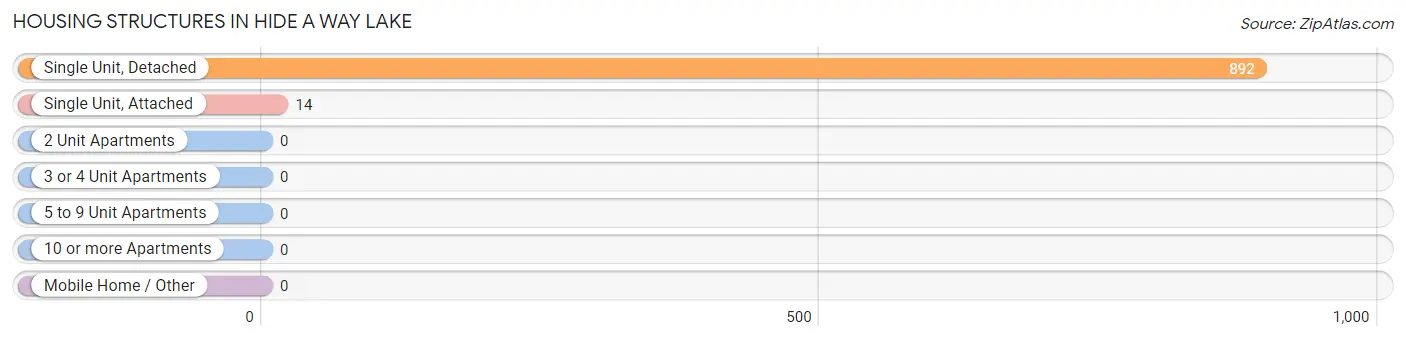
| Structure Type | # Housing Units | % Housing Units |
| Single Unit, Detached | 892 | 98.5% |
| Single Unit, Attached | 14 | 1.5% |
| 2 Unit Apartments | 0 | 0.0% |
| 3 or 4 Unit Apartments | 0 | 0.0% |
| 5 to 9 Unit Apartments | 0 | 0.0% |
| 10 or more Apartments | 0 | 0.0% |
| Mobile Home / Other | 0 | 0.0% |
| Total | 906 | 100.0% |
Housing Structures by Occupancy in Hide A Way Lake
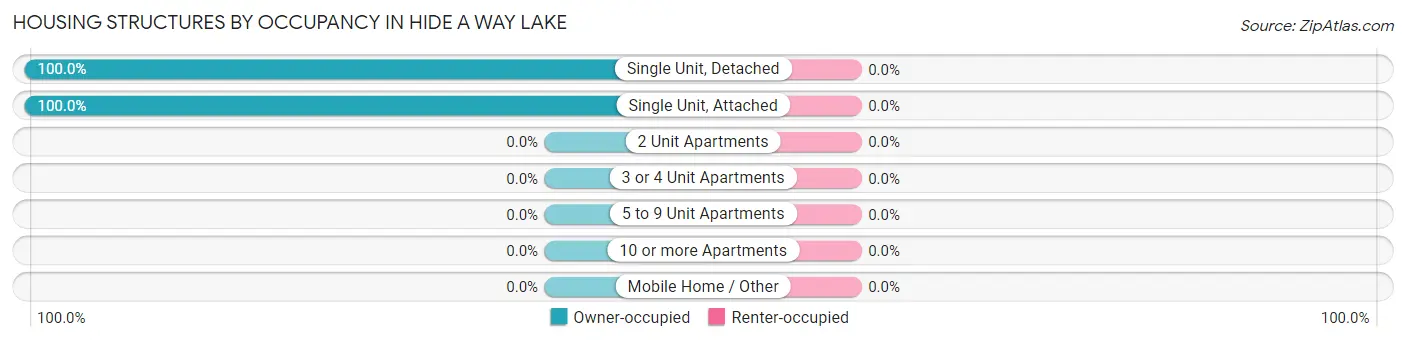
| Structure Type | Owner-occupied | Renter-occupied |
| Single Unit, Detached | 892 (100.0%) | 0 (0.0%) |
| Single Unit, Attached | 14 (100.0%) | 0 (0.0%) |
| 2 Unit Apartments | 0 (0.0%) | 0 (0.0%) |
| 3 or 4 Unit Apartments | 0 (0.0%) | 0 (0.0%) |
| 5 to 9 Unit Apartments | 0 (0.0%) | 0 (0.0%) |
| 10 or more Apartments | 0 (0.0%) | 0 (0.0%) |
| Mobile Home / Other | 0 (0.0%) | 0 (0.0%) |
| Total | 906 (100.0%) | 0 (0.0%) |
Housing Structures by Number of Rooms in Hide A Way Lake
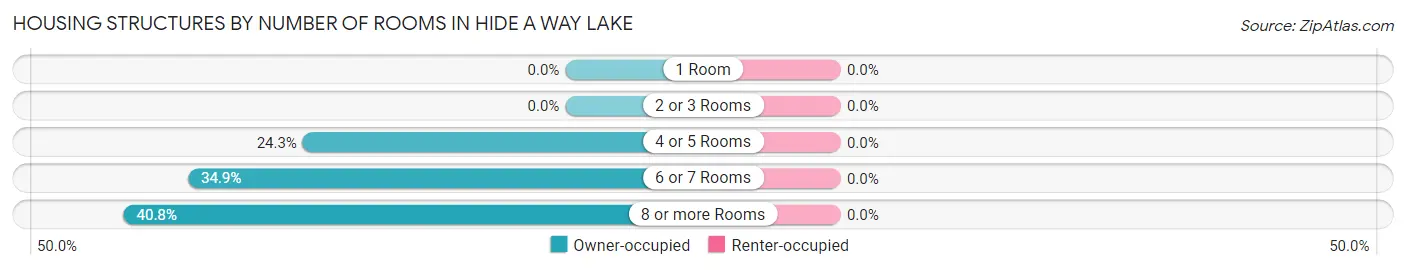
| Number of Rooms | Owner-occupied | Renter-occupied |
| 1 Room | 0 (0.0%) | 0 (0.0%) |
| 2 or 3 Rooms | 0 (0.0%) | 0 (0.0%) |
| 4 or 5 Rooms | 220 (24.3%) | 0 (0.0%) |
| 6 or 7 Rooms | 316 (34.9%) | 0 (0.0%) |
| 8 or more Rooms | 370 (40.8%) | 0 (0.0%) |
| Total | 906 (100.0%) | 0 (0.0%) |
Housing Structure by Heating Type in Hide A Way Lake
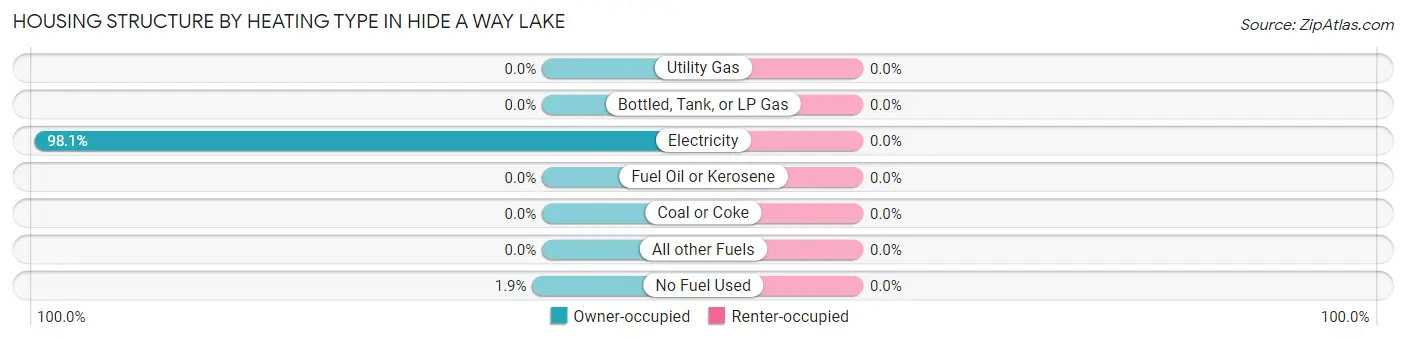
| Heating Type | Owner-occupied | Renter-occupied |
| Utility Gas | 0 (0.0%) | 0 (0.0%) |
| Bottled, Tank, or LP Gas | 0 (0.0%) | 0 (0.0%) |
| Electricity | 889 (98.1%) | 0 (0.0%) |
| Fuel Oil or Kerosene | 0 (0.0%) | 0 (0.0%) |
| Coal or Coke | 0 (0.0%) | 0 (0.0%) |
| All other Fuels | 0 (0.0%) | 0 (0.0%) |
| No Fuel Used | 17 (1.9%) | 0 (0.0%) |
| Total | 906 (100.0%) | 0 (0.0%) |
Household Vehicle Usage in Hide A Way Lake
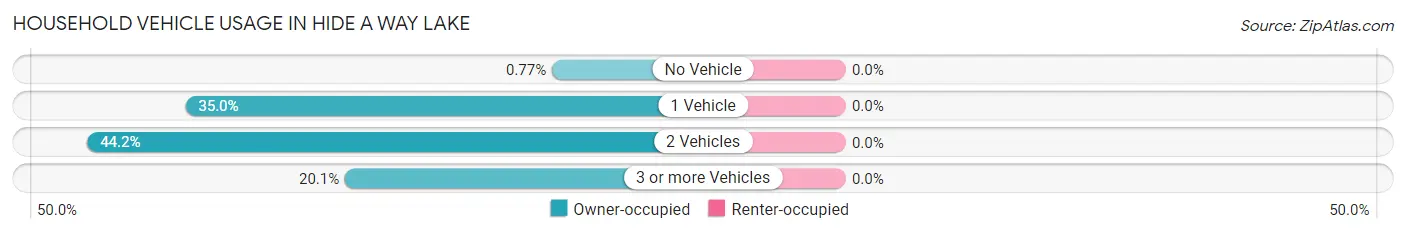
| Vehicles per Household | Owner-occupied | Renter-occupied |
| No Vehicle | 7 (0.8%) | 0 (0.0%) |
| 1 Vehicle | 317 (35.0%) | 0 (0.0%) |
| 2 Vehicles | 400 (44.2%) | 0 (0.0%) |
| 3 or more Vehicles | 182 (20.1%) | 0 (0.0%) |
| Total | 906 (100.0%) | 0 (0.0%) |
Real Estate & Mortgages in Hide A Way Lake
Real Estate and Mortgage Overview in Hide A Way Lake
| Characteristic | Without Mortgage | With Mortgage |
| Housing Units | 413 | 493 |
| Median Property Value | $188,600 | $201,400 |
| Median Household Income | $43,173 | $98 |
| Monthly Housing Costs | $457 | $0 |
| Real Estate Taxes | $899 | $108 |
Property Value by Mortgage Status in Hide A Way Lake
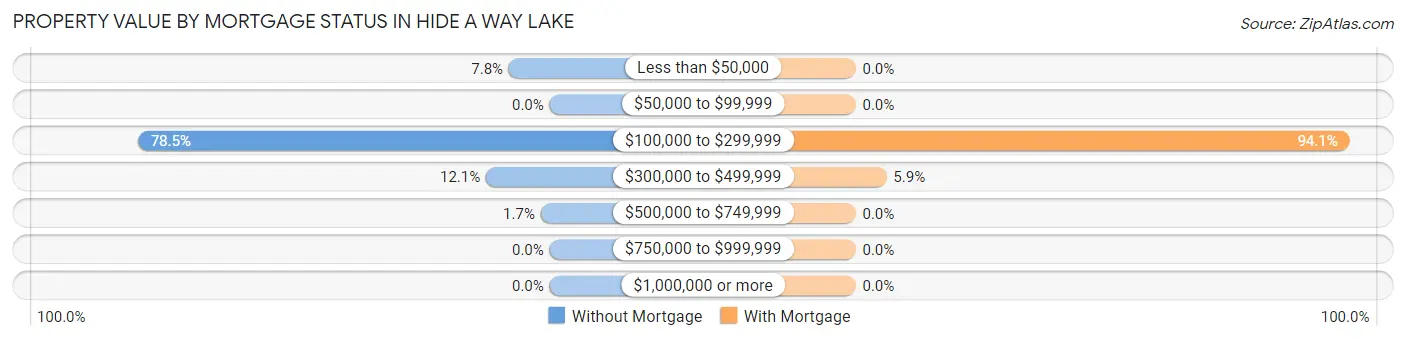
| Property Value | Without Mortgage | With Mortgage |
| Less than $50,000 | 32 (7.7%) | 0 (0.0%) |
| $50,000 to $99,999 | 0 (0.0%) | 0 (0.0%) |
| $100,000 to $299,999 | 324 (78.4%) | 464 (94.1%) |
| $300,000 to $499,999 | 50 (12.1%) | 29 (5.9%) |
| $500,000 to $749,999 | 7 (1.7%) | 0 (0.0%) |
| $750,000 to $999,999 | 0 (0.0%) | 0 (0.0%) |
| $1,000,000 or more | 0 (0.0%) | 0 (0.0%) |
| Total | 413 (100.0%) | 493 (100.0%) |
Household Income by Mortgage Status in Hide A Way Lake
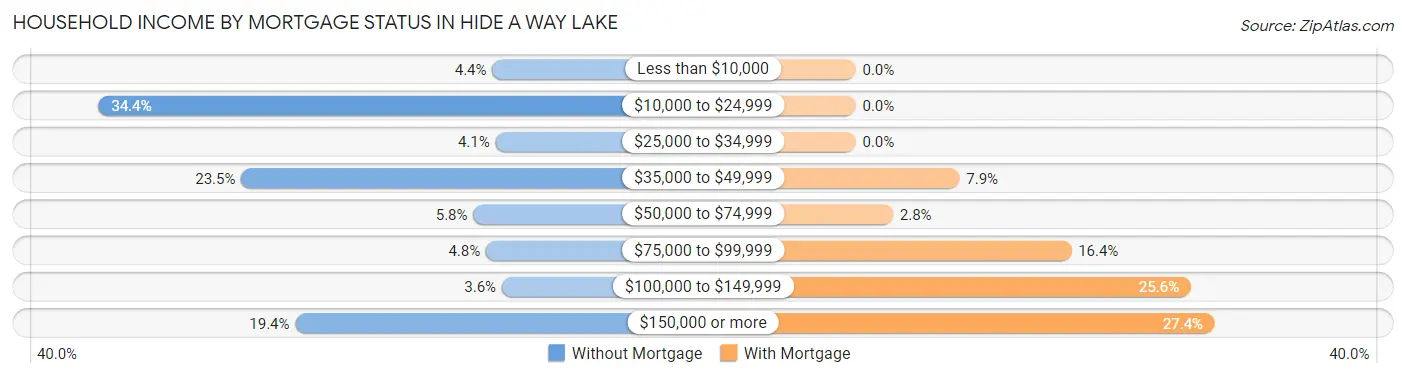
| Household Income | Without Mortgage | With Mortgage |
| Less than $10,000 | 18 (4.4%) | 0 (0.0%) |
| $10,000 to $24,999 | 142 (34.4%) | 0 (0.0%) |
| $25,000 to $34,999 | 17 (4.1%) | 0 (0.0%) |
| $35,000 to $49,999 | 97 (23.5%) | 39 (7.9%) |
| $50,000 to $74,999 | 24 (5.8%) | 14 (2.8%) |
| $75,000 to $99,999 | 20 (4.8%) | 81 (16.4%) |
| $100,000 to $149,999 | 15 (3.6%) | 126 (25.6%) |
| $150,000 or more | 80 (19.4%) | 135 (27.4%) |
| Total | 413 (100.0%) | 493 (100.0%) |
Property Value to Household Income Ratio in Hide A Way Lake
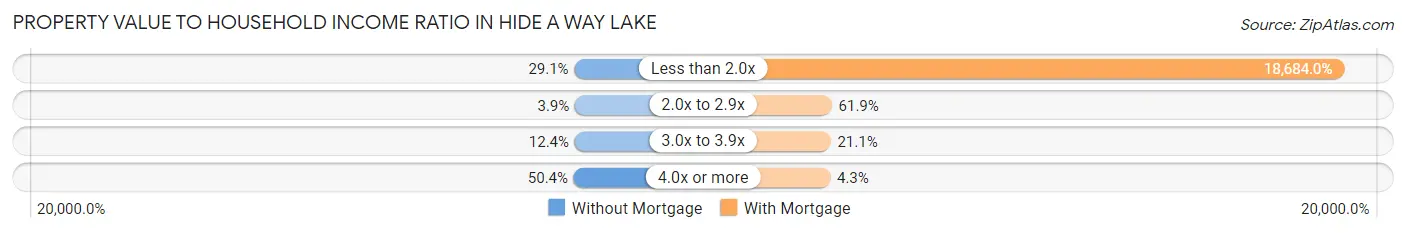
| Value-to-Income Ratio | Without Mortgage | With Mortgage |
| Less than 2.0x | 120 (29.1%) | 92,112 (18,684.0%) |
| 2.0x to 2.9x | 16 (3.9%) | 305 (61.9%) |
| 3.0x to 3.9x | 51 (12.3%) | 104 (21.1%) |
| 4.0x or more | 208 (50.4%) | 21 (4.3%) |
| Total | 413 (100.0%) | 493 (100.0%) |
Real Estate Taxes by Mortgage Status in Hide A Way Lake
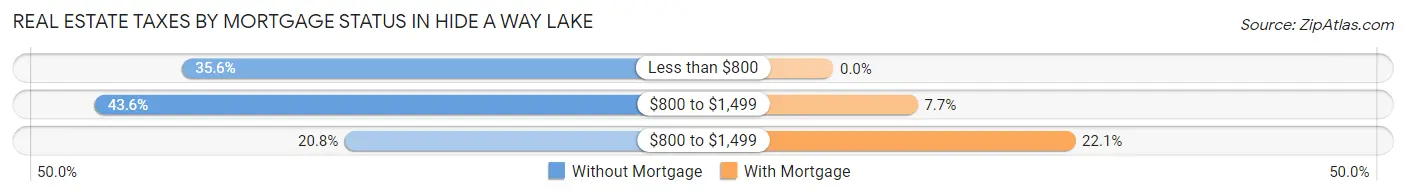
| Property Taxes | Without Mortgage | With Mortgage |
| Less than $800 | 147 (35.6%) | 0 (0.0%) |
| $800 to $1,499 | 180 (43.6%) | 38 (7.7%) |
| $800 to $1,499 | 86 (20.8%) | 109 (22.1%) |
| Total | 413 (100.0%) | 493 (100.0%) |
Health & Disability in Hide A Way Lake
Health Insurance Coverage by Age in Hide A Way Lake
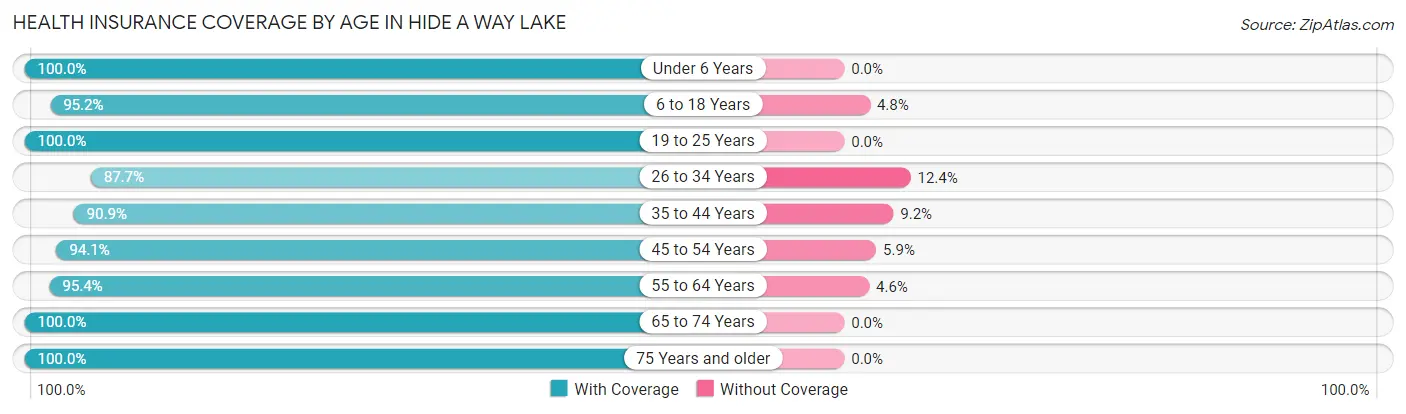
| Age Bracket | With Coverage | Without Coverage |
| Under 6 Years | 92 (100.0%) | 0 (0.0%) |
| 6 to 18 Years | 259 (95.2%) | 13 (4.8%) |
| 19 to 25 Years | 75 (100.0%) | 0 (0.0%) |
| 26 to 34 Years | 298 (87.6%) | 42 (12.3%) |
| 35 to 44 Years | 139 (90.8%) | 14 (9.1%) |
| 45 to 54 Years | 190 (94.1%) | 12 (5.9%) |
| 55 to 64 Years | 206 (95.4%) | 10 (4.6%) |
| 65 to 74 Years | 467 (100.0%) | 0 (0.0%) |
| 75 Years and older | 377 (100.0%) | 0 (0.0%) |
| Total | 2,103 (95.9%) | 91 (4.2%) |
Health Insurance Coverage by Citizenship Status in Hide A Way Lake
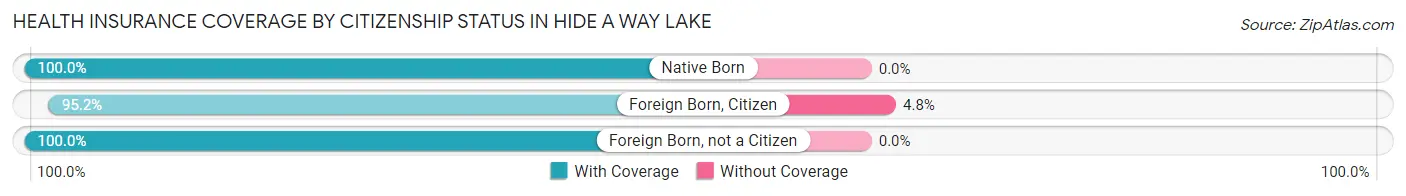
| Citizenship Status | With Coverage | Without Coverage |
| Native Born | 92 (100.0%) | 0 (0.0%) |
| Foreign Born, Citizen | 259 (95.2%) | 13 (4.8%) |
| Foreign Born, not a Citizen | 75 (100.0%) | 0 (0.0%) |
Health Insurance Coverage by Household Income in Hide A Way Lake
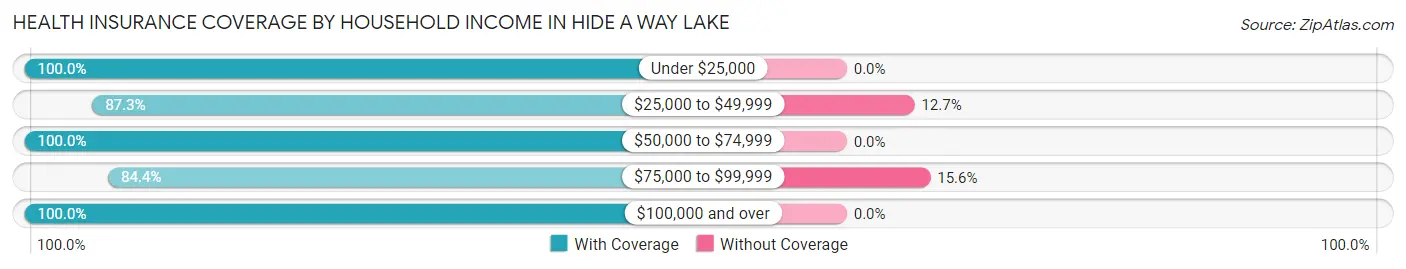
| Household Income | With Coverage | Without Coverage |
| Under $25,000 | 160 (100.0%) | 0 (0.0%) |
| $25,000 to $49,999 | 241 (87.3%) | 35 (12.7%) |
| $50,000 to $74,999 | 400 (100.0%) | 0 (0.0%) |
| $75,000 to $99,999 | 302 (84.4%) | 56 (15.6%) |
| $100,000 and over | 1,000 (100.0%) | 0 (0.0%) |
Public vs Private Health Insurance Coverage by Age in Hide A Way Lake
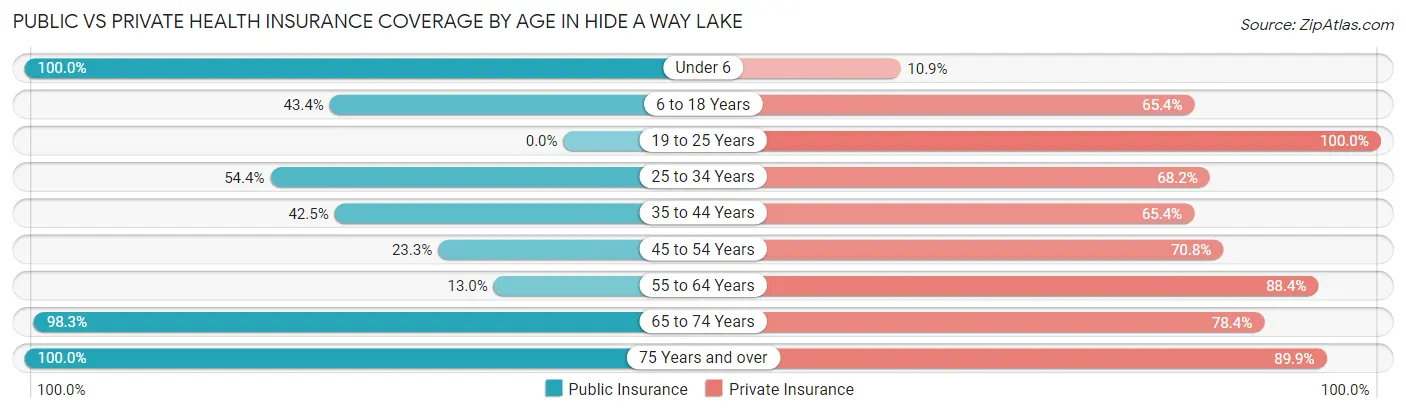
| Age Bracket | Public Insurance | Private Insurance |
| Under 6 | 92 (100.0%) | 10 (10.9%) |
| 6 to 18 Years | 118 (43.4%) | 178 (65.4%) |
| 19 to 25 Years | 0 (0.0%) | 75 (100.0%) |
| 25 to 34 Years | 185 (54.4%) | 232 (68.2%) |
| 35 to 44 Years | 65 (42.5%) | 100 (65.4%) |
| 45 to 54 Years | 47 (23.3%) | 143 (70.8%) |
| 55 to 64 Years | 28 (13.0%) | 191 (88.4%) |
| 65 to 74 Years | 459 (98.3%) | 366 (78.4%) |
| 75 Years and over | 377 (100.0%) | 339 (89.9%) |
| Total | 1,371 (62.5%) | 1,634 (74.5%) |
Disability Status by Sex by Age in Hide A Way Lake
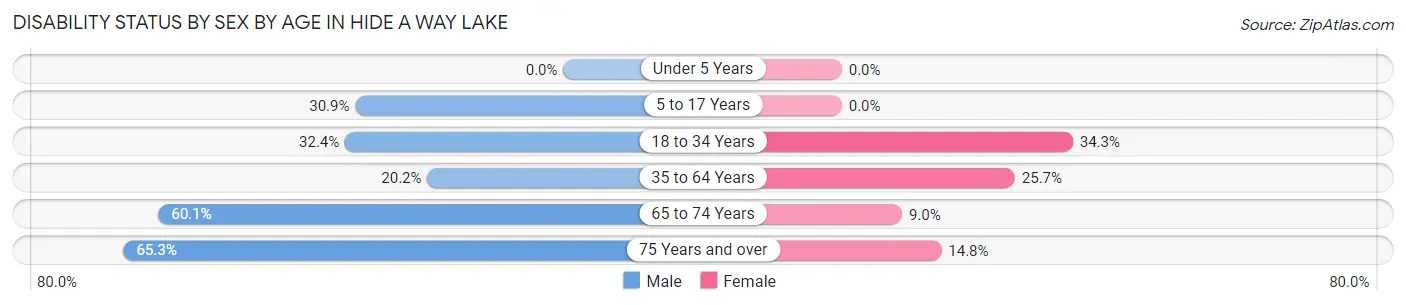
| Age Bracket | Male | Female |
| Under 5 Years | 0 (0.0%) | 0 (0.0%) |
| 5 to 17 Years | 38 (30.9%) | 0 (0.0%) |
| 18 to 34 Years | 117 (32.4%) | 59 (34.3%) |
| 35 to 64 Years | 43 (20.2%) | 92 (25.7%) |
| 65 to 74 Years | 86 (60.1%) | 29 (8.9%) |
| 75 Years and over | 96 (65.3%) | 34 (14.8%) |
Disability Class by Sex by Age in Hide A Way Lake
Disability Class: Hearing Difficulty
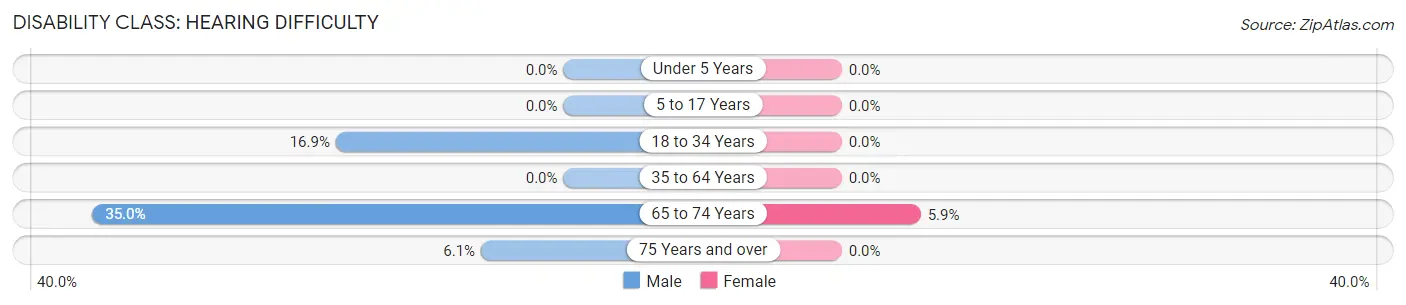
| Age Bracket | Male | Female |
| Under 5 Years | 0 (0.0%) | 0 (0.0%) |
| 5 to 17 Years | 0 (0.0%) | 0 (0.0%) |
| 18 to 34 Years | 61 (16.9%) | 0 (0.0%) |
| 35 to 64 Years | 0 (0.0%) | 0 (0.0%) |
| 65 to 74 Years | 50 (35.0%) | 19 (5.9%) |
| 75 Years and over | 9 (6.1%) | 0 (0.0%) |
Disability Class: Vision Difficulty
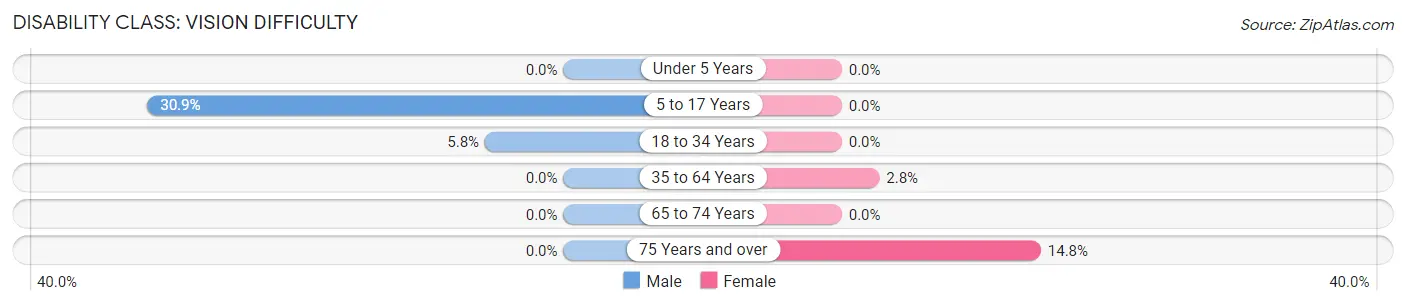
| Age Bracket | Male | Female |
| Under 5 Years | 0 (0.0%) | 0 (0.0%) |
| 5 to 17 Years | 38 (30.9%) | 0 (0.0%) |
| 18 to 34 Years | 21 (5.8%) | 0 (0.0%) |
| 35 to 64 Years | 0 (0.0%) | 10 (2.8%) |
| 65 to 74 Years | 0 (0.0%) | 0 (0.0%) |
| 75 Years and over | 0 (0.0%) | 34 (14.8%) |
Disability Class: Cognitive Difficulty
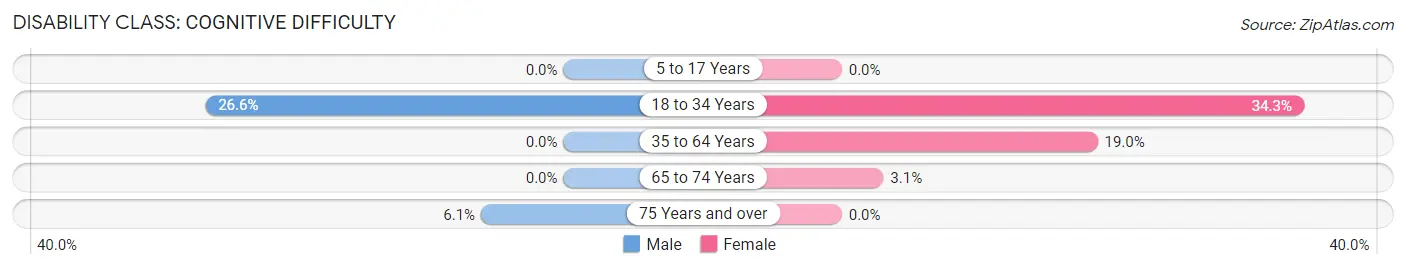
| Age Bracket | Male | Female |
| 5 to 17 Years | 0 (0.0%) | 0 (0.0%) |
| 18 to 34 Years | 96 (26.6%) | 59 (34.3%) |
| 35 to 64 Years | 0 (0.0%) | 68 (19.0%) |
| 65 to 74 Years | 0 (0.0%) | 10 (3.1%) |
| 75 Years and over | 9 (6.1%) | 0 (0.0%) |
Disability Class: Ambulatory Difficulty
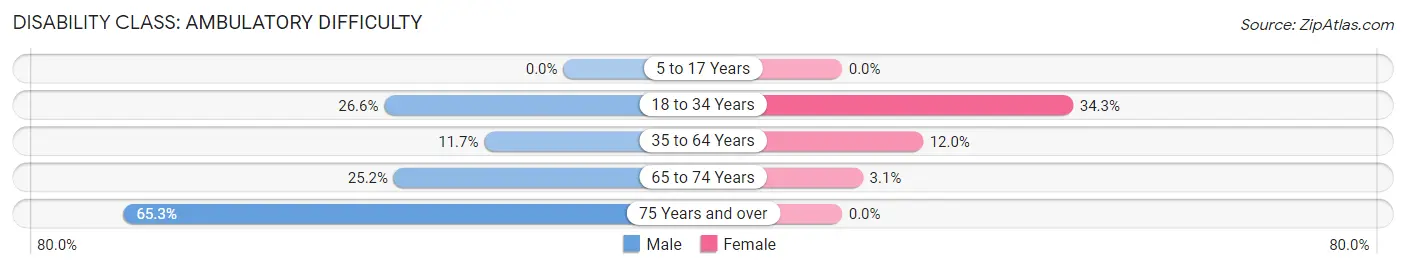
| Age Bracket | Male | Female |
| 5 to 17 Years | 0 (0.0%) | 0 (0.0%) |
| 18 to 34 Years | 96 (26.6%) | 59 (34.3%) |
| 35 to 64 Years | 25 (11.7%) | 43 (12.0%) |
| 65 to 74 Years | 36 (25.2%) | 10 (3.1%) |
| 75 Years and over | 96 (65.3%) | 0 (0.0%) |
Disability Class: Self-Care Difficulty
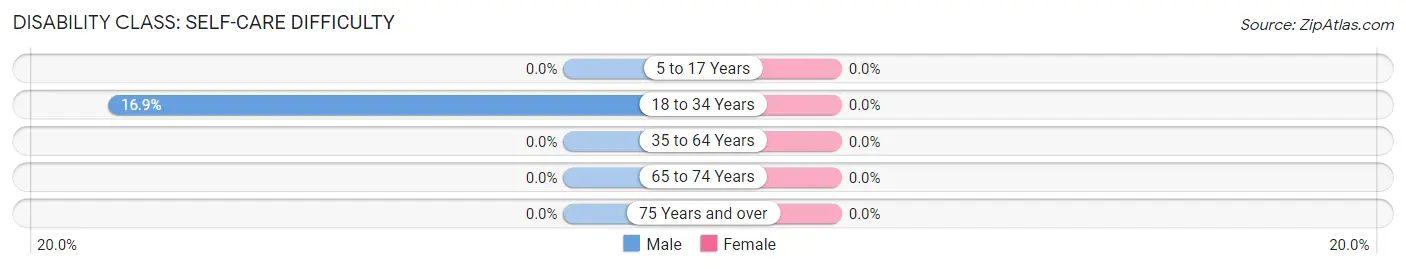
| Age Bracket | Male | Female |
| 5 to 17 Years | 0 (0.0%) | 0 (0.0%) |
| 18 to 34 Years | 61 (16.9%) | 0 (0.0%) |
| 35 to 64 Years | 0 (0.0%) | 0 (0.0%) |
| 65 to 74 Years | 0 (0.0%) | 0 (0.0%) |
| 75 Years and over | 0 (0.0%) | 0 (0.0%) |
Technology Access in Hide A Way Lake
Computing Device Access in Hide A Way Lake
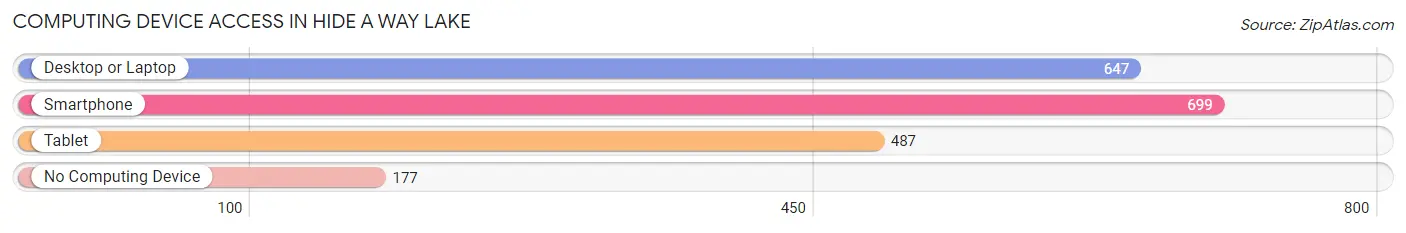
| Device Type | # Households | % Households |
| Desktop or Laptop | 647 | 71.4% |
| Smartphone | 699 | 77.1% |
| Tablet | 487 | 53.7% |
| No Computing Device | 177 | 19.5% |
| Total | 906 | 100.0% |
Internet Access in Hide A Way Lake
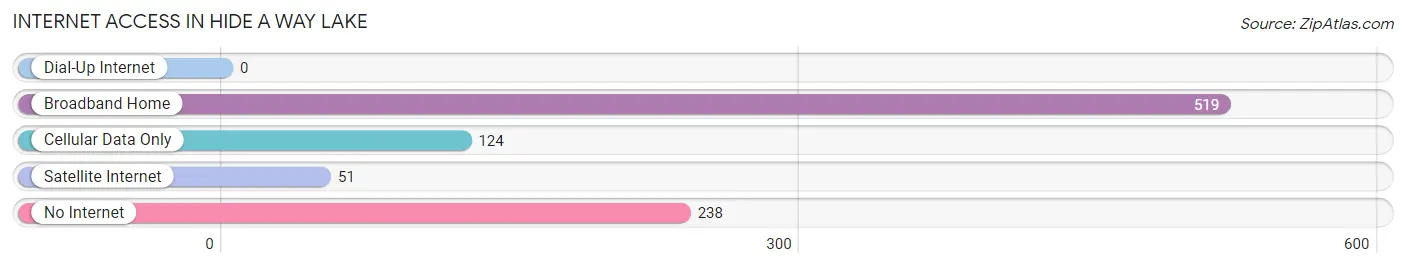
| Internet Type | # Households | % Households |
| Dial-Up Internet | 0 | 0.0% |
| Broadband Home | 519 | 57.3% |
| Cellular Data Only | 124 | 13.7% |
| Satellite Internet | 51 | 5.6% |
| No Internet | 238 | 26.3% |
| Total | 906 | 100.0% |
Hide A Way Lake Summary
History
Hide A Way Lake, Mississippi is a small, private lake community located in Lee County, Mississippi. The community was founded in the late 1950s by a group of investors who wanted to create a private lake community for their families and friends. The community was originally known as Hide A Way Lake Estates, and the lake was named after the community. The lake was created by damming a small creek, and the community was built around the lake.
The community was designed to be a private, gated community with a variety of amenities, including a clubhouse, swimming pool, tennis courts, and a golf course. The community was also designed to be a safe and secure place to live, with strict rules and regulations. The community was designed to be a place where people could come to relax and enjoy the outdoors.
The community has grown over the years, and today it is home to over 1,000 families. The community is still a private, gated community, and the amenities are still available for residents to enjoy.
Geography
Hide A Way Lake is located in Lee County, Mississippi, approximately 20 miles east of Tupelo. The lake is located in a rural area, surrounded by forests and farmland. The lake is approximately one mile long and half a mile wide, and is fed by a small creek. The lake is surrounded by a variety of trees, including cypress, oak, and hickory.
The community is located on the banks of the lake, and is made up of a variety of homes, ranging from small cabins to large, luxurious homes. The community is also home to a variety of businesses, including a marina, a golf course, and a variety of restaurants and shops.
Economy
The economy of Hide A Way Lake is largely based on tourism and recreation. The lake is a popular destination for fishing, boating, and other outdoor activities. The community also has a variety of businesses, including restaurants, shops, and a marina. The community also has a golf course, which is a popular destination for golfers.
The community also has a variety of other businesses, including a variety of professional services, such as lawyers, accountants, and real estate agents. The community also has a variety of retail stores, including a grocery store, a hardware store, and a variety of other stores.
Demographics
As of the 2010 census, the population of Hide A Way Lake was 1,072. The population is predominantly white, with a small percentage of African Americans and other races. The median age of the population is 44.7 years, and the median household income is $50,000.
The community is largely made up of families, with a majority of the population being married couples. The community is also home to a variety of professionals, including lawyers, accountants, and real estate agents.
Conclusion
Hide A Way Lake, Mississippi is a small, private lake community located in Lee County, Mississippi. The community was founded in the late 1950s and has grown over the years to become a popular destination for fishing, boating, and other outdoor activities. The community is made up of a variety of homes, businesses, and amenities, and is home to a predominantly white population with a median age of 44.7 years and a median household income of $50,000. The community is a safe and secure place to live, and is a popular destination for those looking to relax and enjoy the outdoors.
Common Questions
What is the Total Population of Hide A Way Lake?
Total Population of Hide A Way Lake is 2,194.
What is the Total Male Population of Hide A Way Lake?
Total Male Population of Hide A Way Lake is 1,010.
What is the Total Female Population of Hide A Way Lake?
Total Female Population of Hide A Way Lake is 1,184.
What is the Ratio of Males per 100 Females in Hide A Way Lake?
There are 85.30 Males per 100 Females in Hide A Way Lake.
What is the Ratio of Females per 100 Males in Hide A Way Lake?
There are 117.23 Females per 100 Males in Hide A Way Lake.
What is the Median Population Age in Hide A Way Lake?
Median Population Age in Hide A Way Lake is 54.1 Years.
What is the Average Family Size in Hide A Way Lake
Average Family Size in Hide A Way Lake is 3.0 People.
What is the Average Household Size in Hide A Way Lake
Average Household Size in Hide A Way Lake is 2.4 People.
What is Per Capita Income in Hide A Way Lake?
Per Capita income in Hide A Way Lake is $43,336.
What is the Median Family Income in Hide A Way Lake?
Median Family Income in Hide A Way Lake is $92,428.
What is the Median Household income in Hide A Way Lake?
Median Household Income in Hide A Way Lake is $78,529.
What is Inequality or Gini Index in Hide A Way Lake?
Inequality or Gini Index in Hide A Way Lake is 0.42.
How Large is the Labor Force in Hide A Way Lake?
There are 1,312 People in the Labor Forcein in Hide A Way Lake.
What is the Percentage of People in the Labor Force in Hide A Way Lake?
66.8% of People are in the Labor Force in Hide A Way Lake.
What is the Unemployment Rate in Hide A Way Lake?
Unemployment Rate in Hide A Way Lake is 10.1%.