Hickory Flat, MS
Hickory Flat Map
Hickory Flat Overview
730
TOTAL POPULATION
295
MALE POPULATION
435
FEMALE POPULATION
67.82
MALES / 100 FEMALES
147.46
FEMALES / 100 MALES
26.3
MEDIAN AGE
3.5
AVG FAMILY SIZE
2.8
AVG HOUSEHOLD SIZE
$15,381
PER CAPITA INCOME
$34,844
AVG FAMILY INCOME
$33,219
AVG HOUSEHOLD INCOME
10.5%
WAGE / INCOME GAP [ % ]
89.5¢/ $1
WAGE / INCOME GAP [ $ ]
$13,903
FAMILY INCOME DEFICIT
0.41
INEQUALITY / GINI INDEX
247
LABOR FORCE [ PEOPLE ]
51.1%
PERCENT IN LABOR FORCE
12.1%
UNEMPLOYMENT RATE
Hickory Flat Zip Codes
Hickory Flat Area Codes
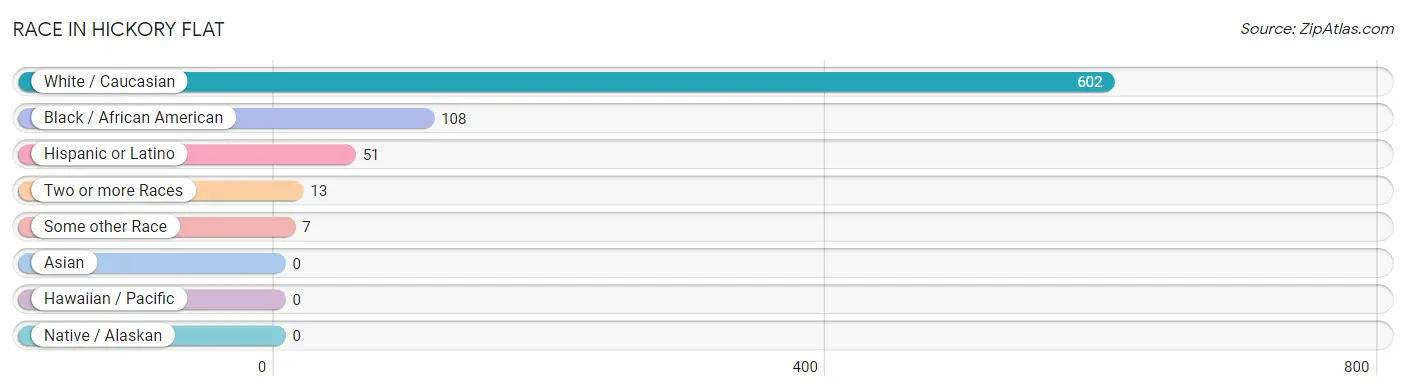
Race in Hickory Flat
The most populous races in Hickory Flat are White / Caucasian (602 | 82.5%), Black / African American (108 | 14.8%), and Hispanic or Latino (51 | 7.0%).
| Race | # Population | % Population |
| Asian | 0 | 0.0% |
| Black / African American | 108 | 14.8% |
| Hawaiian / Pacific | 0 | 0.0% |
| Hispanic or Latino | 51 | 7.0% |
| Native / Alaskan | 0 | 0.0% |
| White / Caucasian | 602 | 82.5% |
| Two or more Races | 13 | 1.8% |
| Some other Race | 7 | 1.0% |
| Total | 730 | 100.0% |
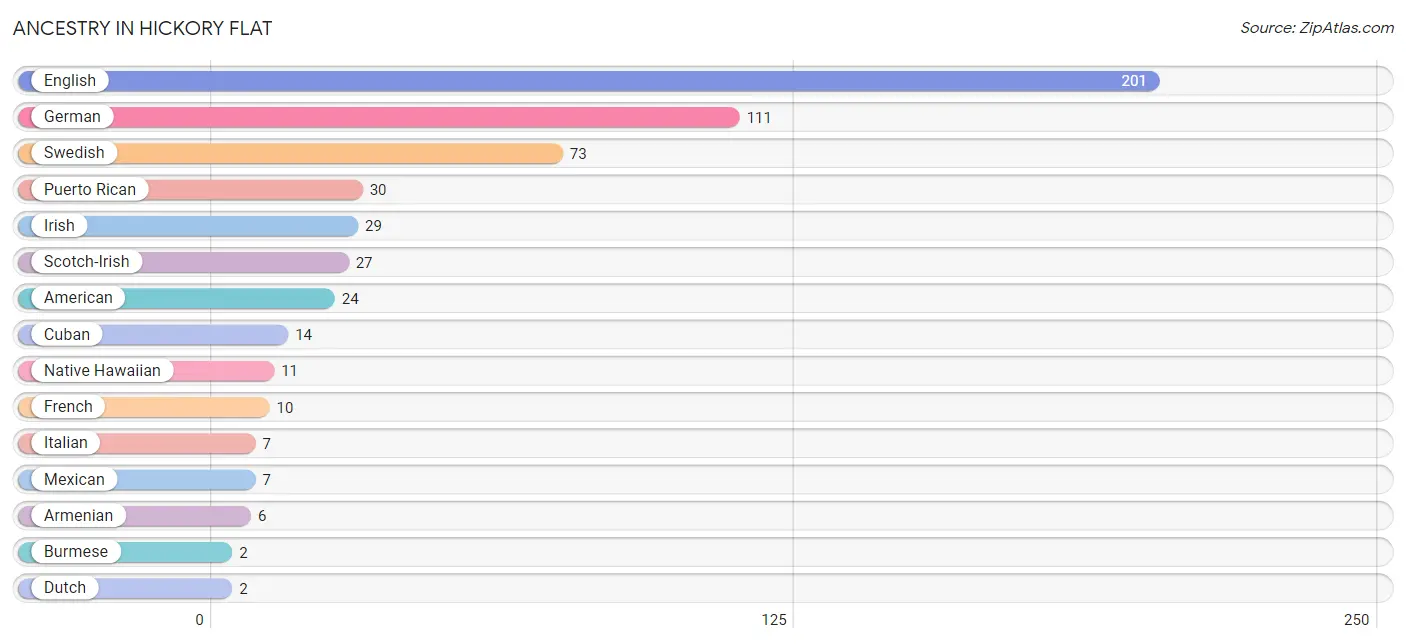
Ancestry in Hickory Flat
The most populous ancestries reported in Hickory Flat are English (201 | 27.5%), German (111 | 15.2%), Swedish (73 | 10.0%), Puerto Rican (30 | 4.1%), and Irish (29 | 4.0%), together accounting for 60.8% of all Hickory Flat residents.
| Ancestry | # Population | % Population |
| American | 24 | 3.3% |
| Armenian | 6 | 0.8% |
| Burmese | 2 | 0.3% |
| Cuban | 14 | 1.9% |
| Dutch | 2 | 0.3% |
| English | 201 | 27.5% |
| French | 10 | 1.4% |
| German | 111 | 15.2% |
| Irish | 29 | 4.0% |
| Italian | 7 | 1.0% |
| Mexican | 7 | 1.0% |
| Native Hawaiian | 11 | 1.5% |
| Puerto Rican | 30 | 4.1% |
| Scotch-Irish | 27 | 3.7% |
| Scottish | 1 | 0.1% |
| Swedish | 73 | 10.0% | View All 16 Rows |
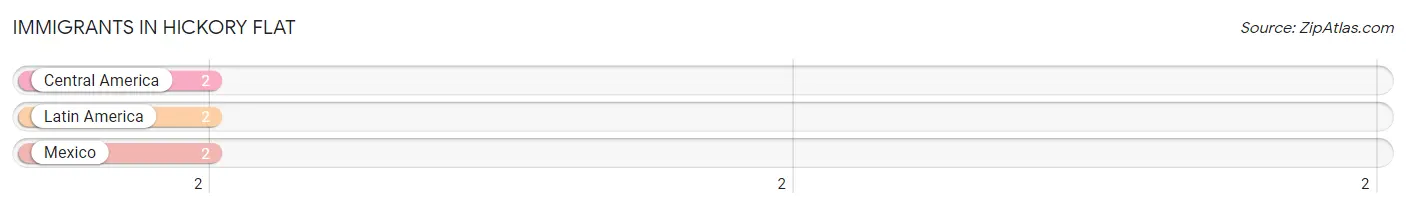
Immigrants in Hickory Flat
The most numerous immigrant groups reported in Hickory Flat came from Central America (2 | 0.3%), Latin America (2 | 0.3%), and Mexico (2 | 0.3%), together accounting for 0.8% of all Hickory Flat residents.
| Immigration Origin | # Population | % Population |
| Central America | 2 | 0.3% |
| Latin America | 2 | 0.3% |
| Mexico | 2 | 0.3% | View All 3 Rows |
Sex and Age in Hickory Flat
Sex and Age in Hickory Flat
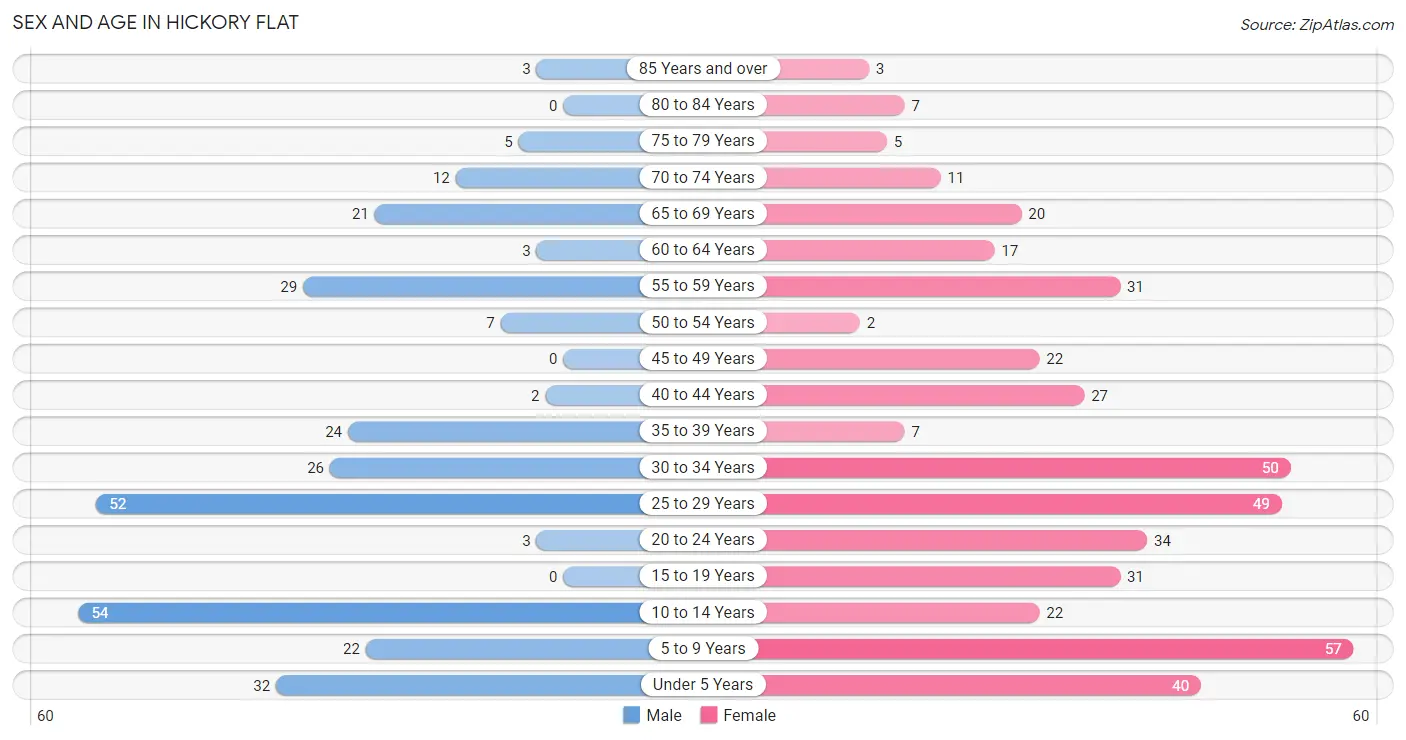
The most populous age groups in Hickory Flat are 10 to 14 Years (54 | 18.3%) for men and 5 to 9 Years (57 | 13.1%) for women.
| Age Bracket | Male | Female |
| Under 5 Years | 32 (10.8%) | 40 (9.2%) |
| 5 to 9 Years | 22 (7.5%) | 57 (13.1%) |
| 10 to 14 Years | 54 (18.3%) | 22 (5.1%) |
| 15 to 19 Years | 0 (0.0%) | 31 (7.1%) |
| 20 to 24 Years | 3 (1.0%) | 34 (7.8%) |
| 25 to 29 Years | 52 (17.6%) | 49 (11.3%) |
| 30 to 34 Years | 26 (8.8%) | 50 (11.5%) |
| 35 to 39 Years | 24 (8.1%) | 7 (1.6%) |
| 40 to 44 Years | 2 (0.7%) | 27 (6.2%) |
| 45 to 49 Years | 0 (0.0%) | 22 (5.1%) |
| 50 to 54 Years | 7 (2.4%) | 2 (0.5%) |
| 55 to 59 Years | 29 (9.8%) | 31 (7.1%) |
| 60 to 64 Years | 3 (1.0%) | 17 (3.9%) |
| 65 to 69 Years | 21 (7.1%) | 20 (4.6%) |
| 70 to 74 Years | 12 (4.1%) | 11 (2.5%) |
| 75 to 79 Years | 5 (1.7%) | 5 (1.1%) |
| 80 to 84 Years | 0 (0.0%) | 7 (1.6%) |
| 85 Years and over | 3 (1.0%) | 3 (0.7%) |
| Total | 295 (100.0%) | 435 (100.0%) |
Families and Households in Hickory Flat
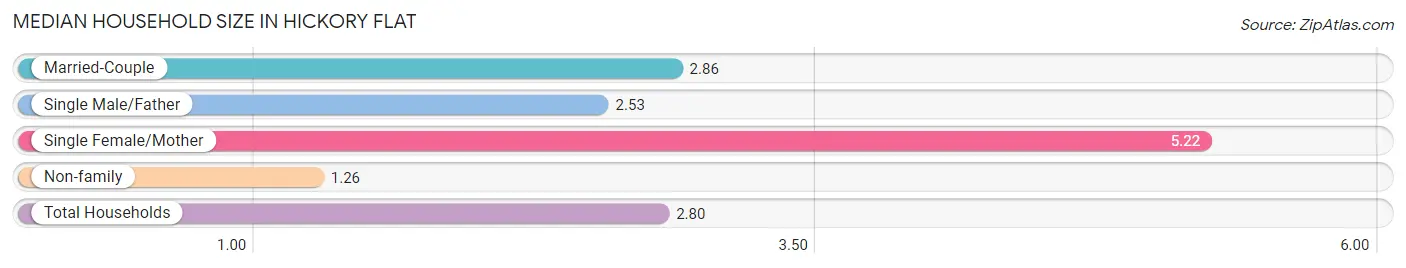
Median Family Size in Hickory Flat
The median family size in Hickory Flat is 3.50 persons per family, with single female/mother families (51 | 28.5%) accounting for the largest median family size of 5.22 persons per family. On the other hand, single male/father families (15 | 8.4%) represent the smallest median family size with 2.53 persons per family.

| Family Type | # Families | Family Size |
| Married-Couple | 113 (63.1%) | 2.86 |
| Single Male/Father | 15 (8.4%) | 2.53 |
| Single Female/Mother | 51 (28.5%) | 5.22 |
| Total Families | 179 (100.0%) | 3.50 |
Median Household Size in Hickory Flat
The median household size in Hickory Flat is 2.80 persons per household, with single female/mother households (51 | 19.5%) accounting for the largest median household size of 5.22 persons per household. non-family households (82 | 31.4%) represent the smallest median household size with 1.26 persons per household.
| Household Type | # Households | Household Size |
| Married-Couple | 113 (43.3%) | 2.86 |
| Single Male/Father | 15 (5.8%) | 2.53 |
| Single Female/Mother | 51 (19.5%) | 5.22 |
| Non-family | 82 (31.4%) | 1.26 |
| Total Households | 261 (100.0%) | 2.80 |
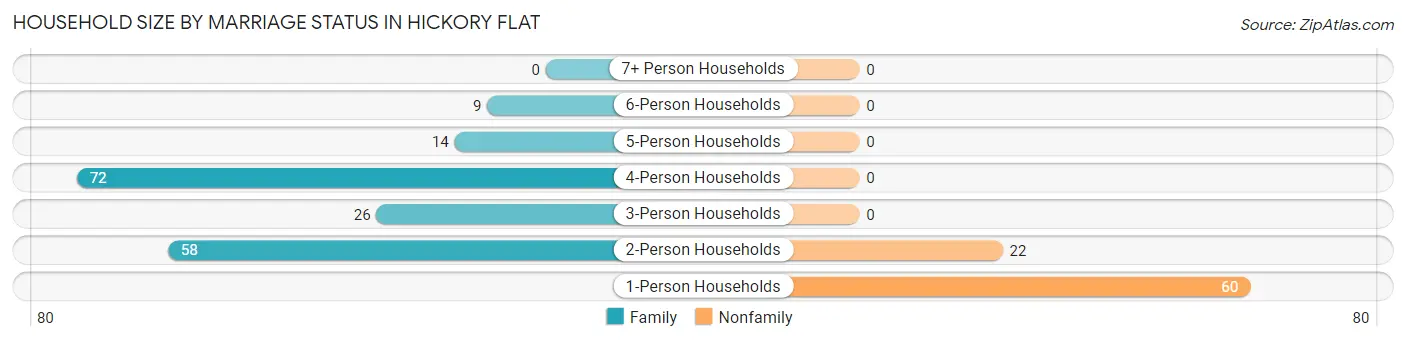
Household Size by Marriage Status in Hickory Flat
Out of a total of 261 households in Hickory Flat, 179 (68.6%) are family households, while 82 (31.4%) are nonfamily households. The most numerous type of family households are 4-person households, comprising 72, and the most common type of nonfamily households are 1-person households, comprising 60.
| Household Size | Family Households | Nonfamily Households |
| 1-Person Households | - | 60 (23.0%) |
| 2-Person Households | 58 (22.2%) | 22 (8.4%) |
| 3-Person Households | 26 (10.0%) | 0 (0.0%) |
| 4-Person Households | 72 (27.6%) | 0 (0.0%) |
| 5-Person Households | 14 (5.4%) | 0 (0.0%) |
| 6-Person Households | 9 (3.5%) | 0 (0.0%) |
| 7+ Person Households | 0 (0.0%) | 0 (0.0%) |
| Total | 179 (68.6%) | 82 (31.4%) |
Female Fertility in Hickory Flat
Fertility by Age in Hickory Flat
| Age Bracket | Women with Births | Births / 1,000 Women |
| 15 to 19 years | 0 (0.0%) | 0.0 |
| 20 to 34 years | 0 (0.0%) | 0.0 |
| 35 to 50 years | 0 (0.0%) | 0.0 |
| Total | 0 (0.0%) | 0.0 |
Fertility by Age by Marriage Status in Hickory Flat
| Age Bracket | Married | Unmarried |
| 15 to 19 years | 0 (0.0%) | 0 (0.0%) |
| 20 to 34 years | 0 (0.0%) | 0 (0.0%) |
| 35 to 50 years | 0 (0.0%) | 0 (0.0%) |
| Total | 0 (0.0%) | 0 (0.0%) |
Fertility by Education in Hickory Flat
| Educational Attainment | Women with Births | Births / 1,000 Women |
| Less than High School | 0 (0.0%) | 0.0 |
| High School Diploma | 0 (0.0%) | 0.0 |
| College or Associate's Degree | 0 (0.0%) | 0.0 |
| Bachelor's Degree | 0 (0.0%) | 0.0 |
| Graduate Degree | 0 (0.0%) | 0.0 |
| Total | 0 (0.0%) | 0.0 |
Fertility by Education by Marriage Status in Hickory Flat
| Educational Attainment | Married | Unmarried |
| Less than High School | 0 (0.0%) | 0 (0.0%) |
| High School Diploma | 0 (0.0%) | 0 (0.0%) |
| College or Associate's Degree | 0 (0.0%) | 0 (0.0%) |
| Bachelor's Degree | 0 (0.0%) | 0 (0.0%) |
| Graduate Degree | 0 (0.0%) | 0 (0.0%) |
| Total | 0 (0.0%) | 0 (0.0%) |
Income in Hickory Flat
Income Overview in Hickory Flat
Per Capita Income in Hickory Flat is $15,381, while median incomes of families and households are $34,844 and $33,219 respectively.
| Characteristic | Number | Measure |
| Per Capita Income | 730 | $15,381 |
| Median Family Income | 179 | $34,844 |
| Mean Family Income | 179 | $52,997 |
| Median Household Income | 261 | $33,219 |
| Mean Household Income | 261 | $44,602 |
| Income Deficit | 179 | $13,903 |
| Wage / Income Gap (%) | 730 | 10.53% |
| Wage / Income Gap ($) | 730 | 89.47¢ per $1 |
| Gini / Inequality Index | 730 | 0.41 |
Earnings by Sex in Hickory Flat
Average Earnings in Hickory Flat are $33,713, $36,731 for men and $32,863 for women, a difference of 10.5%.
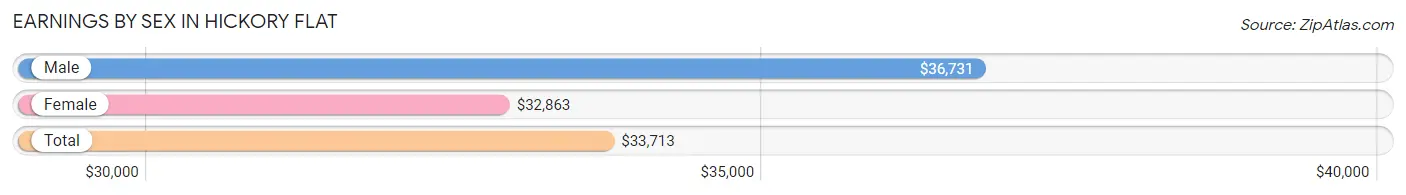
| Sex | Number | Average Earnings |
| Male | 104 (41.8%) | $36,731 |
| Female | 145 (58.2%) | $32,863 |
| Total | 249 (100.0%) | $33,713 |
Earnings by Sex by Income Bracket in Hickory Flat
The most common earnings brackets in Hickory Flat are $55,000 to $64,999 for men (17 | 16.4%) and $30,000 to $34,999 for women (31 | 21.4%).
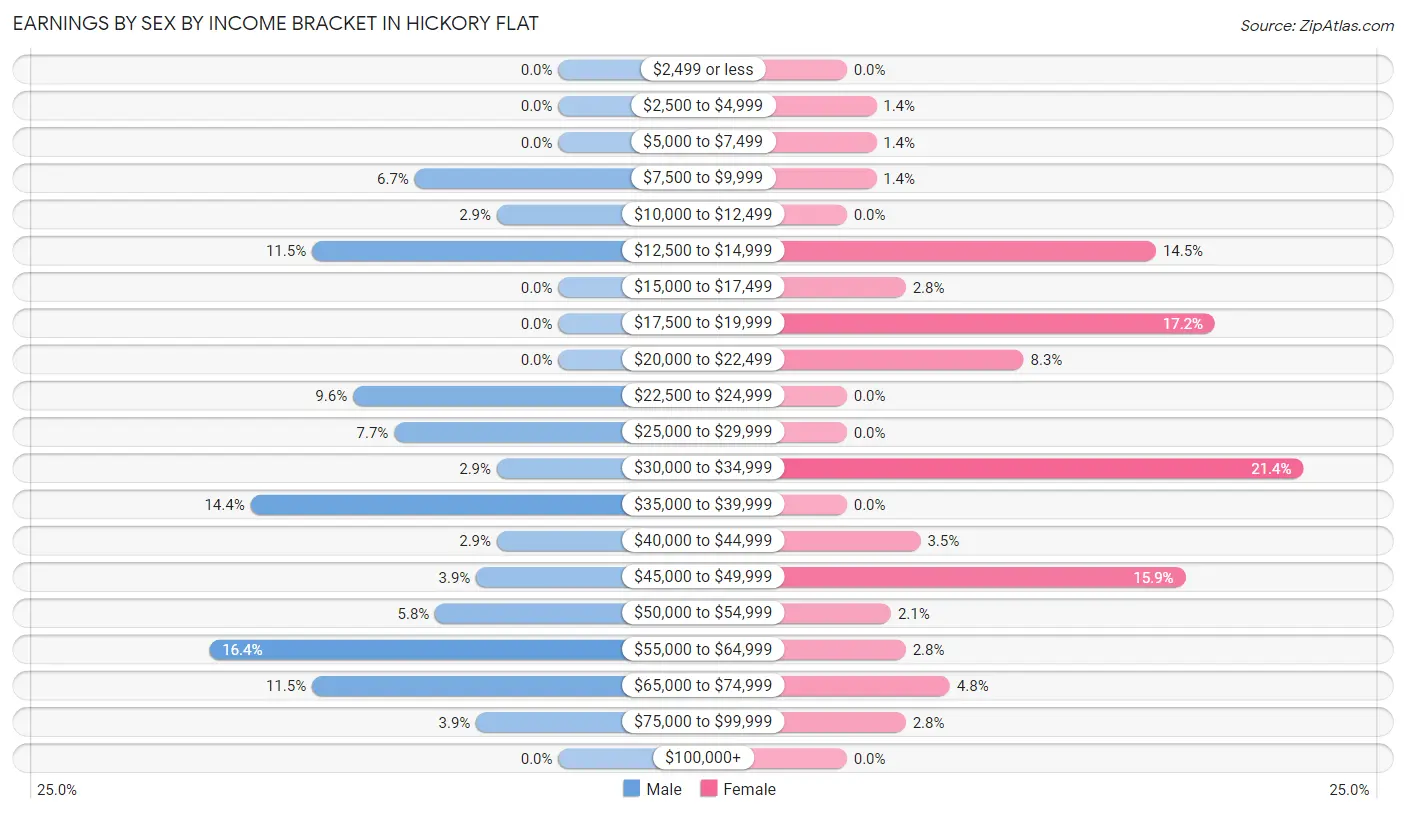
| Income | Male | Female |
| $2,499 or less | 0 (0.0%) | 0 (0.0%) |
| $2,500 to $4,999 | 0 (0.0%) | 2 (1.4%) |
| $5,000 to $7,499 | 0 (0.0%) | 2 (1.4%) |
| $7,500 to $9,999 | 7 (6.7%) | 2 (1.4%) |
| $10,000 to $12,499 | 3 (2.9%) | 0 (0.0%) |
| $12,500 to $14,999 | 12 (11.5%) | 21 (14.5%) |
| $15,000 to $17,499 | 0 (0.0%) | 4 (2.8%) |
| $17,500 to $19,999 | 0 (0.0%) | 25 (17.2%) |
| $20,000 to $22,499 | 0 (0.0%) | 12 (8.3%) |
| $22,500 to $24,999 | 10 (9.6%) | 0 (0.0%) |
| $25,000 to $29,999 | 8 (7.7%) | 0 (0.0%) |
| $30,000 to $34,999 | 3 (2.9%) | 31 (21.4%) |
| $35,000 to $39,999 | 15 (14.4%) | 0 (0.0%) |
| $40,000 to $44,999 | 3 (2.9%) | 5 (3.5%) |
| $45,000 to $49,999 | 4 (3.8%) | 23 (15.9%) |
| $50,000 to $54,999 | 6 (5.8%) | 3 (2.1%) |
| $55,000 to $64,999 | 17 (16.4%) | 4 (2.8%) |
| $65,000 to $74,999 | 12 (11.5%) | 7 (4.8%) |
| $75,000 to $99,999 | 4 (3.8%) | 4 (2.8%) |
| $100,000+ | 0 (0.0%) | 0 (0.0%) |
| Total | 104 (100.0%) | 145 (100.0%) |
Earnings by Sex by Educational Attainment in Hickory Flat
Average earnings in Hickory Flat are $37,019 for men and $33,468 for women, a difference of 9.6%. Men with an educational attainment of high school diploma enjoy the highest average annual earnings of $58,382, while those with college or associate's degree education earn the least with $28,438. Women with an educational attainment of bachelor's degree earn the most with the average annual earnings of $45,417, while those with college or associate's degree education have the smallest earnings of $18,650.
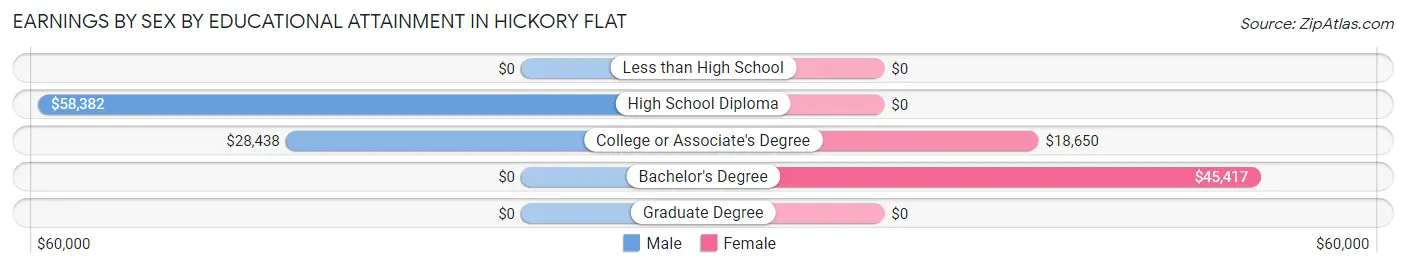
| Educational Attainment | Male Income | Female Income |
| Less than High School | - | - |
| High School Diploma | $58,382 | $0 |
| College or Associate's Degree | $28,438 | $18,650 |
| Bachelor's Degree | - | - |
| Graduate Degree | - | - |
| Total | $37,019 | $33,468 |
Family Income in Hickory Flat
Family Income Brackets in Hickory Flat
According to the Hickory Flat family income data, there are 46 families falling into the $25,000 to $34,999 income range, which is the most common income bracket and makes up 25.7% of all families.
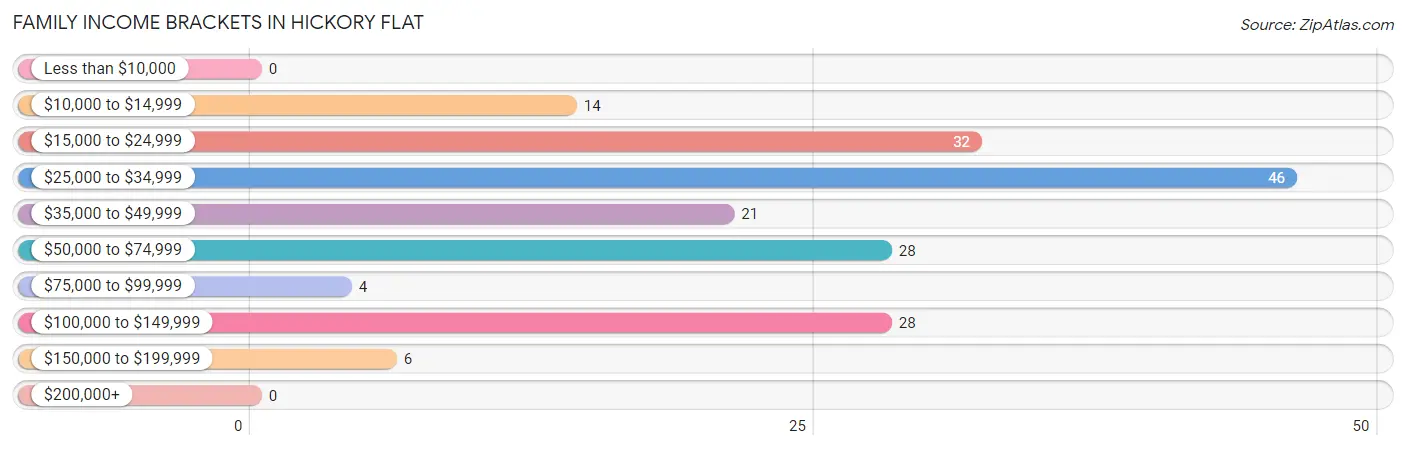
| Income Bracket | # Families | % Families |
| Less than $10,000 | 0 | 0.0% |
| $10,000 to $14,999 | 14 | 7.8% |
| $15,000 to $24,999 | 32 | 17.9% |
| $25,000 to $34,999 | 46 | 25.7% |
| $35,000 to $49,999 | 21 | 11.7% |
| $50,000 to $74,999 | 28 | 15.6% |
| $75,000 to $99,999 | 4 | 2.2% |
| $100,000 to $149,999 | 28 | 15.6% |
| $150,000 to $199,999 | 6 | 3.4% |
| $200,000+ | 0 | 0.0% |
Family Income by Famaliy Size in Hickory Flat
2-person families (58 | 32.4%) account for the highest median family income in Hickory Flat with $37,000 per family, while 2-person families (58 | 32.4%) have the highest median income of $18,500 per family member.
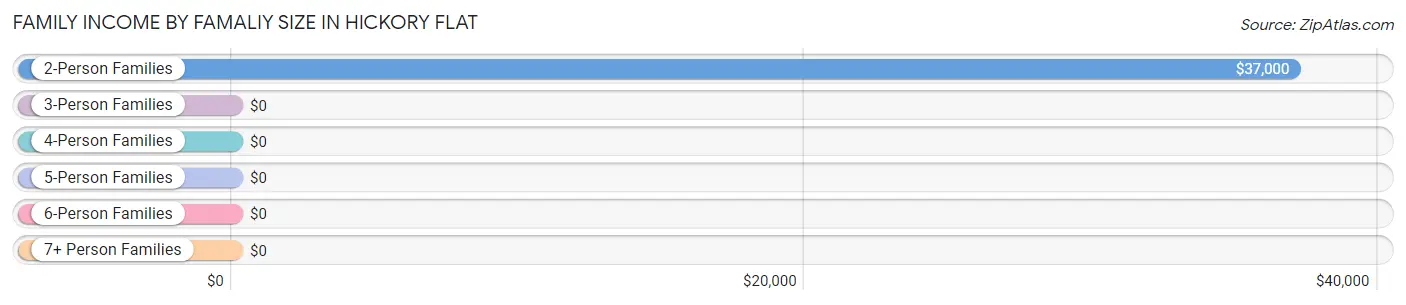
| Income Bracket | # Families | Median Income |
| 2-Person Families | 58 (32.4%) | $37,000 |
| 3-Person Families | 26 (14.5%) | $0 |
| 4-Person Families | 72 (40.2%) | $0 |
| 5-Person Families | 14 (7.8%) | $0 |
| 6-Person Families | 9 (5.0%) | $0 |
| 7+ Person Families | 0 (0.0%) | $0 |
| Total | 179 (100.0%) | $34,844 |
Family Income by Number of Earners in Hickory Flat
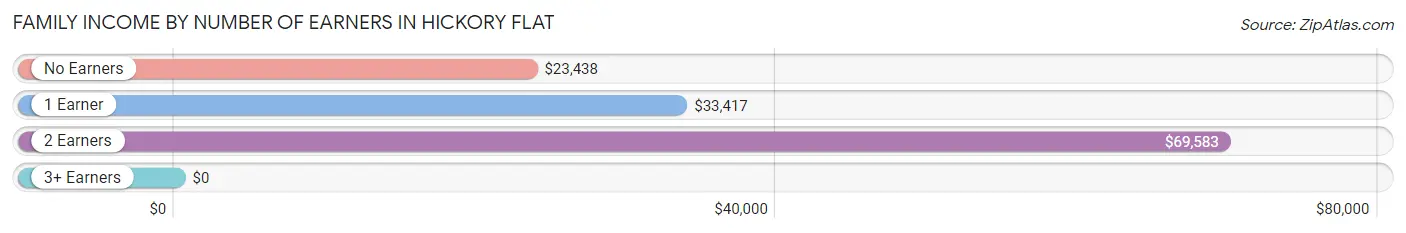
| Number of Earners | # Families | Median Income |
| No Earners | 41 (22.9%) | $23,438 |
| 1 Earner | 57 (31.8%) | $33,417 |
| 2 Earners | 81 (45.3%) | $69,583 |
| 3+ Earners | 0 (0.0%) | $0 |
| Total | 179 (100.0%) | $34,844 |
Household Income in Hickory Flat
Household Income Brackets in Hickory Flat
With 60 households falling in the category, the $15,000 to $24,999 income range is the most frequent in Hickory Flat, accounting for 23.0% of all households.
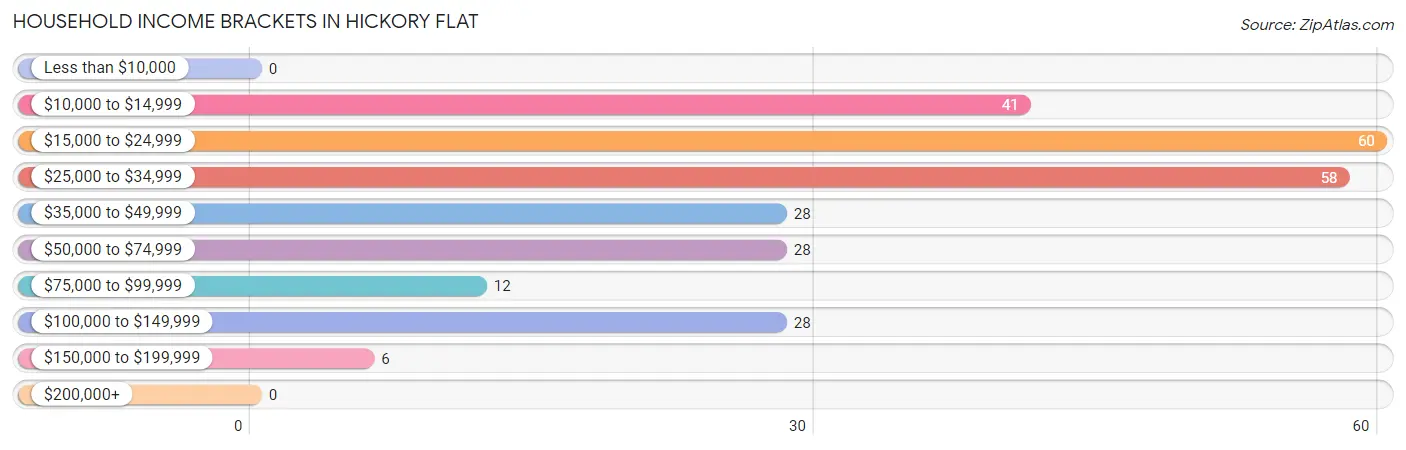
| Income Bracket | # Households | % Households |
| Less than $10,000 | 0 | 0.0% |
| $10,000 to $14,999 | 41 | 15.7% |
| $15,000 to $24,999 | 60 | 23.0% |
| $25,000 to $34,999 | 58 | 22.2% |
| $35,000 to $49,999 | 28 | 10.7% |
| $50,000 to $74,999 | 28 | 10.7% |
| $75,000 to $99,999 | 12 | 4.6% |
| $100,000 to $149,999 | 28 | 10.7% |
| $150,000 to $199,999 | 6 | 2.3% |
| $200,000+ | 0 | 0.0% |
Household Income by Householder Age in Hickory Flat
The median household income in Hickory Flat is $33,219, with the highest median household income of $48,571 found in the 25 to 44 years age bracket for the primary householder. A total of 104 households (39.9%) fall into this category. Meanwhile, the 15 to 24 years age bracket for the primary householder has the lowest median household income of $0, with 14 households (5.4%) in this group.
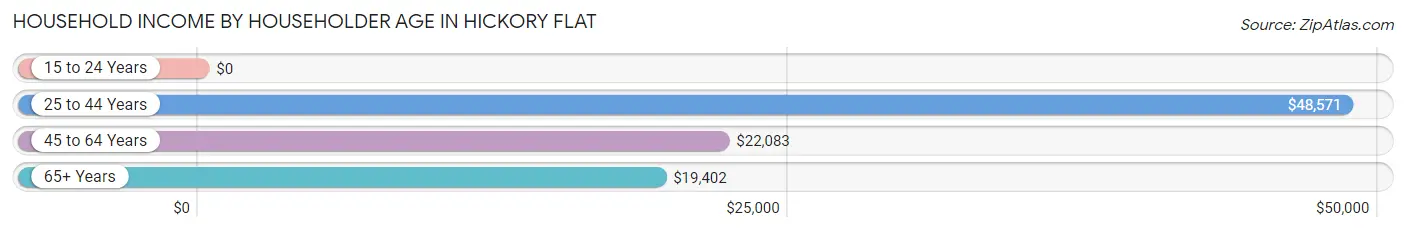
| Income Bracket | # Households | Median Income |
| 15 to 24 Years | 14 (5.4%) | $0 |
| 25 to 44 Years | 104 (39.9%) | $48,571 |
| 45 to 64 Years | 74 (28.3%) | $22,083 |
| 65+ Years | 69 (26.4%) | $19,402 |
| Total | 261 (100.0%) | $33,219 |
Poverty in Hickory Flat
Income Below Poverty by Sex and Age in Hickory Flat
With 21.2% poverty level for males and 43.9% for females among the residents of Hickory Flat, 25 to 34 year old males and 45 to 54 year old females are the most vulnerable to poverty, with 43 males (55.1%) and 22 females (91.7%) in their respective age groups living below the poverty level.
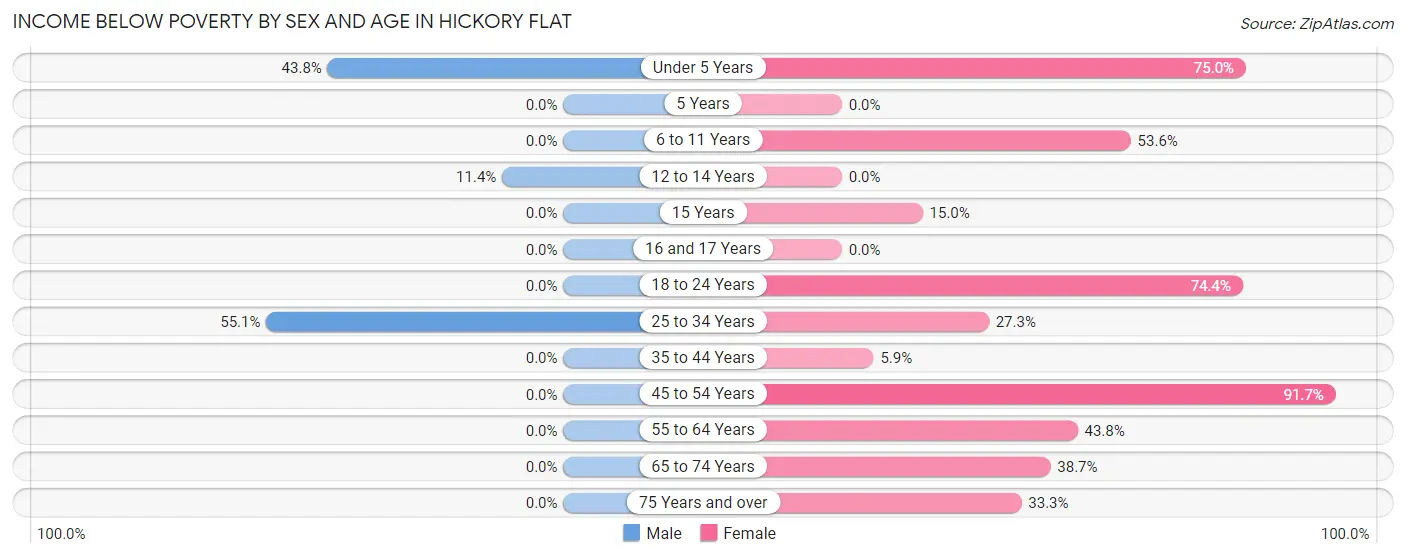
| Age Bracket | Male | Female |
| Under 5 Years | 14 (43.8%) | 30 (75.0%) |
| 5 Years | 0 (0.0%) | 0 (0.0%) |
| 6 to 11 Years | 0 (0.0%) | 37 (53.6%) |
| 12 to 14 Years | 5 (11.4%) | 0 (0.0%) |
| 15 Years | 0 (0.0%) | 3 (15.0%) |
| 16 and 17 Years | 0 (0.0%) | 0 (0.0%) |
| 18 to 24 Years | 0 (0.0%) | 32 (74.4%) |
| 25 to 34 Years | 43 (55.1%) | 27 (27.3%) |
| 35 to 44 Years | 0 (0.0%) | 2 (5.9%) |
| 45 to 54 Years | 0 (0.0%) | 22 (91.7%) |
| 55 to 64 Years | 0 (0.0%) | 21 (43.8%) |
| 65 to 74 Years | 0 (0.0%) | 12 (38.7%) |
| 75 Years and over | 0 (0.0%) | 5 (33.3%) |
| Total | 62 (21.2%) | 191 (43.9%) |
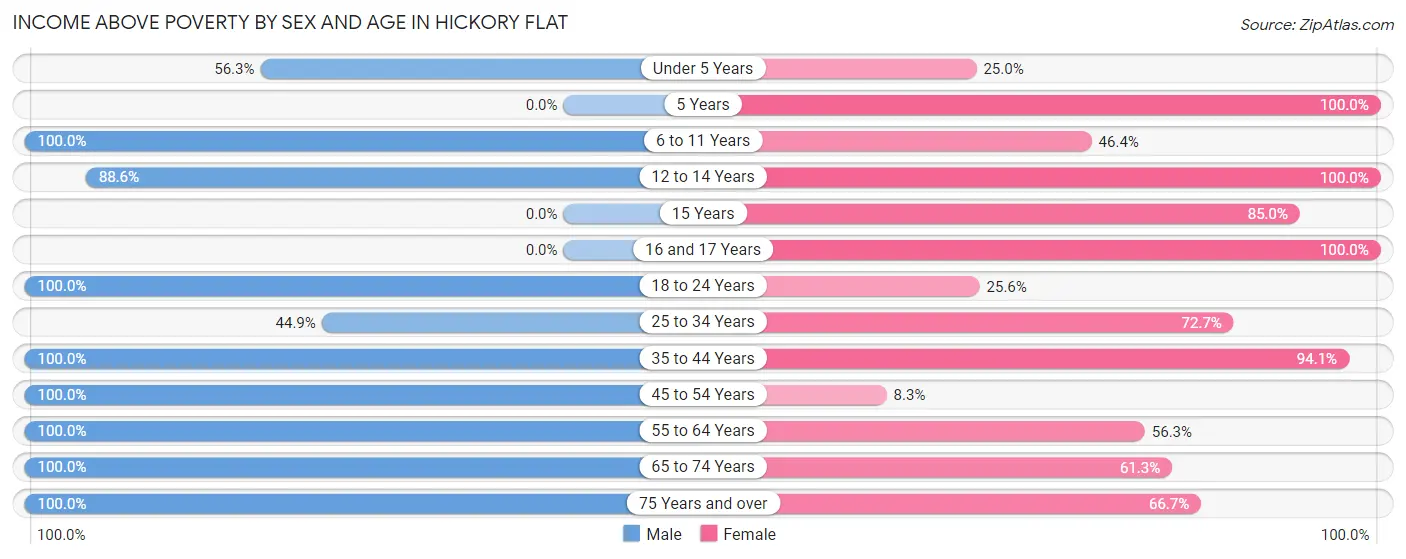
Income Above Poverty by Sex and Age in Hickory Flat
According to the poverty statistics in Hickory Flat, males aged 6 to 11 years and females aged 5 years are the age groups that are most secure financially, with 100.0% of males and 100.0% of females in these age groups living above the poverty line.
| Age Bracket | Male | Female |
| Under 5 Years | 18 (56.2%) | 10 (25.0%) |
| 5 Years | 0 (0.0%) | 1 (100.0%) |
| 6 to 11 Years | 30 (100.0%) | 32 (46.4%) |
| 12 to 14 Years | 39 (88.6%) | 9 (100.0%) |
| 15 Years | 0 (0.0%) | 17 (85.0%) |
| 16 and 17 Years | 0 (0.0%) | 2 (100.0%) |
| 18 to 24 Years | 3 (100.0%) | 11 (25.6%) |
| 25 to 34 Years | 35 (44.9%) | 72 (72.7%) |
| 35 to 44 Years | 26 (100.0%) | 32 (94.1%) |
| 45 to 54 Years | 7 (100.0%) | 2 (8.3%) |
| 55 to 64 Years | 32 (100.0%) | 27 (56.2%) |
| 65 to 74 Years | 33 (100.0%) | 19 (61.3%) |
| 75 Years and over | 8 (100.0%) | 10 (66.7%) |
| Total | 231 (78.8%) | 244 (56.1%) |
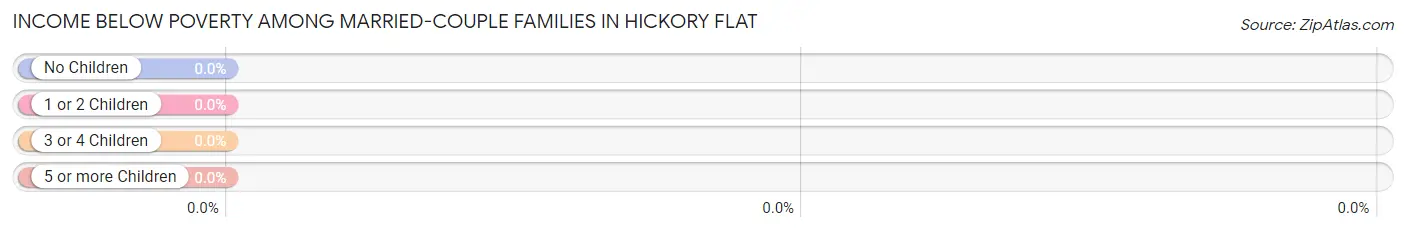
Income Below Poverty Among Married-Couple Families in Hickory Flat
| Children | Above Poverty | Below Poverty |
| No Children | 44 (100.0%) | 0 (0.0%) |
| 1 or 2 Children | 60 (100.0%) | 0 (0.0%) |
| 3 or 4 Children | 9 (100.0%) | 0 (0.0%) |
| 5 or more Children | 0 (0.0%) | 0 (0.0%) |
| Total | 113 (100.0%) | 0 (0.0%) |
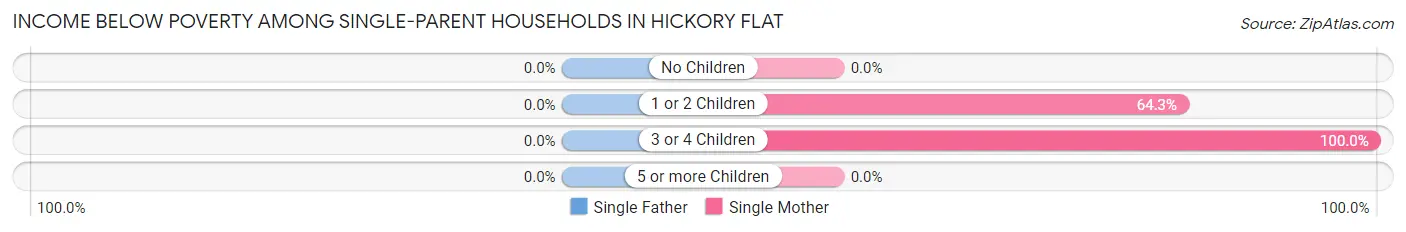
Income Below Poverty Among Single-Parent Households in Hickory Flat
| Children | Single Father | Single Mother |
| No Children | 0 (0.0%) | 0 (0.0%) |
| 1 or 2 Children | 0 (0.0%) | 27 (64.3%) |
| 3 or 4 Children | 0 (0.0%) | 2 (100.0%) |
| 5 or more Children | 0 (0.0%) | 0 (0.0%) |
| Total | 0 (0.0%) | 29 (56.9%) |
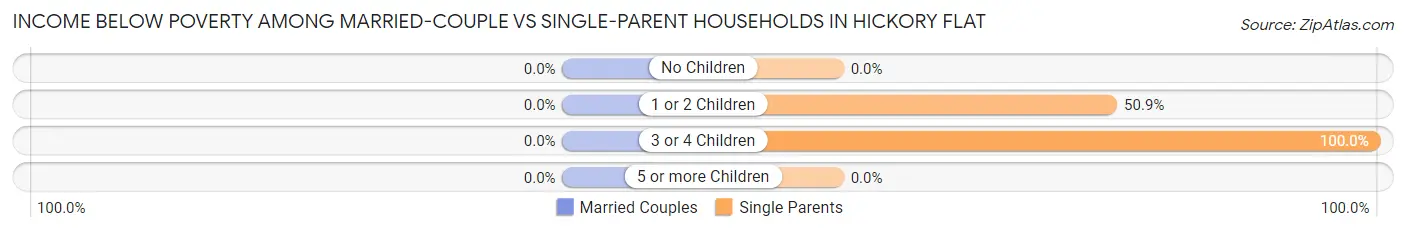
Income Below Poverty Among Married-Couple vs Single-Parent Households in Hickory Flat
| Children | Married-Couple Families | Single-Parent Households |
| No Children | 0 (0.0%) | 0 (0.0%) |
| 1 or 2 Children | 0 (0.0%) | 27 (50.9%) |
| 3 or 4 Children | 0 (0.0%) | 2 (100.0%) |
| 5 or more Children | 0 (0.0%) | 0 (0.0%) |
| Total | 0 (0.0%) | 29 (43.9%) |
Employment Characteristics in Hickory Flat
Employment by Class of Employer in Hickory Flat
Among the 217 employed individuals in Hickory Flat, private company employees (144 | 66.4%), state government employees (49 | 22.6%), and local government employees (12 | 5.5%) make up the most common classes of employment.
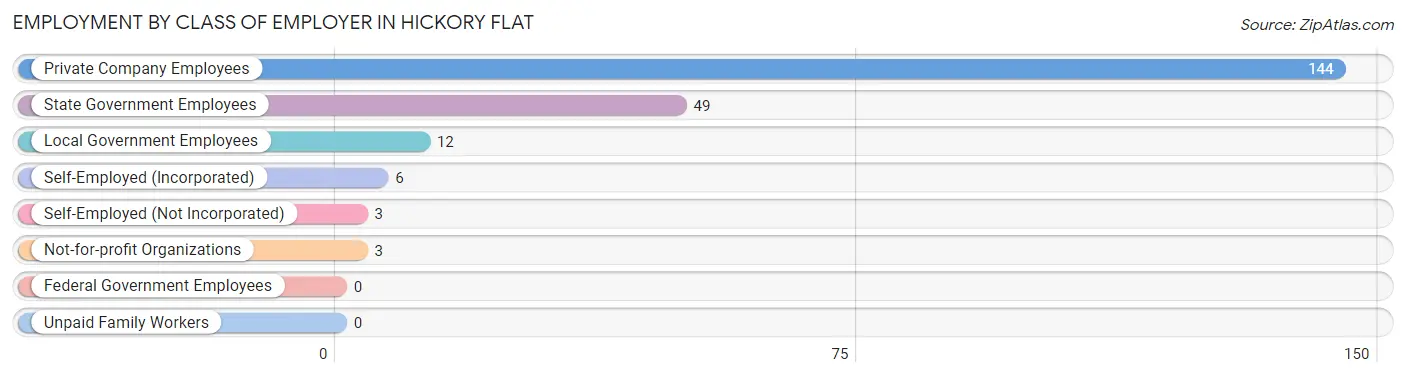
| Employer Class | # Employees | % Employees |
| Private Company Employees | 144 | 66.4% |
| Self-Employed (Incorporated) | 6 | 2.8% |
| Self-Employed (Not Incorporated) | 3 | 1.4% |
| Not-for-profit Organizations | 3 | 1.4% |
| Local Government Employees | 12 | 5.5% |
| State Government Employees | 49 | 22.6% |
| Federal Government Employees | 0 | 0.0% |
| Unpaid Family Workers | 0 | 0.0% |
| Total | 217 | 100.0% |
Employment Status by Age in Hickory Flat
According to the labor force statistics for Hickory Flat, out of the total population over 16 years of age (483), 51.1% or 247 individuals are in the labor force, with 12.1% or 30 of them unemployed. The age group with the highest labor force participation rate is 35 to 44 years, with 91.7% or 55 individuals in the labor force. Within the labor force, the 25 to 29 years age range has the highest percentage of unemployed individuals, with 35.4% or 23 of them being unemployed.
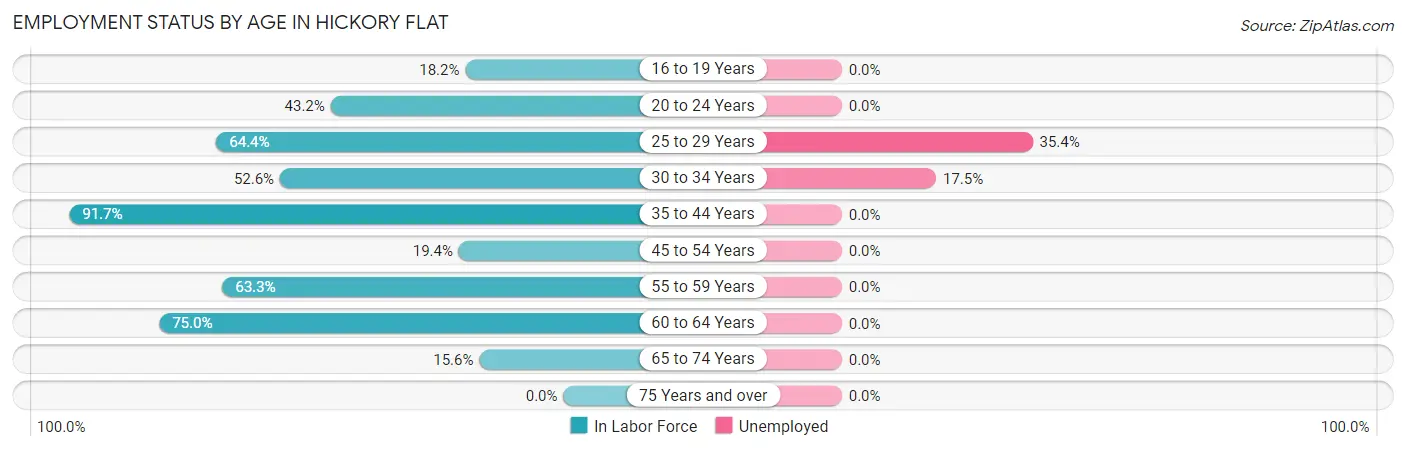
| Age Bracket | In Labor Force | Unemployed |
| 16 to 19 Years | 2 (18.2%) | 0 (0.0%) |
| 20 to 24 Years | 16 (43.2%) | 0 (0.0%) |
| 25 to 29 Years | 65 (64.4%) | 23 (35.4%) |
| 30 to 34 Years | 40 (52.6%) | 7 (17.5%) |
| 35 to 44 Years | 55 (91.7%) | 0 (0.0%) |
| 45 to 54 Years | 6 (19.4%) | 0 (0.0%) |
| 55 to 59 Years | 38 (63.3%) | 0 (0.0%) |
| 60 to 64 Years | 15 (75.0%) | 0 (0.0%) |
| 65 to 74 Years | 10 (15.6%) | 0 (0.0%) |
| 75 Years and over | 0 (0.0%) | 0 (0.0%) |
| Total | 247 (51.1%) | 30 (12.1%) |
Employment Status by Educational Attainment in Hickory Flat
According to labor force statistics for Hickory Flat, 62.9% of individuals (219) out of the total population between 25 and 64 years of age (348) are in the labor force, with 13.7% or 30 of them being unemployed. The group with the highest labor force participation rate are those with the educational attainment of less than high school, with 74.0% or 37 individuals in the labor force. Within the labor force, individuals with college / associate degree education have the highest percentage of unemployment, with 36.1% or 30 of them being unemployed.
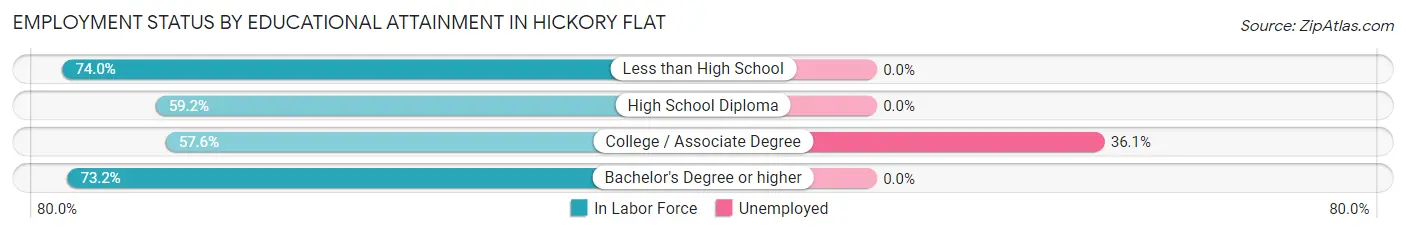
| Educational Attainment | In Labor Force | Unemployed |
| Less than High School | 37 (74.0%) | 0 (0.0%) |
| High School Diploma | 58 (59.2%) | 0 (0.0%) |
| College / Associate Degree | 83 (57.6%) | 52 (36.1%) |
| Bachelor's Degree or higher | 41 (73.2%) | 0 (0.0%) |
| Total | 219 (62.9%) | 48 (13.7%) |
Employment Occupations by Sex in Hickory Flat
Management, Business, Science and Arts Occupations
The most common Management, Business, Science and Arts occupations in Hickory Flat are Community & Social Service (33 | 15.2%), Education Instruction & Library (30 | 13.8%), Business & Financial (7 | 3.2%), Management (4 | 1.8%), and Education, Arts & Media (3 | 1.4%).
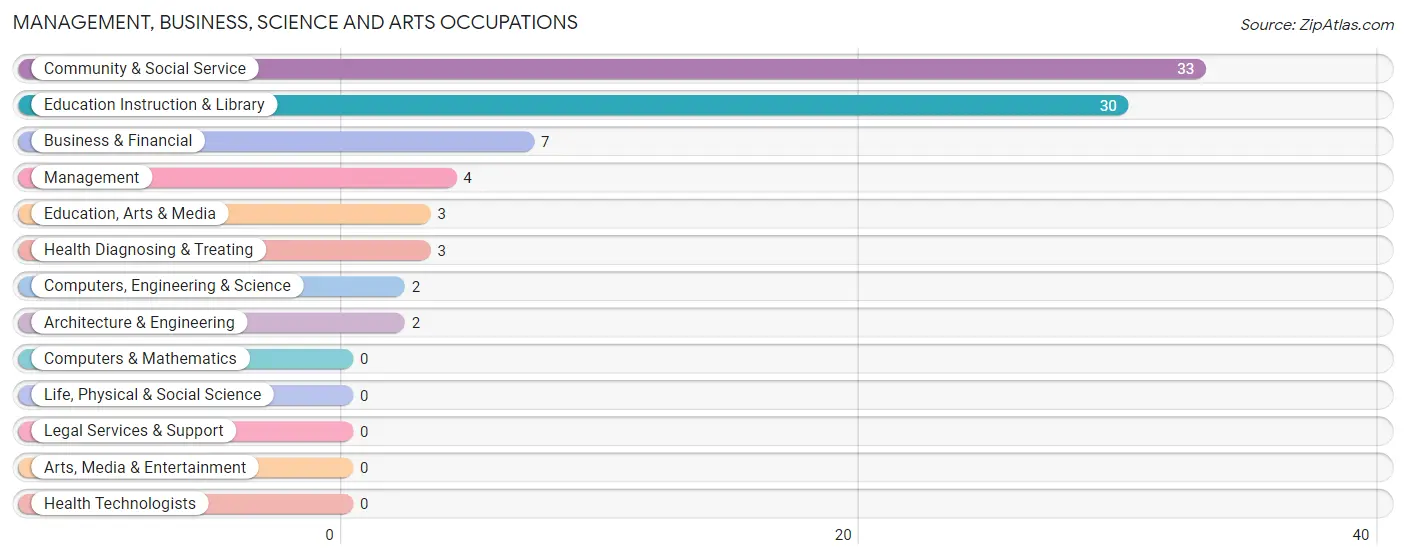
Management, Business, Science and Arts Occupations by Sex
Within the Management, Business, Science and Arts occupations in Hickory Flat, the most male-oriented occupations are Computers, Engineering & Science (100.0%), Architecture & Engineering (100.0%), and Education, Arts & Media (100.0%), while the most female-oriented occupations are Management (100.0%), Business & Financial (100.0%), and Education Instruction & Library (100.0%).
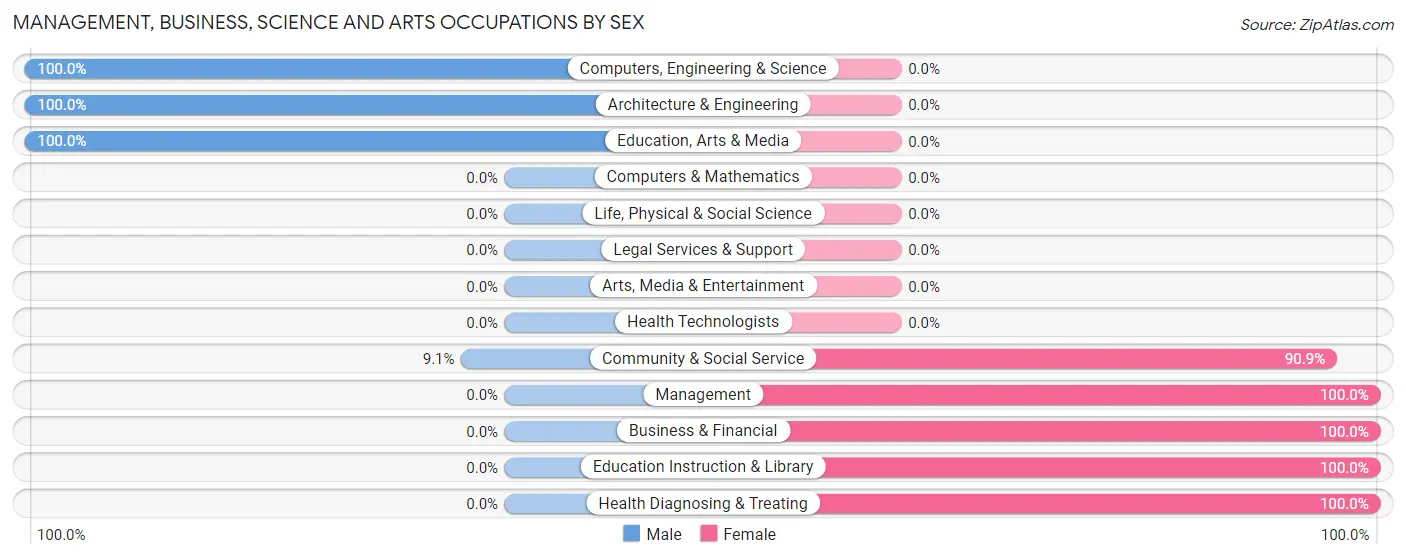
| Occupation | Male | Female |
| Management | 0 (0.0%) | 4 (100.0%) |
| Business & Financial | 0 (0.0%) | 7 (100.0%) |
| Computers, Engineering & Science | 2 (100.0%) | 0 (0.0%) |
| Computers & Mathematics | 0 (0.0%) | 0 (0.0%) |
| Architecture & Engineering | 2 (100.0%) | 0 (0.0%) |
| Life, Physical & Social Science | 0 (0.0%) | 0 (0.0%) |
| Community & Social Service | 3 (9.1%) | 30 (90.9%) |
| Education, Arts & Media | 3 (100.0%) | 0 (0.0%) |
| Legal Services & Support | 0 (0.0%) | 0 (0.0%) |
| Education Instruction & Library | 0 (0.0%) | 30 (100.0%) |
| Arts, Media & Entertainment | 0 (0.0%) | 0 (0.0%) |
| Health Diagnosing & Treating | 0 (0.0%) | 3 (100.0%) |
| Health Technologists | 0 (0.0%) | 0 (0.0%) |
| Total (Category) | 5 (10.2%) | 44 (89.8%) |
| Total (Overall) | 104 (47.9%) | 113 (52.1%) |
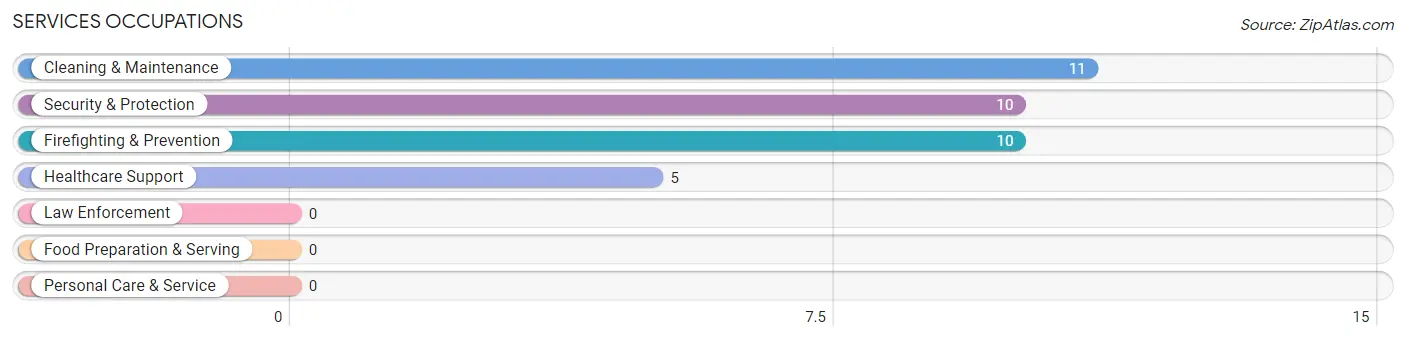
Services Occupations
The most common Services occupations in Hickory Flat are Cleaning & Maintenance (11 | 5.1%), Security & Protection (10 | 4.6%), Firefighting & Prevention (10 | 4.6%), and Healthcare Support (5 | 2.3%).
Services Occupations by Sex
Within the Services occupations in Hickory Flat, the most male-oriented occupations are Security & Protection (100.0%), and Firefighting & Prevention (100.0%), while the most female-oriented occupations are Healthcare Support (100.0%), and Cleaning & Maintenance (100.0%).
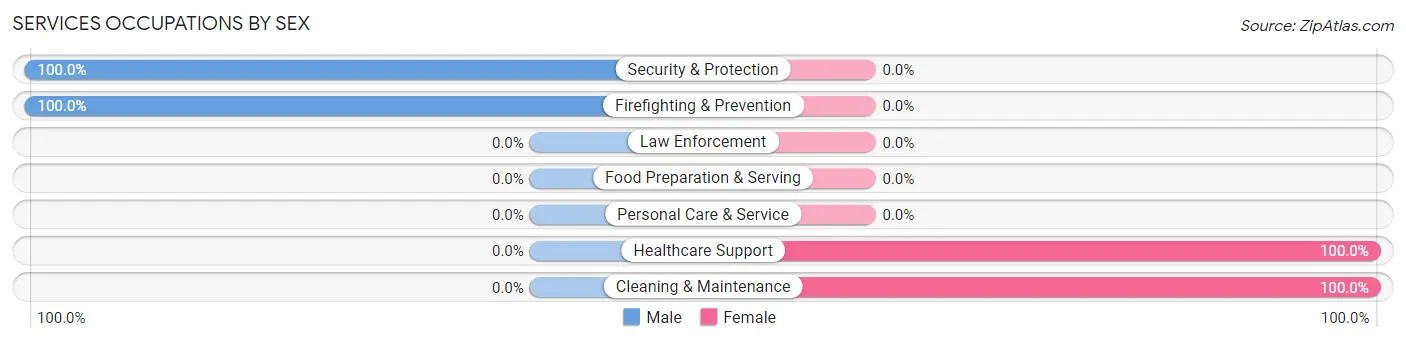
| Occupation | Male | Female |
| Healthcare Support | 0 (0.0%) | 5 (100.0%) |
| Security & Protection | 10 (100.0%) | 0 (0.0%) |
| Firefighting & Prevention | 10 (100.0%) | 0 (0.0%) |
| Law Enforcement | 0 (0.0%) | 0 (0.0%) |
| Food Preparation & Serving | 0 (0.0%) | 0 (0.0%) |
| Cleaning & Maintenance | 0 (0.0%) | 11 (100.0%) |
| Personal Care & Service | 0 (0.0%) | 0 (0.0%) |
| Total (Category) | 10 (38.5%) | 16 (61.5%) |
| Total (Overall) | 104 (47.9%) | 113 (52.1%) |
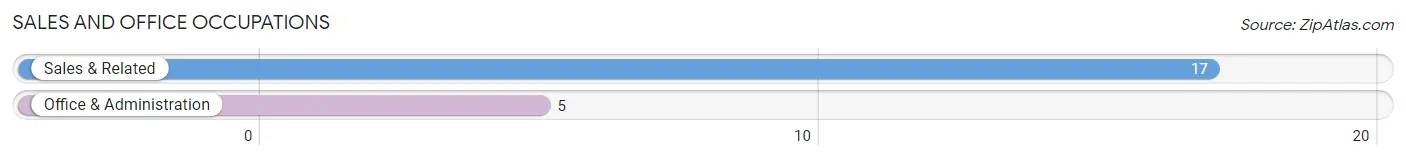
Sales and Office Occupations
The most common Sales and Office occupations in Hickory Flat are Sales & Related (17 | 7.8%), and Office & Administration (5 | 2.3%).
Sales and Office Occupations by Sex
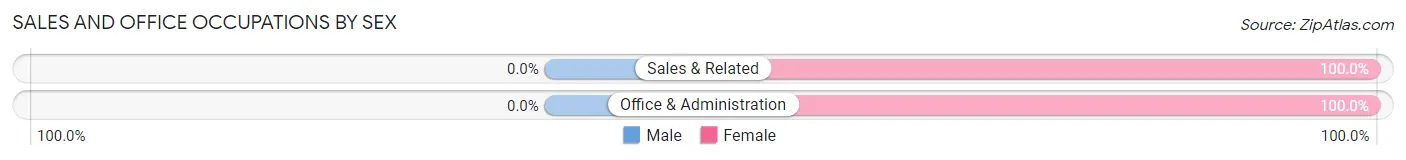
| Occupation | Male | Female |
| Sales & Related | 0 (0.0%) | 17 (100.0%) |
| Office & Administration | 0 (0.0%) | 5 (100.0%) |
| Total (Category) | 0 (0.0%) | 22 (100.0%) |
| Total (Overall) | 104 (47.9%) | 113 (52.1%) |
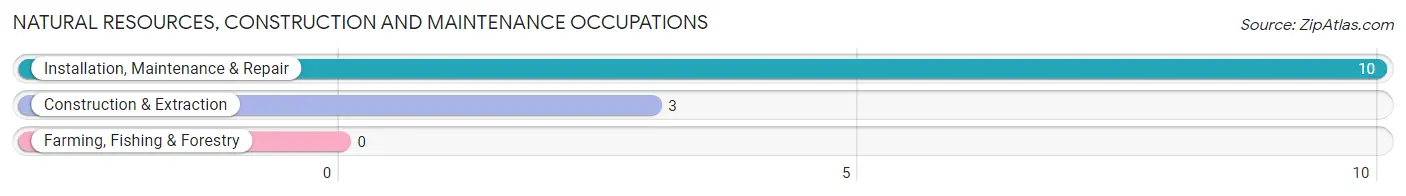
Natural Resources, Construction and Maintenance Occupations
The most common Natural Resources, Construction and Maintenance occupations in Hickory Flat are Installation, Maintenance & Repair (10 | 4.6%), and Construction & Extraction (3 | 1.4%).
Natural Resources, Construction and Maintenance Occupations by Sex
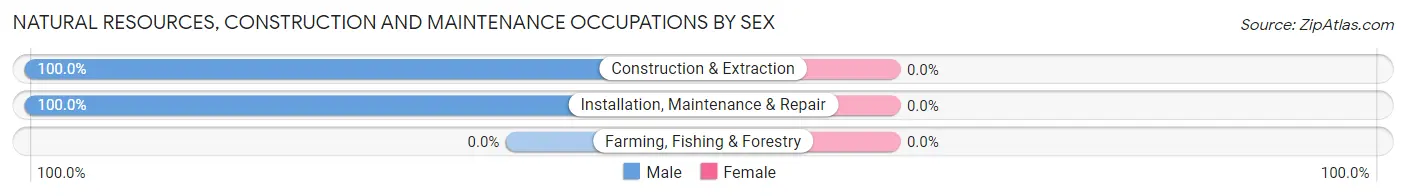
| Occupation | Male | Female |
| Farming, Fishing & Forestry | 0 (0.0%) | 0 (0.0%) |
| Construction & Extraction | 3 (100.0%) | 0 (0.0%) |
| Installation, Maintenance & Repair | 10 (100.0%) | 0 (0.0%) |
| Total (Category) | 13 (100.0%) | 0 (0.0%) |
| Total (Overall) | 104 (47.9%) | 113 (52.1%) |
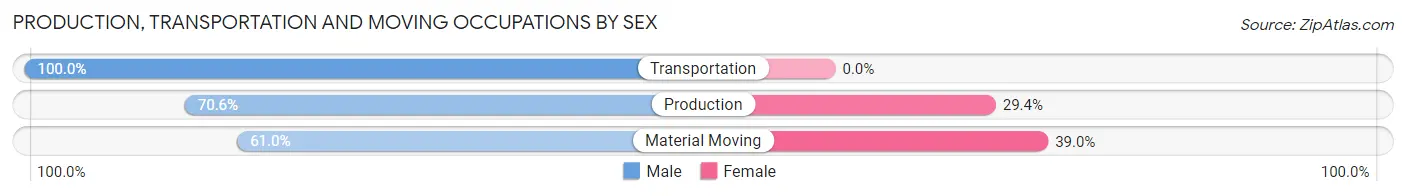
Production, Transportation and Moving Occupations
The most common Production, Transportation and Moving occupations in Hickory Flat are Production (51 | 23.5%), Material Moving (41 | 18.9%), and Transportation (15 | 6.9%).
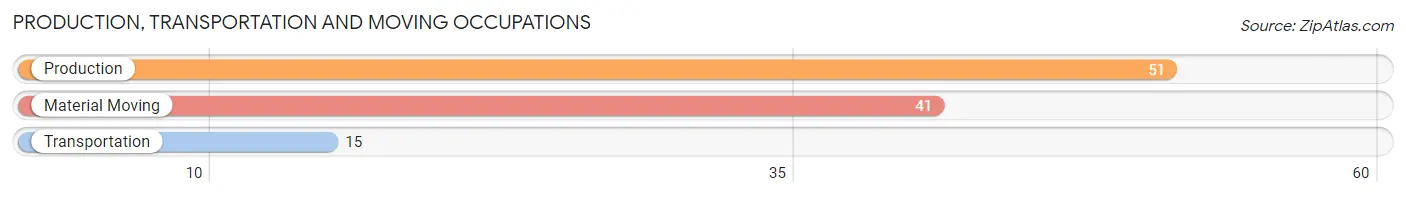
Production, Transportation and Moving Occupations by Sex
| Occupation | Male | Female |
| Production | 36 (70.6%) | 15 (29.4%) |
| Transportation | 15 (100.0%) | 0 (0.0%) |
| Material Moving | 25 (61.0%) | 16 (39.0%) |
| Total (Category) | 76 (71.0%) | 31 (29.0%) |
| Total (Overall) | 104 (47.9%) | 113 (52.1%) |
Employment Industries by Sex in Hickory Flat
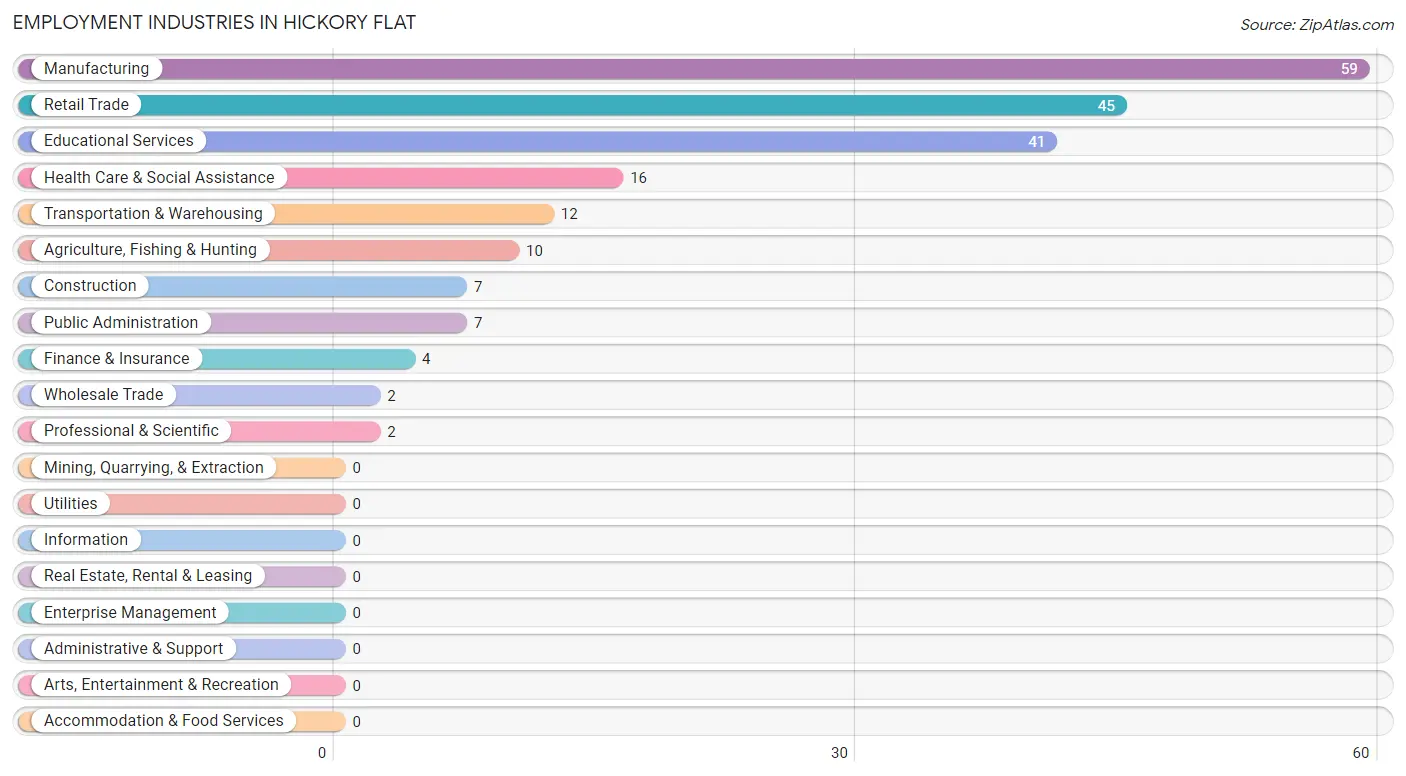
Employment Industries in Hickory Flat
The major employment industries in Hickory Flat include Manufacturing (59 | 27.2%), Retail Trade (45 | 20.7%), Educational Services (41 | 18.9%), Health Care & Social Assistance (16 | 7.4%), and Transportation & Warehousing (12 | 5.5%).
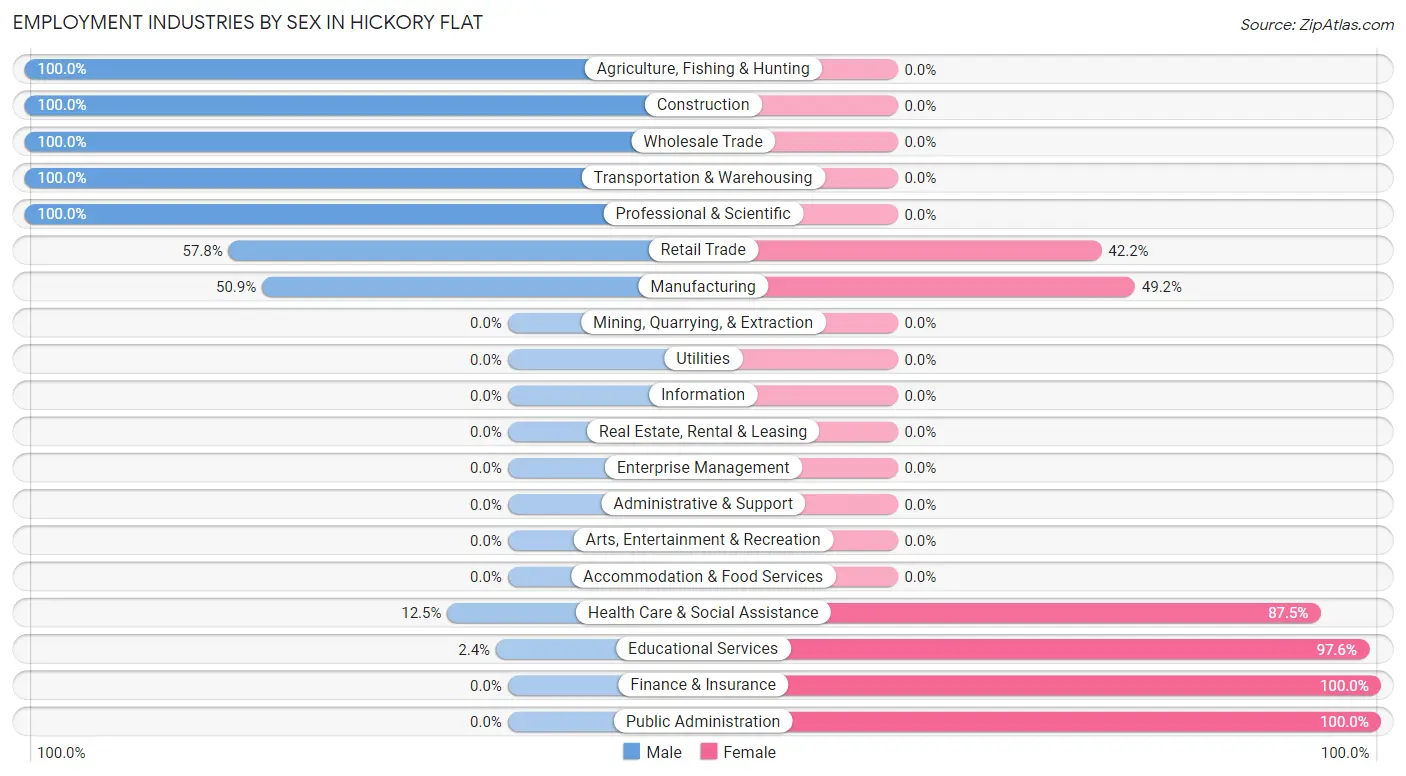
Employment Industries by Sex in Hickory Flat
The Hickory Flat industries that see more men than women are Agriculture, Fishing & Hunting (100.0%), Construction (100.0%), and Wholesale Trade (100.0%), whereas the industries that tend to have a higher number of women are Finance & Insurance (100.0%), Public Administration (100.0%), and Educational Services (97.6%).
| Industry | Male | Female |
| Agriculture, Fishing & Hunting | 10 (100.0%) | 0 (0.0%) |
| Mining, Quarrying, & Extraction | 0 (0.0%) | 0 (0.0%) |
| Construction | 7 (100.0%) | 0 (0.0%) |
| Manufacturing | 30 (50.8%) | 29 (49.1%) |
| Wholesale Trade | 2 (100.0%) | 0 (0.0%) |
| Retail Trade | 26 (57.8%) | 19 (42.2%) |
| Transportation & Warehousing | 12 (100.0%) | 0 (0.0%) |
| Utilities | 0 (0.0%) | 0 (0.0%) |
| Information | 0 (0.0%) | 0 (0.0%) |
| Finance & Insurance | 0 (0.0%) | 4 (100.0%) |
| Real Estate, Rental & Leasing | 0 (0.0%) | 0 (0.0%) |
| Professional & Scientific | 2 (100.0%) | 0 (0.0%) |
| Enterprise Management | 0 (0.0%) | 0 (0.0%) |
| Administrative & Support | 0 (0.0%) | 0 (0.0%) |
| Educational Services | 1 (2.4%) | 40 (97.6%) |
| Health Care & Social Assistance | 2 (12.5%) | 14 (87.5%) |
| Arts, Entertainment & Recreation | 0 (0.0%) | 0 (0.0%) |
| Accommodation & Food Services | 0 (0.0%) | 0 (0.0%) |
| Public Administration | 0 (0.0%) | 7 (100.0%) |
| Total | 104 (47.9%) | 113 (52.1%) |
Education in Hickory Flat
School Enrollment in Hickory Flat
The most common levels of schooling among the 212 students in Hickory Flat are elementary school (82 | 38.7%), high school (41 | 19.3%), and middle school (34 | 16.0%).

| School Level | # Students | % Students |
| Nursery / Preschool | 20 | 9.4% |
| Kindergarten | 16 | 7.5% |
| Elementary School | 82 | 38.7% |
| Middle School | 34 | 16.0% |
| High School | 41 | 19.3% |
| College / Undergraduate | 19 | 9.0% |
| Graduate / Professional | 0 | 0.0% |
| Total | 212 | 100.0% |
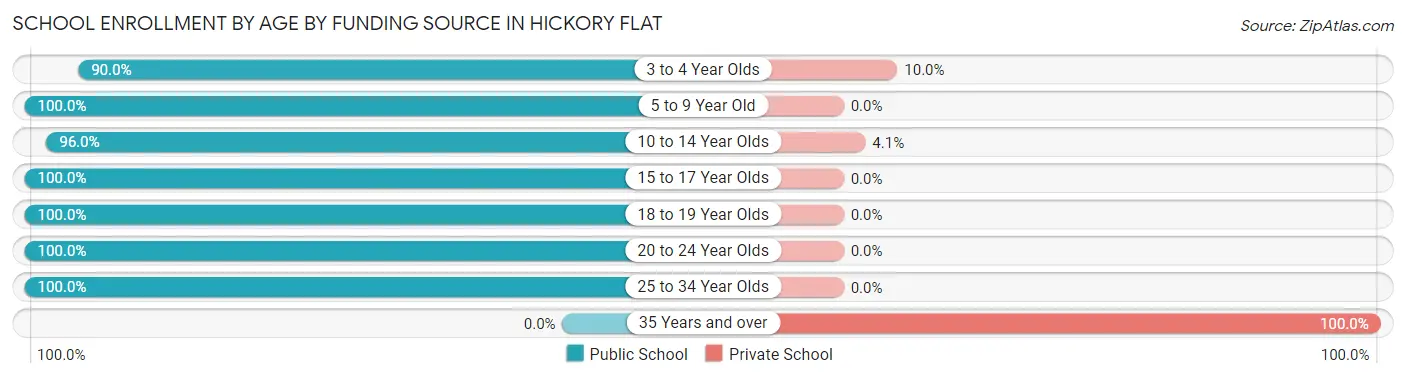
School Enrollment by Age by Funding Source in Hickory Flat
Out of a total of 212 students who are enrolled in schools in Hickory Flat, 6 (2.8%) attend a private institution, while the remaining 206 (97.2%) are enrolled in public schools. The age group of 35 years and over has the highest likelihood of being enrolled in private schools, with 1 (100.0% in the age bracket) enrolled. Conversely, the age group of 5 to 9 year old has the lowest likelihood of being enrolled in a private school, with 77 (100.0% in the age bracket) attending a public institution.
| Age Bracket | Public School | Private School |
| 3 to 4 Year Olds | 18 (90.0%) | 2 (10.0%) |
| 5 to 9 Year Old | 77 (100.0%) | 0 (0.0%) |
| 10 to 14 Year Olds | 71 (96.0%) | 3 (4.1%) |
| 15 to 17 Year Olds | 22 (100.0%) | 0 (0.0%) |
| 18 to 19 Year Olds | 9 (100.0%) | 0 (0.0%) |
| 20 to 24 Year Olds | 2 (100.0%) | 0 (0.0%) |
| 25 to 34 Year Olds | 7 (100.0%) | 0 (0.0%) |
| 35 Years and over | 0 (0.0%) | 1 (100.0%) |
| Total | 206 (97.2%) | 6 (2.8%) |
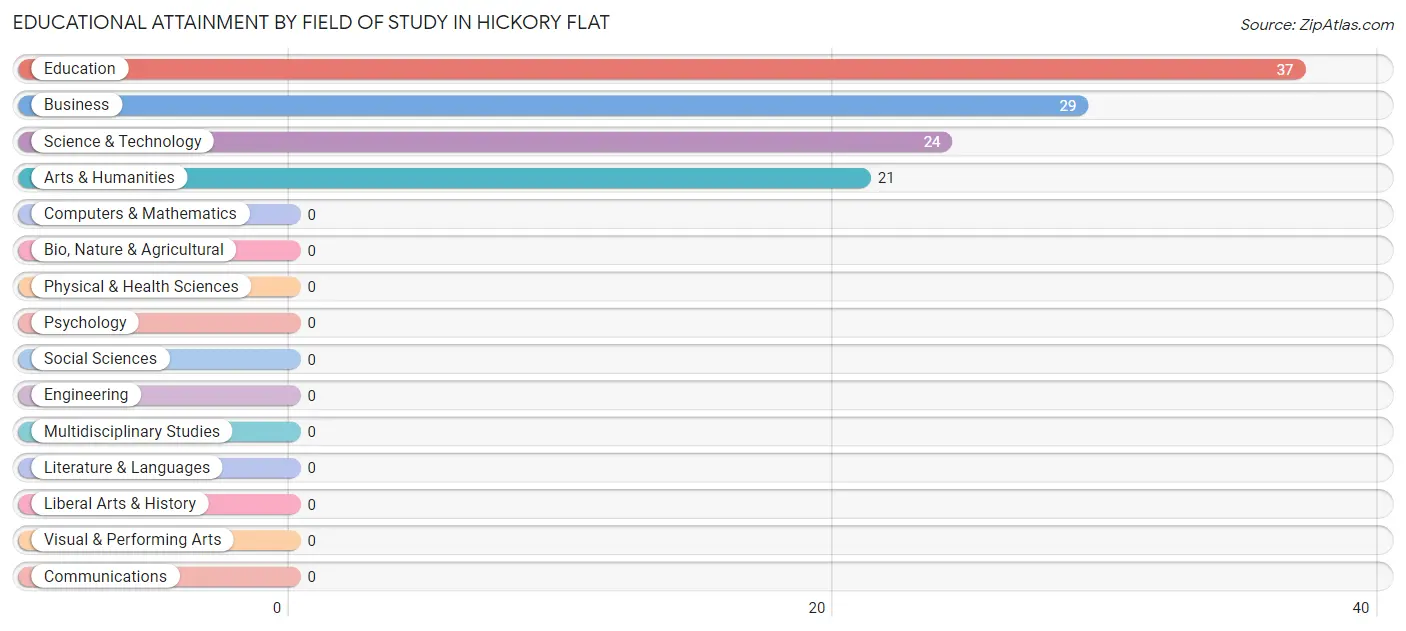
Educational Attainment by Field of Study in Hickory Flat
Education (37 | 33.3%), business (29 | 26.1%), science & technology (24 | 21.6%), and arts & humanities (21 | 18.9%) are the most common fields of study among 111 individuals in Hickory Flat who have obtained a bachelor's degree or higher.
| Field of Study | # Graduates | % Graduates |
| Computers & Mathematics | 0 | 0.0% |
| Bio, Nature & Agricultural | 0 | 0.0% |
| Physical & Health Sciences | 0 | 0.0% |
| Psychology | 0 | 0.0% |
| Social Sciences | 0 | 0.0% |
| Engineering | 0 | 0.0% |
| Multidisciplinary Studies | 0 | 0.0% |
| Science & Technology | 24 | 21.6% |
| Business | 29 | 26.1% |
| Education | 37 | 33.3% |
| Literature & Languages | 0 | 0.0% |
| Liberal Arts & History | 0 | 0.0% |
| Visual & Performing Arts | 0 | 0.0% |
| Communications | 0 | 0.0% |
| Arts & Humanities | 21 | 18.9% |
| Total | 111 | 100.0% |
Transportation & Commute in Hickory Flat
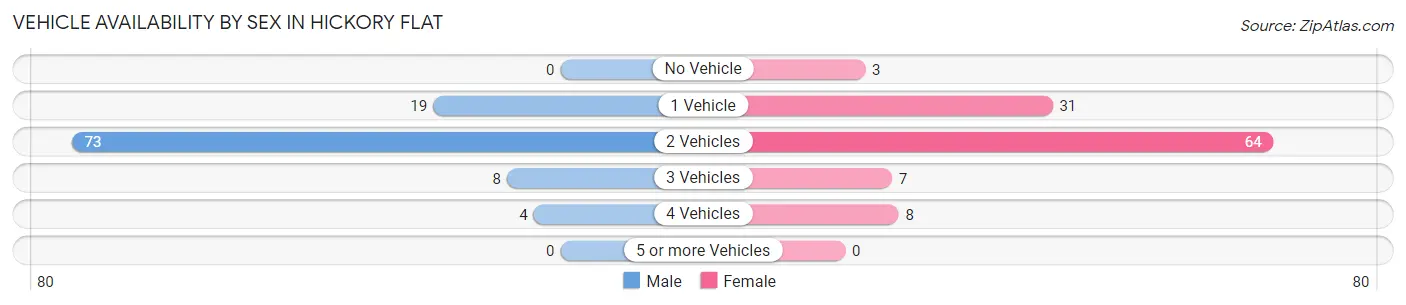
Vehicle Availability by Sex in Hickory Flat
The most prevalent vehicle ownership categories in Hickory Flat are males with 2 vehicles (73, accounting for 70.2%) and females with 2 vehicles (64, making up 64.6%).
| Vehicles Available | Male | Female |
| No Vehicle | 0 (0.0%) | 3 (2.6%) |
| 1 Vehicle | 19 (18.3%) | 31 (27.4%) |
| 2 Vehicles | 73 (70.2%) | 64 (56.6%) |
| 3 Vehicles | 8 (7.7%) | 7 (6.2%) |
| 4 Vehicles | 4 (3.8%) | 8 (7.1%) |
| 5 or more Vehicles | 0 (0.0%) | 0 (0.0%) |
| Total | 104 (100.0%) | 113 (100.0%) |
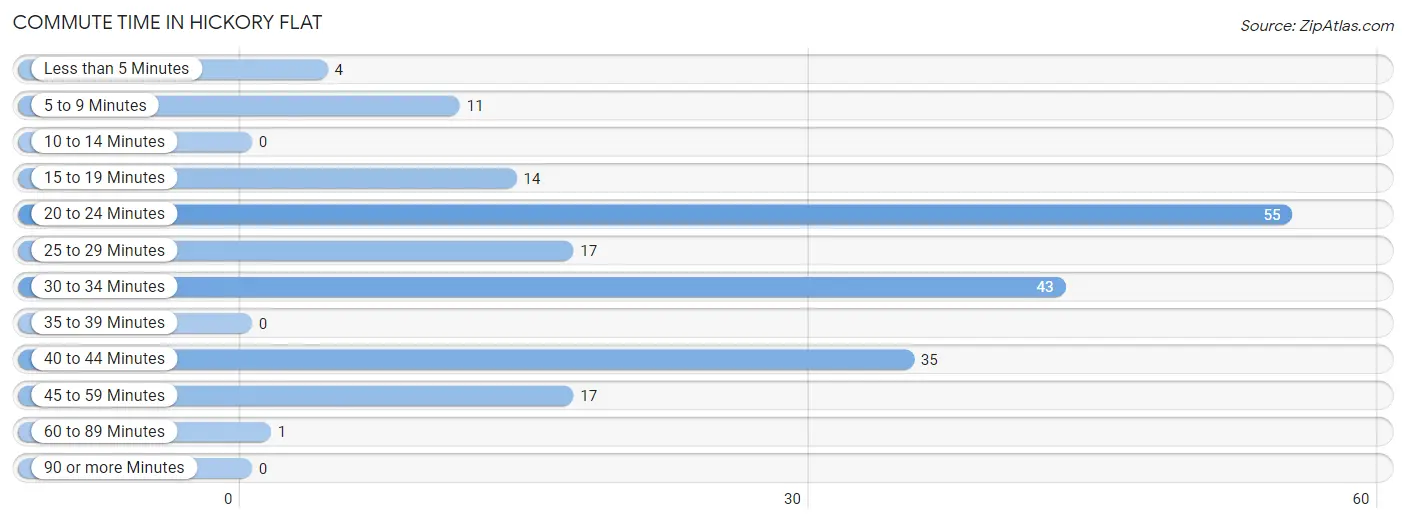
Commute Time in Hickory Flat
The most frequently occuring commute durations in Hickory Flat are 20 to 24 minutes (55 commuters, 27.9%), 30 to 34 minutes (43 commuters, 21.8%), and 40 to 44 minutes (35 commuters, 17.8%).
| Commute Time | # Commuters | % Commuters |
| Less than 5 Minutes | 4 | 2.0% |
| 5 to 9 Minutes | 11 | 5.6% |
| 10 to 14 Minutes | 0 | 0.0% |
| 15 to 19 Minutes | 14 | 7.1% |
| 20 to 24 Minutes | 55 | 27.9% |
| 25 to 29 Minutes | 17 | 8.6% |
| 30 to 34 Minutes | 43 | 21.8% |
| 35 to 39 Minutes | 0 | 0.0% |
| 40 to 44 Minutes | 35 | 17.8% |
| 45 to 59 Minutes | 17 | 8.6% |
| 60 to 89 Minutes | 1 | 0.5% |
| 90 or more Minutes | 0 | 0.0% |
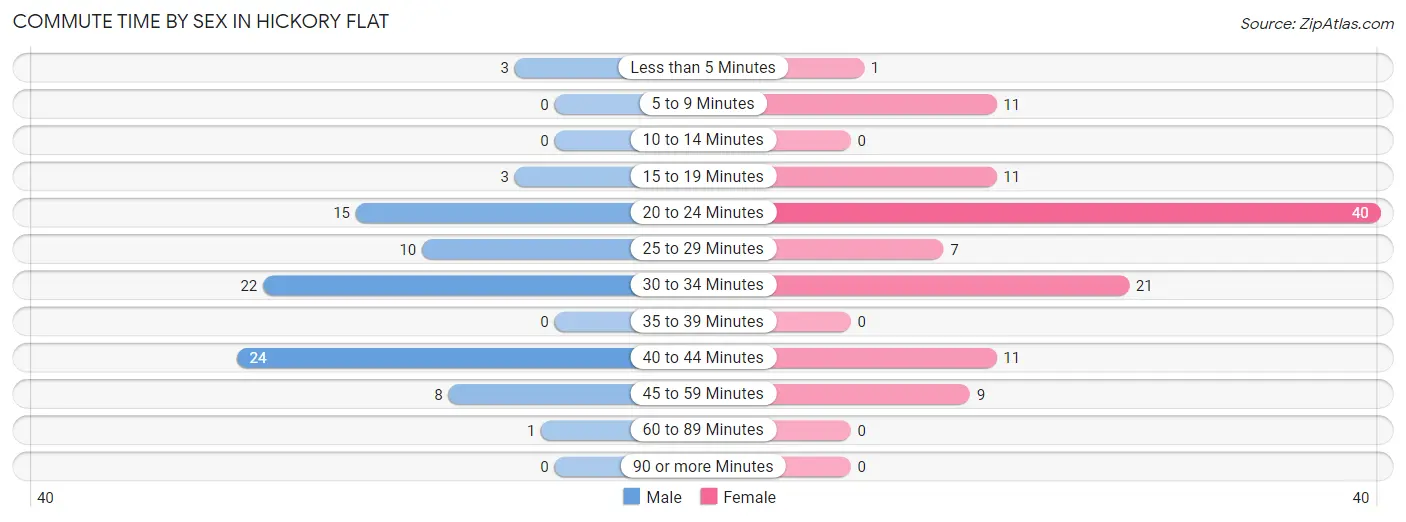
Commute Time by Sex in Hickory Flat
The most common commute times in Hickory Flat are 40 to 44 minutes (24 commuters, 27.9%) for males and 20 to 24 minutes (40 commuters, 36.0%) for females.
| Commute Time | Male | Female |
| Less than 5 Minutes | 3 (3.5%) | 1 (0.9%) |
| 5 to 9 Minutes | 0 (0.0%) | 11 (9.9%) |
| 10 to 14 Minutes | 0 (0.0%) | 0 (0.0%) |
| 15 to 19 Minutes | 3 (3.5%) | 11 (9.9%) |
| 20 to 24 Minutes | 15 (17.4%) | 40 (36.0%) |
| 25 to 29 Minutes | 10 (11.6%) | 7 (6.3%) |
| 30 to 34 Minutes | 22 (25.6%) | 21 (18.9%) |
| 35 to 39 Minutes | 0 (0.0%) | 0 (0.0%) |
| 40 to 44 Minutes | 24 (27.9%) | 11 (9.9%) |
| 45 to 59 Minutes | 8 (9.3%) | 9 (8.1%) |
| 60 to 89 Minutes | 1 (1.2%) | 0 (0.0%) |
| 90 or more Minutes | 0 (0.0%) | 0 (0.0%) |
Time of Departure to Work by Sex in Hickory Flat
The most frequent times of departure to work in Hickory Flat are 5:30 AM to 5:59 AM (36, 41.9%) for males and 6:30 AM to 6:59 AM (58, 52.2%) for females.

| Time of Departure | Male | Female |
| 12:00 AM to 4:59 AM | 17 (19.8%) | 0 (0.0%) |
| 5:00 AM to 5:29 AM | 0 (0.0%) | 0 (0.0%) |
| 5:30 AM to 5:59 AM | 36 (41.9%) | 0 (0.0%) |
| 6:00 AM to 6:29 AM | 11 (12.8%) | 10 (9.0%) |
| 6:30 AM to 6:59 AM | 10 (11.6%) | 58 (52.2%) |
| 7:00 AM to 7:29 AM | 0 (0.0%) | 19 (17.1%) |
| 7:30 AM to 7:59 AM | 0 (0.0%) | 0 (0.0%) |
| 8:00 AM to 8:29 AM | 0 (0.0%) | 6 (5.4%) |
| 8:30 AM to 8:59 AM | 3 (3.5%) | 11 (9.9%) |
| 9:00 AM to 9:59 AM | 0 (0.0%) | 0 (0.0%) |
| 10:00 AM to 10:59 AM | 3 (3.5%) | 0 (0.0%) |
| 11:00 AM to 11:59 AM | 0 (0.0%) | 0 (0.0%) |
| 12:00 PM to 3:59 PM | 0 (0.0%) | 0 (0.0%) |
| 4:00 PM to 11:59 PM | 6 (7.0%) | 7 (6.3%) |
| Total | 86 (100.0%) | 111 (100.0%) |
Housing Occupancy in Hickory Flat
Occupancy by Ownership in Hickory Flat
Of the total 261 dwellings in Hickory Flat, owner-occupied units account for 129 (49.4%), while renter-occupied units make up 132 (50.6%).
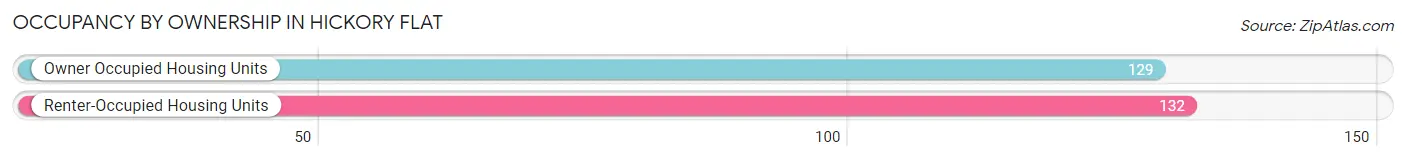
| Occupancy | # Housing Units | % Housing Units |
| Owner Occupied Housing Units | 129 | 49.4% |
| Renter-Occupied Housing Units | 132 | 50.6% |
| Total Occupied Housing Units | 261 | 100.0% |
Occupancy by Household Size in Hickory Flat
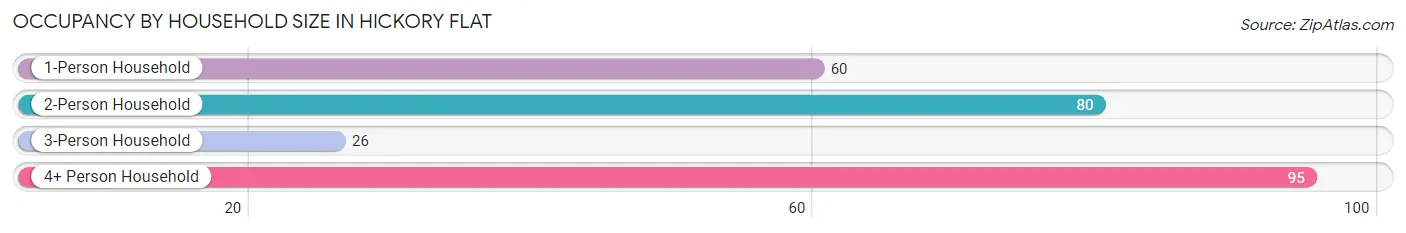
| Household Size | # Housing Units | % Housing Units |
| 1-Person Household | 60 | 23.0% |
| 2-Person Household | 80 | 30.6% |
| 3-Person Household | 26 | 10.0% |
| 4+ Person Household | 95 | 36.4% |
| Total Housing Units | 261 | 100.0% |
Occupancy by Ownership by Household Size in Hickory Flat
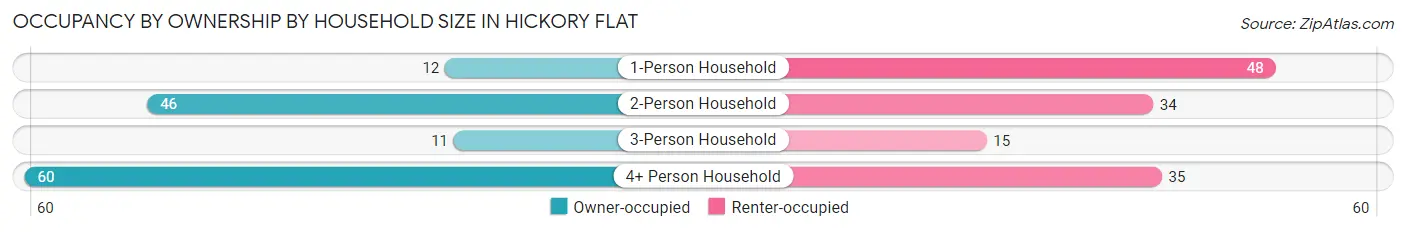
| Household Size | Owner-occupied | Renter-occupied |
| 1-Person Household | 12 (20.0%) | 48 (80.0%) |
| 2-Person Household | 46 (57.5%) | 34 (42.5%) |
| 3-Person Household | 11 (42.3%) | 15 (57.7%) |
| 4+ Person Household | 60 (63.2%) | 35 (36.8%) |
| Total Housing Units | 129 (49.4%) | 132 (50.6%) |
Occupancy by Educational Attainment in Hickory Flat
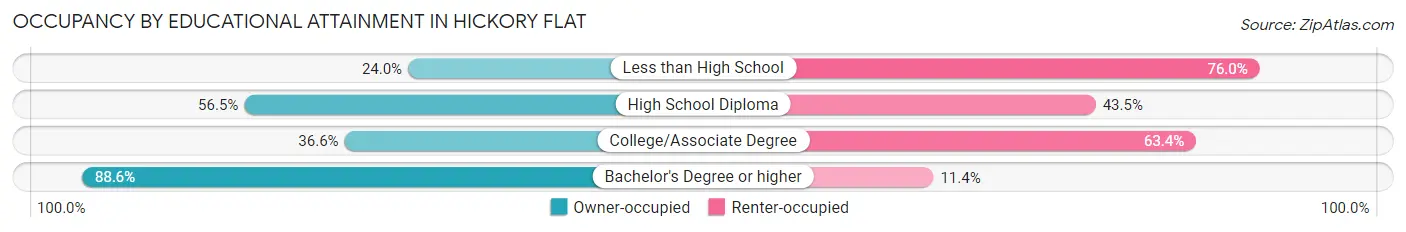
| Household Size | Owner-occupied | Renter-occupied |
| Less than High School | 12 (24.0%) | 38 (76.0%) |
| High School Diploma | 48 (56.5%) | 37 (43.5%) |
| College/Associate Degree | 30 (36.6%) | 52 (63.4%) |
| Bachelor's Degree or higher | 39 (88.6%) | 5 (11.4%) |
Occupancy by Age of Householder in Hickory Flat

| Age Bracket | # Households | % Households |
| Under 35 Years | 86 | 33.0% |
| 35 to 44 Years | 32 | 12.3% |
| 45 to 54 Years | 26 | 10.0% |
| 55 to 64 Years | 48 | 18.4% |
| 65 to 74 Years | 49 | 18.8% |
| 75 to 84 Years | 17 | 6.5% |
| 85 Years and Over | 3 | 1.1% |
| Total | 261 | 100.0% |
Housing Finances in Hickory Flat
Median Income by Occupancy in Hickory Flat
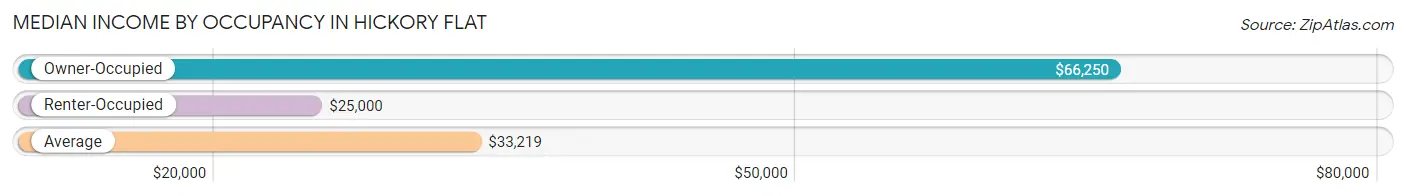
| Occupancy Type | # Households | Median Income |
| Owner-Occupied | 129 (49.4%) | $66,250 |
| Renter-Occupied | 132 (50.6%) | $25,000 |
| Average | 261 (100.0%) | $33,219 |
Occupancy by Householder Income Bracket in Hickory Flat
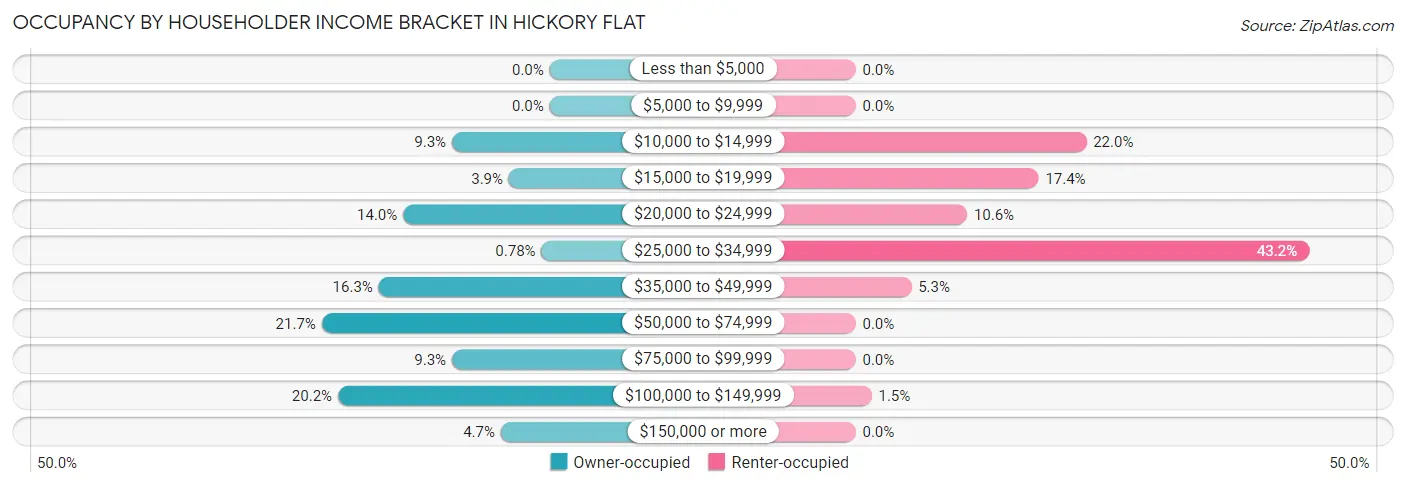
| Income Bracket | Owner-occupied | Renter-occupied |
| Less than $5,000 | 0 (0.0%) | 0 (0.0%) |
| $5,000 to $9,999 | 0 (0.0%) | 0 (0.0%) |
| $10,000 to $14,999 | 12 (9.3%) | 29 (22.0%) |
| $15,000 to $19,999 | 5 (3.9%) | 23 (17.4%) |
| $20,000 to $24,999 | 18 (14.0%) | 14 (10.6%) |
| $25,000 to $34,999 | 1 (0.8%) | 57 (43.2%) |
| $35,000 to $49,999 | 21 (16.3%) | 7 (5.3%) |
| $50,000 to $74,999 | 28 (21.7%) | 0 (0.0%) |
| $75,000 to $99,999 | 12 (9.3%) | 0 (0.0%) |
| $100,000 to $149,999 | 26 (20.2%) | 2 (1.5%) |
| $150,000 or more | 6 (4.6%) | 0 (0.0%) |
| Total | 129 (100.0%) | 132 (100.0%) |
Monthly Housing Cost Tiers in Hickory Flat
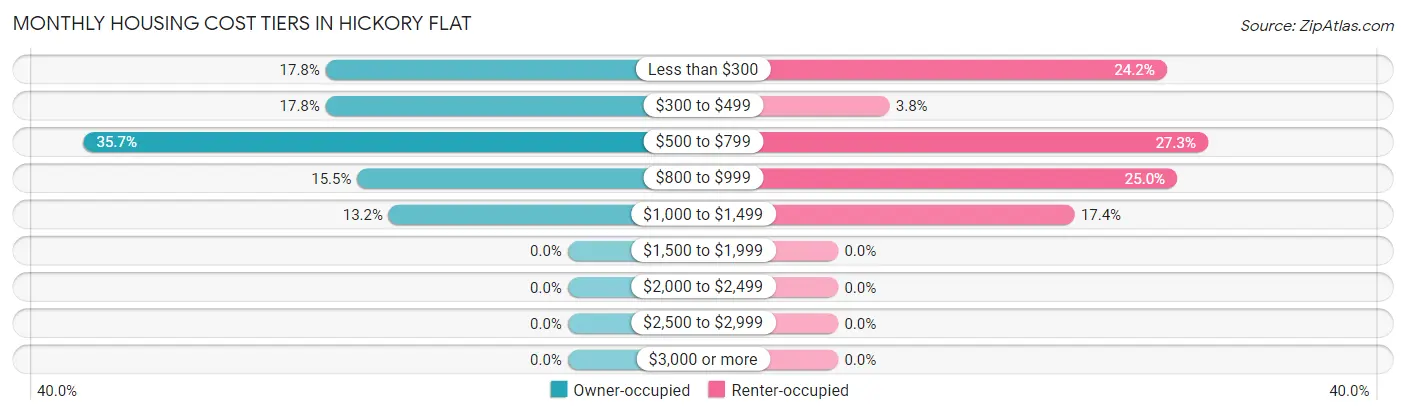
| Monthly Cost | Owner-occupied | Renter-occupied |
| Less than $300 | 23 (17.8%) | 32 (24.2%) |
| $300 to $499 | 23 (17.8%) | 5 (3.8%) |
| $500 to $799 | 46 (35.7%) | 36 (27.3%) |
| $800 to $999 | 20 (15.5%) | 33 (25.0%) |
| $1,000 to $1,499 | 17 (13.2%) | 23 (17.4%) |
| $1,500 to $1,999 | 0 (0.0%) | 0 (0.0%) |
| $2,000 to $2,499 | 0 (0.0%) | 0 (0.0%) |
| $2,500 to $2,999 | 0 (0.0%) | 0 (0.0%) |
| $3,000 or more | 0 (0.0%) | 0 (0.0%) |
| Total | 129 (100.0%) | 132 (100.0%) |
Physical Housing Characteristics in Hickory Flat
Housing Structures in Hickory Flat
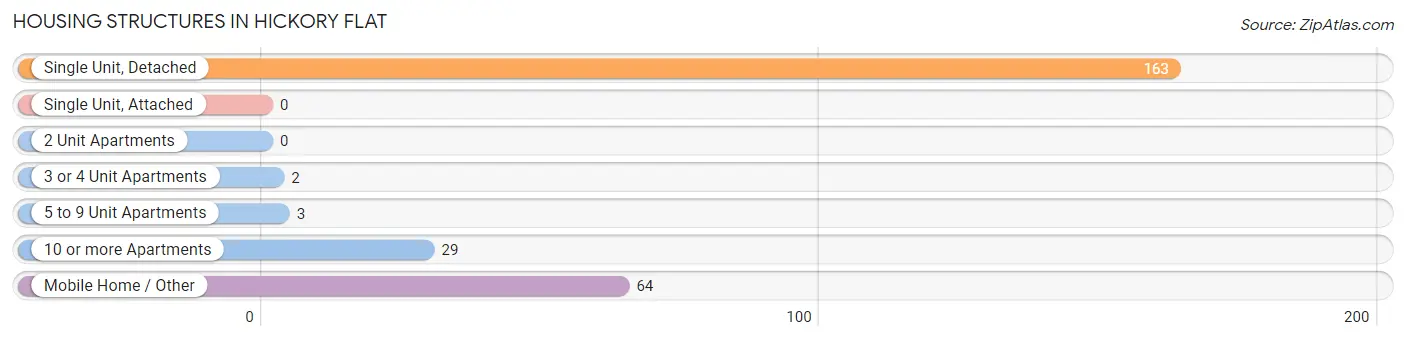
| Structure Type | # Housing Units | % Housing Units |
| Single Unit, Detached | 163 | 62.5% |
| Single Unit, Attached | 0 | 0.0% |
| 2 Unit Apartments | 0 | 0.0% |
| 3 or 4 Unit Apartments | 2 | 0.8% |
| 5 to 9 Unit Apartments | 3 | 1.1% |
| 10 or more Apartments | 29 | 11.1% |
| Mobile Home / Other | 64 | 24.5% |
| Total | 261 | 100.0% |
Housing Structures by Occupancy in Hickory Flat
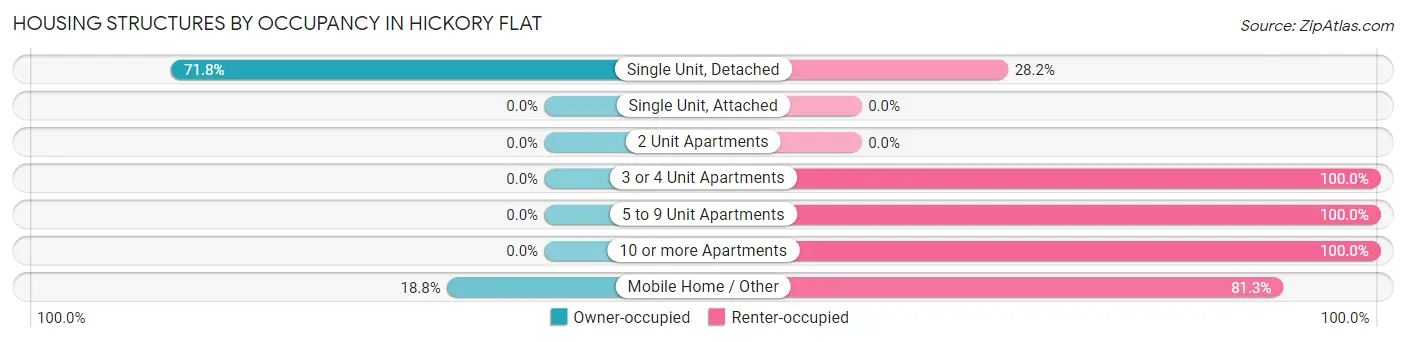
| Structure Type | Owner-occupied | Renter-occupied |
| Single Unit, Detached | 117 (71.8%) | 46 (28.2%) |
| Single Unit, Attached | 0 (0.0%) | 0 (0.0%) |
| 2 Unit Apartments | 0 (0.0%) | 0 (0.0%) |
| 3 or 4 Unit Apartments | 0 (0.0%) | 2 (100.0%) |
| 5 to 9 Unit Apartments | 0 (0.0%) | 3 (100.0%) |
| 10 or more Apartments | 0 (0.0%) | 29 (100.0%) |
| Mobile Home / Other | 12 (18.8%) | 52 (81.2%) |
| Total | 129 (49.4%) | 132 (50.6%) |
Housing Structures by Number of Rooms in Hickory Flat
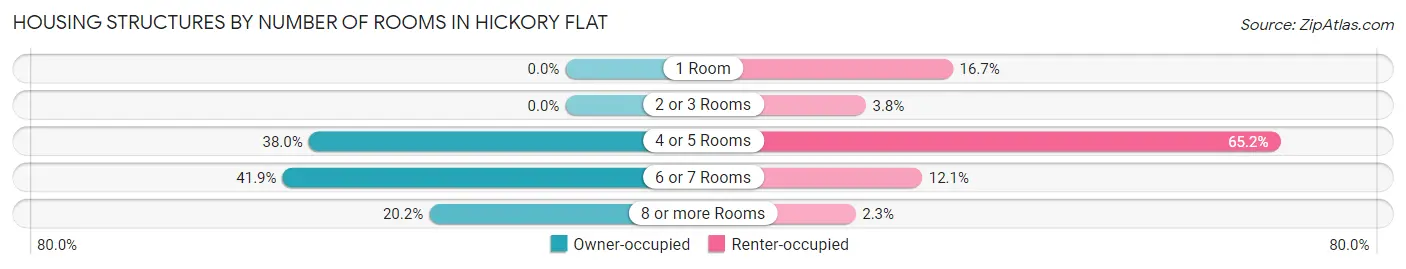
| Number of Rooms | Owner-occupied | Renter-occupied |
| 1 Room | 0 (0.0%) | 22 (16.7%) |
| 2 or 3 Rooms | 0 (0.0%) | 5 (3.8%) |
| 4 or 5 Rooms | 49 (38.0%) | 86 (65.1%) |
| 6 or 7 Rooms | 54 (41.9%) | 16 (12.1%) |
| 8 or more Rooms | 26 (20.2%) | 3 (2.3%) |
| Total | 129 (100.0%) | 132 (100.0%) |
Housing Structure by Heating Type in Hickory Flat
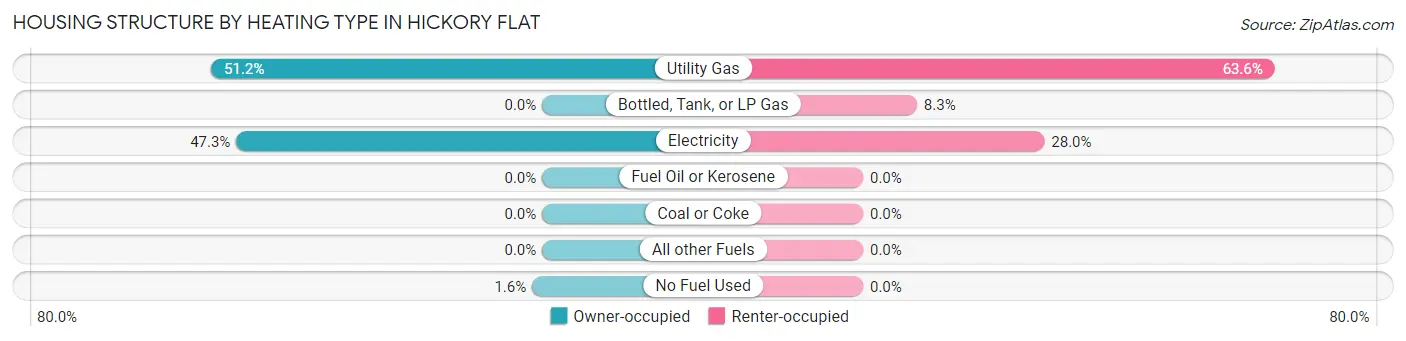
| Heating Type | Owner-occupied | Renter-occupied |
| Utility Gas | 66 (51.2%) | 84 (63.6%) |
| Bottled, Tank, or LP Gas | 0 (0.0%) | 11 (8.3%) |
| Electricity | 61 (47.3%) | 37 (28.0%) |
| Fuel Oil or Kerosene | 0 (0.0%) | 0 (0.0%) |
| Coal or Coke | 0 (0.0%) | 0 (0.0%) |
| All other Fuels | 0 (0.0%) | 0 (0.0%) |
| No Fuel Used | 2 (1.5%) | 0 (0.0%) |
| Total | 129 (100.0%) | 132 (100.0%) |
Household Vehicle Usage in Hickory Flat
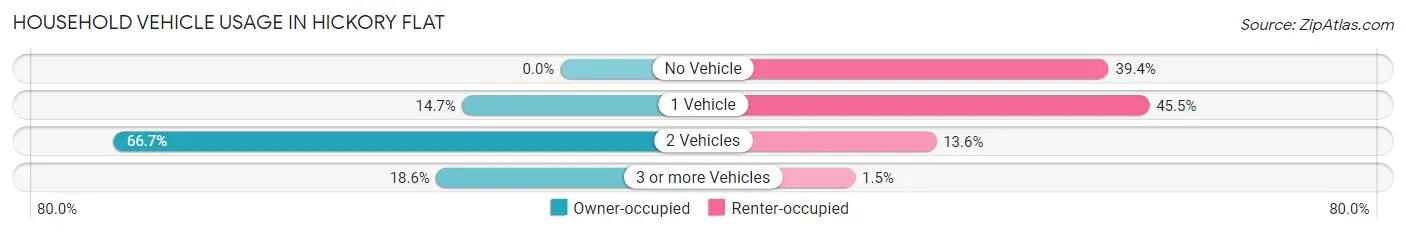
| Vehicles per Household | Owner-occupied | Renter-occupied |
| No Vehicle | 0 (0.0%) | 52 (39.4%) |
| 1 Vehicle | 19 (14.7%) | 60 (45.5%) |
| 2 Vehicles | 86 (66.7%) | 18 (13.6%) |
| 3 or more Vehicles | 24 (18.6%) | 2 (1.5%) |
| Total | 129 (100.0%) | 132 (100.0%) |
Real Estate & Mortgages in Hickory Flat
Real Estate and Mortgage Overview in Hickory Flat
| Characteristic | Without Mortgage | With Mortgage |
| Housing Units | 59 | 70 |
| Median Property Value | $91,900 | $70,000 |
| Median Household Income | - | - |
| Monthly Housing Costs | $341 | $0 |
| Real Estate Taxes | - | - |
Property Value by Mortgage Status in Hickory Flat
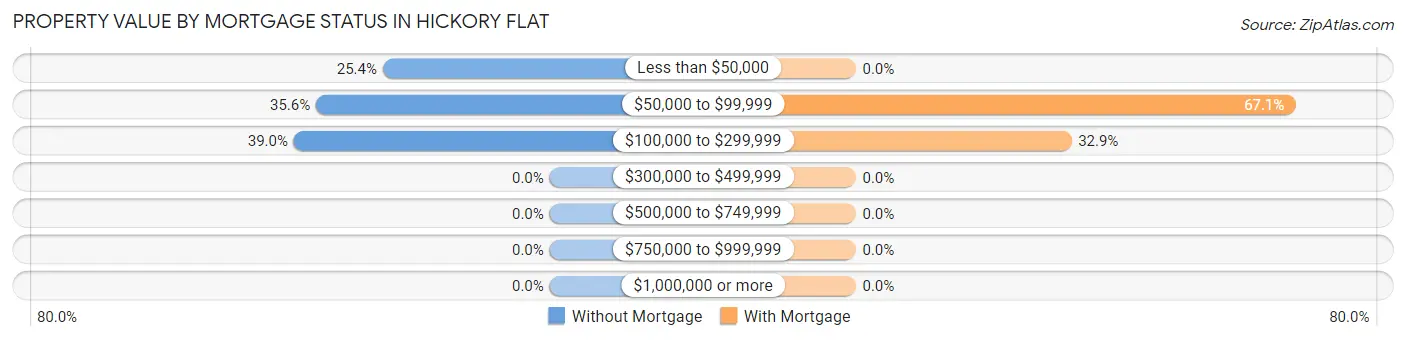
| Property Value | Without Mortgage | With Mortgage |
| Less than $50,000 | 15 (25.4%) | 0 (0.0%) |
| $50,000 to $99,999 | 21 (35.6%) | 47 (67.1%) |
| $100,000 to $299,999 | 23 (39.0%) | 23 (32.9%) |
| $300,000 to $499,999 | 0 (0.0%) | 0 (0.0%) |
| $500,000 to $749,999 | 0 (0.0%) | 0 (0.0%) |
| $750,000 to $999,999 | 0 (0.0%) | 0 (0.0%) |
| $1,000,000 or more | 0 (0.0%) | 0 (0.0%) |
| Total | 59 (100.0%) | 70 (100.0%) |
Household Income by Mortgage Status in Hickory Flat
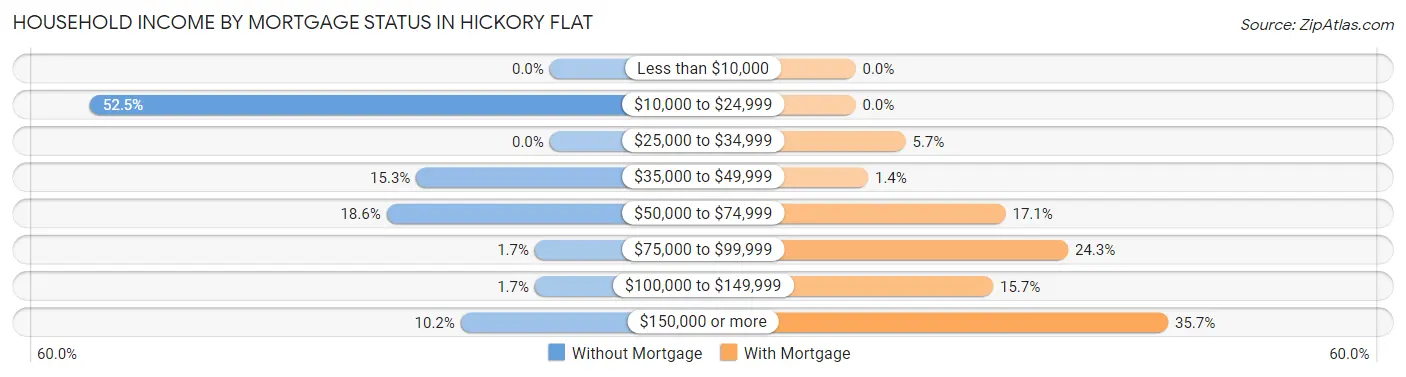
| Household Income | Without Mortgage | With Mortgage |
| Less than $10,000 | 0 (0.0%) | 0 (0.0%) |
| $10,000 to $24,999 | 31 (52.5%) | 0 (0.0%) |
| $25,000 to $34,999 | 0 (0.0%) | 4 (5.7%) |
| $35,000 to $49,999 | 9 (15.2%) | 1 (1.4%) |
| $50,000 to $74,999 | 11 (18.6%) | 12 (17.1%) |
| $75,000 to $99,999 | 1 (1.7%) | 17 (24.3%) |
| $100,000 to $149,999 | 1 (1.7%) | 11 (15.7%) |
| $150,000 or more | 6 (10.2%) | 25 (35.7%) |
| Total | 59 (100.0%) | 70 (100.0%) |
Property Value to Household Income Ratio in Hickory Flat
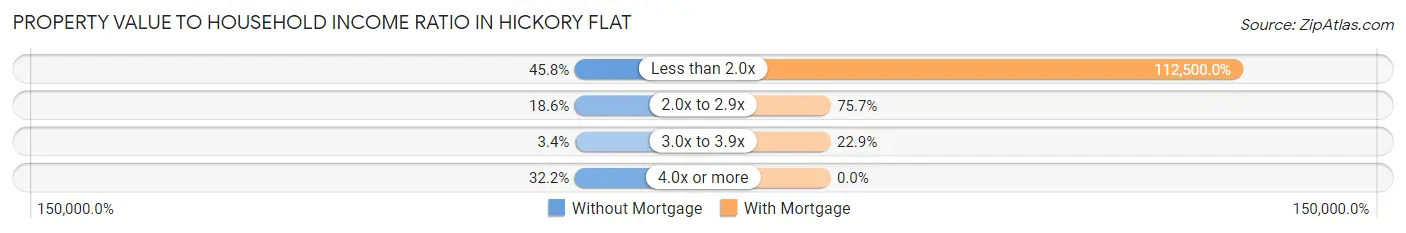
| Value-to-Income Ratio | Without Mortgage | With Mortgage |
| Less than 2.0x | 27 (45.8%) | 78,750 (112,500.0%) |
| 2.0x to 2.9x | 11 (18.6%) | 53 (75.7%) |
| 3.0x to 3.9x | 2 (3.4%) | 16 (22.9%) |
| 4.0x or more | 19 (32.2%) | 0 (0.0%) |
| Total | 59 (100.0%) | 70 (100.0%) |
Real Estate Taxes by Mortgage Status in Hickory Flat
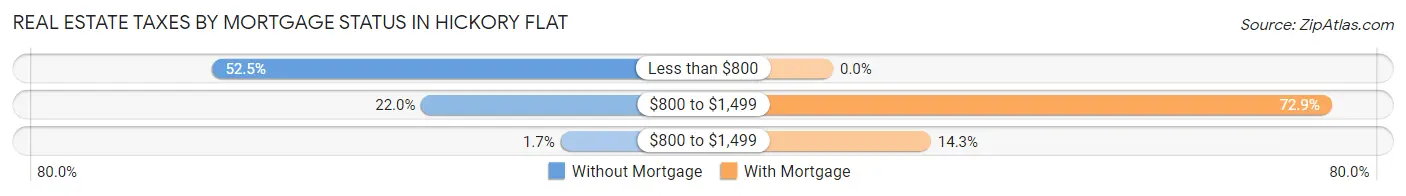
| Property Taxes | Without Mortgage | With Mortgage |
| Less than $800 | 31 (52.5%) | 0 (0.0%) |
| $800 to $1,499 | 13 (22.0%) | 51 (72.9%) |
| $800 to $1,499 | 1 (1.7%) | 10 (14.3%) |
| Total | 59 (100.0%) | 70 (100.0%) |
Health & Disability in Hickory Flat
Health Insurance Coverage by Age in Hickory Flat
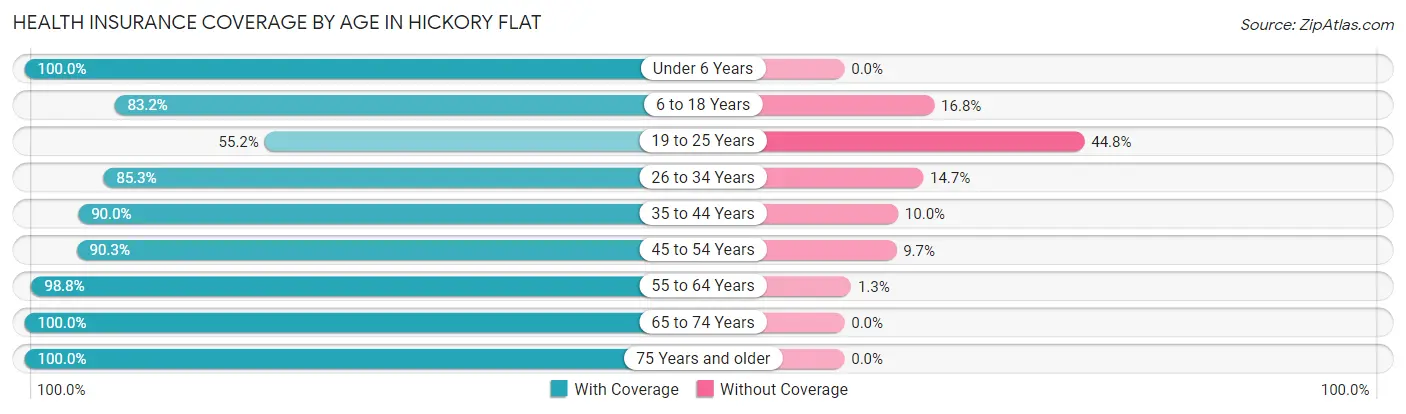
| Age Bracket | With Coverage | Without Coverage |
| Under 6 Years | 73 (100.0%) | 0 (0.0%) |
| 6 to 18 Years | 154 (83.2%) | 31 (16.8%) |
| 19 to 25 Years | 58 (55.2%) | 47 (44.8%) |
| 26 to 34 Years | 93 (85.3%) | 16 (14.7%) |
| 35 to 44 Years | 54 (90.0%) | 6 (10.0%) |
| 45 to 54 Years | 28 (90.3%) | 3 (9.7%) |
| 55 to 64 Years | 79 (98.8%) | 1 (1.3%) |
| 65 to 74 Years | 64 (100.0%) | 0 (0.0%) |
| 75 Years and older | 23 (100.0%) | 0 (0.0%) |
| Total | 626 (85.8%) | 104 (14.2%) |
Health Insurance Coverage by Citizenship Status in Hickory Flat
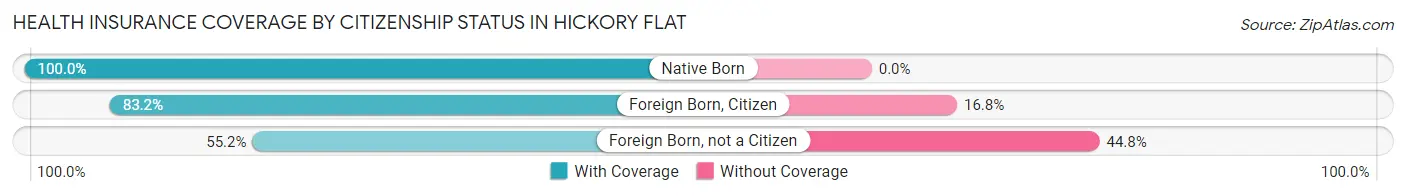
| Citizenship Status | With Coverage | Without Coverage |
| Native Born | 73 (100.0%) | 0 (0.0%) |
| Foreign Born, Citizen | 154 (83.2%) | 31 (16.8%) |
| Foreign Born, not a Citizen | 58 (55.2%) | 47 (44.8%) |
Health Insurance Coverage by Household Income in Hickory Flat
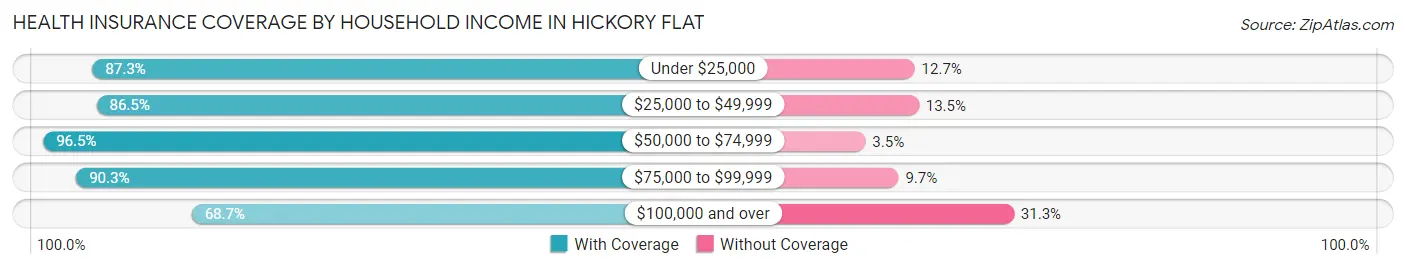
| Household Income | With Coverage | Without Coverage |
| Under $25,000 | 261 (87.3%) | 38 (12.7%) |
| $25,000 to $49,999 | 186 (86.5%) | 29 (13.5%) |
| $50,000 to $74,999 | 83 (96.5%) | 3 (3.5%) |
| $75,000 to $99,999 | 28 (90.3%) | 3 (9.7%) |
| $100,000 and over | 68 (68.7%) | 31 (31.3%) |
Public vs Private Health Insurance Coverage by Age in Hickory Flat
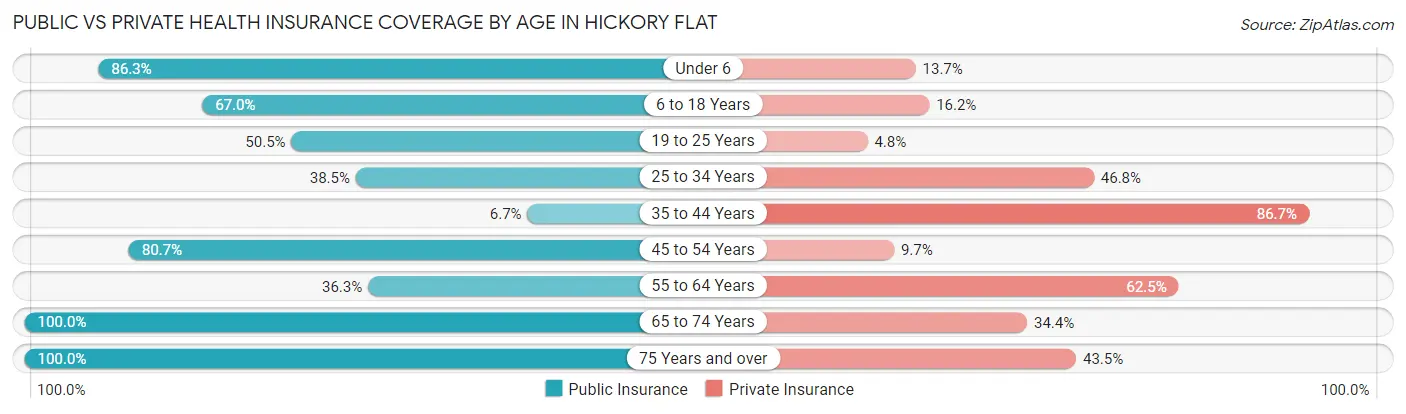
| Age Bracket | Public Insurance | Private Insurance |
| Under 6 | 63 (86.3%) | 10 (13.7%) |
| 6 to 18 Years | 124 (67.0%) | 30 (16.2%) |
| 19 to 25 Years | 53 (50.5%) | 5 (4.8%) |
| 25 to 34 Years | 42 (38.5%) | 51 (46.8%) |
| 35 to 44 Years | 4 (6.7%) | 52 (86.7%) |
| 45 to 54 Years | 25 (80.6%) | 3 (9.7%) |
| 55 to 64 Years | 29 (36.2%) | 50 (62.5%) |
| 65 to 74 Years | 64 (100.0%) | 22 (34.4%) |
| 75 Years and over | 23 (100.0%) | 10 (43.5%) |
| Total | 427 (58.5%) | 233 (31.9%) |
Disability Status by Sex by Age in Hickory Flat
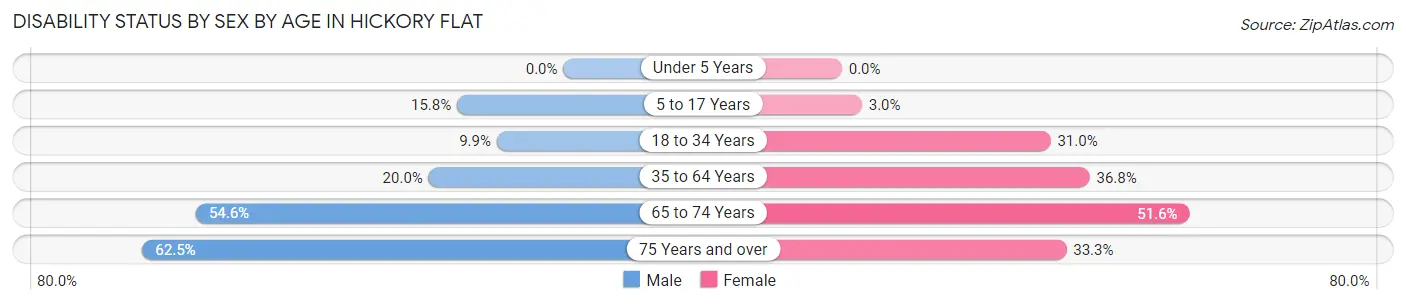
| Age Bracket | Male | Female |
| Under 5 Years | 0 (0.0%) | 0 (0.0%) |
| 5 to 17 Years | 12 (15.8%) | 3 (3.0%) |
| 18 to 34 Years | 8 (9.9%) | 44 (31.0%) |
| 35 to 64 Years | 13 (20.0%) | 39 (36.8%) |
| 65 to 74 Years | 18 (54.5%) | 16 (51.6%) |
| 75 Years and over | 5 (62.5%) | 5 (33.3%) |
Disability Class by Sex by Age in Hickory Flat
Disability Class: Hearing Difficulty
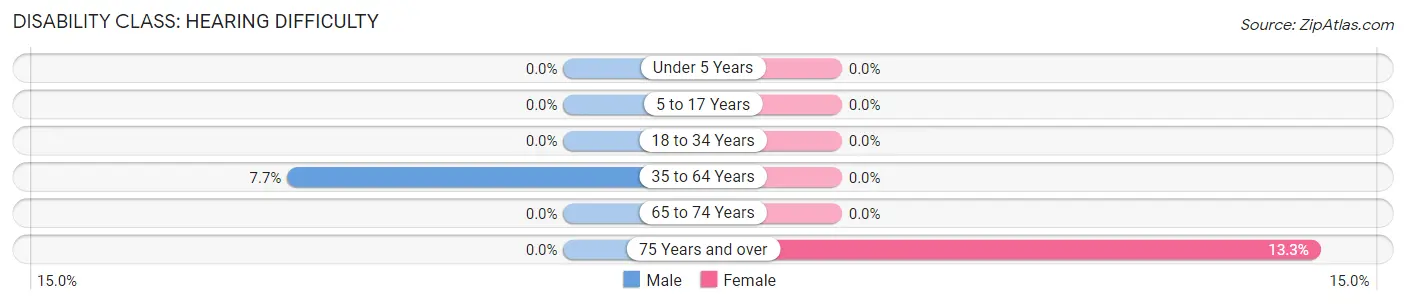
| Age Bracket | Male | Female |
| Under 5 Years | 0 (0.0%) | 0 (0.0%) |
| 5 to 17 Years | 0 (0.0%) | 0 (0.0%) |
| 18 to 34 Years | 0 (0.0%) | 0 (0.0%) |
| 35 to 64 Years | 5 (7.7%) | 0 (0.0%) |
| 65 to 74 Years | 0 (0.0%) | 0 (0.0%) |
| 75 Years and over | 0 (0.0%) | 2 (13.3%) |
Disability Class: Vision Difficulty
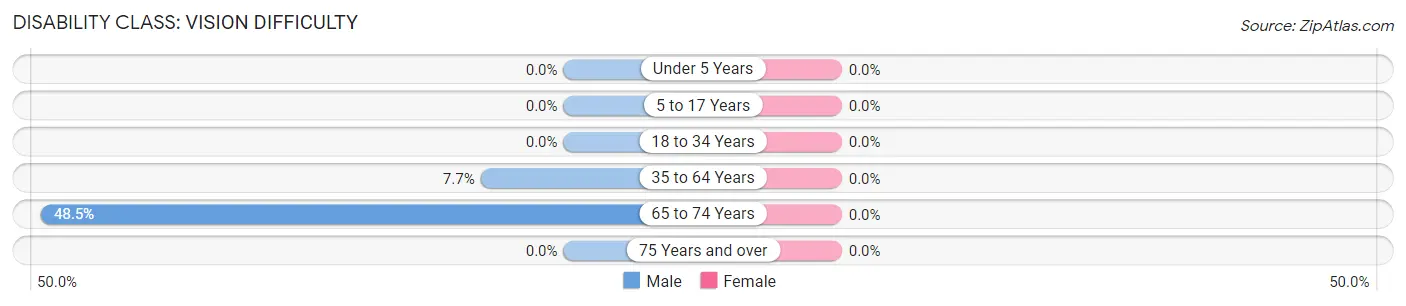
| Age Bracket | Male | Female |
| Under 5 Years | 0 (0.0%) | 0 (0.0%) |
| 5 to 17 Years | 0 (0.0%) | 0 (0.0%) |
| 18 to 34 Years | 0 (0.0%) | 0 (0.0%) |
| 35 to 64 Years | 5 (7.7%) | 0 (0.0%) |
| 65 to 74 Years | 16 (48.5%) | 0 (0.0%) |
| 75 Years and over | 0 (0.0%) | 0 (0.0%) |
Disability Class: Cognitive Difficulty
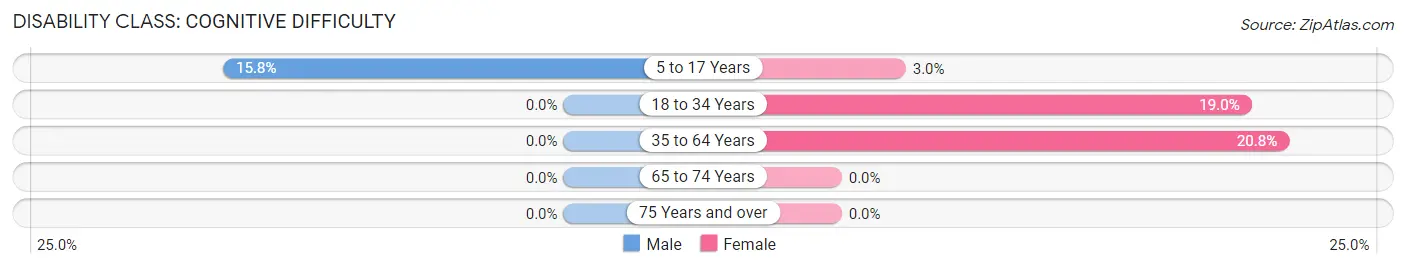
| Age Bracket | Male | Female |
| 5 to 17 Years | 12 (15.8%) | 3 (3.0%) |
| 18 to 34 Years | 0 (0.0%) | 27 (19.0%) |
| 35 to 64 Years | 0 (0.0%) | 22 (20.7%) |
| 65 to 74 Years | 0 (0.0%) | 0 (0.0%) |
| 75 Years and over | 0 (0.0%) | 0 (0.0%) |
Disability Class: Ambulatory Difficulty
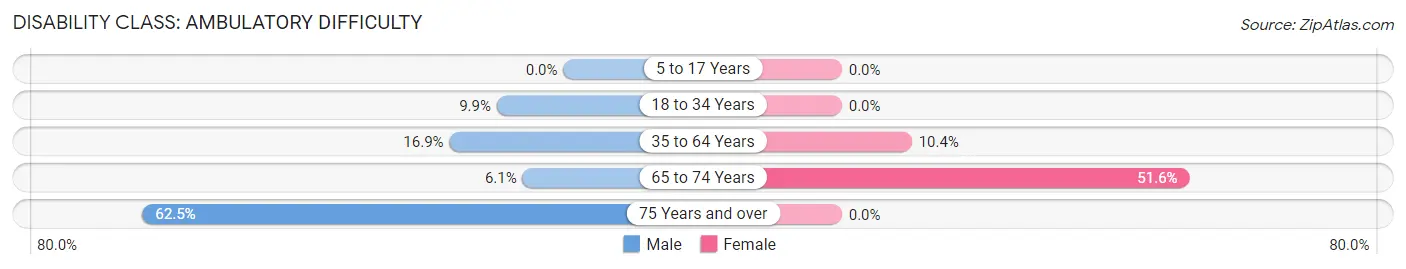
| Age Bracket | Male | Female |
| 5 to 17 Years | 0 (0.0%) | 0 (0.0%) |
| 18 to 34 Years | 8 (9.9%) | 0 (0.0%) |
| 35 to 64 Years | 11 (16.9%) | 11 (10.4%) |
| 65 to 74 Years | 2 (6.1%) | 16 (51.6%) |
| 75 Years and over | 5 (62.5%) | 0 (0.0%) |
Disability Class: Self-Care Difficulty
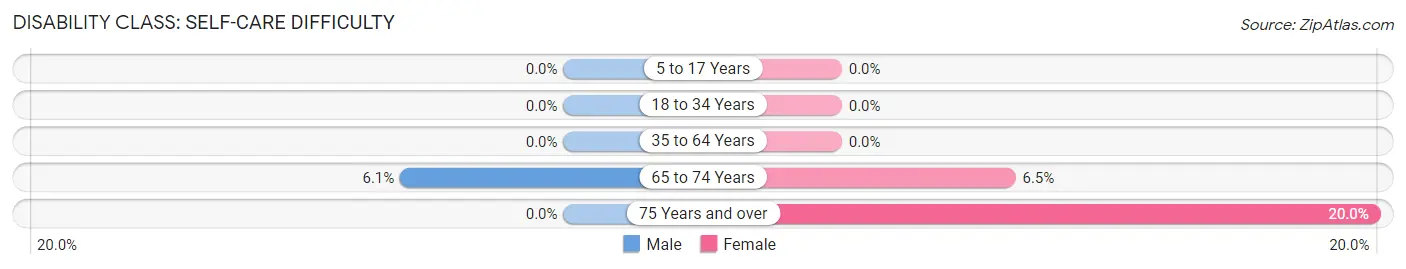
| Age Bracket | Male | Female |
| 5 to 17 Years | 0 (0.0%) | 0 (0.0%) |
| 18 to 34 Years | 0 (0.0%) | 0 (0.0%) |
| 35 to 64 Years | 0 (0.0%) | 0 (0.0%) |
| 65 to 74 Years | 2 (6.1%) | 2 (6.5%) |
| 75 Years and over | 0 (0.0%) | 3 (20.0%) |
Technology Access in Hickory Flat
Computing Device Access in Hickory Flat
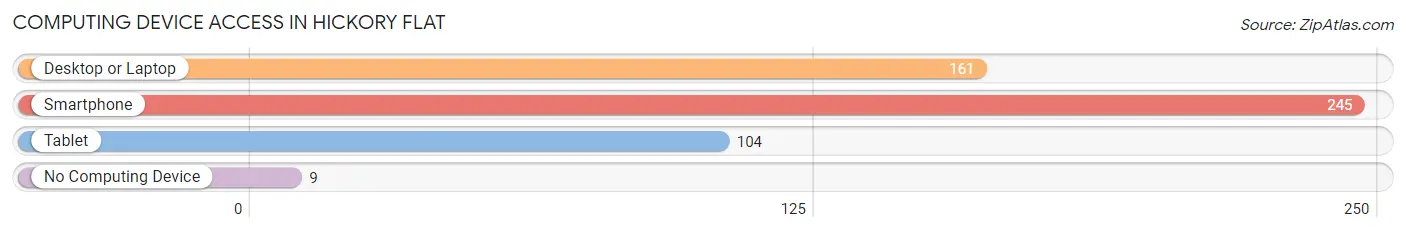
| Device Type | # Households | % Households |
| Desktop or Laptop | 161 | 61.7% |
| Smartphone | 245 | 93.9% |
| Tablet | 104 | 39.9% |
| No Computing Device | 9 | 3.5% |
| Total | 261 | 100.0% |
Internet Access in Hickory Flat
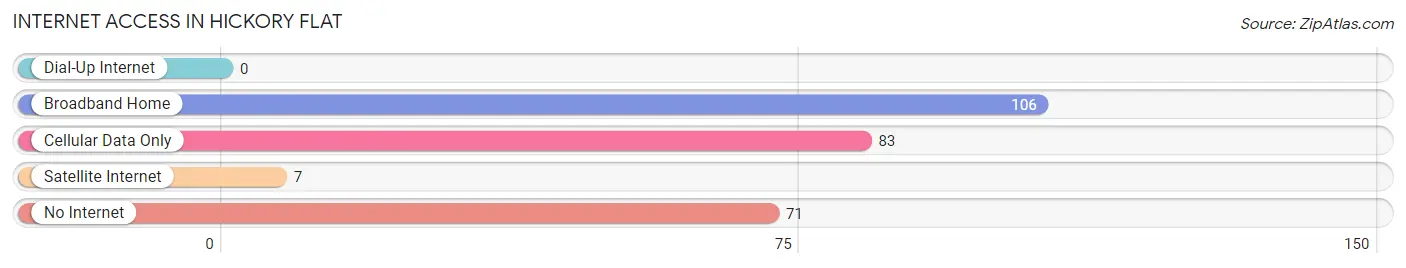
| Internet Type | # Households | % Households |
| Dial-Up Internet | 0 | 0.0% |
| Broadband Home | 106 | 40.6% |
| Cellular Data Only | 83 | 31.8% |
| Satellite Internet | 7 | 2.7% |
| No Internet | 71 | 27.2% |
| Total | 261 | 100.0% |
Hickory Flat Summary
Hickory Flat is a small unincorporated community located in Benton County, Mississippi. It is situated in the foothills of the Appalachian Mountains, approximately 20 miles east of the state capital of Jackson. The population of Hickory Flat was estimated to be around 1,000 people in 2020.
History
Hickory Flat was first settled in the early 1800s by settlers from North Carolina and Virginia. The town was named after the abundance of hickory trees in the area. The town was originally a farming community, with cotton and tobacco being the main crops. In the late 1800s, the town began to grow as a result of the railroad being built through the area. This allowed for the transportation of goods and people to and from the town.
In the early 1900s, the town began to experience a decline in population as many of the residents moved away in search of better economic opportunities. This trend continued until the 1950s when the town began to experience a resurgence in population. This was due to the growth of the nearby cities of Tupelo and Oxford, which provided employment opportunities for the residents of Hickory Flat.
Geography
Hickory Flat is located in the foothills of the Appalachian Mountains in Benton County, Mississippi. The town is situated on the banks of the Tippah River, which flows through the area. The town is surrounded by rolling hills and forests, providing a picturesque backdrop. The climate in Hickory Flat is mild, with temperatures ranging from the mid-50s in the winter to the mid-80s in the summer.
Economy
The economy of Hickory Flat is largely based on agriculture. The town is home to several farms, which produce a variety of crops, including cotton, soybeans, corn, and wheat. The town also has a few small businesses, including a grocery store, a hardware store, and a few restaurants.
Demographics
As of the 2020 census, the population of Hickory Flat was estimated to be around 1,000 people. The racial makeup of the town was 97.2% White, 0.9% African American, 0.4% Native American, 0.2% Asian, and 1.3% from other races. The median household income in Hickory Flat was $37,500, and the median home value was $90,000.
Conclusion
Hickory Flat is a small unincorporated community located in Benton County, Mississippi. It is situated in the foothills of the Appalachian Mountains, approximately 20 miles east of the state capital of Jackson. The town was first settled in the early 1800s and has since grown to a population of around 1,000 people. The economy of Hickory Flat is largely based on agriculture, with cotton, soybeans, corn, and wheat being the main crops. The racial makeup of the town is predominantly White, with a small percentage of African American, Native American, and Asian residents. The median household income in Hickory Flat is $37,500, and the median home value is $90,000.
Common Questions
What is the Total Population of Hickory Flat?
Total Population of Hickory Flat is 730.
What is the Total Male Population of Hickory Flat?
Total Male Population of Hickory Flat is 295.
What is the Total Female Population of Hickory Flat?
Total Female Population of Hickory Flat is 435.
What is the Ratio of Males per 100 Females in Hickory Flat?
There are 67.82 Males per 100 Females in Hickory Flat.
What is the Ratio of Females per 100 Males in Hickory Flat?
There are 147.46 Females per 100 Males in Hickory Flat.
What is the Median Population Age in Hickory Flat?
Median Population Age in Hickory Flat is 26.3 Years.
What is the Average Family Size in Hickory Flat
Average Family Size in Hickory Flat is 3.5 People.
What is the Average Household Size in Hickory Flat
Average Household Size in Hickory Flat is 2.8 People.
What is Per Capita Income in Hickory Flat?
Per Capita income in Hickory Flat is $15,381.
What is the Median Family Income in Hickory Flat?
Median Family Income in Hickory Flat is $34,844.
What is the Median Household income in Hickory Flat?
Median Household Income in Hickory Flat is $33,219.
What is Income or Wage Gap in Hickory Flat?
Income or Wage Gap in Hickory Flat is 10.5%.
Women in Hickory Flat earn 89.5 cents for every dollar earned by a man.
What is Family Income Deficit in Hickory Flat?
Family Income Deficit in Hickory Flat is $13,903.
Families that are below poverty line in Hickory Flat earn $13,903 less on average than the poverty threshold level.
What is Inequality or Gini Index in Hickory Flat?
Inequality or Gini Index in Hickory Flat is 0.41.
How Large is the Labor Force in Hickory Flat?
There are 247 People in the Labor Forcein in Hickory Flat.
What is the Percentage of People in the Labor Force in Hickory Flat?
51.1% of People are in the Labor Force in Hickory Flat.
What is the Unemployment Rate in Hickory Flat?
Unemployment Rate in Hickory Flat is 12.1%.