Farmington, MS
Farmington Map
Farmington Overview
2,534
TOTAL POPULATION
1,127
MALE POPULATION
1,407
FEMALE POPULATION
80.10
MALES / 100 FEMALES
124.84
FEMALES / 100 MALES
37.3
MEDIAN AGE
3.6
AVG FAMILY SIZE
3.1
AVG HOUSEHOLD SIZE
$22,541
PER CAPITA INCOME
$65,250
AVG FAMILY INCOME
$53,015
AVG HOUSEHOLD INCOME
12.4%
WAGE / INCOME GAP [ % ]
87.6¢/ $1
WAGE / INCOME GAP [ $ ]
$8,246
FAMILY INCOME DEFICIT
0.40
INEQUALITY / GINI INDEX
1,020
LABOR FORCE [ PEOPLE ]
55.6%
PERCENT IN LABOR FORCE
4.9%
UNEMPLOYMENT RATE
Farmington Area Codes
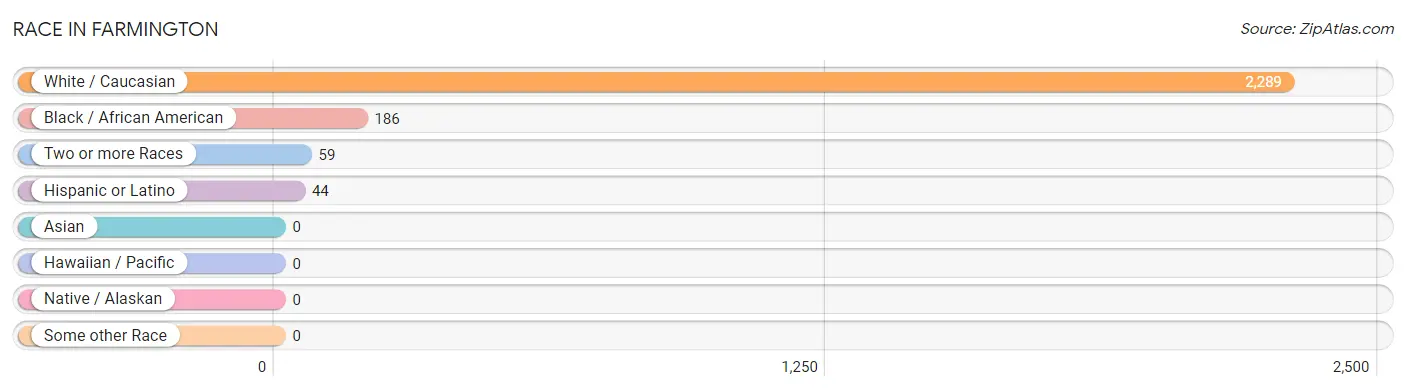
Race in Farmington
The most populous races in Farmington are White / Caucasian (2,289 | 90.3%), Black / African American (186 | 7.3%), and Two or more Races (59 | 2.3%).
| Race | # Population | % Population |
| Asian | 0 | 0.0% |
| Black / African American | 186 | 7.3% |
| Hawaiian / Pacific | 0 | 0.0% |
| Hispanic or Latino | 44 | 1.7% |
| Native / Alaskan | 0 | 0.0% |
| White / Caucasian | 2,289 | 90.3% |
| Two or more Races | 59 | 2.3% |
| Some other Race | 0 | 0.0% |
| Total | 2,534 | 100.0% |
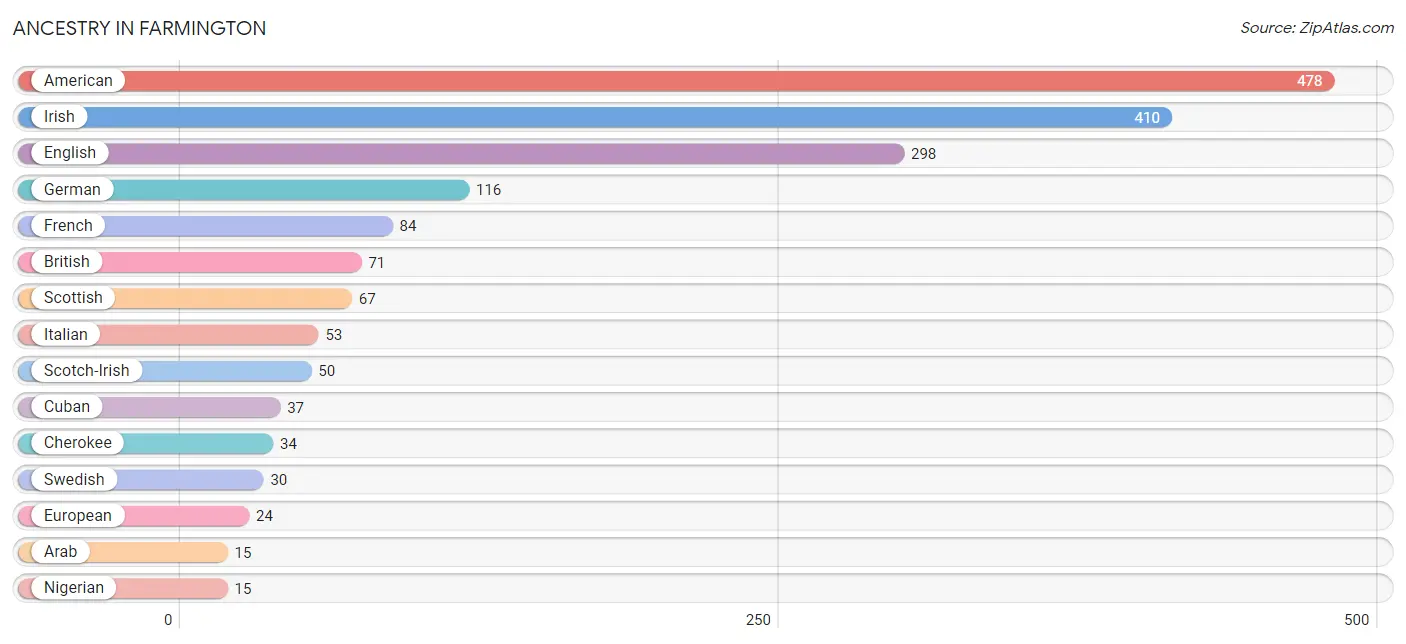
Ancestry in Farmington
The most populous ancestries reported in Farmington are American (478 | 18.9%), Irish (410 | 16.2%), English (298 | 11.8%), German (116 | 4.6%), and French (84 | 3.3%), together accounting for 54.7% of all Farmington residents.
| Ancestry | # Population | % Population |
| American | 478 | 18.9% |
| Arab | 15 | 0.6% |
| Austrian | 7 | 0.3% |
| Blackfeet | 1 | 0.0% |
| British | 71 | 2.8% |
| Cherokee | 34 | 1.3% |
| Cuban | 37 | 1.5% |
| English | 298 | 11.8% |
| European | 24 | 0.9% |
| French | 84 | 3.3% |
| French Canadian | 4 | 0.2% |
| German | 116 | 4.6% |
| Iranian | 4 | 0.2% |
| Irish | 410 | 16.2% |
| Italian | 53 | 2.1% |
| Mexican | 7 | 0.3% |
| Nigerian | 15 | 0.6% |
| Norwegian | 3 | 0.1% |
| Palestinian | 15 | 0.6% |
| Scotch-Irish | 50 | 2.0% |
| Scottish | 67 | 2.6% |
| Subsaharan African | 15 | 0.6% |
| Swedish | 30 | 1.2% |
| Welsh | 4 | 0.2% | View All 24 Rows |
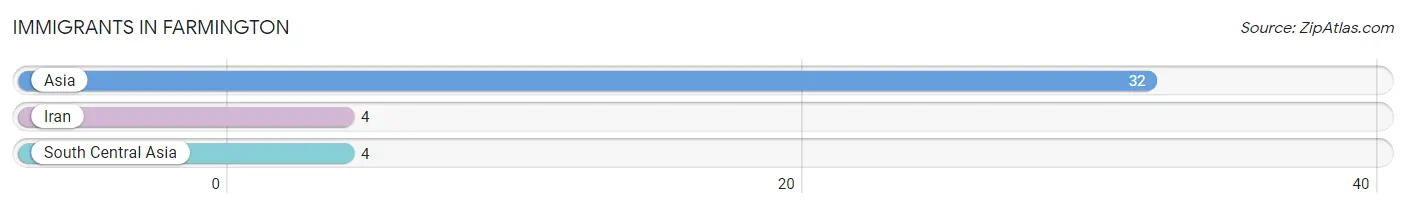
Immigrants in Farmington
The most numerous immigrant groups reported in Farmington came from Asia (32 | 1.3%), Iran (4 | 0.2%), and South Central Asia (4 | 0.2%), together accounting for 1.6% of all Farmington residents.
| Immigration Origin | # Population | % Population |
| Asia | 32 | 1.3% |
| Iran | 4 | 0.2% |
| South Central Asia | 4 | 0.2% | View All 3 Rows |
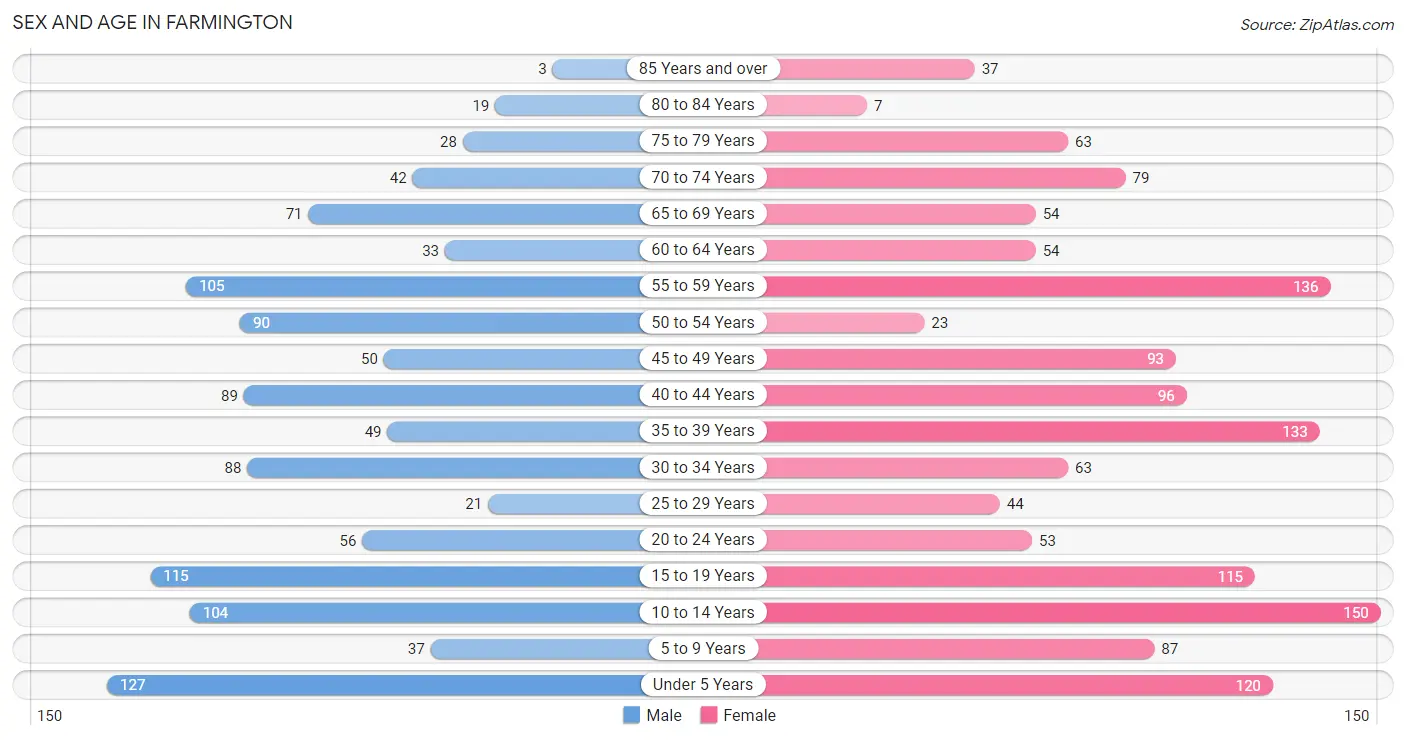
Sex and Age in Farmington
Sex and Age in Farmington
The most populous age groups in Farmington are Under 5 Years (127 | 11.3%) for men and 10 to 14 Years (150 | 10.7%) for women.
| Age Bracket | Male | Female |
| Under 5 Years | 127 (11.3%) | 120 (8.5%) |
| 5 to 9 Years | 37 (3.3%) | 87 (6.2%) |
| 10 to 14 Years | 104 (9.2%) | 150 (10.7%) |
| 15 to 19 Years | 115 (10.2%) | 115 (8.2%) |
| 20 to 24 Years | 56 (5.0%) | 53 (3.8%) |
| 25 to 29 Years | 21 (1.9%) | 44 (3.1%) |
| 30 to 34 Years | 88 (7.8%) | 63 (4.5%) |
| 35 to 39 Years | 49 (4.3%) | 133 (9.5%) |
| 40 to 44 Years | 89 (7.9%) | 96 (6.8%) |
| 45 to 49 Years | 50 (4.4%) | 93 (6.6%) |
| 50 to 54 Years | 90 (8.0%) | 23 (1.6%) |
| 55 to 59 Years | 105 (9.3%) | 136 (9.7%) |
| 60 to 64 Years | 33 (2.9%) | 54 (3.8%) |
| 65 to 69 Years | 71 (6.3%) | 54 (3.8%) |
| 70 to 74 Years | 42 (3.7%) | 79 (5.6%) |
| 75 to 79 Years | 28 (2.5%) | 63 (4.5%) |
| 80 to 84 Years | 19 (1.7%) | 7 (0.5%) |
| 85 Years and over | 3 (0.3%) | 37 (2.6%) |
| Total | 1,127 (100.0%) | 1,407 (100.0%) |
Families and Households in Farmington
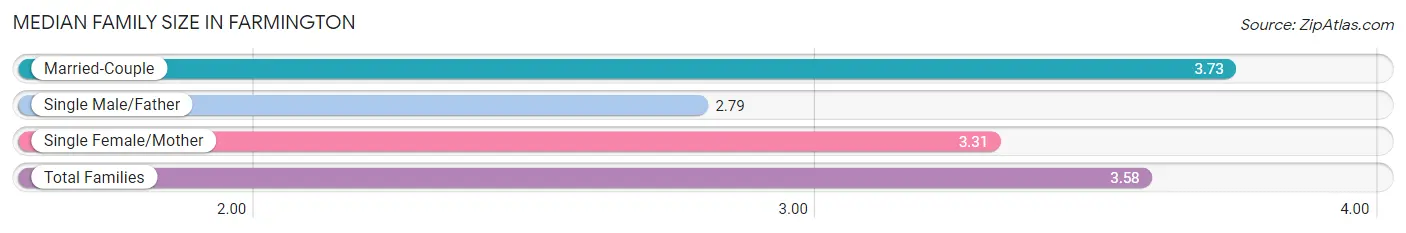
Median Family Size in Farmington
The median family size in Farmington is 3.58 persons per family, with married-couple families (413 | 68.0%) accounting for the largest median family size of 3.73 persons per family. On the other hand, single male/father families (14 | 2.3%) represent the smallest median family size with 2.79 persons per family.
| Family Type | # Families | Family Size |
| Married-Couple | 413 (68.0%) | 3.73 |
| Single Male/Father | 14 (2.3%) | 2.79 |
| Single Female/Mother | 180 (29.6%) | 3.31 |
| Total Families | 607 (100.0%) | 3.58 |
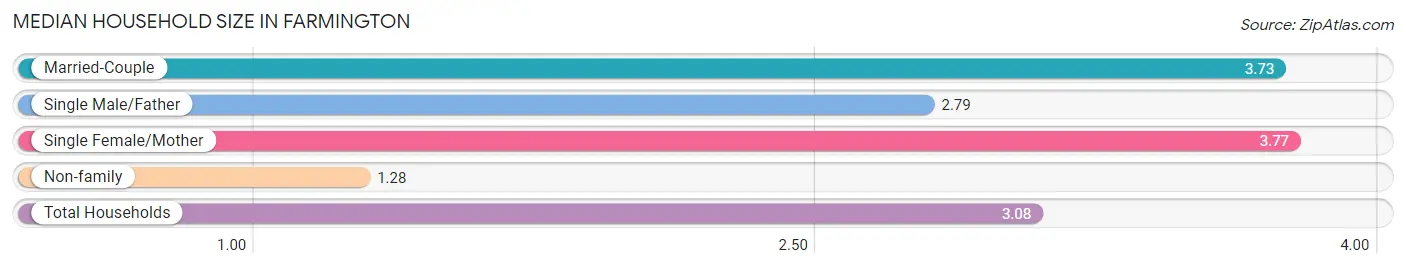
Median Household Size in Farmington
The median household size in Farmington is 3.08 persons per household, with single female/mother households (180 | 21.9%) accounting for the largest median household size of 3.77 persons per household. non-family households (215 | 26.2%) represent the smallest median household size with 1.28 persons per household.
| Household Type | # Households | Household Size |
| Married-Couple | 413 (50.2%) | 3.73 |
| Single Male/Father | 14 (1.7%) | 2.79 |
| Single Female/Mother | 180 (21.9%) | 3.77 |
| Non-family | 215 (26.2%) | 1.28 |
| Total Households | 822 (100.0%) | 3.08 |
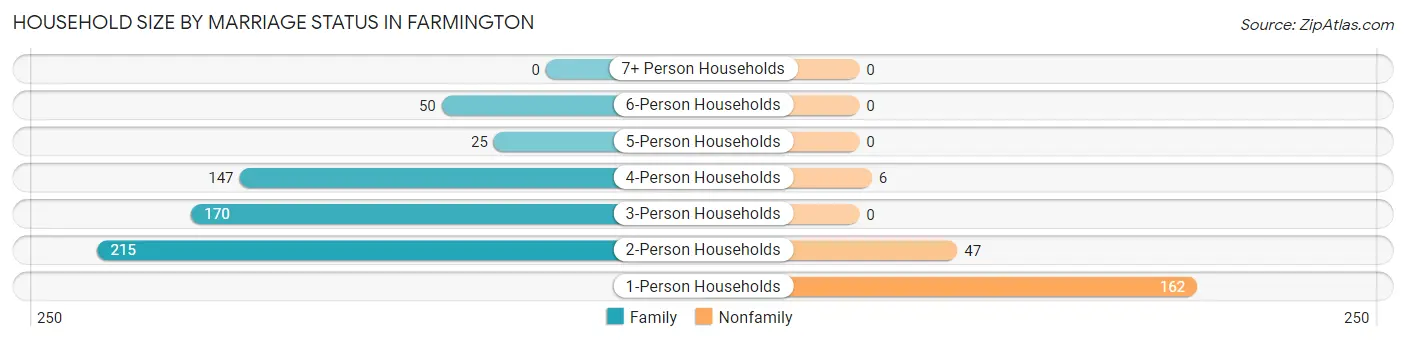
Household Size by Marriage Status in Farmington
Out of a total of 822 households in Farmington, 607 (73.8%) are family households, while 215 (26.2%) are nonfamily households. The most numerous type of family households are 2-person households, comprising 215, and the most common type of nonfamily households are 1-person households, comprising 162.
| Household Size | Family Households | Nonfamily Households |
| 1-Person Households | - | 162 (19.7%) |
| 2-Person Households | 215 (26.2%) | 47 (5.7%) |
| 3-Person Households | 170 (20.7%) | 0 (0.0%) |
| 4-Person Households | 147 (17.9%) | 6 (0.7%) |
| 5-Person Households | 25 (3.0%) | 0 (0.0%) |
| 6-Person Households | 50 (6.1%) | 0 (0.0%) |
| 7+ Person Households | 0 (0.0%) | 0 (0.0%) |
| Total | 607 (73.8%) | 215 (26.2%) |
Female Fertility in Farmington
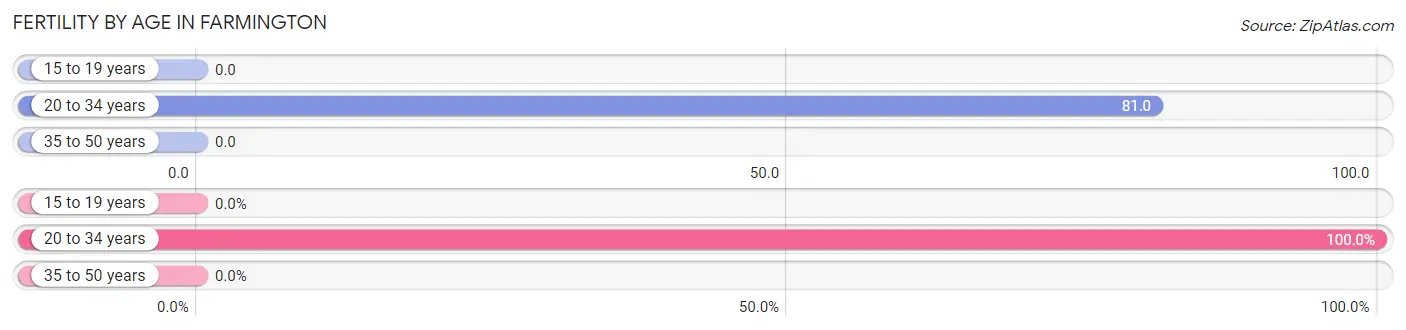
Fertility by Age in Farmington
Average fertility rate in Farmington is 22.0 births per 1,000 women. Women in the age bracket of 20 to 34 years have the highest fertility rate with 81.0 births per 1,000 women. Women in the age bracket of 20 to 34 years acount for 100.0% of all women with births.
| Age Bracket | Women with Births | Births / 1,000 Women |
| 15 to 19 years | 0 (0.0%) | 0.0 |
| 20 to 34 years | 13 (100.0%) | 81.0 |
| 35 to 50 years | 0 (0.0%) | 0.0 |
| Total | 13 (100.0%) | 22.0 |
Fertility by Age by Marriage Status in Farmington
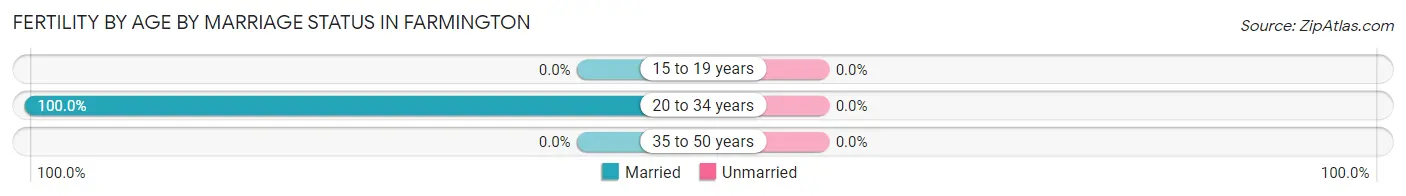
| Age Bracket | Married | Unmarried |
| 15 to 19 years | 0 (0.0%) | 0 (0.0%) |
| 20 to 34 years | 13 (100.0%) | 0 (0.0%) |
| 35 to 50 years | 0 (0.0%) | 0 (0.0%) |
| Total | 13 (100.0%) | 0 (0.0%) |
Fertility by Education in Farmington
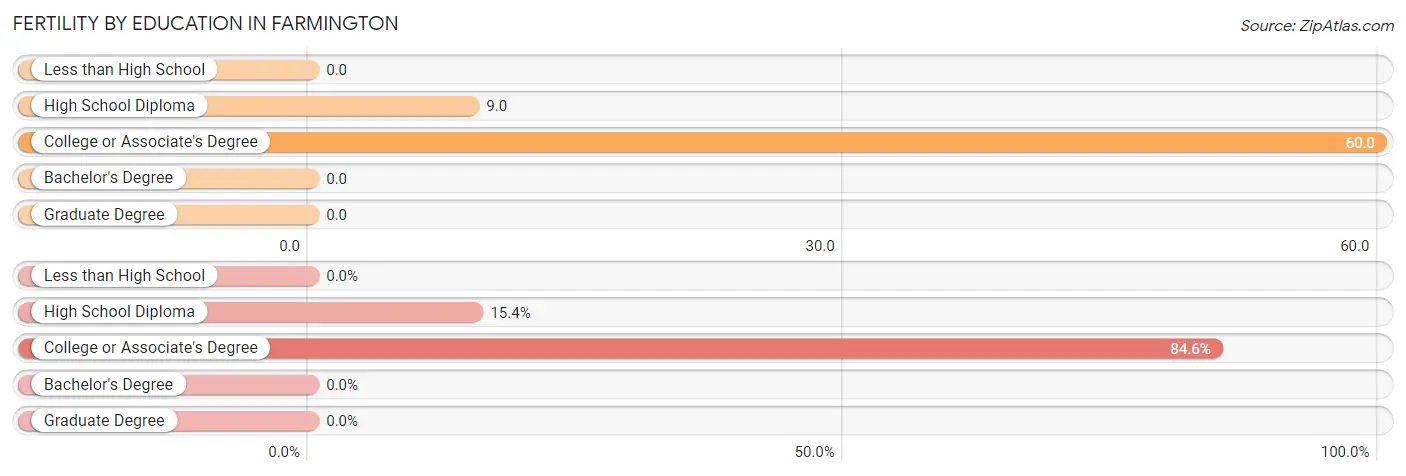
| Educational Attainment | Women with Births | Births / 1,000 Women |
| Less than High School | 0 (0.0%) | 0.0 |
| High School Diploma | 2 (15.4%) | 9.0 |
| College or Associate's Degree | 11 (84.6%) | 60.0 |
| Bachelor's Degree | 0 (0.0%) | 0.0 |
| Graduate Degree | 0 (0.0%) | 0.0 |
| Total | 13 (100.0%) | 22.0 |
Fertility by Education by Marriage Status in Farmington
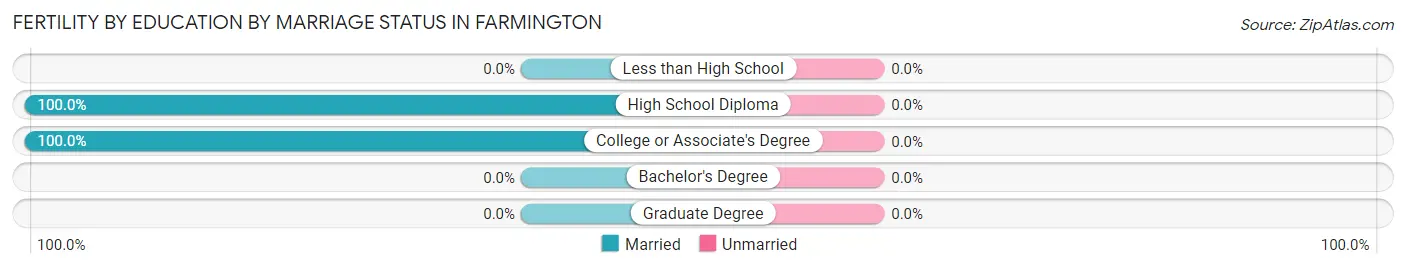
| Educational Attainment | Married | Unmarried |
| Less than High School | 0 (0.0%) | 0 (0.0%) |
| High School Diploma | 2 (100.0%) | 0 (0.0%) |
| College or Associate's Degree | 11 (100.0%) | 0 (0.0%) |
| Bachelor's Degree | 0 (0.0%) | 0 (0.0%) |
| Graduate Degree | 0 (0.0%) | 0 (0.0%) |
| Total | 13 (100.0%) | 0 (0.0%) |
Income in Farmington
Income Overview in Farmington
Per Capita Income in Farmington is $22,541, while median incomes of families and households are $65,250 and $53,015 respectively.
| Characteristic | Number | Measure |
| Per Capita Income | 2,534 | $22,541 |
| Median Family Income | 607 | $65,250 |
| Mean Family Income | 607 | $75,095 |
| Median Household Income | 822 | $53,015 |
| Mean Household Income | 822 | $65,471 |
| Income Deficit | 607 | $8,246 |
| Wage / Income Gap (%) | 2,534 | 12.36% |
| Wage / Income Gap ($) | 2,534 | 87.64¢ per $1 |
| Gini / Inequality Index | 2,534 | 0.40 |
Earnings by Sex in Farmington
Average Earnings in Farmington are $33,279, $29,700 for men and $33,887 for women, a difference of 12.4%.
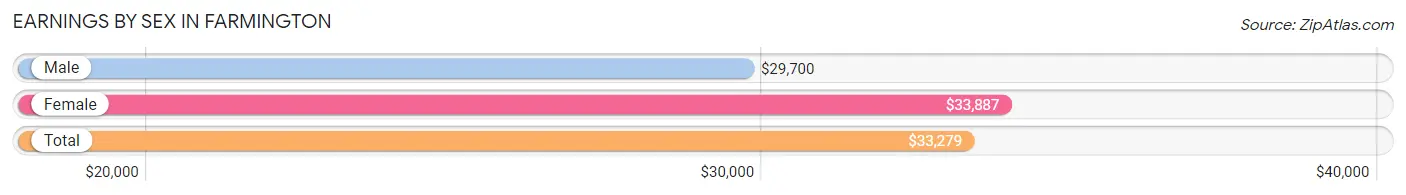
| Sex | Number | Average Earnings |
| Male | 578 (55.0%) | $29,700 |
| Female | 473 (45.0%) | $33,887 |
| Total | 1,051 (100.0%) | $33,279 |
Earnings by Sex by Income Bracket in Farmington
The most common earnings brackets in Farmington are $25,000 to $29,999 for men (96 | 16.6%) and $30,000 to $34,999 for women (73 | 15.4%).
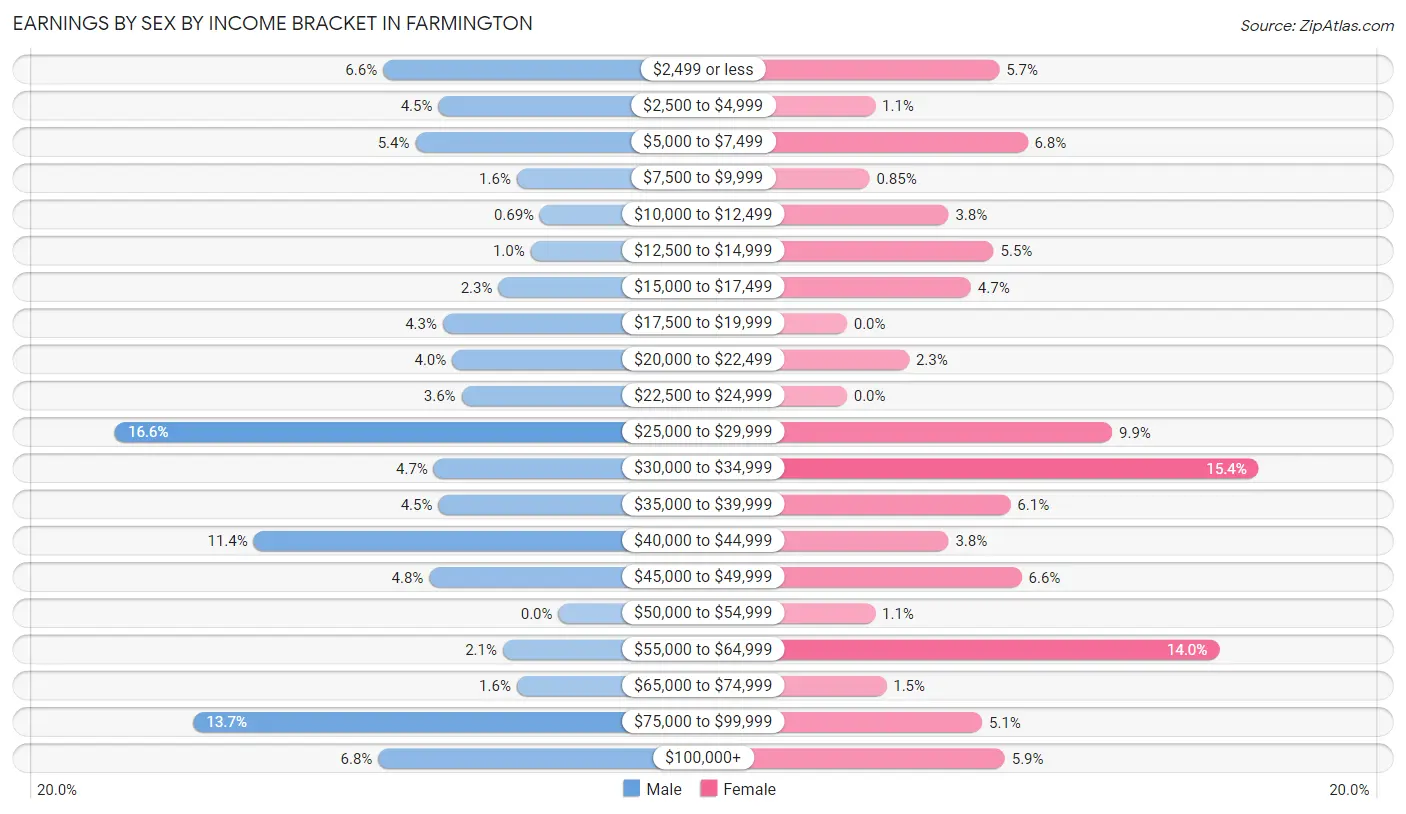
| Income | Male | Female |
| $2,499 or less | 38 (6.6%) | 27 (5.7%) |
| $2,500 to $4,999 | 26 (4.5%) | 5 (1.1%) |
| $5,000 to $7,499 | 31 (5.4%) | 32 (6.8%) |
| $7,500 to $9,999 | 9 (1.6%) | 4 (0.9%) |
| $10,000 to $12,499 | 4 (0.7%) | 18 (3.8%) |
| $12,500 to $14,999 | 6 (1.0%) | 26 (5.5%) |
| $15,000 to $17,499 | 13 (2.2%) | 22 (4.6%) |
| $17,500 to $19,999 | 25 (4.3%) | 0 (0.0%) |
| $20,000 to $22,499 | 23 (4.0%) | 11 (2.3%) |
| $22,500 to $24,999 | 21 (3.6%) | 0 (0.0%) |
| $25,000 to $29,999 | 96 (16.6%) | 47 (9.9%) |
| $30,000 to $34,999 | 27 (4.7%) | 73 (15.4%) |
| $35,000 to $39,999 | 26 (4.5%) | 29 (6.1%) |
| $40,000 to $44,999 | 66 (11.4%) | 18 (3.8%) |
| $45,000 to $49,999 | 28 (4.8%) | 31 (6.6%) |
| $50,000 to $54,999 | 0 (0.0%) | 5 (1.1%) |
| $55,000 to $64,999 | 12 (2.1%) | 66 (14.0%) |
| $65,000 to $74,999 | 9 (1.6%) | 7 (1.5%) |
| $75,000 to $99,999 | 79 (13.7%) | 24 (5.1%) |
| $100,000+ | 39 (6.8%) | 28 (5.9%) |
| Total | 578 (100.0%) | 473 (100.0%) |
Earnings by Sex by Educational Attainment in Farmington
Average earnings in Farmington are $37,404 for men and $34,766 for women, a difference of 7.0%. Men with an educational attainment of college or associate's degree enjoy the highest average annual earnings of $41,719, while those with high school diploma education earn the least with $33,036. Women with an educational attainment of bachelor's degree earn the most with the average annual earnings of $36,250, while those with high school diploma education have the smallest earnings of $33,790.
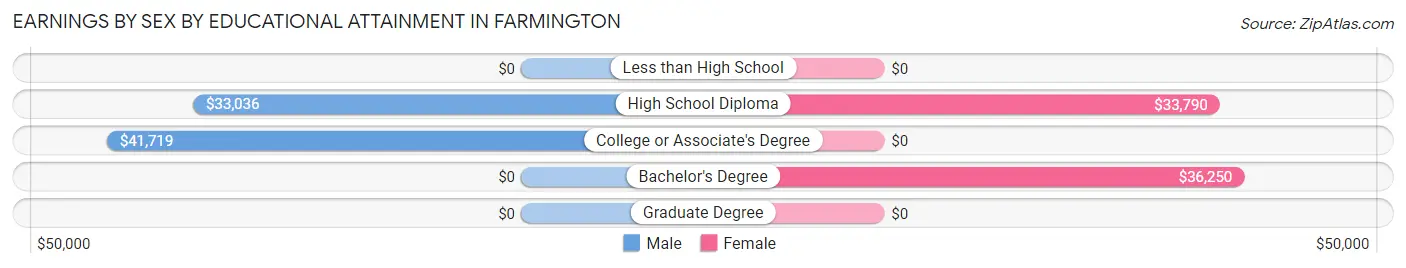
| Educational Attainment | Male Income | Female Income |
| Less than High School | - | - |
| High School Diploma | $33,036 | $33,790 |
| College or Associate's Degree | $41,719 | $0 |
| Bachelor's Degree | - | - |
| Graduate Degree | - | - |
| Total | $37,404 | $34,766 |
Family Income in Farmington
Family Income Brackets in Farmington
According to the Farmington family income data, there are 118 families falling into the $50,000 to $74,999 income range, which is the most common income bracket and makes up 19.4% of all families. Conversely, the $10,000 to $14,999 income bracket is the least frequent group with only 10 families (1.7%) belonging to this category.
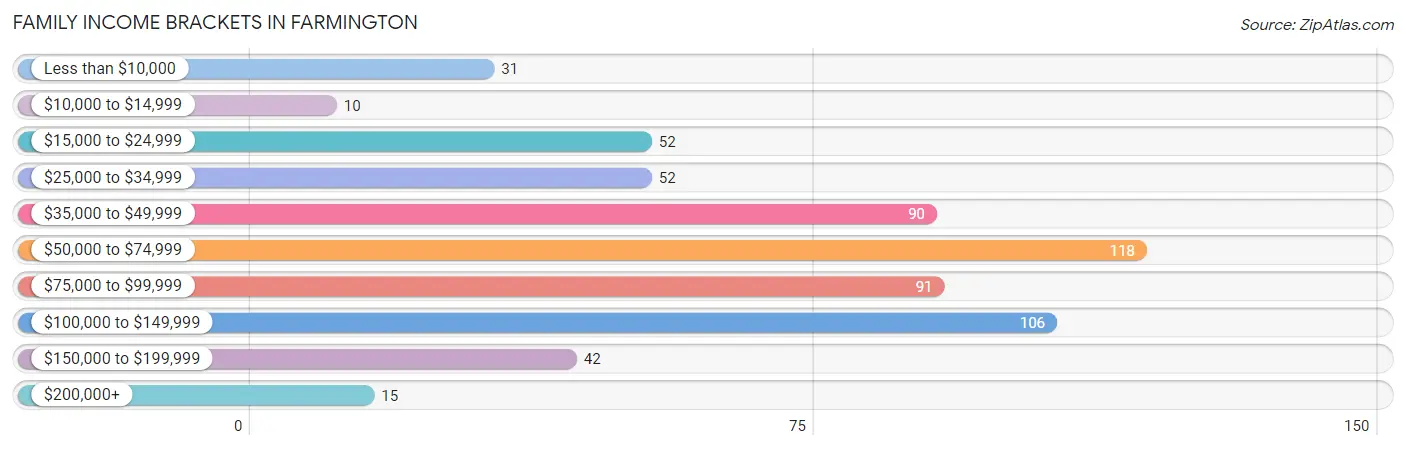
| Income Bracket | # Families | % Families |
| Less than $10,000 | 31 | 5.1% |
| $10,000 to $14,999 | 10 | 1.6% |
| $15,000 to $24,999 | 52 | 8.6% |
| $25,000 to $34,999 | 52 | 8.6% |
| $35,000 to $49,999 | 90 | 14.8% |
| $50,000 to $74,999 | 118 | 19.4% |
| $75,000 to $99,999 | 91 | 15.0% |
| $100,000 to $149,999 | 106 | 17.5% |
| $150,000 to $199,999 | 42 | 6.9% |
| $200,000+ | 15 | 2.5% |
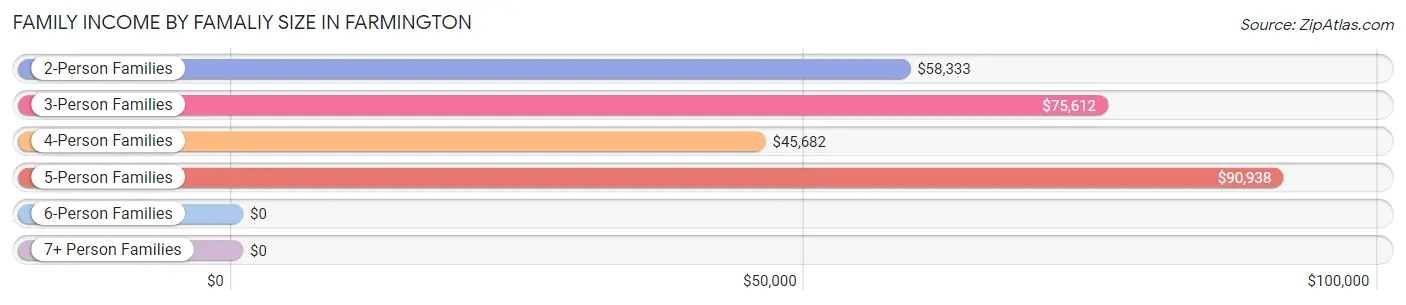
Family Income by Famaliy Size in Farmington
5-person families (25 | 4.1%) account for the highest median family income in Farmington with $90,938 per family, while 2-person families (232 | 38.2%) have the highest median income of $29,166 per family member.
| Income Bracket | # Families | Median Income |
| 2-Person Families | 232 (38.2%) | $58,333 |
| 3-Person Families | 192 (31.6%) | $75,612 |
| 4-Person Families | 108 (17.8%) | $45,682 |
| 5-Person Families | 25 (4.1%) | $90,938 |
| 6-Person Families | 50 (8.2%) | $0 |
| 7+ Person Families | 0 (0.0%) | $0 |
| Total | 607 (100.0%) | $65,250 |
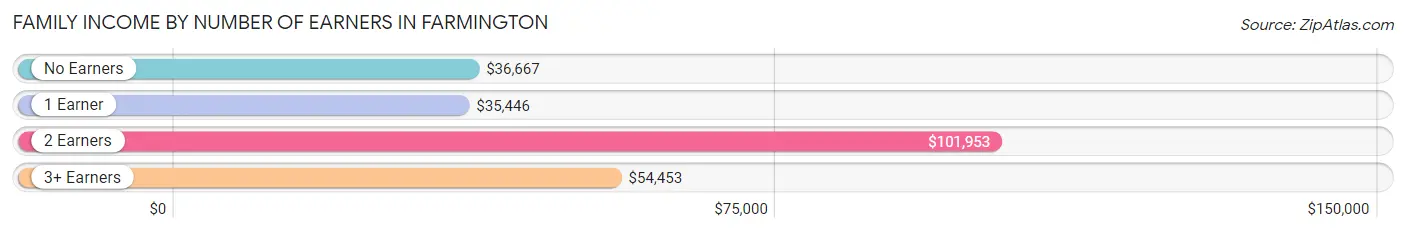
Family Income by Number of Earners in Farmington
The median family income in Farmington is $65,250, with families comprising 2 earners (253) having the highest median family income of $101,953, while families with 1 earner (179) have the lowest median family income of $35,446, accounting for 41.7% and 29.5% of families, respectively.
| Number of Earners | # Families | Median Income |
| No Earners | 120 (19.8%) | $36,667 |
| 1 Earner | 179 (29.5%) | $35,446 |
| 2 Earners | 253 (41.7%) | $101,953 |
| 3+ Earners | 55 (9.1%) | $54,453 |
| Total | 607 (100.0%) | $65,250 |
Household Income in Farmington
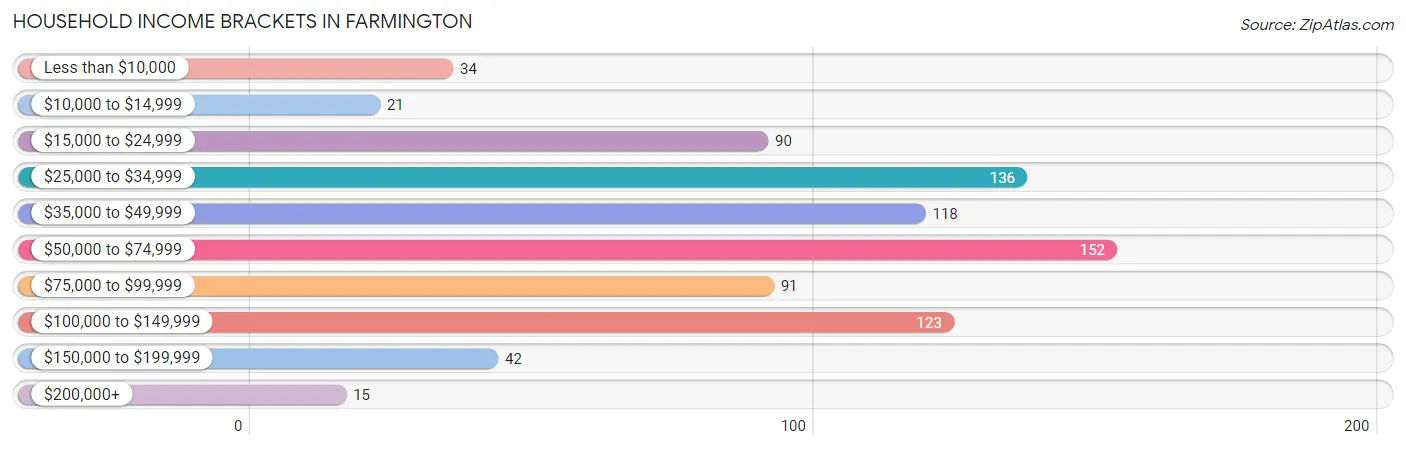
Household Income Brackets in Farmington
With 152 households falling in the category, the $50,000 to $74,999 income range is the most frequent in Farmington, accounting for 18.5% of all households. In contrast, only 15 households (1.8%) fall into the $200,000+ income bracket, making it the least populous group.
| Income Bracket | # Households | % Households |
| Less than $10,000 | 34 | 4.1% |
| $10,000 to $14,999 | 21 | 2.6% |
| $15,000 to $24,999 | 90 | 10.9% |
| $25,000 to $34,999 | 136 | 16.5% |
| $35,000 to $49,999 | 118 | 14.4% |
| $50,000 to $74,999 | 152 | 18.5% |
| $75,000 to $99,999 | 91 | 11.1% |
| $100,000 to $149,999 | 123 | 15.0% |
| $150,000 to $199,999 | 42 | 5.1% |
| $200,000+ | 15 | 1.8% |
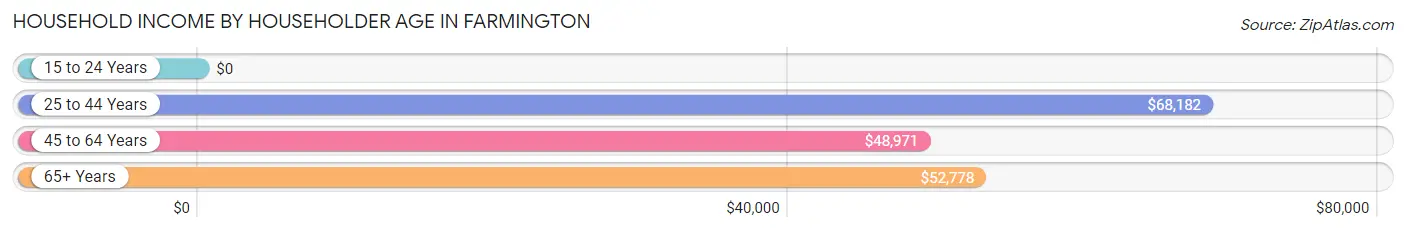
Household Income by Householder Age in Farmington
The median household income in Farmington is $53,015, with the highest median household income of $68,182 found in the 25 to 44 years age bracket for the primary householder. A total of 280 households (34.1%) fall into this category. Meanwhile, the 15 to 24 years age bracket for the primary householder has the lowest median household income of $0, with 14 households (1.7%) in this group.
| Income Bracket | # Households | Median Income |
| 15 to 24 Years | 14 (1.7%) | $0 |
| 25 to 44 Years | 280 (34.1%) | $68,182 |
| 45 to 64 Years | 292 (35.5%) | $48,971 |
| 65+ Years | 236 (28.7%) | $52,778 |
| Total | 822 (100.0%) | $53,015 |
Poverty in Farmington
Income Below Poverty by Sex and Age in Farmington
With 8.6% poverty level for males and 27.2% for females among the residents of Farmington, 16 and 17 year old males and 18 to 24 year old females are the most vulnerable to poverty, with 13 males (41.9%) and 64 females (80.0%) in their respective age groups living below the poverty level.
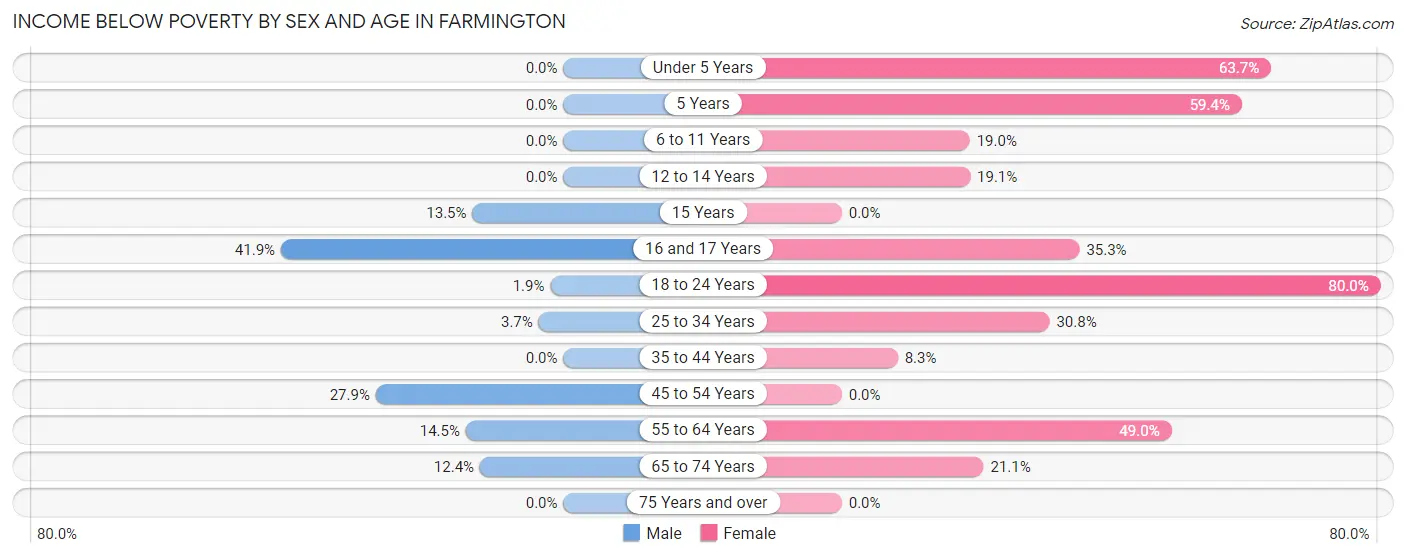
| Age Bracket | Male | Female |
| Under 5 Years | 0 (0.0%) | 65 (63.7%) |
| 5 Years | 0 (0.0%) | 19 (59.4%) |
| 6 to 11 Years | 0 (0.0%) | 19 (19.0%) |
| 12 to 14 Years | 0 (0.0%) | 20 (19.1%) |
| 15 Years | 5 (13.5%) | 0 (0.0%) |
| 16 and 17 Years | 13 (41.9%) | 18 (35.3%) |
| 18 to 24 Years | 2 (1.9%) | 64 (80.0%) |
| 25 to 34 Years | 4 (3.7%) | 33 (30.8%) |
| 35 to 44 Years | 0 (0.0%) | 19 (8.3%) |
| 45 to 54 Years | 39 (27.9%) | 0 (0.0%) |
| 55 to 64 Years | 20 (14.5%) | 93 (48.9%) |
| 65 to 74 Years | 14 (12.4%) | 28 (21.0%) |
| 75 Years and over | 0 (0.0%) | 0 (0.0%) |
| Total | 97 (8.6%) | 378 (27.2%) |
Income Above Poverty by Sex and Age in Farmington
According to the poverty statistics in Farmington, males aged under 5 years and females aged 15 years are the age groups that are most secure financially, with 100.0% of males and 100.0% of females in these age groups living above the poverty line.
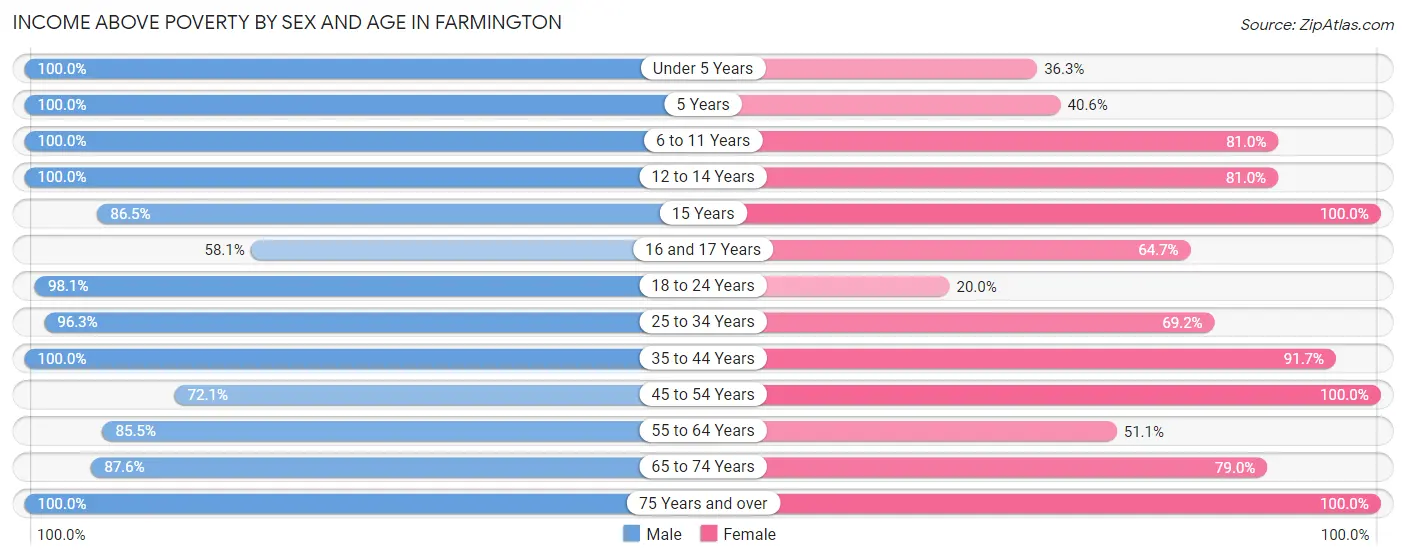
| Age Bracket | Male | Female |
| Under 5 Years | 127 (100.0%) | 37 (36.3%) |
| 5 Years | 20 (100.0%) | 13 (40.6%) |
| 6 to 11 Years | 23 (100.0%) | 81 (81.0%) |
| 12 to 14 Years | 98 (100.0%) | 85 (80.9%) |
| 15 Years | 32 (86.5%) | 37 (100.0%) |
| 16 and 17 Years | 18 (58.1%) | 33 (64.7%) |
| 18 to 24 Years | 101 (98.1%) | 16 (20.0%) |
| 25 to 34 Years | 105 (96.3%) | 74 (69.2%) |
| 35 to 44 Years | 138 (100.0%) | 210 (91.7%) |
| 45 to 54 Years | 101 (72.1%) | 116 (100.0%) |
| 55 to 64 Years | 118 (85.5%) | 97 (51.0%) |
| 65 to 74 Years | 99 (87.6%) | 105 (78.9%) |
| 75 Years and over | 50 (100.0%) | 107 (100.0%) |
| Total | 1,030 (91.4%) | 1,011 (72.8%) |
Income Below Poverty Among Married-Couple Families in Farmington
The poverty statistics for married-couple families in Farmington show that 7.0% or 29 of the total 413 families live below the poverty line. Families with 1 or 2 children have the highest poverty rate of 8.2%, comprising of 15 families. On the other hand, families with 3 or 4 children have the lowest poverty rate of 0.0%, which includes 0 families.
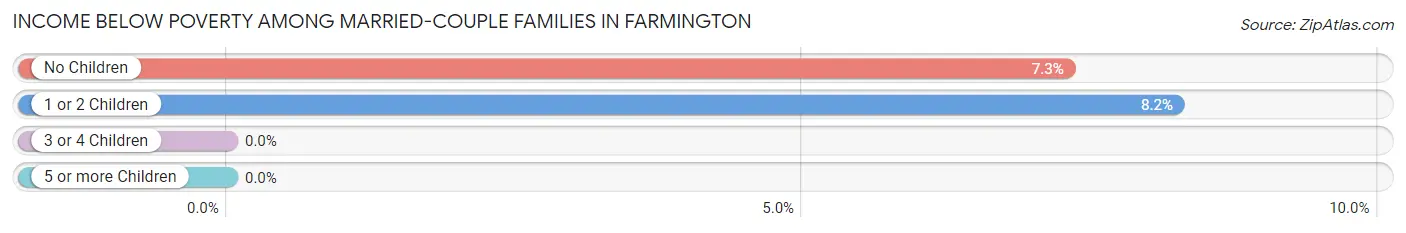
| Children | Above Poverty | Below Poverty |
| No Children | 178 (92.7%) | 14 (7.3%) |
| 1 or 2 Children | 167 (91.8%) | 15 (8.2%) |
| 3 or 4 Children | 39 (100.0%) | 0 (0.0%) |
| 5 or more Children | 0 (0.0%) | 0 (0.0%) |
| Total | 384 (93.0%) | 29 (7.0%) |
Income Below Poverty Among Single-Parent Households in Farmington
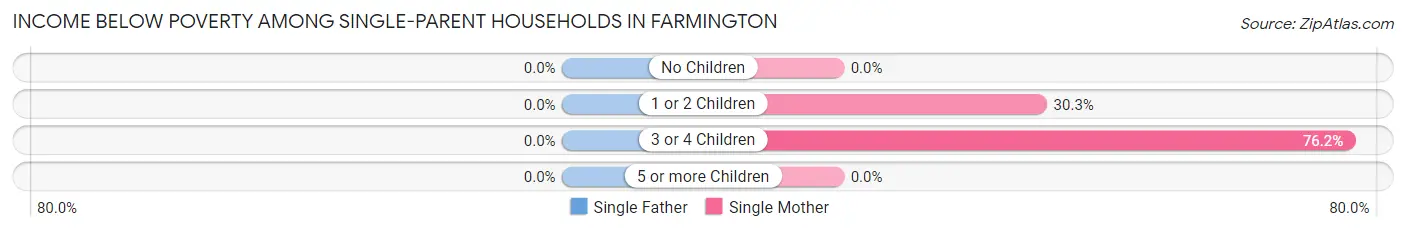
| Children | Single Father | Single Mother |
| No Children | 0 (0.0%) | 0 (0.0%) |
| 1 or 2 Children | 0 (0.0%) | 36 (30.2%) |
| 3 or 4 Children | 0 (0.0%) | 16 (76.2%) |
| 5 or more Children | 0 (0.0%) | 0 (0.0%) |
| Total | 0 (0.0%) | 52 (28.9%) |
Income Below Poverty Among Married-Couple vs Single-Parent Households in Farmington
The poverty data for Farmington shows that 29 of the married-couple family households (7.0%) and 52 of the single-parent households (26.8%) are living below the poverty level. Within the married-couple family households, those with 1 or 2 children have the highest poverty rate, with 15 households (8.2%) falling below the poverty line. Among the single-parent households, those with 3 or 4 children have the highest poverty rate, with 16 household (76.2%) living below poverty.
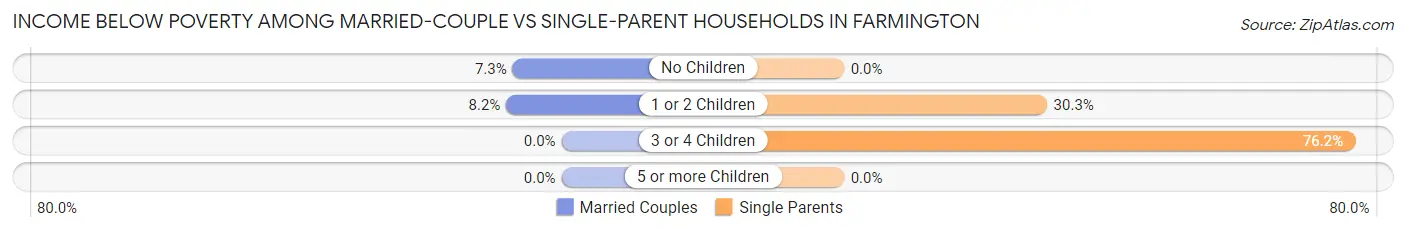
| Children | Married-Couple Families | Single-Parent Households |
| No Children | 14 (7.3%) | 0 (0.0%) |
| 1 or 2 Children | 15 (8.2%) | 36 (30.2%) |
| 3 or 4 Children | 0 (0.0%) | 16 (76.2%) |
| 5 or more Children | 0 (0.0%) | 0 (0.0%) |
| Total | 29 (7.0%) | 52 (26.8%) |
Employment Characteristics in Farmington
Employment by Class of Employer in Farmington
Among the 965 employed individuals in Farmington, private company employees (591 | 61.2%), not-for-profit organizations (109 | 11.3%), and local government employees (99 | 10.3%) make up the most common classes of employment.
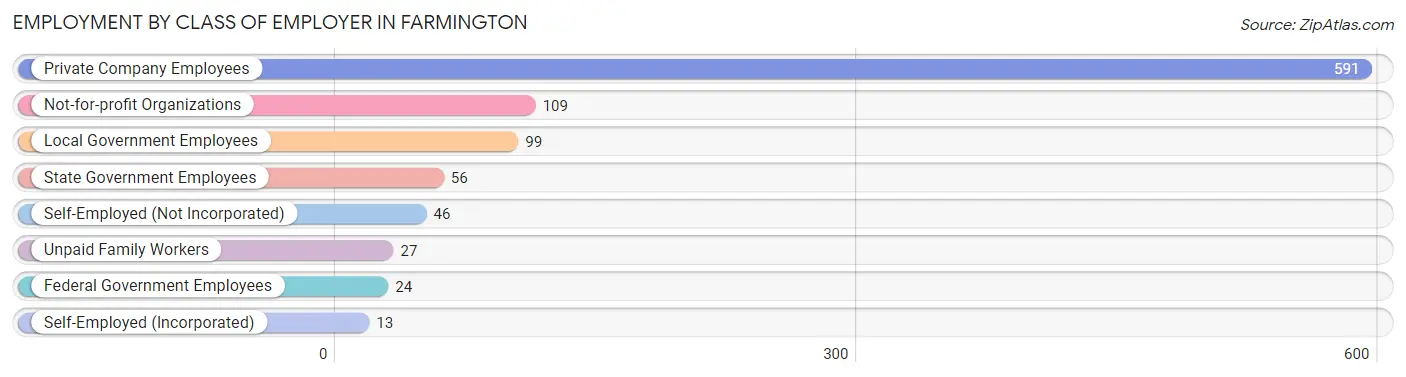
| Employer Class | # Employees | % Employees |
| Private Company Employees | 591 | 61.2% |
| Self-Employed (Incorporated) | 13 | 1.3% |
| Self-Employed (Not Incorporated) | 46 | 4.8% |
| Not-for-profit Organizations | 109 | 11.3% |
| Local Government Employees | 99 | 10.3% |
| State Government Employees | 56 | 5.8% |
| Federal Government Employees | 24 | 2.5% |
| Unpaid Family Workers | 27 | 2.8% |
| Total | 965 | 100.0% |
Employment Status by Age in Farmington
According to the labor force statistics for Farmington, out of the total population over 16 years of age (1,835), 55.6% or 1,020 individuals are in the labor force, with 4.9% or 50 of them unemployed. The age group with the highest labor force participation rate is 35 to 44 years, with 93.7% or 344 individuals in the labor force. Within the labor force, the 20 to 24 years age range has the highest percentage of unemployed individuals, with 19.7% or 15 of them being unemployed.
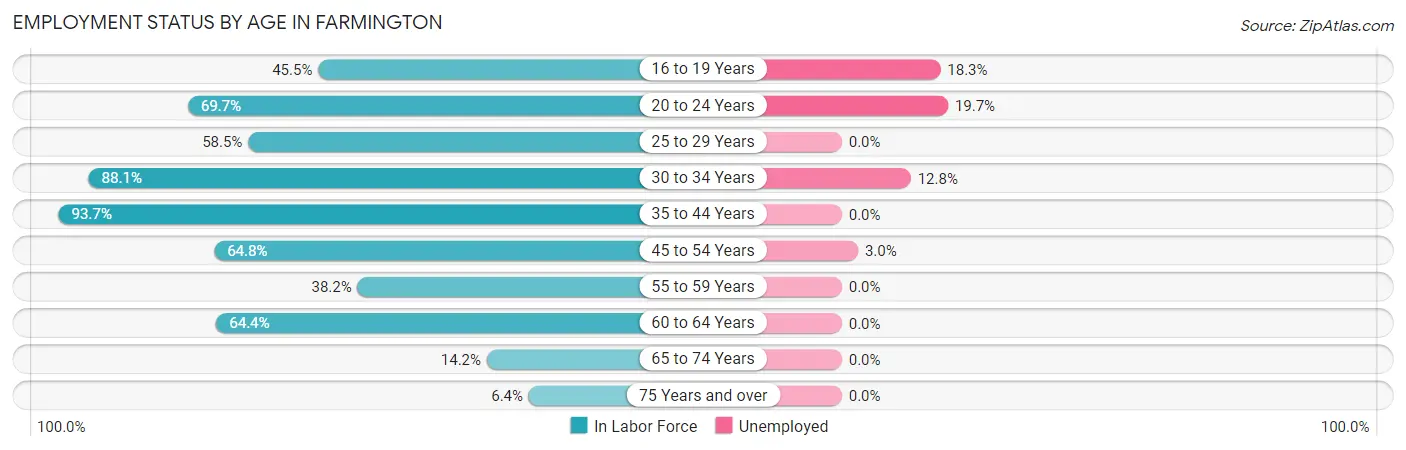
| Age Bracket | In Labor Force | Unemployed |
| 16 to 19 Years | 71 (45.5%) | 13 (18.3%) |
| 20 to 24 Years | 76 (69.7%) | 15 (19.7%) |
| 25 to 29 Years | 38 (58.5%) | 0 (0.0%) |
| 30 to 34 Years | 133 (88.1%) | 17 (12.8%) |
| 35 to 44 Years | 344 (93.7%) | 0 (0.0%) |
| 45 to 54 Years | 166 (64.8%) | 5 (3.0%) |
| 55 to 59 Years | 92 (38.2%) | 0 (0.0%) |
| 60 to 64 Years | 56 (64.4%) | 0 (0.0%) |
| 65 to 74 Years | 35 (14.2%) | 0 (0.0%) |
| 75 Years and over | 10 (6.4%) | 0 (0.0%) |
| Total | 1,020 (55.6%) | 50 (4.9%) |
Employment Status by Educational Attainment in Farmington
According to labor force statistics for Farmington, 71.0% of individuals (829) out of the total population between 25 and 64 years of age (1,167) are in the labor force, with 2.7% or 22 of them being unemployed. The group with the highest labor force participation rate are those with the educational attainment of bachelor's degree or higher, with 100.0% or 179 individuals in the labor force. Within the labor force, individuals with college / associate degree education have the highest percentage of unemployment, with 6.5% or 17 of them being unemployed.
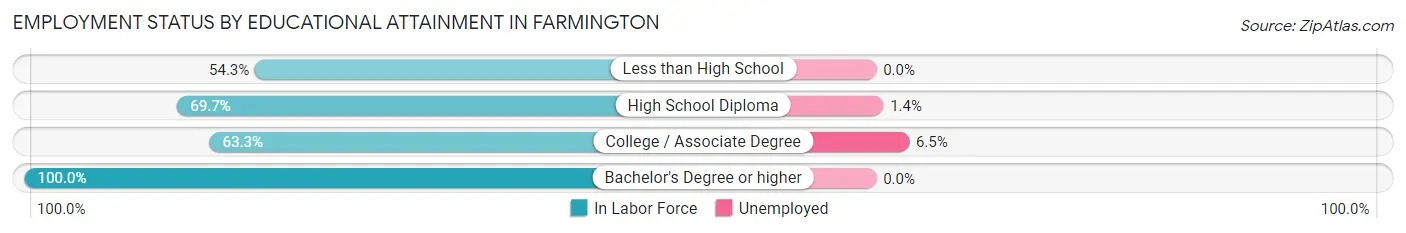
| Educational Attainment | In Labor Force | Unemployed |
| Less than High School | 44 (54.3%) | 0 (0.0%) |
| High School Diploma | 345 (69.7%) | 7 (1.4%) |
| College / Associate Degree | 261 (63.3%) | 27 (6.5%) |
| Bachelor's Degree or higher | 179 (100.0%) | 0 (0.0%) |
| Total | 829 (71.0%) | 32 (2.7%) |
Employment Occupations by Sex in Farmington
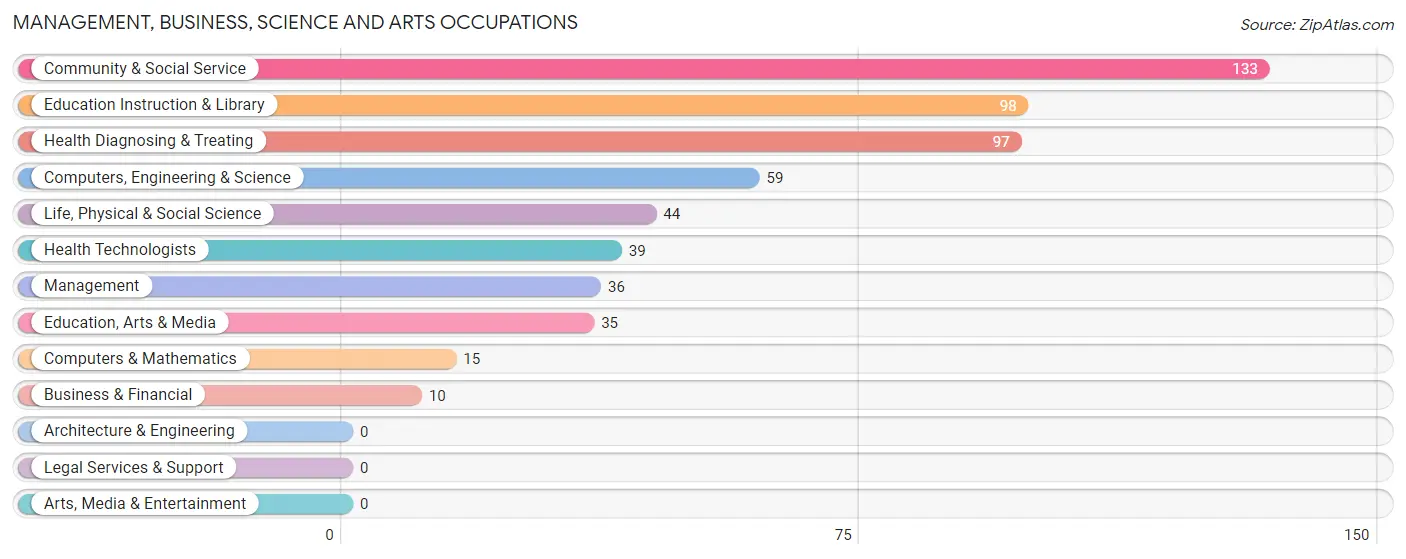
Management, Business, Science and Arts Occupations
The most common Management, Business, Science and Arts occupations in Farmington are Community & Social Service (133 | 13.7%), Education Instruction & Library (98 | 10.1%), Health Diagnosing & Treating (97 | 10.0%), Computers, Engineering & Science (59 | 6.1%), and Life, Physical & Social Science (44 | 4.5%).
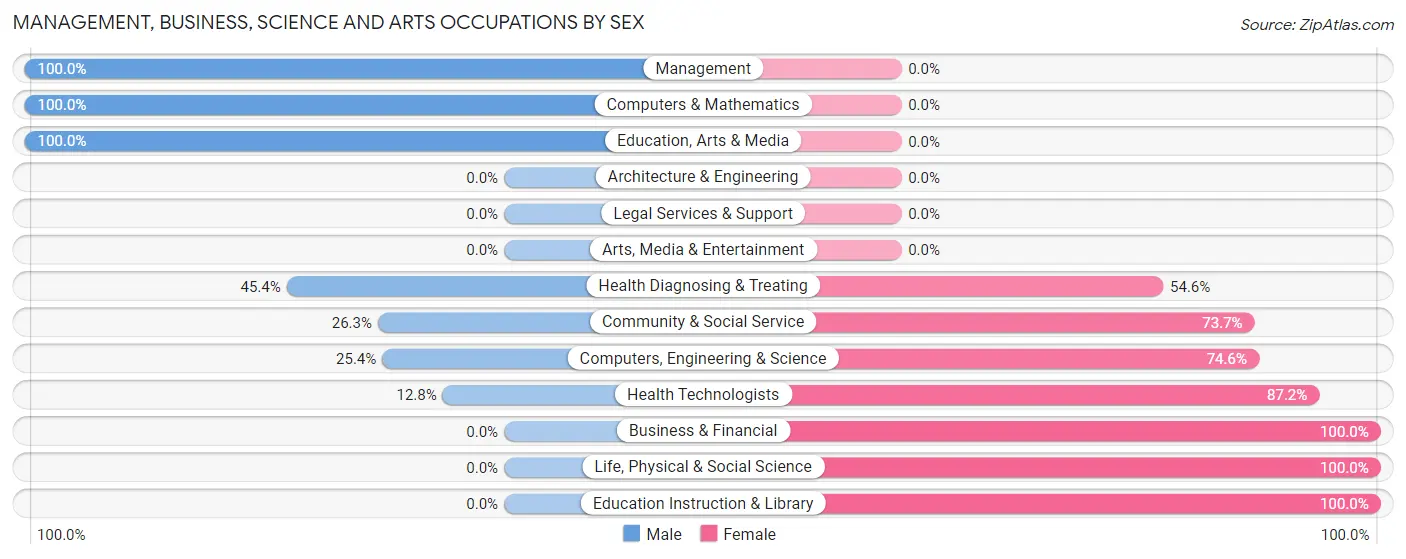
Management, Business, Science and Arts Occupations by Sex
Within the Management, Business, Science and Arts occupations in Farmington, the most male-oriented occupations are Management (100.0%), Computers & Mathematics (100.0%), and Education, Arts & Media (100.0%), while the most female-oriented occupations are Business & Financial (100.0%), Life, Physical & Social Science (100.0%), and Education Instruction & Library (100.0%).
| Occupation | Male | Female |
| Management | 36 (100.0%) | 0 (0.0%) |
| Business & Financial | 0 (0.0%) | 10 (100.0%) |
| Computers, Engineering & Science | 15 (25.4%) | 44 (74.6%) |
| Computers & Mathematics | 15 (100.0%) | 0 (0.0%) |
| Architecture & Engineering | 0 (0.0%) | 0 (0.0%) |
| Life, Physical & Social Science | 0 (0.0%) | 44 (100.0%) |
| Community & Social Service | 35 (26.3%) | 98 (73.7%) |
| Education, Arts & Media | 35 (100.0%) | 0 (0.0%) |
| Legal Services & Support | 0 (0.0%) | 0 (0.0%) |
| Education Instruction & Library | 0 (0.0%) | 98 (100.0%) |
| Arts, Media & Entertainment | 0 (0.0%) | 0 (0.0%) |
| Health Diagnosing & Treating | 44 (45.4%) | 53 (54.6%) |
| Health Technologists | 5 (12.8%) | 34 (87.2%) |
| Total (Category) | 130 (38.8%) | 205 (61.2%) |
| Total (Overall) | 522 (53.8%) | 449 (46.2%) |
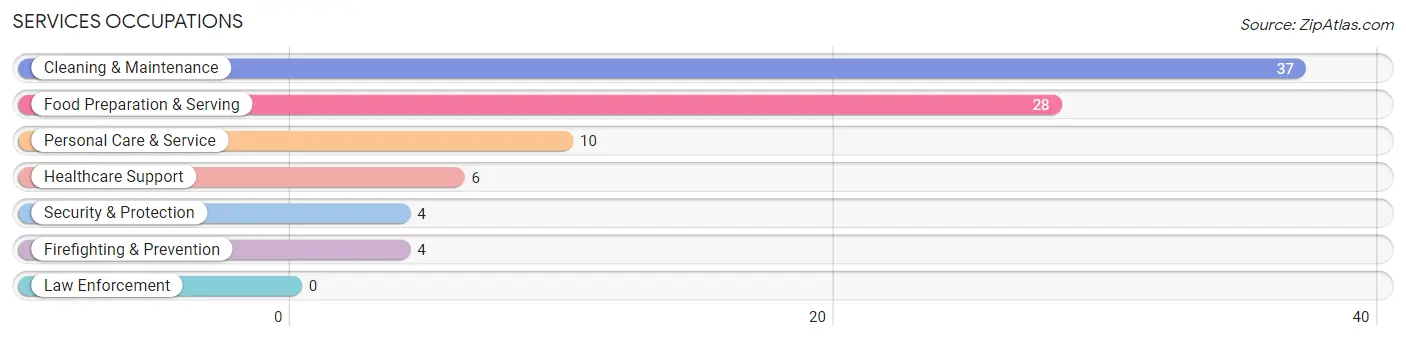
Services Occupations
The most common Services occupations in Farmington are Cleaning & Maintenance (37 | 3.8%), Food Preparation & Serving (28 | 2.9%), Personal Care & Service (10 | 1.0%), Healthcare Support (6 | 0.6%), and Security & Protection (4 | 0.4%).
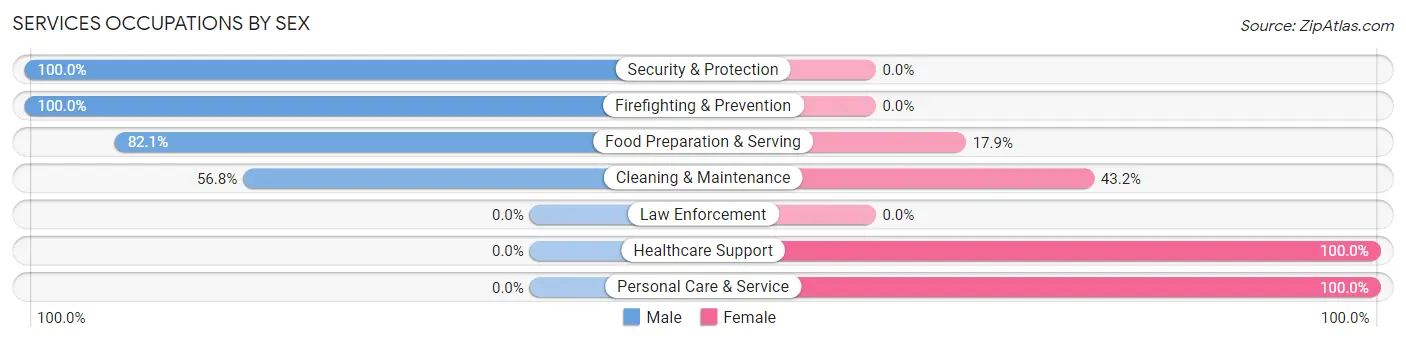
Services Occupations by Sex
Within the Services occupations in Farmington, the most male-oriented occupations are Security & Protection (100.0%), Firefighting & Prevention (100.0%), and Food Preparation & Serving (82.1%), while the most female-oriented occupations are Healthcare Support (100.0%), Personal Care & Service (100.0%), and Cleaning & Maintenance (43.2%).
| Occupation | Male | Female |
| Healthcare Support | 0 (0.0%) | 6 (100.0%) |
| Security & Protection | 4 (100.0%) | 0 (0.0%) |
| Firefighting & Prevention | 4 (100.0%) | 0 (0.0%) |
| Law Enforcement | 0 (0.0%) | 0 (0.0%) |
| Food Preparation & Serving | 23 (82.1%) | 5 (17.9%) |
| Cleaning & Maintenance | 21 (56.8%) | 16 (43.2%) |
| Personal Care & Service | 0 (0.0%) | 10 (100.0%) |
| Total (Category) | 48 (56.5%) | 37 (43.5%) |
| Total (Overall) | 522 (53.8%) | 449 (46.2%) |
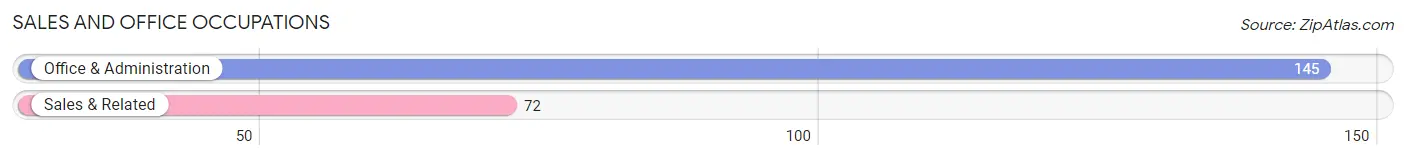
Sales and Office Occupations
The most common Sales and Office occupations in Farmington are Office & Administration (145 | 14.9%), and Sales & Related (72 | 7.4%).
Sales and Office Occupations by Sex
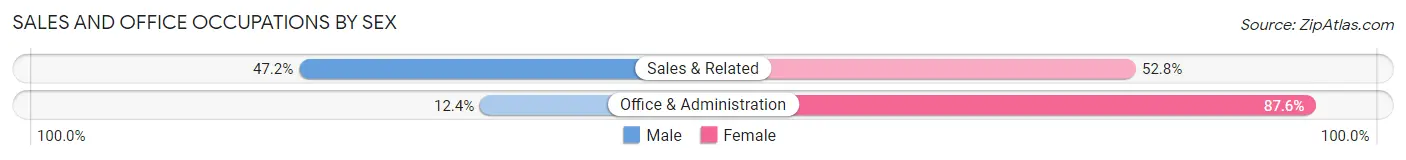
| Occupation | Male | Female |
| Sales & Related | 34 (47.2%) | 38 (52.8%) |
| Office & Administration | 18 (12.4%) | 127 (87.6%) |
| Total (Category) | 52 (24.0%) | 165 (76.0%) |
| Total (Overall) | 522 (53.8%) | 449 (46.2%) |
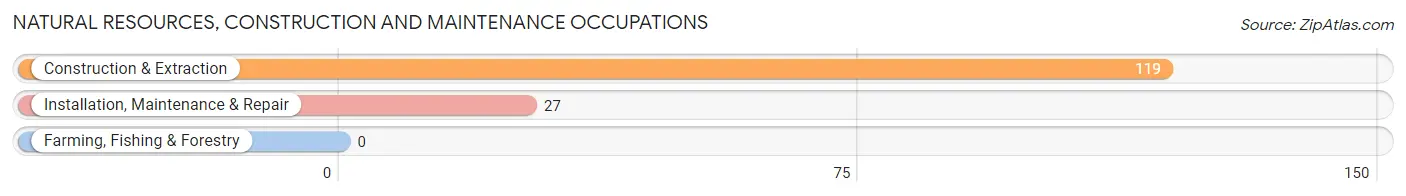
Natural Resources, Construction and Maintenance Occupations
The most common Natural Resources, Construction and Maintenance occupations in Farmington are Construction & Extraction (119 | 12.3%), and Installation, Maintenance & Repair (27 | 2.8%).
Natural Resources, Construction and Maintenance Occupations by Sex
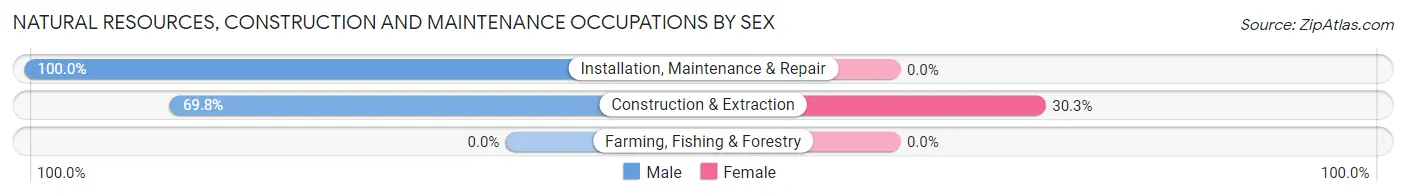
| Occupation | Male | Female |
| Farming, Fishing & Forestry | 0 (0.0%) | 0 (0.0%) |
| Construction & Extraction | 83 (69.8%) | 36 (30.2%) |
| Installation, Maintenance & Repair | 27 (100.0%) | 0 (0.0%) |
| Total (Category) | 110 (75.3%) | 36 (24.7%) |
| Total (Overall) | 522 (53.8%) | 449 (46.2%) |
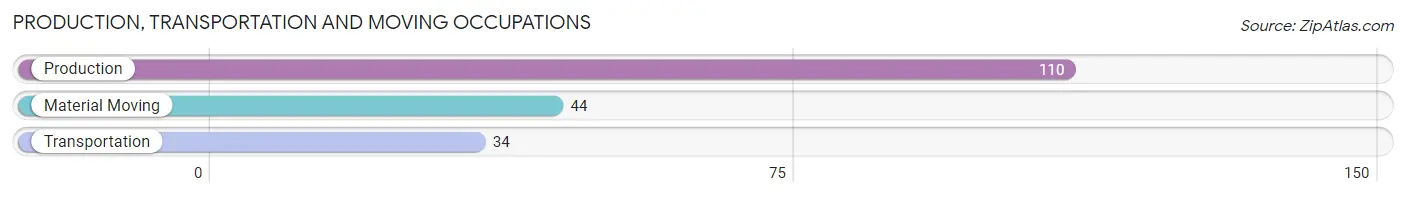
Production, Transportation and Moving Occupations
The most common Production, Transportation and Moving occupations in Farmington are Production (110 | 11.3%), Material Moving (44 | 4.5%), and Transportation (34 | 3.5%).
Production, Transportation and Moving Occupations by Sex
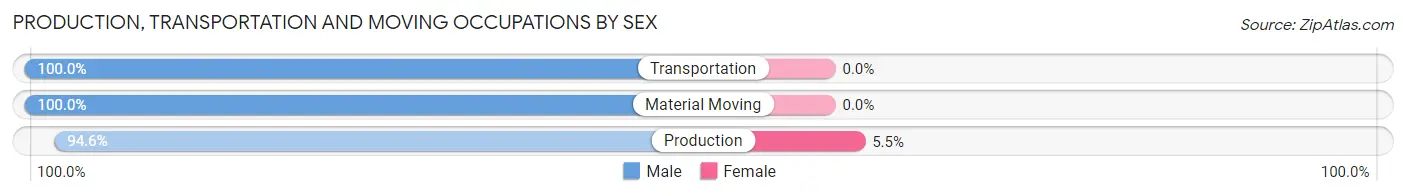
| Occupation | Male | Female |
| Production | 104 (94.6%) | 6 (5.4%) |
| Transportation | 34 (100.0%) | 0 (0.0%) |
| Material Moving | 44 (100.0%) | 0 (0.0%) |
| Total (Category) | 182 (96.8%) | 6 (3.2%) |
| Total (Overall) | 522 (53.8%) | 449 (46.2%) |
Employment Industries by Sex in Farmington
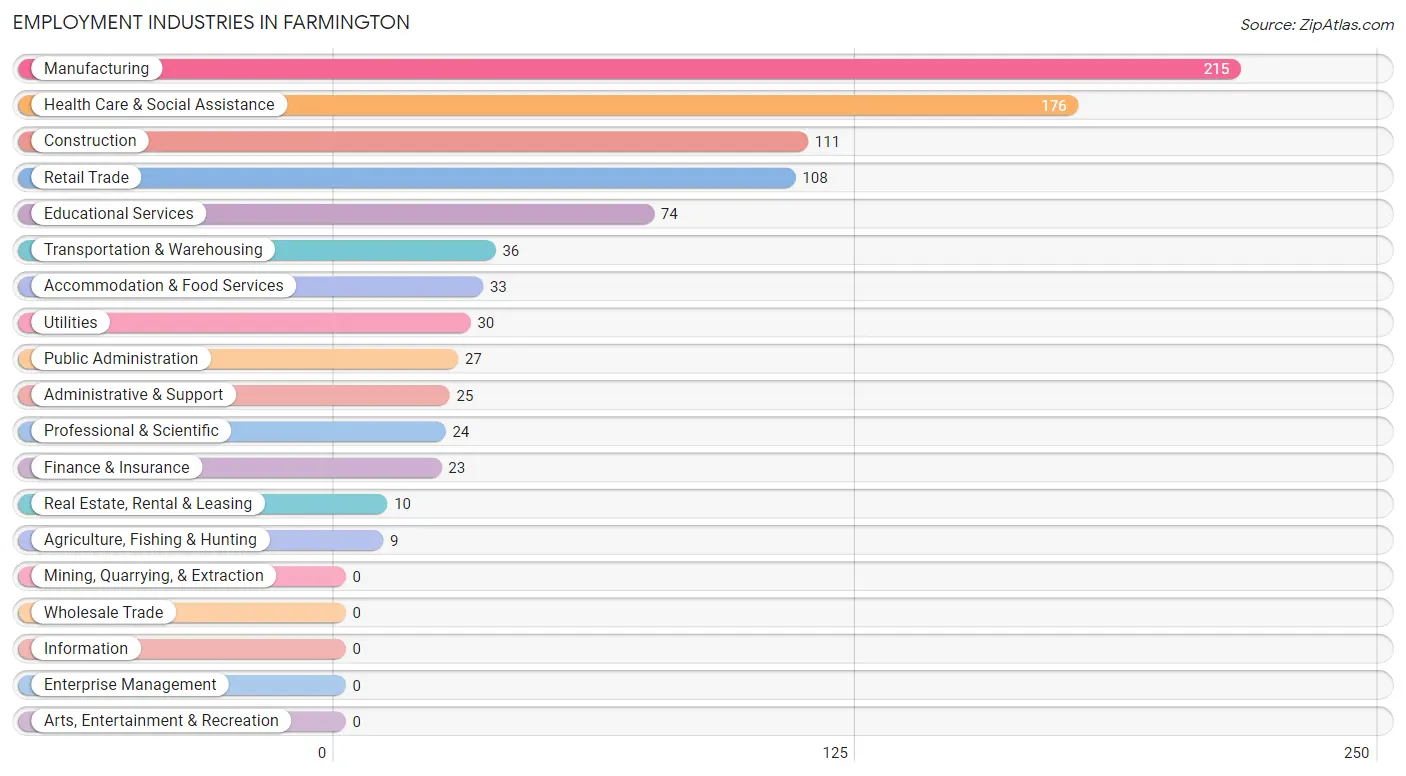
Employment Industries in Farmington
The major employment industries in Farmington include Manufacturing (215 | 22.1%), Health Care & Social Assistance (176 | 18.1%), Construction (111 | 11.4%), Retail Trade (108 | 11.1%), and Educational Services (74 | 7.6%).
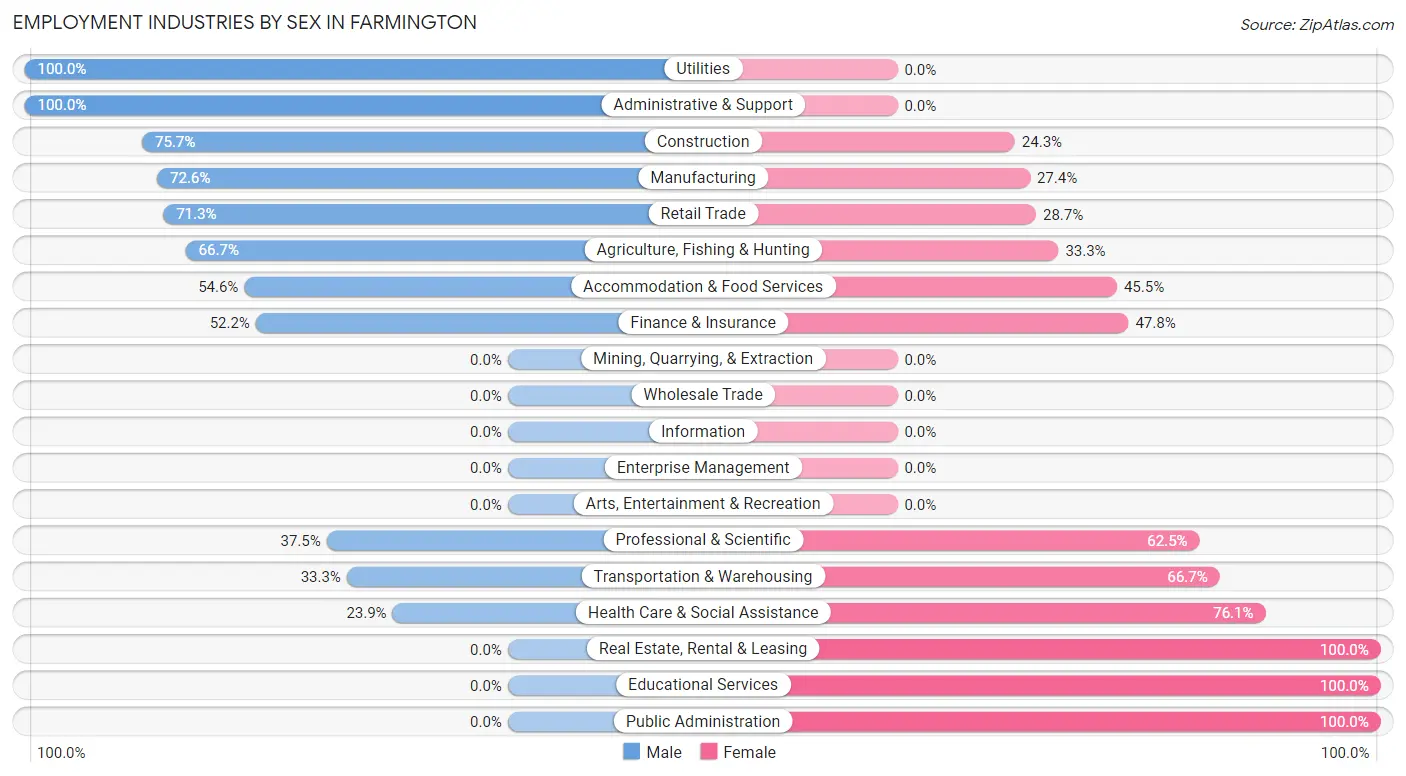
Employment Industries by Sex in Farmington
The Farmington industries that see more men than women are Utilities (100.0%), Administrative & Support (100.0%), and Construction (75.7%), whereas the industries that tend to have a higher number of women are Real Estate, Rental & Leasing (100.0%), Educational Services (100.0%), and Public Administration (100.0%).
| Industry | Male | Female |
| Agriculture, Fishing & Hunting | 6 (66.7%) | 3 (33.3%) |
| Mining, Quarrying, & Extraction | 0 (0.0%) | 0 (0.0%) |
| Construction | 84 (75.7%) | 27 (24.3%) |
| Manufacturing | 156 (72.6%) | 59 (27.4%) |
| Wholesale Trade | 0 (0.0%) | 0 (0.0%) |
| Retail Trade | 77 (71.3%) | 31 (28.7%) |
| Transportation & Warehousing | 12 (33.3%) | 24 (66.7%) |
| Utilities | 30 (100.0%) | 0 (0.0%) |
| Information | 0 (0.0%) | 0 (0.0%) |
| Finance & Insurance | 12 (52.2%) | 11 (47.8%) |
| Real Estate, Rental & Leasing | 0 (0.0%) | 10 (100.0%) |
| Professional & Scientific | 9 (37.5%) | 15 (62.5%) |
| Enterprise Management | 0 (0.0%) | 0 (0.0%) |
| Administrative & Support | 25 (100.0%) | 0 (0.0%) |
| Educational Services | 0 (0.0%) | 74 (100.0%) |
| Health Care & Social Assistance | 42 (23.9%) | 134 (76.1%) |
| Arts, Entertainment & Recreation | 0 (0.0%) | 0 (0.0%) |
| Accommodation & Food Services | 18 (54.5%) | 15 (45.5%) |
| Public Administration | 0 (0.0%) | 27 (100.0%) |
| Total | 522 (53.8%) | 449 (46.2%) |
Education in Farmington
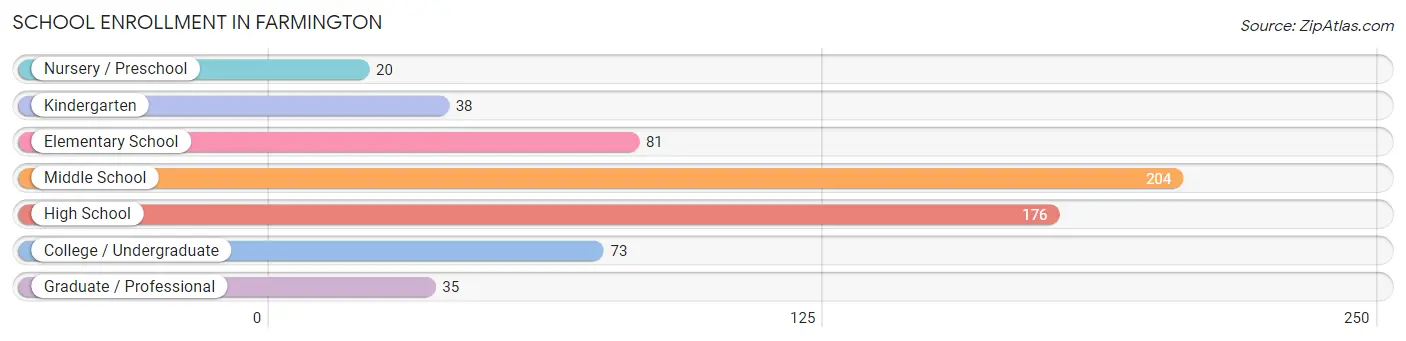
School Enrollment in Farmington
The most common levels of schooling among the 627 students in Farmington are middle school (204 | 32.5%), high school (176 | 28.1%), and elementary school (81 | 12.9%).
| School Level | # Students | % Students |
| Nursery / Preschool | 20 | 3.2% |
| Kindergarten | 38 | 6.1% |
| Elementary School | 81 | 12.9% |
| Middle School | 204 | 32.5% |
| High School | 176 | 28.1% |
| College / Undergraduate | 73 | 11.6% |
| Graduate / Professional | 35 | 5.6% |
| Total | 627 | 100.0% |
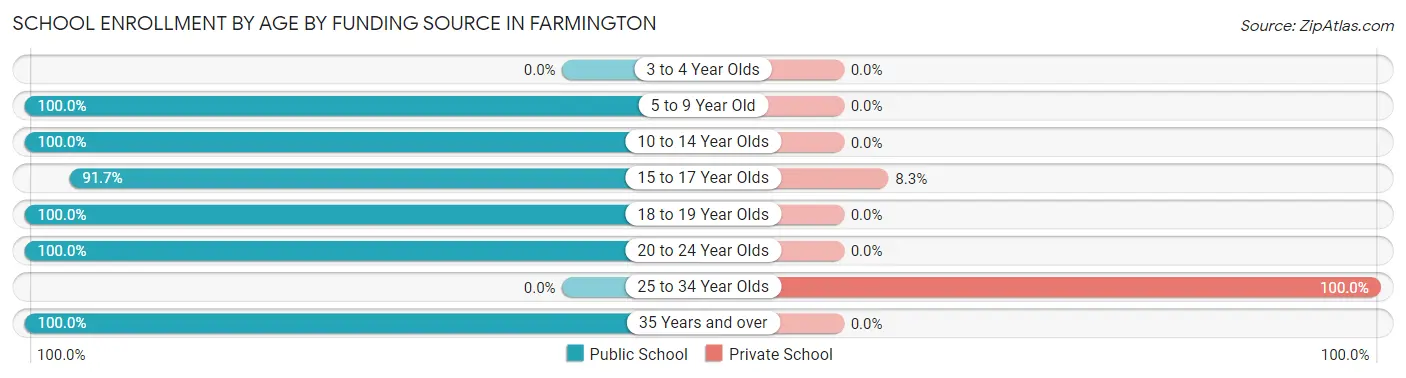
School Enrollment by Age by Funding Source in Farmington
Out of a total of 627 students who are enrolled in schools in Farmington, 17 (2.7%) attend a private institution, while the remaining 610 (97.3%) are enrolled in public schools. The age group of 25 to 34 year olds has the highest likelihood of being enrolled in private schools, with 4 (100.0% in the age bracket) enrolled. Conversely, the age group of 5 to 9 year old has the lowest likelihood of being enrolled in a private school, with 105 (100.0% in the age bracket) attending a public institution.
| Age Bracket | Public School | Private School |
| 3 to 4 Year Olds | 0 (0.0%) | 0 (0.0%) |
| 5 to 9 Year Old | 105 (100.0%) | 0 (0.0%) |
| 10 to 14 Year Olds | 254 (100.0%) | 0 (0.0%) |
| 15 to 17 Year Olds | 143 (91.7%) | 13 (8.3%) |
| 18 to 19 Year Olds | 44 (100.0%) | 0 (0.0%) |
| 20 to 24 Year Olds | 4 (100.0%) | 0 (0.0%) |
| 25 to 34 Year Olds | 0 (0.0%) | 4 (100.0%) |
| 35 Years and over | 60 (100.0%) | 0 (0.0%) |
| Total | 610 (97.3%) | 17 (2.7%) |
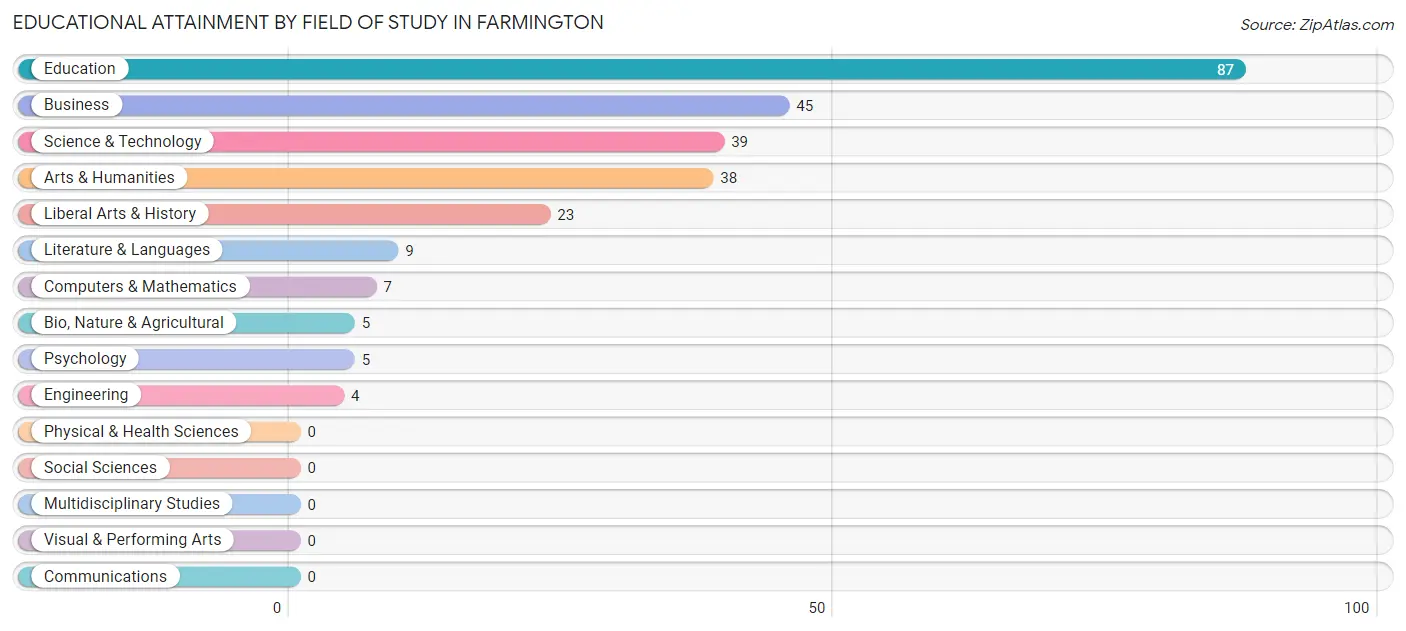
Educational Attainment by Field of Study in Farmington
Education (87 | 33.2%), business (45 | 17.2%), science & technology (39 | 14.9%), arts & humanities (38 | 14.5%), and liberal arts & history (23 | 8.8%) are the most common fields of study among 262 individuals in Farmington who have obtained a bachelor's degree or higher.
| Field of Study | # Graduates | % Graduates |
| Computers & Mathematics | 7 | 2.7% |
| Bio, Nature & Agricultural | 5 | 1.9% |
| Physical & Health Sciences | 0 | 0.0% |
| Psychology | 5 | 1.9% |
| Social Sciences | 0 | 0.0% |
| Engineering | 4 | 1.5% |
| Multidisciplinary Studies | 0 | 0.0% |
| Science & Technology | 39 | 14.9% |
| Business | 45 | 17.2% |
| Education | 87 | 33.2% |
| Literature & Languages | 9 | 3.4% |
| Liberal Arts & History | 23 | 8.8% |
| Visual & Performing Arts | 0 | 0.0% |
| Communications | 0 | 0.0% |
| Arts & Humanities | 38 | 14.5% |
| Total | 262 | 100.0% |
Transportation & Commute in Farmington
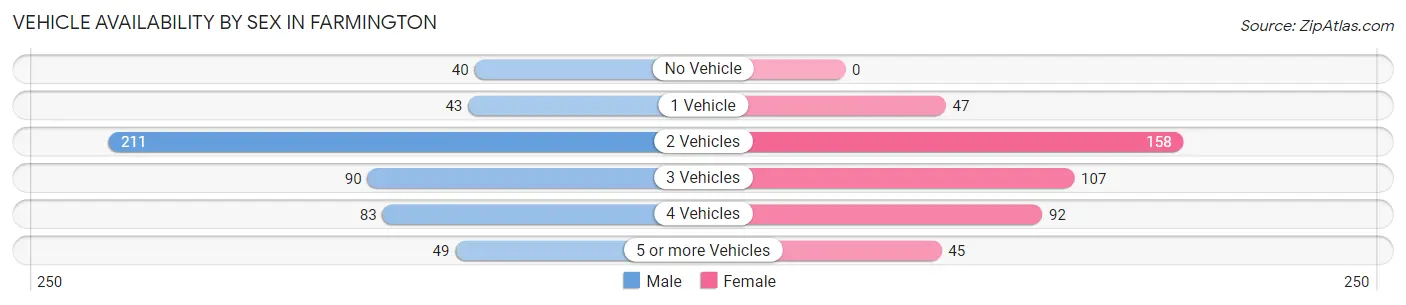
Vehicle Availability by Sex in Farmington
The most prevalent vehicle ownership categories in Farmington are males with 2 vehicles (211, accounting for 40.9%) and females with 2 vehicles (158, making up 47.0%).
| Vehicles Available | Male | Female |
| No Vehicle | 40 (7.7%) | 0 (0.0%) |
| 1 Vehicle | 43 (8.3%) | 47 (10.5%) |
| 2 Vehicles | 211 (40.9%) | 158 (35.2%) |
| 3 Vehicles | 90 (17.4%) | 107 (23.8%) |
| 4 Vehicles | 83 (16.1%) | 92 (20.5%) |
| 5 or more Vehicles | 49 (9.5%) | 45 (10.0%) |
| Total | 516 (100.0%) | 449 (100.0%) |
Commute Time in Farmington
The most frequently occuring commute durations in Farmington are 15 to 19 minutes (240 commuters, 25.1%), 20 to 24 minutes (175 commuters, 18.3%), and 10 to 14 minutes (165 commuters, 17.3%).
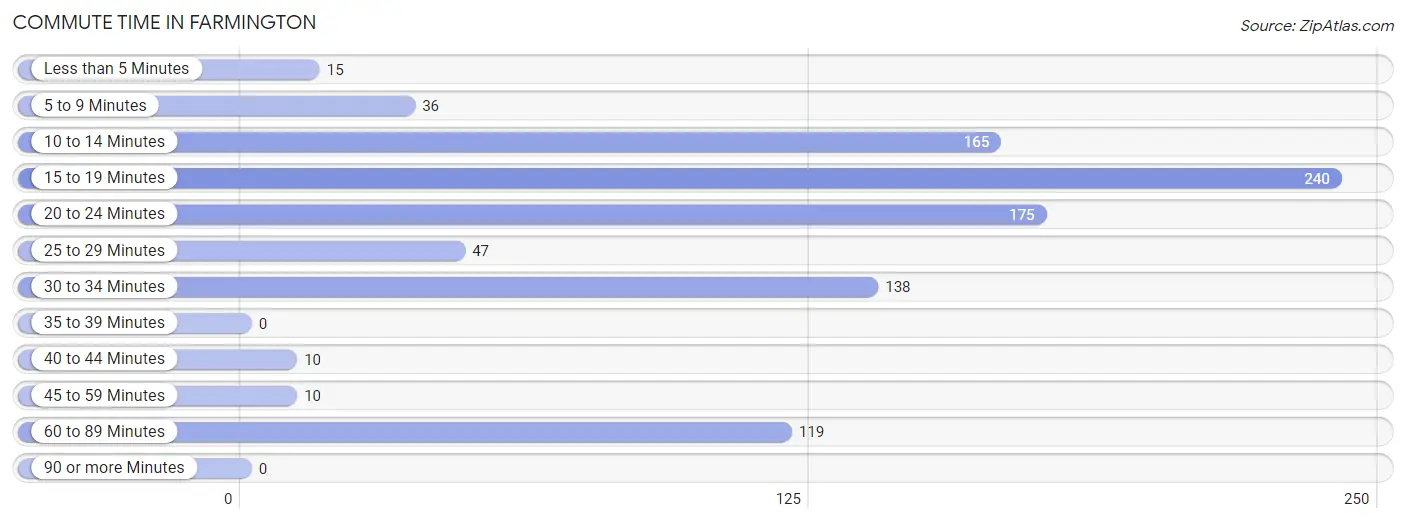
| Commute Time | # Commuters | % Commuters |
| Less than 5 Minutes | 15 | 1.6% |
| 5 to 9 Minutes | 36 | 3.8% |
| 10 to 14 Minutes | 165 | 17.3% |
| 15 to 19 Minutes | 240 | 25.1% |
| 20 to 24 Minutes | 175 | 18.3% |
| 25 to 29 Minutes | 47 | 4.9% |
| 30 to 34 Minutes | 138 | 14.4% |
| 35 to 39 Minutes | 0 | 0.0% |
| 40 to 44 Minutes | 10 | 1.1% |
| 45 to 59 Minutes | 10 | 1.1% |
| 60 to 89 Minutes | 119 | 12.5% |
| 90 or more Minutes | 0 | 0.0% |
Commute Time by Sex in Farmington
The most common commute times in Farmington are 10 to 14 minutes (124 commuters, 24.0%) for males and 15 to 19 minutes (118 commuters, 26.9%) for females.
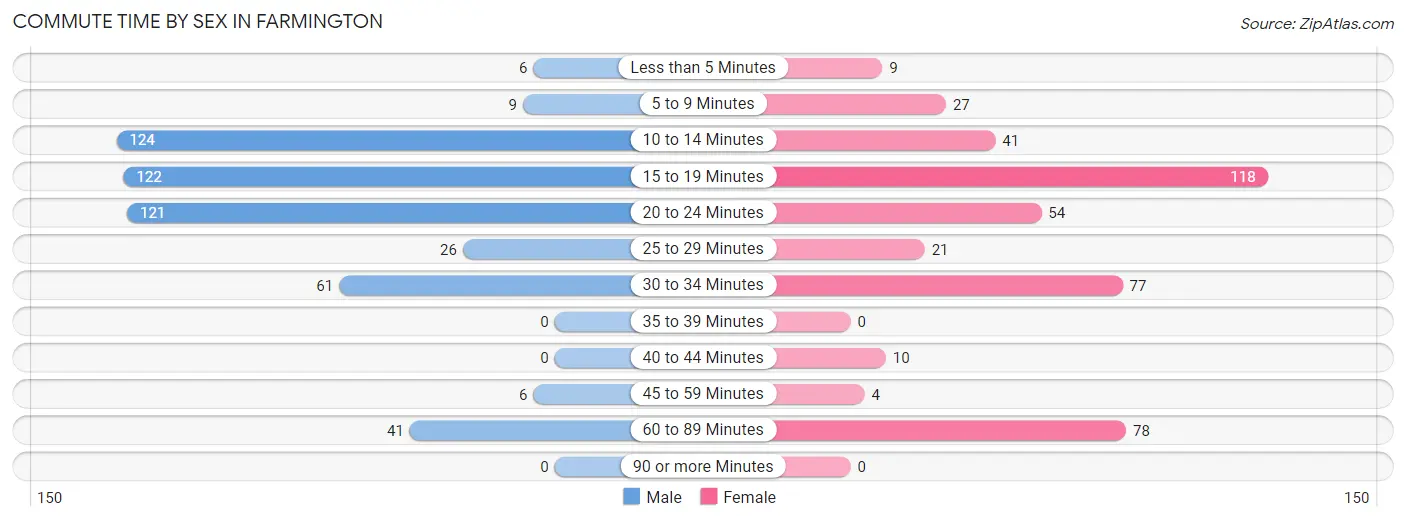
| Commute Time | Male | Female |
| Less than 5 Minutes | 6 (1.2%) | 9 (2.1%) |
| 5 to 9 Minutes | 9 (1.7%) | 27 (6.1%) |
| 10 to 14 Minutes | 124 (24.0%) | 41 (9.3%) |
| 15 to 19 Minutes | 122 (23.6%) | 118 (26.9%) |
| 20 to 24 Minutes | 121 (23.4%) | 54 (12.3%) |
| 25 to 29 Minutes | 26 (5.0%) | 21 (4.8%) |
| 30 to 34 Minutes | 61 (11.8%) | 77 (17.5%) |
| 35 to 39 Minutes | 0 (0.0%) | 0 (0.0%) |
| 40 to 44 Minutes | 0 (0.0%) | 10 (2.3%) |
| 45 to 59 Minutes | 6 (1.2%) | 4 (0.9%) |
| 60 to 89 Minutes | 41 (8.0%) | 78 (17.8%) |
| 90 or more Minutes | 0 (0.0%) | 0 (0.0%) |
Time of Departure to Work by Sex in Farmington
The most frequent times of departure to work in Farmington are 6:00 AM to 6:29 AM (129, 25.0%) for males and 7:00 AM to 7:29 AM (149, 33.9%) for females.
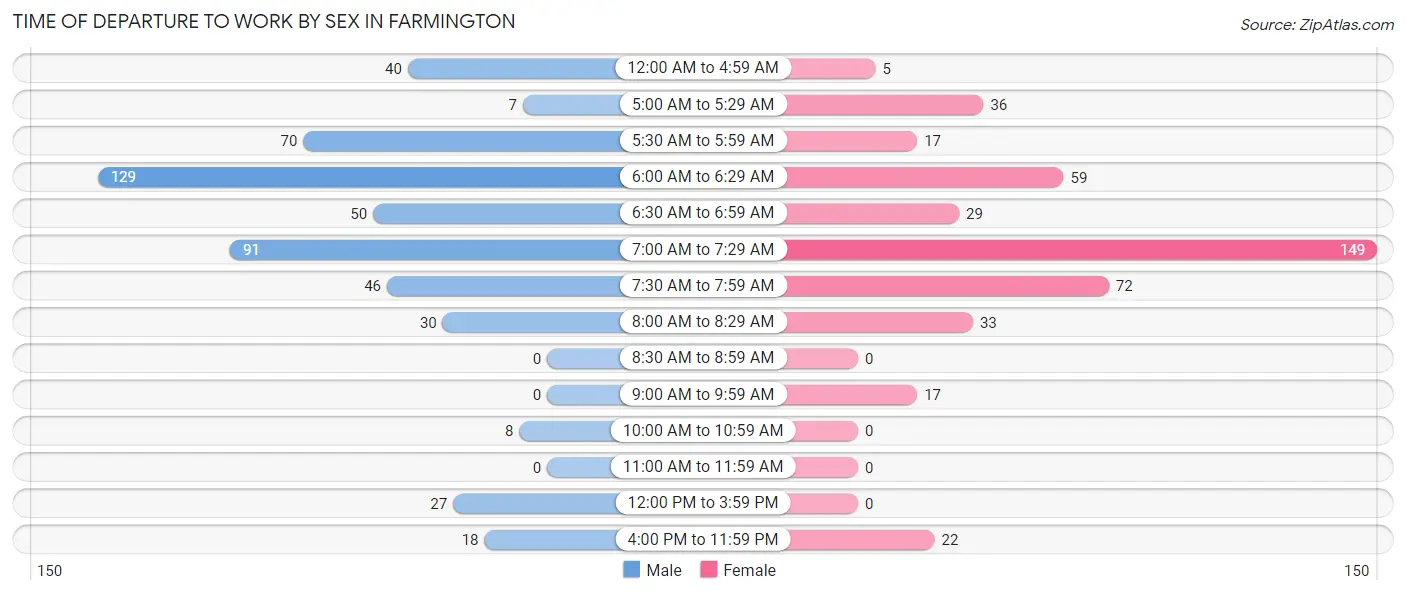
| Time of Departure | Male | Female |
| 12:00 AM to 4:59 AM | 40 (7.7%) | 5 (1.1%) |
| 5:00 AM to 5:29 AM | 7 (1.4%) | 36 (8.2%) |
| 5:30 AM to 5:59 AM | 70 (13.6%) | 17 (3.9%) |
| 6:00 AM to 6:29 AM | 129 (25.0%) | 59 (13.4%) |
| 6:30 AM to 6:59 AM | 50 (9.7%) | 29 (6.6%) |
| 7:00 AM to 7:29 AM | 91 (17.6%) | 149 (33.9%) |
| 7:30 AM to 7:59 AM | 46 (8.9%) | 72 (16.4%) |
| 8:00 AM to 8:29 AM | 30 (5.8%) | 33 (7.5%) |
| 8:30 AM to 8:59 AM | 0 (0.0%) | 0 (0.0%) |
| 9:00 AM to 9:59 AM | 0 (0.0%) | 17 (3.9%) |
| 10:00 AM to 10:59 AM | 8 (1.5%) | 0 (0.0%) |
| 11:00 AM to 11:59 AM | 0 (0.0%) | 0 (0.0%) |
| 12:00 PM to 3:59 PM | 27 (5.2%) | 0 (0.0%) |
| 4:00 PM to 11:59 PM | 18 (3.5%) | 22 (5.0%) |
| Total | 516 (100.0%) | 439 (100.0%) |
Housing Occupancy in Farmington
Occupancy by Ownership in Farmington
Of the total 822 dwellings in Farmington, owner-occupied units account for 619 (75.3%), while renter-occupied units make up 203 (24.7%).
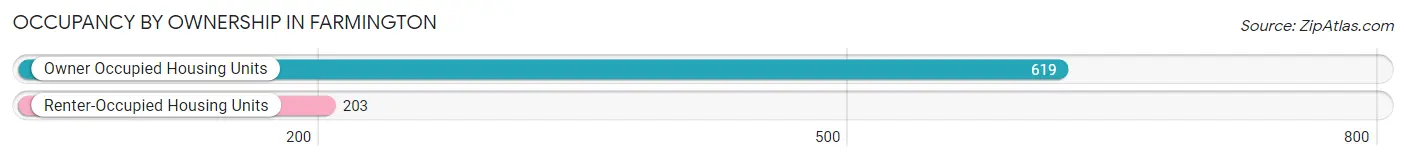
| Occupancy | # Housing Units | % Housing Units |
| Owner Occupied Housing Units | 619 | 75.3% |
| Renter-Occupied Housing Units | 203 | 24.7% |
| Total Occupied Housing Units | 822 | 100.0% |
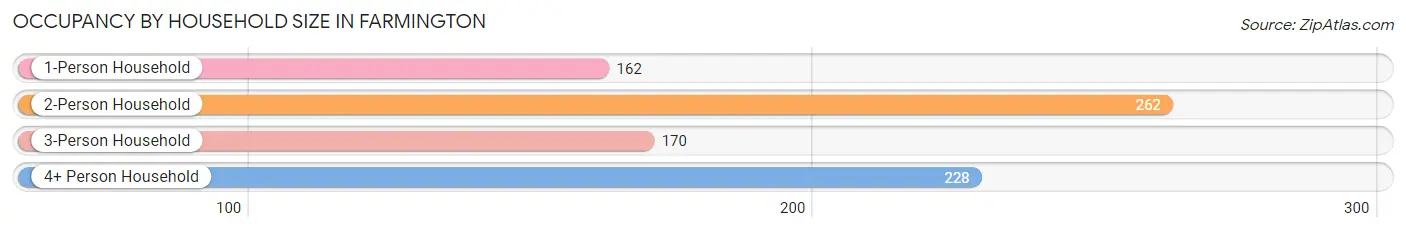
Occupancy by Household Size in Farmington
| Household Size | # Housing Units | % Housing Units |
| 1-Person Household | 162 | 19.7% |
| 2-Person Household | 262 | 31.9% |
| 3-Person Household | 170 | 20.7% |
| 4+ Person Household | 228 | 27.7% |
| Total Housing Units | 822 | 100.0% |
Occupancy by Ownership by Household Size in Farmington
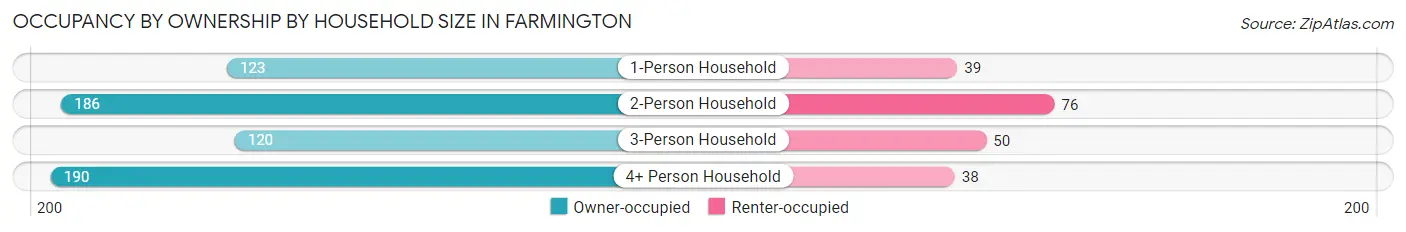
| Household Size | Owner-occupied | Renter-occupied |
| 1-Person Household | 123 (75.9%) | 39 (24.1%) |
| 2-Person Household | 186 (71.0%) | 76 (29.0%) |
| 3-Person Household | 120 (70.6%) | 50 (29.4%) |
| 4+ Person Household | 190 (83.3%) | 38 (16.7%) |
| Total Housing Units | 619 (75.3%) | 203 (24.7%) |
Occupancy by Educational Attainment in Farmington
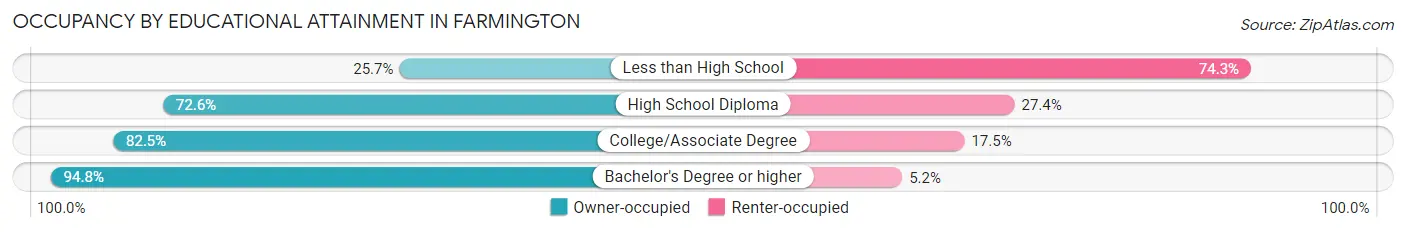
| Household Size | Owner-occupied | Renter-occupied |
| Less than High School | 18 (25.7%) | 52 (74.3%) |
| High School Diploma | 246 (72.6%) | 93 (27.4%) |
| College/Associate Degree | 245 (82.5%) | 52 (17.5%) |
| Bachelor's Degree or higher | 110 (94.8%) | 6 (5.2%) |
Occupancy by Age of Householder in Farmington
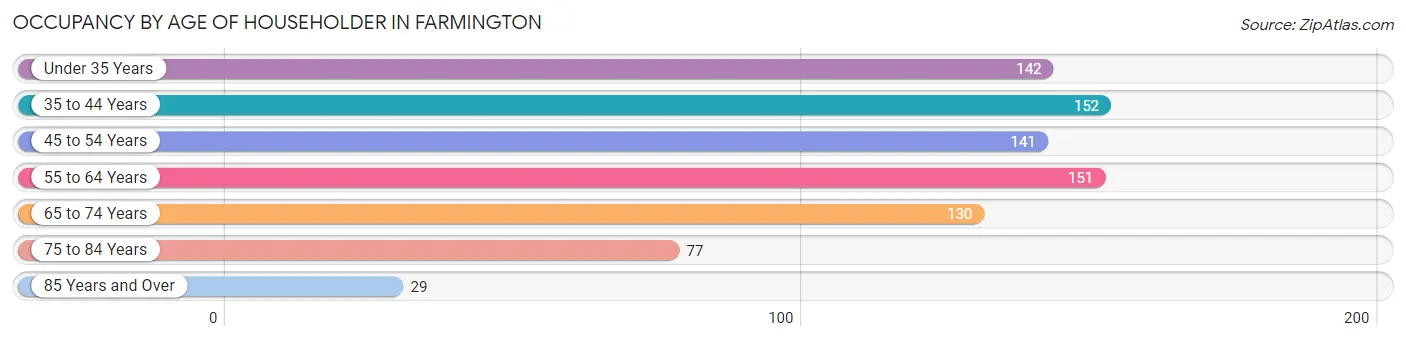
| Age Bracket | # Households | % Households |
| Under 35 Years | 142 | 17.3% |
| 35 to 44 Years | 152 | 18.5% |
| 45 to 54 Years | 141 | 17.2% |
| 55 to 64 Years | 151 | 18.4% |
| 65 to 74 Years | 130 | 15.8% |
| 75 to 84 Years | 77 | 9.4% |
| 85 Years and Over | 29 | 3.5% |
| Total | 822 | 100.0% |
Housing Finances in Farmington
Median Income by Occupancy in Farmington
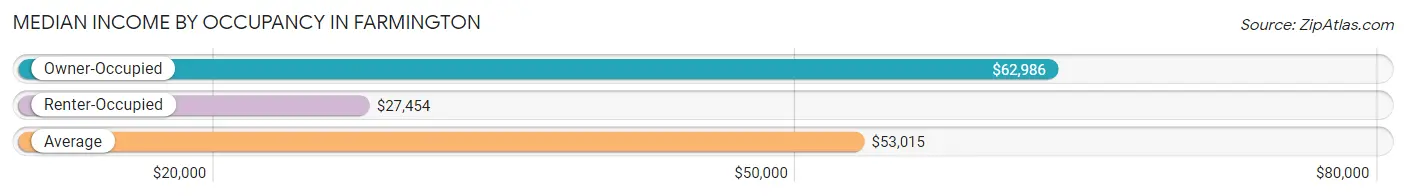
| Occupancy Type | # Households | Median Income |
| Owner-Occupied | 619 (75.3%) | $62,986 |
| Renter-Occupied | 203 (24.7%) | $27,454 |
| Average | 822 (100.0%) | $53,015 |
Occupancy by Householder Income Bracket in Farmington
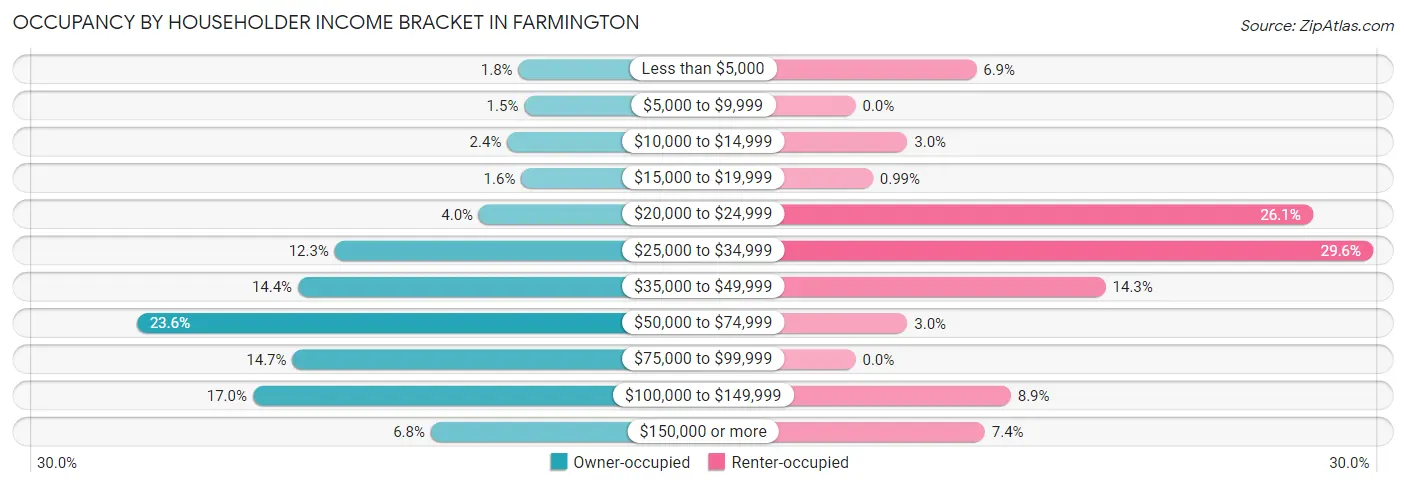
| Income Bracket | Owner-occupied | Renter-occupied |
| Less than $5,000 | 11 (1.8%) | 14 (6.9%) |
| $5,000 to $9,999 | 9 (1.5%) | 0 (0.0%) |
| $10,000 to $14,999 | 15 (2.4%) | 6 (3.0%) |
| $15,000 to $19,999 | 10 (1.6%) | 2 (1.0%) |
| $20,000 to $24,999 | 25 (4.0%) | 53 (26.1%) |
| $25,000 to $34,999 | 76 (12.3%) | 60 (29.6%) |
| $35,000 to $49,999 | 89 (14.4%) | 29 (14.3%) |
| $50,000 to $74,999 | 146 (23.6%) | 6 (3.0%) |
| $75,000 to $99,999 | 91 (14.7%) | 0 (0.0%) |
| $100,000 to $149,999 | 105 (17.0%) | 18 (8.9%) |
| $150,000 or more | 42 (6.8%) | 15 (7.4%) |
| Total | 619 (100.0%) | 203 (100.0%) |
Monthly Housing Cost Tiers in Farmington
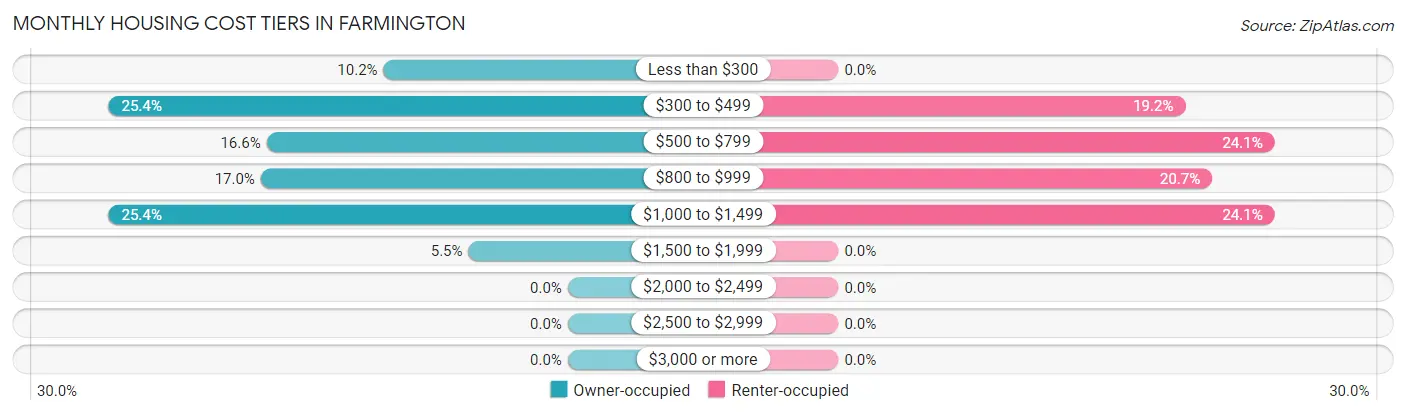
| Monthly Cost | Owner-occupied | Renter-occupied |
| Less than $300 | 63 (10.2%) | 0 (0.0%) |
| $300 to $499 | 157 (25.4%) | 39 (19.2%) |
| $500 to $799 | 103 (16.6%) | 49 (24.1%) |
| $800 to $999 | 105 (17.0%) | 42 (20.7%) |
| $1,000 to $1,499 | 157 (25.4%) | 49 (24.1%) |
| $1,500 to $1,999 | 34 (5.5%) | 0 (0.0%) |
| $2,000 to $2,499 | 0 (0.0%) | 0 (0.0%) |
| $2,500 to $2,999 | 0 (0.0%) | 0 (0.0%) |
| $3,000 or more | 0 (0.0%) | 0 (0.0%) |
| Total | 619 (100.0%) | 203 (100.0%) |
Physical Housing Characteristics in Farmington
Housing Structures in Farmington
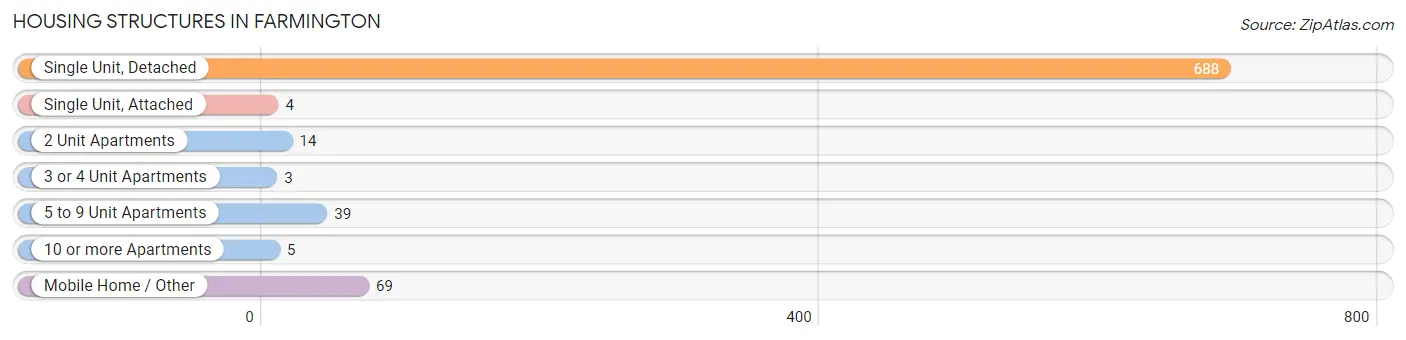
| Structure Type | # Housing Units | % Housing Units |
| Single Unit, Detached | 688 | 83.7% |
| Single Unit, Attached | 4 | 0.5% |
| 2 Unit Apartments | 14 | 1.7% |
| 3 or 4 Unit Apartments | 3 | 0.4% |
| 5 to 9 Unit Apartments | 39 | 4.7% |
| 10 or more Apartments | 5 | 0.6% |
| Mobile Home / Other | 69 | 8.4% |
| Total | 822 | 100.0% |
Housing Structures by Occupancy in Farmington
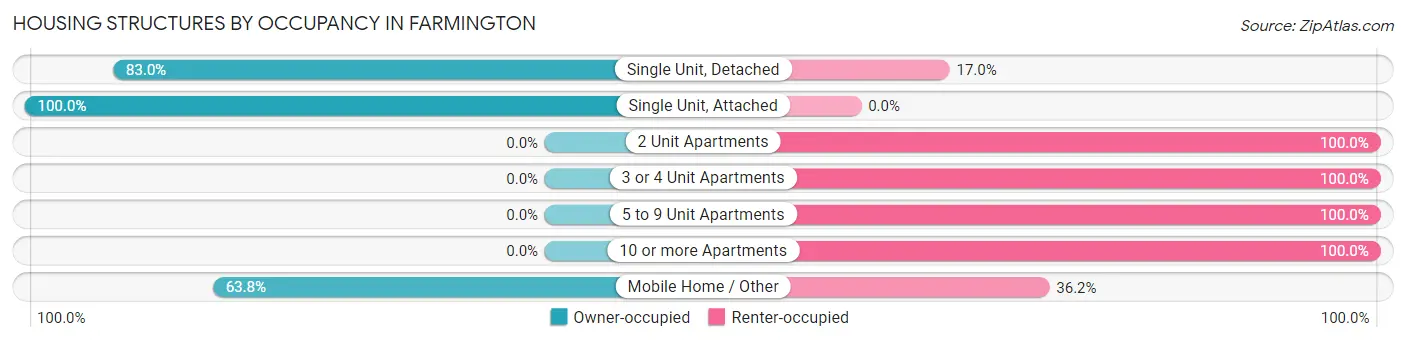
| Structure Type | Owner-occupied | Renter-occupied |
| Single Unit, Detached | 571 (83.0%) | 117 (17.0%) |
| Single Unit, Attached | 4 (100.0%) | 0 (0.0%) |
| 2 Unit Apartments | 0 (0.0%) | 14 (100.0%) |
| 3 or 4 Unit Apartments | 0 (0.0%) | 3 (100.0%) |
| 5 to 9 Unit Apartments | 0 (0.0%) | 39 (100.0%) |
| 10 or more Apartments | 0 (0.0%) | 5 (100.0%) |
| Mobile Home / Other | 44 (63.8%) | 25 (36.2%) |
| Total | 619 (75.3%) | 203 (24.7%) |
Housing Structures by Number of Rooms in Farmington
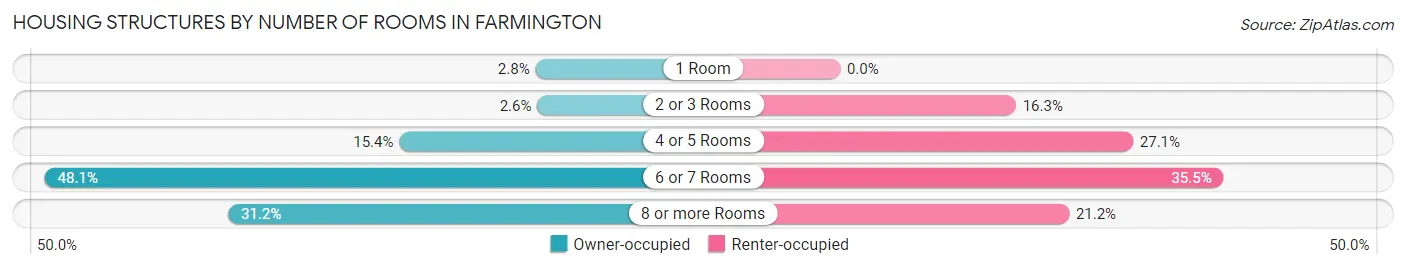
| Number of Rooms | Owner-occupied | Renter-occupied |
| 1 Room | 17 (2.8%) | 0 (0.0%) |
| 2 or 3 Rooms | 16 (2.6%) | 33 (16.3%) |
| 4 or 5 Rooms | 95 (15.3%) | 55 (27.1%) |
| 6 or 7 Rooms | 298 (48.1%) | 72 (35.5%) |
| 8 or more Rooms | 193 (31.2%) | 43 (21.2%) |
| Total | 619 (100.0%) | 203 (100.0%) |
Housing Structure by Heating Type in Farmington
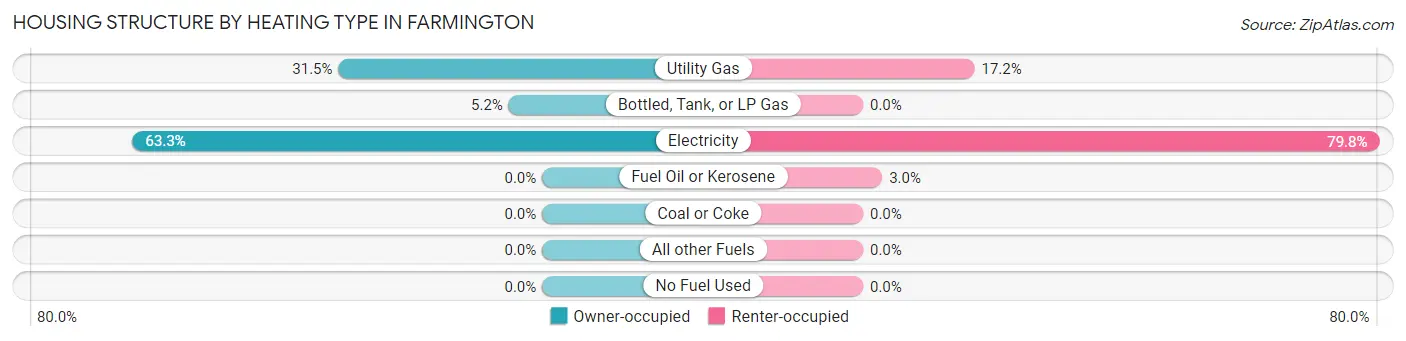
| Heating Type | Owner-occupied | Renter-occupied |
| Utility Gas | 195 (31.5%) | 35 (17.2%) |
| Bottled, Tank, or LP Gas | 32 (5.2%) | 0 (0.0%) |
| Electricity | 392 (63.3%) | 162 (79.8%) |
| Fuel Oil or Kerosene | 0 (0.0%) | 6 (3.0%) |
| Coal or Coke | 0 (0.0%) | 0 (0.0%) |
| All other Fuels | 0 (0.0%) | 0 (0.0%) |
| No Fuel Used | 0 (0.0%) | 0 (0.0%) |
| Total | 619 (100.0%) | 203 (100.0%) |
Household Vehicle Usage in Farmington
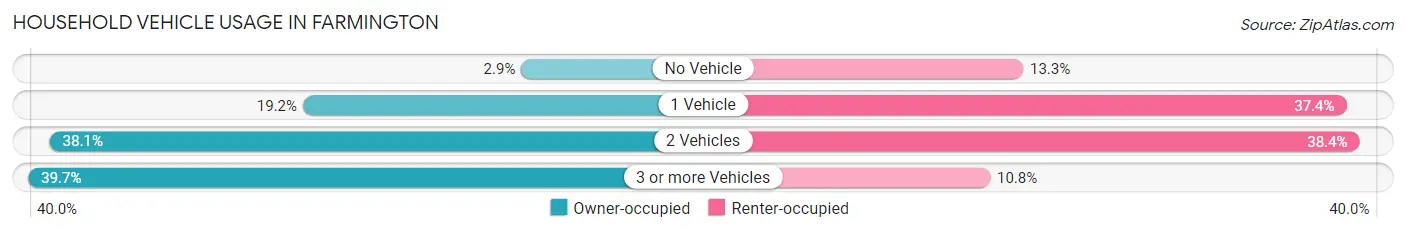
| Vehicles per Household | Owner-occupied | Renter-occupied |
| No Vehicle | 18 (2.9%) | 27 (13.3%) |
| 1 Vehicle | 119 (19.2%) | 76 (37.4%) |
| 2 Vehicles | 236 (38.1%) | 78 (38.4%) |
| 3 or more Vehicles | 246 (39.7%) | 22 (10.8%) |
| Total | 619 (100.0%) | 203 (100.0%) |
Real Estate & Mortgages in Farmington
Real Estate and Mortgage Overview in Farmington
| Characteristic | Without Mortgage | With Mortgage |
| Housing Units | 263 | 356 |
| Median Property Value | $98,400 | $136,800 |
| Median Household Income | $53,819 | $18 |
| Monthly Housing Costs | $382 | $0 |
| Real Estate Taxes | $803 | $65 |
Property Value by Mortgage Status in Farmington
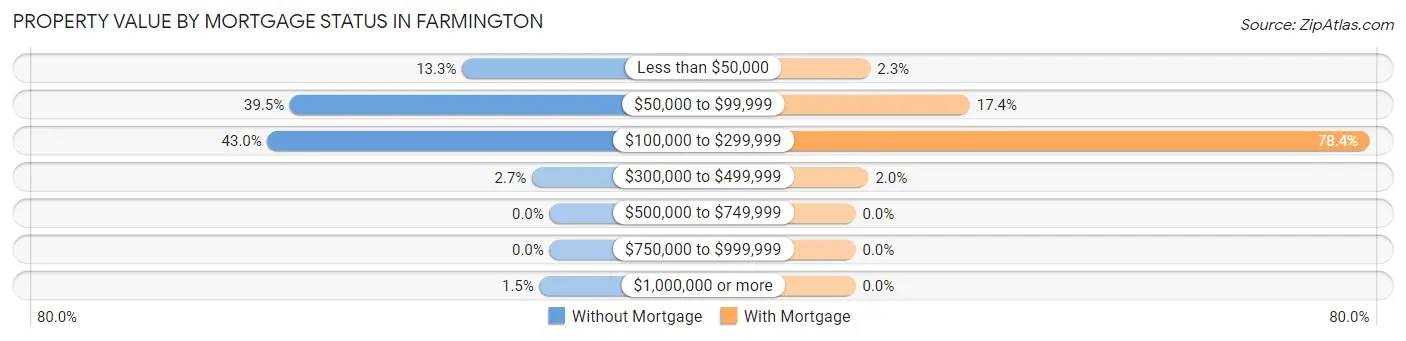
| Property Value | Without Mortgage | With Mortgage |
| Less than $50,000 | 35 (13.3%) | 8 (2.2%) |
| $50,000 to $99,999 | 104 (39.5%) | 62 (17.4%) |
| $100,000 to $299,999 | 113 (43.0%) | 279 (78.4%) |
| $300,000 to $499,999 | 7 (2.7%) | 7 (2.0%) |
| $500,000 to $749,999 | 0 (0.0%) | 0 (0.0%) |
| $750,000 to $999,999 | 0 (0.0%) | 0 (0.0%) |
| $1,000,000 or more | 4 (1.5%) | 0 (0.0%) |
| Total | 263 (100.0%) | 356 (100.0%) |
Household Income by Mortgage Status in Farmington
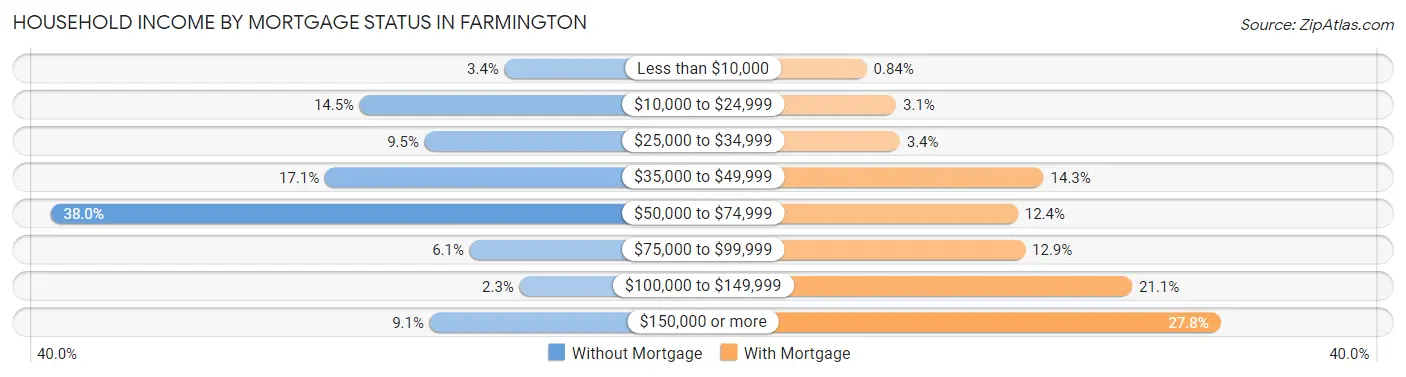
| Household Income | Without Mortgage | With Mortgage |
| Less than $10,000 | 9 (3.4%) | 3 (0.8%) |
| $10,000 to $24,999 | 38 (14.4%) | 11 (3.1%) |
| $25,000 to $34,999 | 25 (9.5%) | 12 (3.4%) |
| $35,000 to $49,999 | 45 (17.1%) | 51 (14.3%) |
| $50,000 to $74,999 | 100 (38.0%) | 44 (12.4%) |
| $75,000 to $99,999 | 16 (6.1%) | 46 (12.9%) |
| $100,000 to $149,999 | 6 (2.3%) | 75 (21.1%) |
| $150,000 or more | 24 (9.1%) | 99 (27.8%) |
| Total | 263 (100.0%) | 356 (100.0%) |
Property Value to Household Income Ratio in Farmington
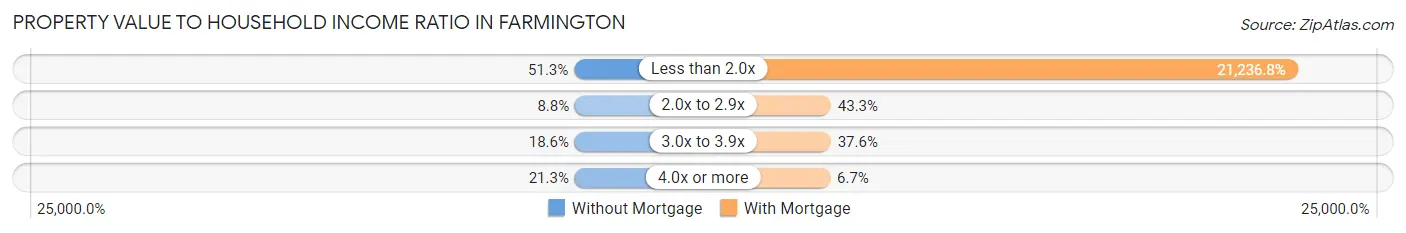
| Value-to-Income Ratio | Without Mortgage | With Mortgage |
| Less than 2.0x | 135 (51.3%) | 75,603 (21,236.8%) |
| 2.0x to 2.9x | 23 (8.7%) | 154 (43.3%) |
| 3.0x to 3.9x | 49 (18.6%) | 134 (37.6%) |
| 4.0x or more | 56 (21.3%) | 24 (6.7%) |
| Total | 263 (100.0%) | 356 (100.0%) |
Real Estate Taxes by Mortgage Status in Farmington
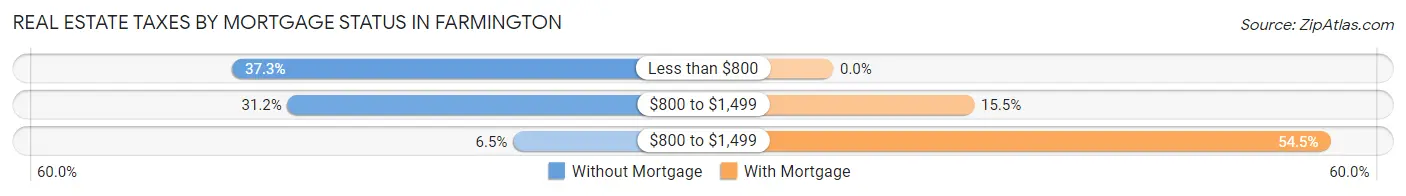
| Property Taxes | Without Mortgage | With Mortgage |
| Less than $800 | 98 (37.3%) | 0 (0.0%) |
| $800 to $1,499 | 82 (31.2%) | 55 (15.4%) |
| $800 to $1,499 | 17 (6.5%) | 194 (54.5%) |
| Total | 263 (100.0%) | 356 (100.0%) |
Health & Disability in Farmington
Health Insurance Coverage by Age in Farmington
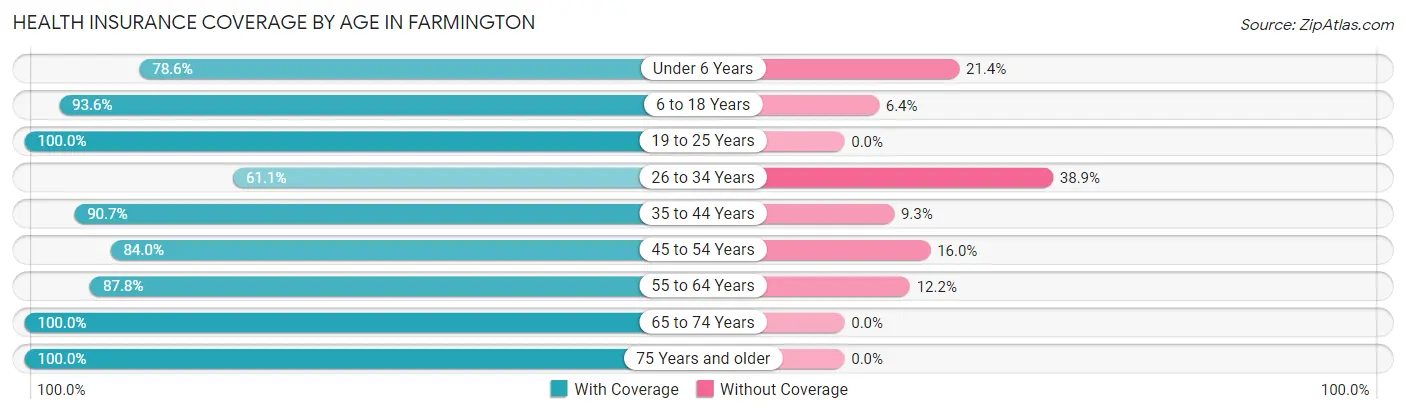
| Age Bracket | With Coverage | Without Coverage |
| Under 6 Years | 235 (78.6%) | 64 (21.4%) |
| 6 to 18 Years | 495 (93.6%) | 34 (6.4%) |
| 19 to 25 Years | 136 (100.0%) | 0 (0.0%) |
| 26 to 34 Years | 132 (61.1%) | 84 (38.9%) |
| 35 to 44 Years | 333 (90.7%) | 34 (9.3%) |
| 45 to 54 Years | 215 (84.0%) | 41 (16.0%) |
| 55 to 64 Years | 288 (87.8%) | 40 (12.2%) |
| 65 to 74 Years | 246 (100.0%) | 0 (0.0%) |
| 75 Years and older | 157 (100.0%) | 0 (0.0%) |
| Total | 2,237 (88.3%) | 297 (11.7%) |
Health Insurance Coverage by Citizenship Status in Farmington
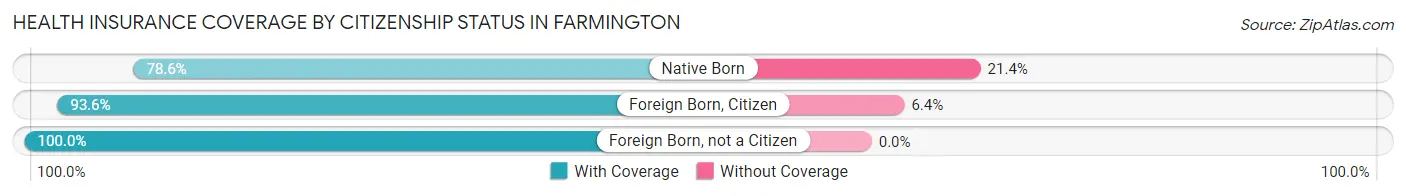
| Citizenship Status | With Coverage | Without Coverage |
| Native Born | 235 (78.6%) | 64 (21.4%) |
| Foreign Born, Citizen | 495 (93.6%) | 34 (6.4%) |
| Foreign Born, not a Citizen | 136 (100.0%) | 0 (0.0%) |
Health Insurance Coverage by Household Income in Farmington
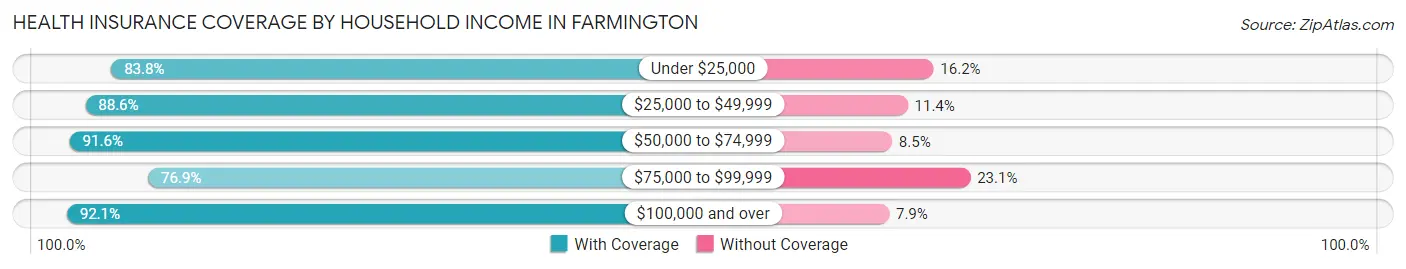
| Household Income | With Coverage | Without Coverage |
| Under $25,000 | 289 (83.8%) | 56 (16.2%) |
| $25,000 to $49,999 | 568 (88.6%) | 73 (11.4%) |
| $50,000 to $74,999 | 477 (91.5%) | 44 (8.5%) |
| $75,000 to $99,999 | 216 (76.9%) | 65 (23.1%) |
| $100,000 and over | 687 (92.1%) | 59 (7.9%) |
Public vs Private Health Insurance Coverage by Age in Farmington
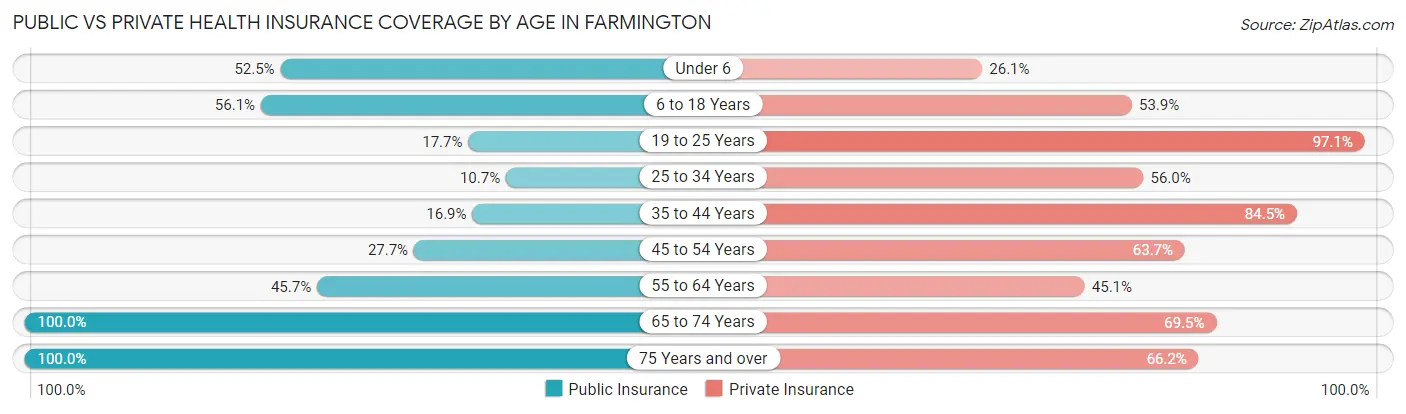
| Age Bracket | Public Insurance | Private Insurance |
| Under 6 | 157 (52.5%) | 78 (26.1%) |
| 6 to 18 Years | 297 (56.1%) | 285 (53.9%) |
| 19 to 25 Years | 24 (17.6%) | 132 (97.1%) |
| 25 to 34 Years | 23 (10.6%) | 121 (56.0%) |
| 35 to 44 Years | 62 (16.9%) | 310 (84.5%) |
| 45 to 54 Years | 71 (27.7%) | 163 (63.7%) |
| 55 to 64 Years | 150 (45.7%) | 148 (45.1%) |
| 65 to 74 Years | 246 (100.0%) | 171 (69.5%) |
| 75 Years and over | 157 (100.0%) | 104 (66.2%) |
| Total | 1,187 (46.8%) | 1,512 (59.7%) |
Disability Status by Sex by Age in Farmington
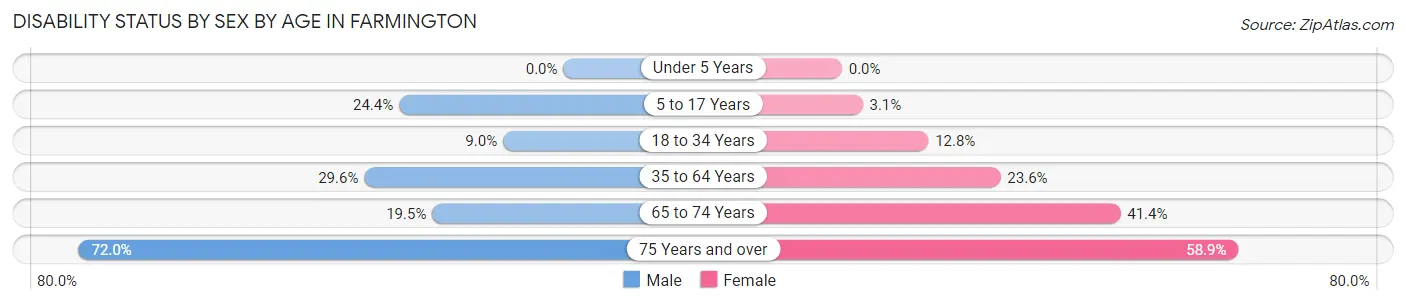
| Age Bracket | Male | Female |
| Under 5 Years | 0 (0.0%) | 0 (0.0%) |
| 5 to 17 Years | 51 (24.4%) | 10 (3.1%) |
| 18 to 34 Years | 19 (9.0%) | 24 (12.8%) |
| 35 to 64 Years | 123 (29.6%) | 126 (23.5%) |
| 65 to 74 Years | 22 (19.5%) | 55 (41.3%) |
| 75 Years and over | 36 (72.0%) | 63 (58.9%) |
Disability Class by Sex by Age in Farmington
Disability Class: Hearing Difficulty
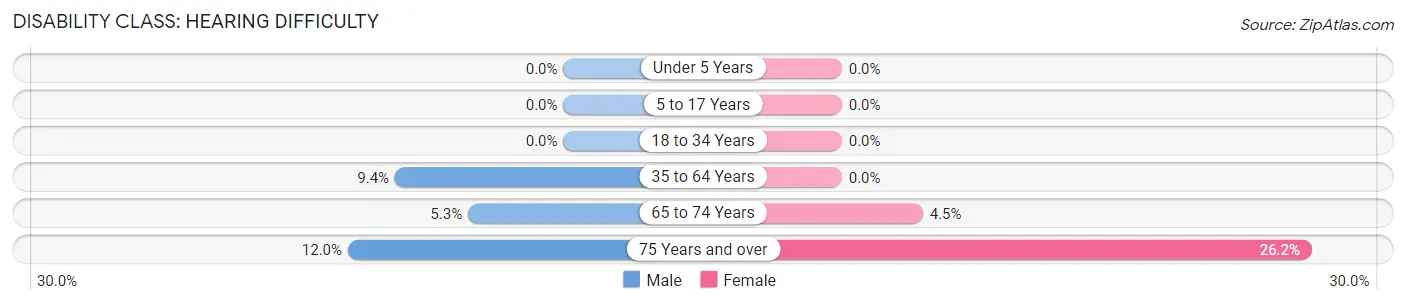
| Age Bracket | Male | Female |
| Under 5 Years | 0 (0.0%) | 0 (0.0%) |
| 5 to 17 Years | 0 (0.0%) | 0 (0.0%) |
| 18 to 34 Years | 0 (0.0%) | 0 (0.0%) |
| 35 to 64 Years | 39 (9.4%) | 0 (0.0%) |
| 65 to 74 Years | 6 (5.3%) | 6 (4.5%) |
| 75 Years and over | 6 (12.0%) | 28 (26.2%) |
Disability Class: Vision Difficulty
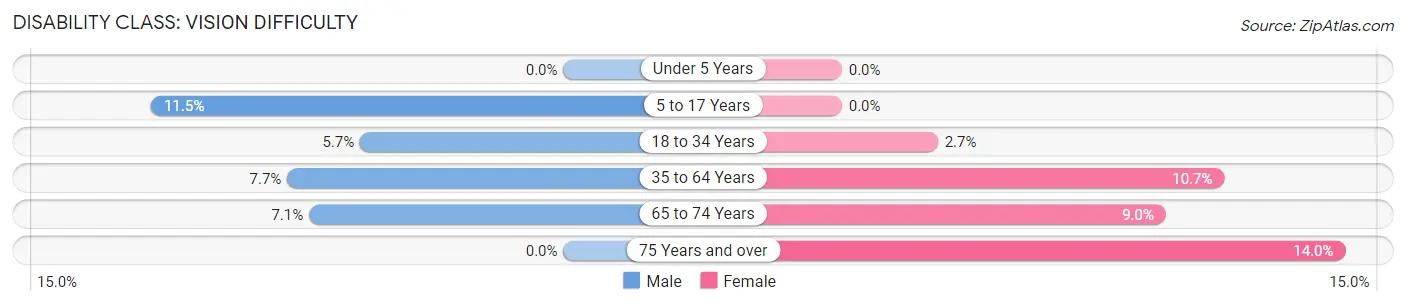
| Age Bracket | Male | Female |
| Under 5 Years | 0 (0.0%) | 0 (0.0%) |
| 5 to 17 Years | 24 (11.5%) | 0 (0.0%) |
| 18 to 34 Years | 12 (5.7%) | 5 (2.7%) |
| 35 to 64 Years | 32 (7.7%) | 57 (10.6%) |
| 65 to 74 Years | 8 (7.1%) | 12 (9.0%) |
| 75 Years and over | 0 (0.0%) | 15 (14.0%) |
Disability Class: Cognitive Difficulty
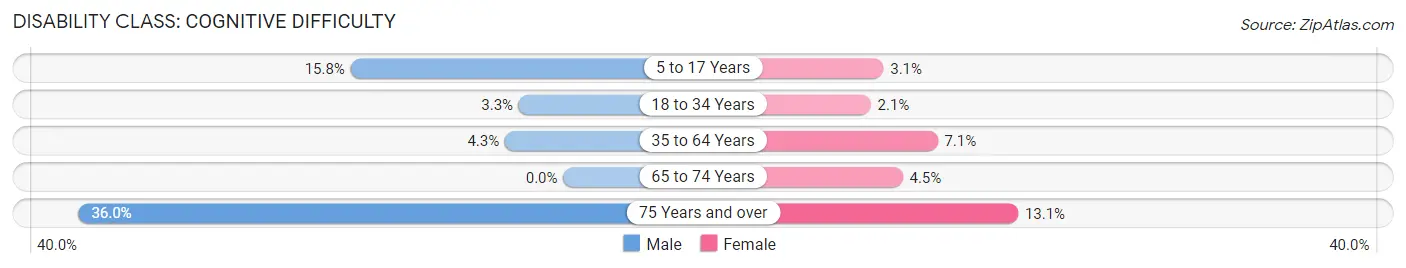
| Age Bracket | Male | Female |
| 5 to 17 Years | 33 (15.8%) | 10 (3.1%) |
| 18 to 34 Years | 7 (3.3%) | 4 (2.1%) |
| 35 to 64 Years | 18 (4.3%) | 38 (7.1%) |
| 65 to 74 Years | 0 (0.0%) | 6 (4.5%) |
| 75 Years and over | 18 (36.0%) | 14 (13.1%) |
Disability Class: Ambulatory Difficulty
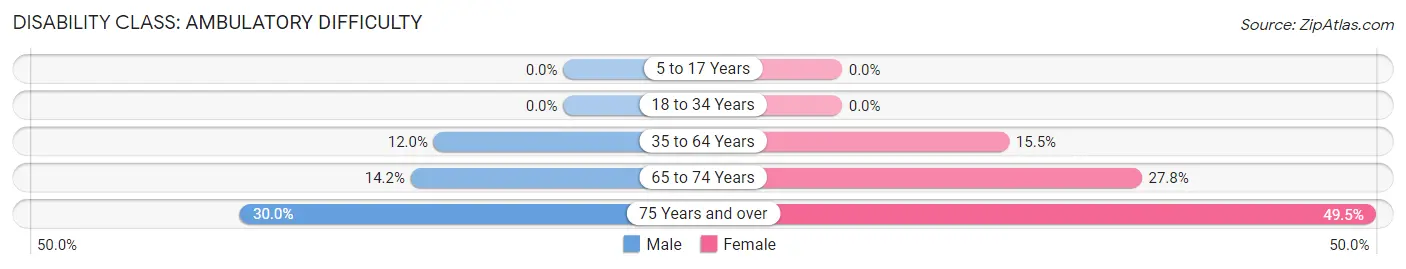
| Age Bracket | Male | Female |
| 5 to 17 Years | 0 (0.0%) | 0 (0.0%) |
| 18 to 34 Years | 0 (0.0%) | 0 (0.0%) |
| 35 to 64 Years | 50 (12.0%) | 83 (15.5%) |
| 65 to 74 Years | 16 (14.2%) | 37 (27.8%) |
| 75 Years and over | 15 (30.0%) | 53 (49.5%) |
Disability Class: Self-Care Difficulty
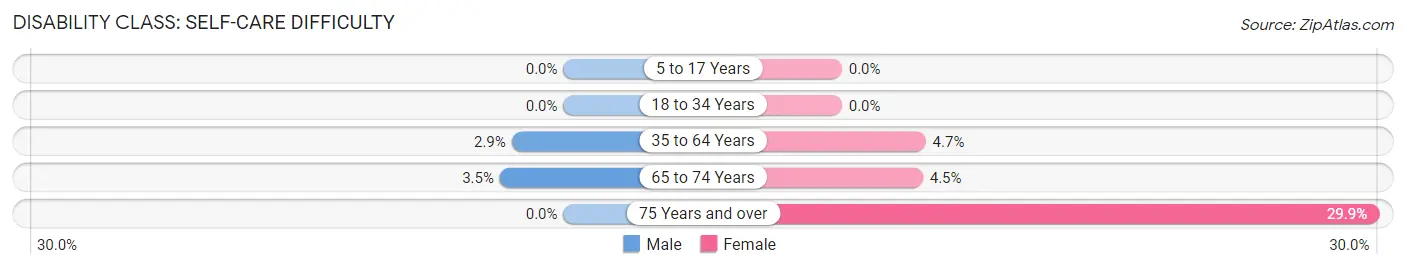
| Age Bracket | Male | Female |
| 5 to 17 Years | 0 (0.0%) | 0 (0.0%) |
| 18 to 34 Years | 0 (0.0%) | 0 (0.0%) |
| 35 to 64 Years | 12 (2.9%) | 25 (4.7%) |
| 65 to 74 Years | 4 (3.5%) | 6 (4.5%) |
| 75 Years and over | 0 (0.0%) | 32 (29.9%) |
Technology Access in Farmington
Computing Device Access in Farmington
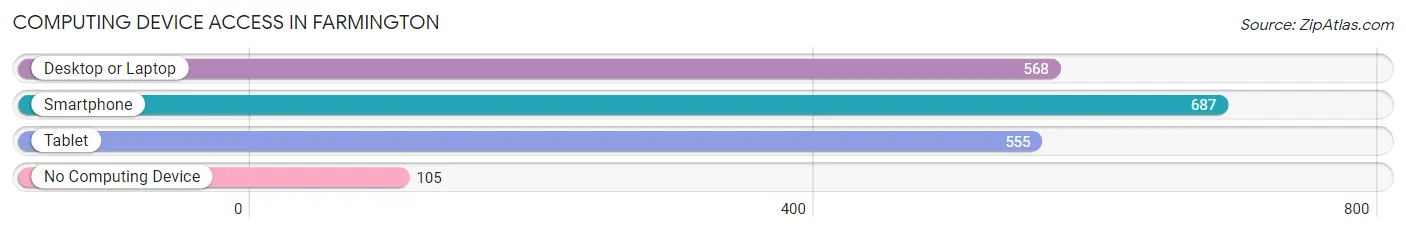
| Device Type | # Households | % Households |
| Desktop or Laptop | 568 | 69.1% |
| Smartphone | 687 | 83.6% |
| Tablet | 555 | 67.5% |
| No Computing Device | 105 | 12.8% |
| Total | 822 | 100.0% |
Internet Access in Farmington
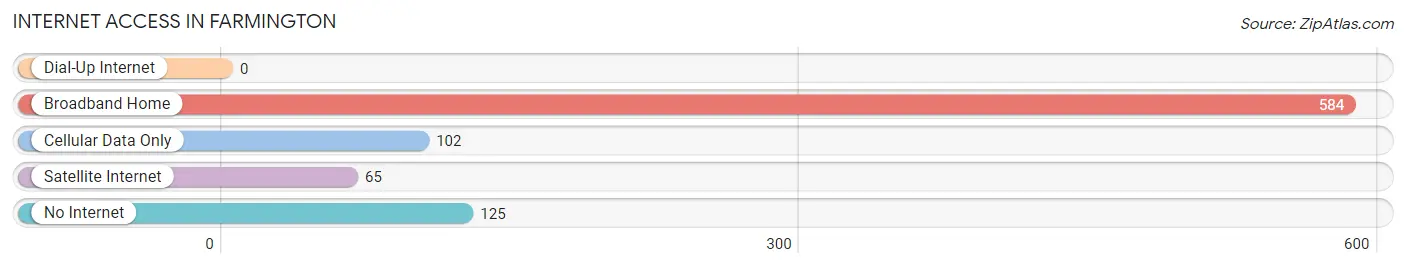
| Internet Type | # Households | % Households |
| Dial-Up Internet | 0 | 0.0% |
| Broadband Home | 584 | 71.1% |
| Cellular Data Only | 102 | 12.4% |
| Satellite Internet | 65 | 7.9% |
| No Internet | 125 | 15.2% |
| Total | 822 | 100.0% |
Farmington Summary
History
The city of Farmington, Mississippi is located in the northwest corner of the state, in DeSoto County. It is a small city with a population of just over 8,000 people, according to the 2010 census. The city was founded in 1837 and was originally known as “Farmington Station” due to its location on the Memphis and Charleston Railroad. The city was officially incorporated in 1856 and was named after the nearby town of Farmington, Tennessee.
The city of Farmington has a rich history that is closely tied to the Civil War. During the war, the city was the site of several battles, including the Battle of Farmington Station in 1862. The city was also the site of a Confederate hospital, which was used to treat wounded soldiers. After the war, the city experienced a period of growth and development, with the construction of several new businesses and homes.
Geography
Farmington is located in the northwest corner of Mississippi, in DeSoto County. It is situated on the banks of the Wolf River, which flows through the city. The city is located approximately 20 miles south of Memphis, Tennessee and is part of the Memphis metropolitan area. The city is located in a region of rolling hills and is surrounded by farmland.
The climate in Farmington is humid subtropical, with hot, humid summers and mild winters. The average annual temperature is around 64 degrees Fahrenheit, with an average high of around 90 degrees in the summer and an average low of around 40 degrees in the winter. The city receives an average of around 50 inches of precipitation per year.
Economy
The economy of Farmington is largely based on agriculture and manufacturing. The city is home to several large agricultural operations, including cotton, soybeans, and corn. The city is also home to several manufacturing companies, including a furniture factory, a plastics factory, and a paper mill.
The city is also home to several retail stores, restaurants, and other businesses. The city is served by the DeSoto County School District, which includes several elementary, middle, and high schools. The city is also home to a branch of Northwest Mississippi Community College.
Demographics
According to the 2010 census, the population of Farmington was 8,072. The population is predominantly white, with African Americans making up around 20% of the population. The median household income in the city is around $45,000, and the median home value is around $150,000. The city has a poverty rate of around 15%, which is slightly higher than the national average.
The city is served by the DeSoto County School District, which includes several elementary, middle, and high schools. The city is also home to a branch of Northwest Mississippi Community College. The city is served by several churches, including Baptist, Methodist, and Catholic. The city is also home to several parks and recreational facilities, including a golf course, a swimming pool, and several parks.
Common Questions
What is the Total Population of Farmington?
Total Population of Farmington is 2,534.
What is the Total Male Population of Farmington?
Total Male Population of Farmington is 1,127.
What is the Total Female Population of Farmington?
Total Female Population of Farmington is 1,407.
What is the Ratio of Males per 100 Females in Farmington?
There are 80.10 Males per 100 Females in Farmington.
What is the Ratio of Females per 100 Males in Farmington?
There are 124.84 Females per 100 Males in Farmington.
What is the Median Population Age in Farmington?
Median Population Age in Farmington is 37.3 Years.
What is the Average Family Size in Farmington
Average Family Size in Farmington is 3.6 People.
What is the Average Household Size in Farmington
Average Household Size in Farmington is 3.1 People.
What is Per Capita Income in Farmington?
Per Capita income in Farmington is $22,541.
What is the Median Family Income in Farmington?
Median Family Income in Farmington is $65,250.
What is the Median Household income in Farmington?
Median Household Income in Farmington is $53,015.
What is Income or Wage Gap in Farmington?
Income or Wage Gap in Farmington is 12.4%.
Women in Farmington earn 87.6 cents for every dollar earned by a man.
What is Family Income Deficit in Farmington?
Family Income Deficit in Farmington is $8,246.
Families that are below poverty line in Farmington earn $8,246 less on average than the poverty threshold level.
What is Inequality or Gini Index in Farmington?
Inequality or Gini Index in Farmington is 0.40.
How Large is the Labor Force in Farmington?
There are 1,020 People in the Labor Forcein in Farmington.
What is the Percentage of People in the Labor Force in Farmington?
55.6% of People are in the Labor Force in Farmington.
What is the Unemployment Rate in Farmington?
Unemployment Rate in Farmington is 4.9%.