Durant, MS
Durant Map
Durant Overview
2,133
TOTAL POPULATION
1,042
MALE POPULATION
1,091
FEMALE POPULATION
95.51
MALES / 100 FEMALES
104.70
FEMALES / 100 MALES
42.2
MEDIAN AGE
3.6
AVG FAMILY SIZE
2.5
AVG HOUSEHOLD SIZE
$18,139
PER CAPITA INCOME
$29,115
AVG FAMILY INCOME
$25,552
AVG HOUSEHOLD INCOME
15.0%
WAGE / INCOME GAP [ % ]
85.0¢/ $1
WAGE / INCOME GAP [ $ ]
0.55
INEQUALITY / GINI INDEX
627
LABOR FORCE [ PEOPLE ]
41.3%
PERCENT IN LABOR FORCE
10.0%
UNEMPLOYMENT RATE
Durant Zip Codes
Durant Area Codes
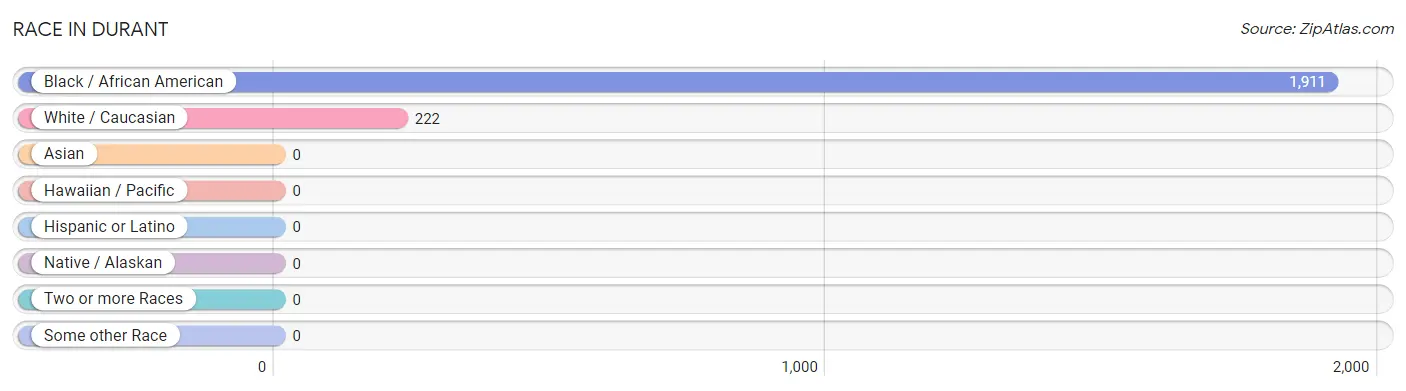
Race in Durant
The most populous races in Durant are Black / African American (1,911 | 89.6%), and White / Caucasian (222 | 10.4%).
| Race | # Population | % Population |
| Asian | 0 | 0.0% |
| Black / African American | 1,911 | 89.6% |
| Hawaiian / Pacific | 0 | 0.0% |
| Hispanic or Latino | 0 | 0.0% |
| Native / Alaskan | 0 | 0.0% |
| White / Caucasian | 222 | 10.4% |
| Two or more Races | 0 | 0.0% |
| Some other Race | 0 | 0.0% |
| Total | 2,133 | 100.0% |
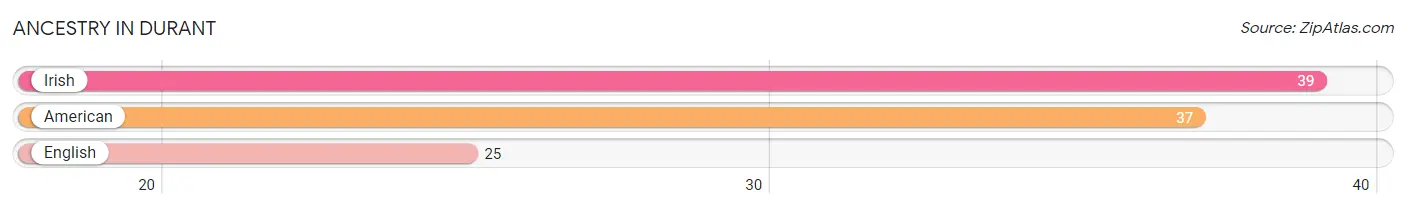
Ancestry in Durant
The most populous ancestries reported in Durant are Irish (39 | 1.8%), American (37 | 1.7%), and English (25 | 1.2%), together accounting for 4.7% of all Durant residents.
| Ancestry | # Population | % Population |
| American | 37 | 1.7% |
| English | 25 | 1.2% |
| Irish | 39 | 1.8% | View All 3 Rows |
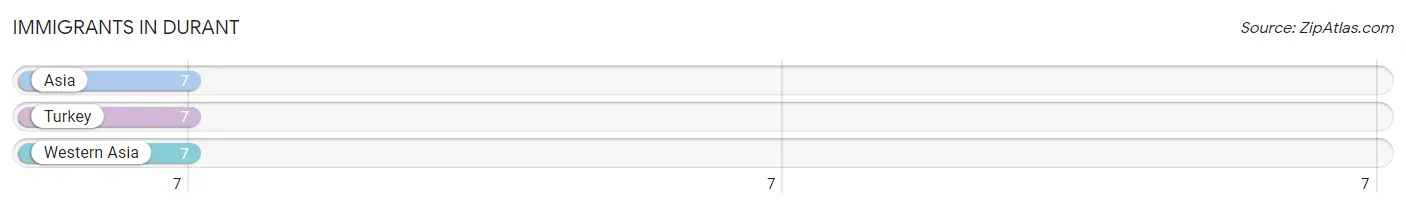
Immigrants in Durant
The most numerous immigrant groups reported in Durant came from Asia (7 | 0.3%), Turkey (7 | 0.3%), and Western Asia (7 | 0.3%), together accounting for 1.0% of all Durant residents.
| Immigration Origin | # Population | % Population |
| Asia | 7 | 0.3% |
| Turkey | 7 | 0.3% |
| Western Asia | 7 | 0.3% | View All 3 Rows |
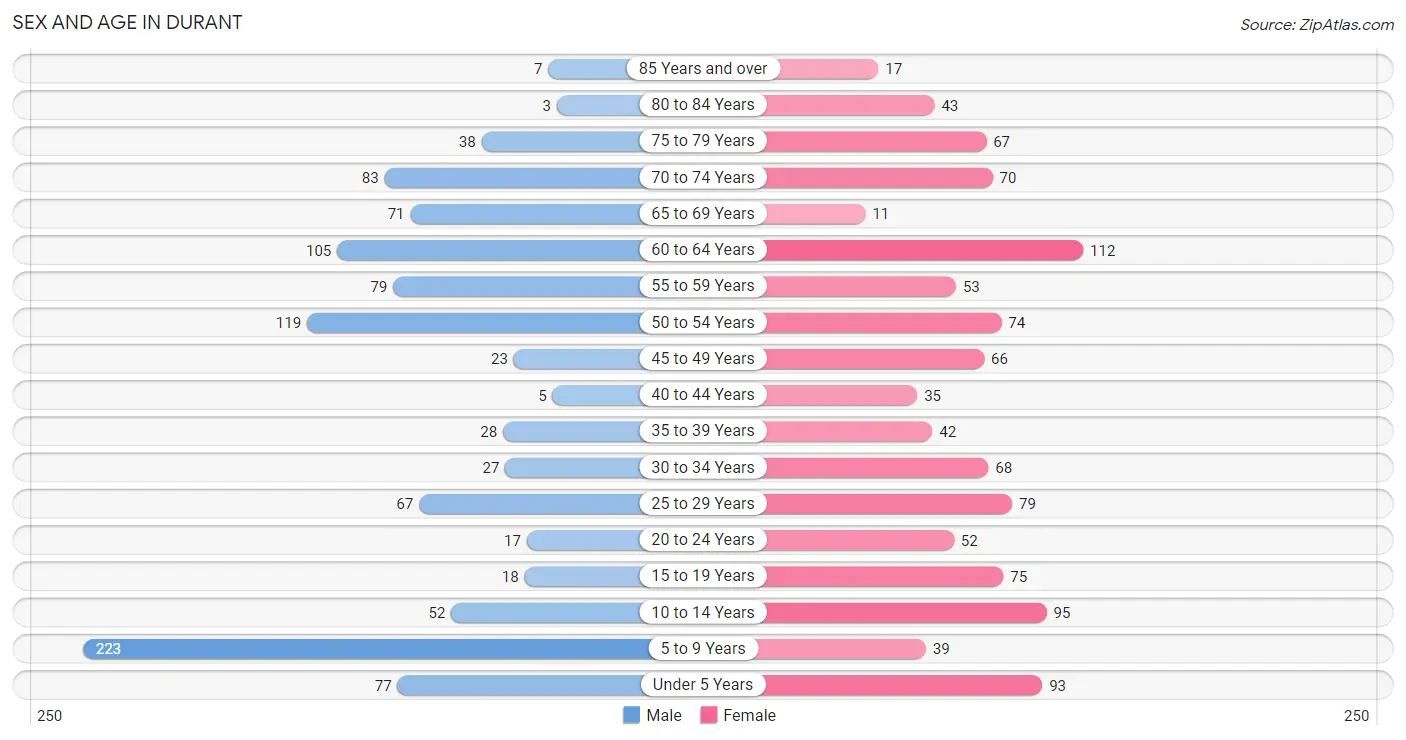
Sex and Age in Durant
Sex and Age in Durant
The most populous age groups in Durant are 5 to 9 Years (223 | 21.4%) for men and 60 to 64 Years (112 | 10.3%) for women.
| Age Bracket | Male | Female |
| Under 5 Years | 77 (7.4%) | 93 (8.5%) |
| 5 to 9 Years | 223 (21.4%) | 39 (3.6%) |
| 10 to 14 Years | 52 (5.0%) | 95 (8.7%) |
| 15 to 19 Years | 18 (1.7%) | 75 (6.9%) |
| 20 to 24 Years | 17 (1.6%) | 52 (4.8%) |
| 25 to 29 Years | 67 (6.4%) | 79 (7.2%) |
| 30 to 34 Years | 27 (2.6%) | 68 (6.2%) |
| 35 to 39 Years | 28 (2.7%) | 42 (3.8%) |
| 40 to 44 Years | 5 (0.5%) | 35 (3.2%) |
| 45 to 49 Years | 23 (2.2%) | 66 (6.0%) |
| 50 to 54 Years | 119 (11.4%) | 74 (6.8%) |
| 55 to 59 Years | 79 (7.6%) | 53 (4.9%) |
| 60 to 64 Years | 105 (10.1%) | 112 (10.3%) |
| 65 to 69 Years | 71 (6.8%) | 11 (1.0%) |
| 70 to 74 Years | 83 (8.0%) | 70 (6.4%) |
| 75 to 79 Years | 38 (3.6%) | 67 (6.1%) |
| 80 to 84 Years | 3 (0.3%) | 43 (3.9%) |
| 85 Years and over | 7 (0.7%) | 17 (1.6%) |
| Total | 1,042 (100.0%) | 1,091 (100.0%) |
Families and Households in Durant
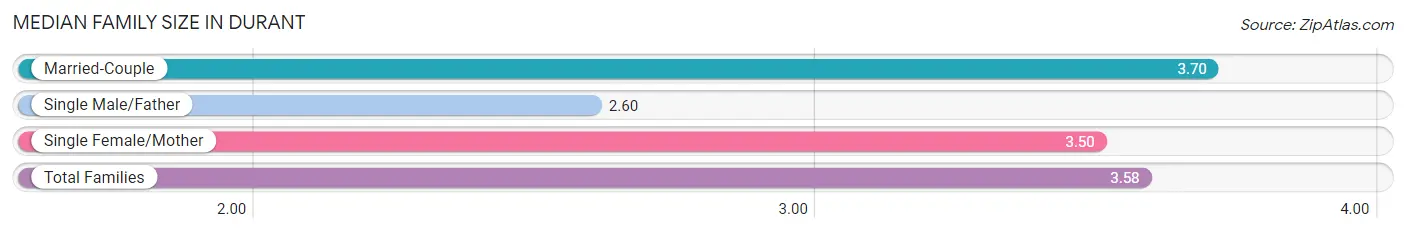
Median Family Size in Durant
The median family size in Durant is 3.58 persons per family, with married-couple families (229 | 48.9%) accounting for the largest median family size of 3.7 persons per family. On the other hand, single male/father families (10 | 2.1%) represent the smallest median family size with 2.60 persons per family.
| Family Type | # Families | Family Size |
| Married-Couple | 229 (48.9%) | 3.70 |
| Single Male/Father | 10 (2.1%) | 2.60 |
| Single Female/Mother | 229 (48.9%) | 3.50 |
| Total Families | 468 (100.0%) | 3.58 |
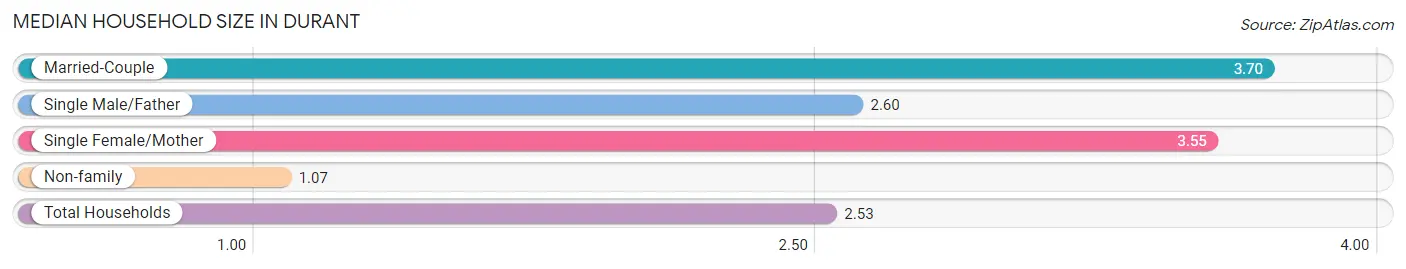
Median Household Size in Durant
The median household size in Durant is 2.53 persons per household, with married-couple households (229 | 28.2%) accounting for the largest median household size of 3.7 persons per household. non-family households (345 | 42.4%) represent the smallest median household size with 1.07 persons per household.
| Household Type | # Households | Household Size |
| Married-Couple | 229 (28.2%) | 3.70 |
| Single Male/Father | 10 (1.2%) | 2.60 |
| Single Female/Mother | 229 (28.2%) | 3.55 |
| Non-family | 345 (42.4%) | 1.07 |
| Total Households | 813 (100.0%) | 2.53 |
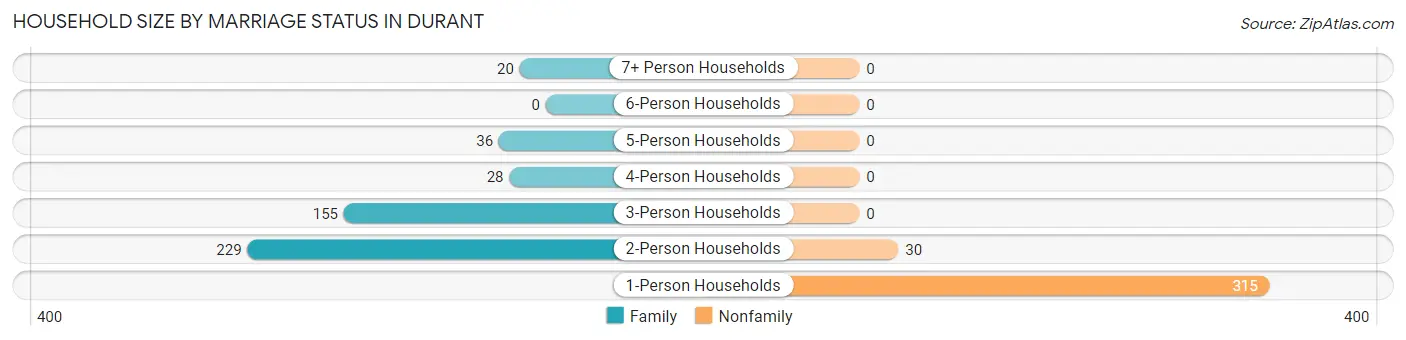
Household Size by Marriage Status in Durant
Out of a total of 813 households in Durant, 468 (57.6%) are family households, while 345 (42.4%) are nonfamily households. The most numerous type of family households are 2-person households, comprising 229, and the most common type of nonfamily households are 1-person households, comprising 315.
| Household Size | Family Households | Nonfamily Households |
| 1-Person Households | - | 315 (38.8%) |
| 2-Person Households | 229 (28.2%) | 30 (3.7%) |
| 3-Person Households | 155 (19.1%) | 0 (0.0%) |
| 4-Person Households | 28 (3.4%) | 0 (0.0%) |
| 5-Person Households | 36 (4.4%) | 0 (0.0%) |
| 6-Person Households | 0 (0.0%) | 0 (0.0%) |
| 7+ Person Households | 20 (2.5%) | 0 (0.0%) |
| Total | 468 (57.6%) | 345 (42.4%) |
Female Fertility in Durant
Fertility by Age in Durant
| Age Bracket | Women with Births | Births / 1,000 Women |
| 15 to 19 years | 0 (0.0%) | 0.0 |
| 20 to 34 years | 0 (0.0%) | 0.0 |
| 35 to 50 years | 0 (0.0%) | 0.0 |
| Total | 0 (0.0%) | 0.0 |
Fertility by Age by Marriage Status in Durant
| Age Bracket | Married | Unmarried |
| 15 to 19 years | 0 (0.0%) | 0 (0.0%) |
| 20 to 34 years | 0 (0.0%) | 0 (0.0%) |
| 35 to 50 years | 0 (0.0%) | 0 (0.0%) |
| Total | 0 (0.0%) | 0 (0.0%) |
Fertility by Education in Durant
| Educational Attainment | Women with Births | Births / 1,000 Women |
| Less than High School | 0 (0.0%) | 0.0 |
| High School Diploma | 0 (0.0%) | 0.0 |
| College or Associate's Degree | 0 (0.0%) | 0.0 |
| Bachelor's Degree | 0 (0.0%) | 0.0 |
| Graduate Degree | 0 (0.0%) | 0.0 |
| Total | 0 (0.0%) | 0.0 |
Fertility by Education by Marriage Status in Durant
| Educational Attainment | Married | Unmarried |
| Less than High School | 0 (0.0%) | 0 (0.0%) |
| High School Diploma | 0 (0.0%) | 0 (0.0%) |
| College or Associate's Degree | 0 (0.0%) | 0 (0.0%) |
| Bachelor's Degree | 0 (0.0%) | 0 (0.0%) |
| Graduate Degree | 0 (0.0%) | 0 (0.0%) |
| Total | 0 (0.0%) | 0 (0.0%) |
Income in Durant
Income Overview in Durant
Per Capita Income in Durant is $18,139, while median incomes of families and households are $29,115 and $25,552 respectively.
| Characteristic | Number | Measure |
| Per Capita Income | 2,133 | $18,139 |
| Median Family Income | 468 | $29,115 |
| Mean Family Income | 468 | $44,852 |
| Median Household Income | 813 | $25,552 |
| Mean Household Income | 813 | $38,484 |
| Income Deficit | 468 | $0 |
| Wage / Income Gap (%) | 2,133 | 15.05% |
| Wage / Income Gap ($) | 2,133 | 84.95¢ per $1 |
| Gini / Inequality Index | 2,133 | 0.55 |
Earnings by Sex in Durant
Average Earnings in Durant are $23,828, $21,528 for men and $25,341 for women, a difference of 15.0%.
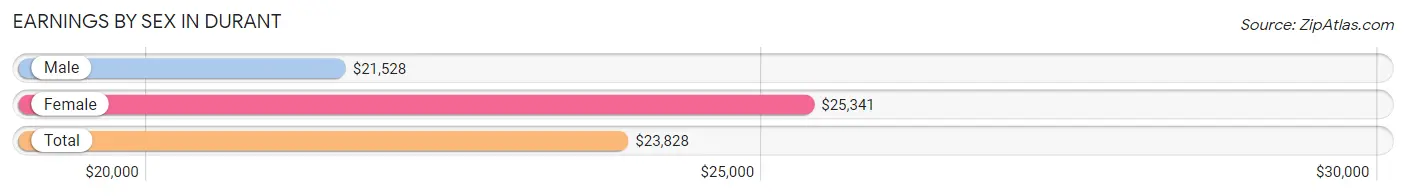
| Sex | Number | Average Earnings |
| Male | 225 (37.7%) | $21,528 |
| Female | 372 (62.3%) | $25,341 |
| Total | 597 (100.0%) | $23,828 |
Earnings by Sex by Income Bracket in Durant
The most common earnings brackets in Durant are $10,000 to $12,499 for men (44 | 19.6%) and $15,000 to $17,499 for women (116 | 31.2%).
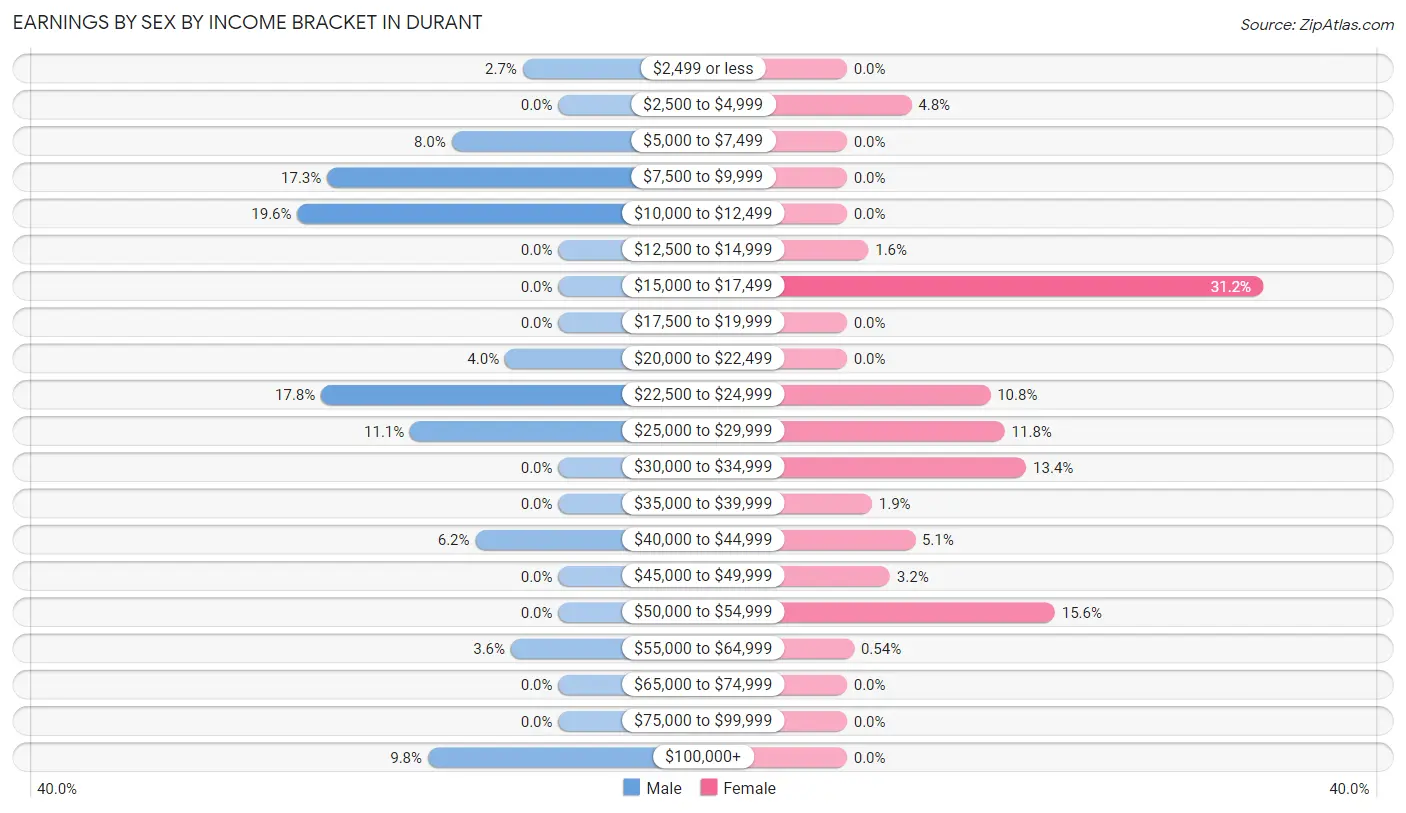
| Income | Male | Female |
| $2,499 or less | 6 (2.7%) | 0 (0.0%) |
| $2,500 to $4,999 | 0 (0.0%) | 18 (4.8%) |
| $5,000 to $7,499 | 18 (8.0%) | 0 (0.0%) |
| $7,500 to $9,999 | 39 (17.3%) | 0 (0.0%) |
| $10,000 to $12,499 | 44 (19.6%) | 0 (0.0%) |
| $12,500 to $14,999 | 0 (0.0%) | 6 (1.6%) |
| $15,000 to $17,499 | 0 (0.0%) | 116 (31.2%) |
| $17,500 to $19,999 | 0 (0.0%) | 0 (0.0%) |
| $20,000 to $22,499 | 9 (4.0%) | 0 (0.0%) |
| $22,500 to $24,999 | 40 (17.8%) | 40 (10.7%) |
| $25,000 to $29,999 | 25 (11.1%) | 44 (11.8%) |
| $30,000 to $34,999 | 0 (0.0%) | 50 (13.4%) |
| $35,000 to $39,999 | 0 (0.0%) | 7 (1.9%) |
| $40,000 to $44,999 | 14 (6.2%) | 19 (5.1%) |
| $45,000 to $49,999 | 0 (0.0%) | 12 (3.2%) |
| $50,000 to $54,999 | 0 (0.0%) | 58 (15.6%) |
| $55,000 to $64,999 | 8 (3.6%) | 2 (0.5%) |
| $65,000 to $74,999 | 0 (0.0%) | 0 (0.0%) |
| $75,000 to $99,999 | 0 (0.0%) | 0 (0.0%) |
| $100,000+ | 22 (9.8%) | 0 (0.0%) |
| Total | 225 (100.0%) | 372 (100.0%) |
Earnings by Sex by Educational Attainment in Durant
Average earnings in Durant are $21,389 for men and $25,800 for women, a difference of 17.1%. Men with an educational attainment of high school diploma enjoy the highest average annual earnings of $11,222, while those with high school diploma education earn the least with $11,222. Women with an educational attainment of college or associate's degree earn the most with the average annual earnings of $42,763, while those with high school diploma education have the smallest earnings of $16,598.
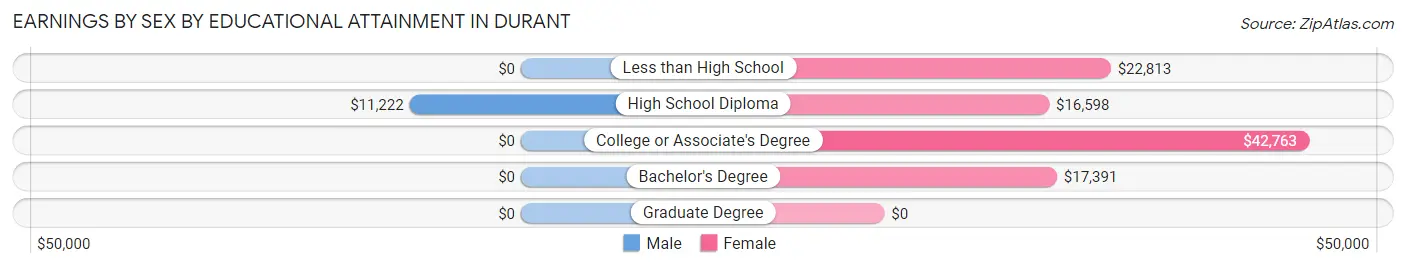
| Educational Attainment | Male Income | Female Income |
| Less than High School | - | - |
| High School Diploma | $11,222 | $16,598 |
| College or Associate's Degree | - | - |
| Bachelor's Degree | - | - |
| Graduate Degree | - | - |
| Total | $21,389 | $25,800 |
Family Income in Durant
Family Income Brackets in Durant
According to the Durant family income data, there are 124 families falling into the less than $10,000 income range, which is the most common income bracket and makes up 26.5% of all families.
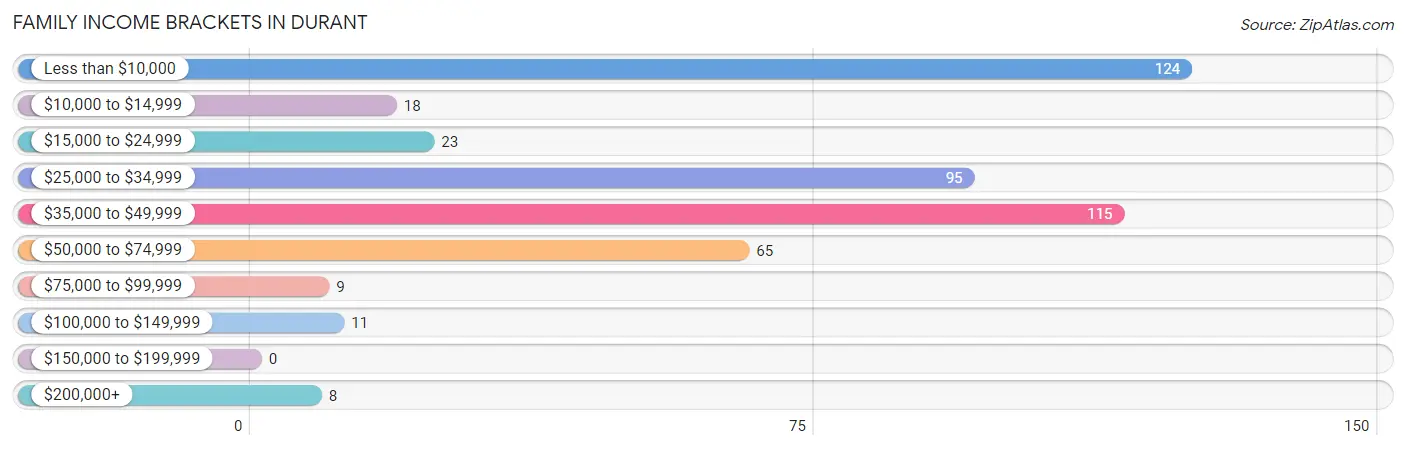
| Income Bracket | # Families | % Families |
| Less than $10,000 | 124 | 26.5% |
| $10,000 to $14,999 | 18 | 3.8% |
| $15,000 to $24,999 | 23 | 4.9% |
| $25,000 to $34,999 | 95 | 20.3% |
| $35,000 to $49,999 | 115 | 24.6% |
| $50,000 to $74,999 | 65 | 13.9% |
| $75,000 to $99,999 | 9 | 1.9% |
| $100,000 to $149,999 | 11 | 2.4% |
| $150,000 to $199,999 | 0 | 0.0% |
| $200,000+ | 8 | 1.7% |
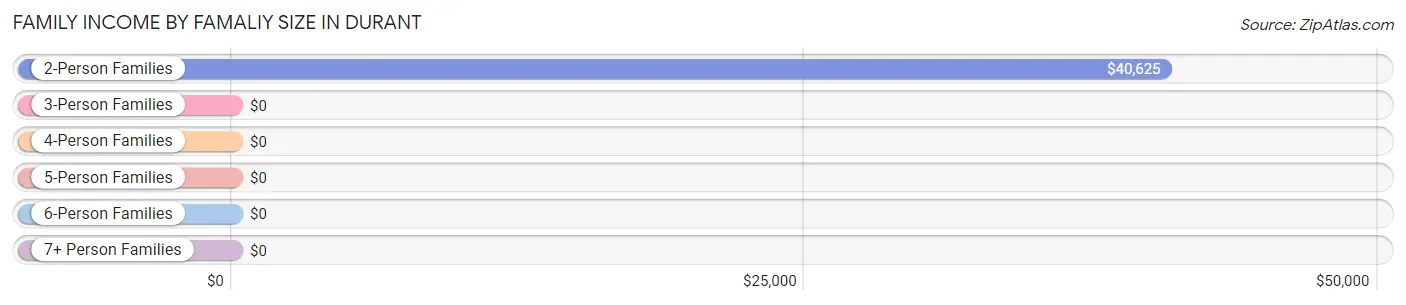
Family Income by Famaliy Size in Durant
2-person families (237 | 50.6%) account for the highest median family income in Durant with $40,625 per family, while 2-person families (237 | 50.6%) have the highest median income of $20,312 per family member.
| Income Bracket | # Families | Median Income |
| 2-Person Families | 237 (50.6%) | $40,625 |
| 3-Person Families | 147 (31.4%) | $0 |
| 4-Person Families | 28 (6.0%) | $0 |
| 5-Person Families | 36 (7.7%) | $0 |
| 6-Person Families | 0 (0.0%) | $0 |
| 7+ Person Families | 20 (4.3%) | $0 |
| Total | 468 (100.0%) | $29,115 |
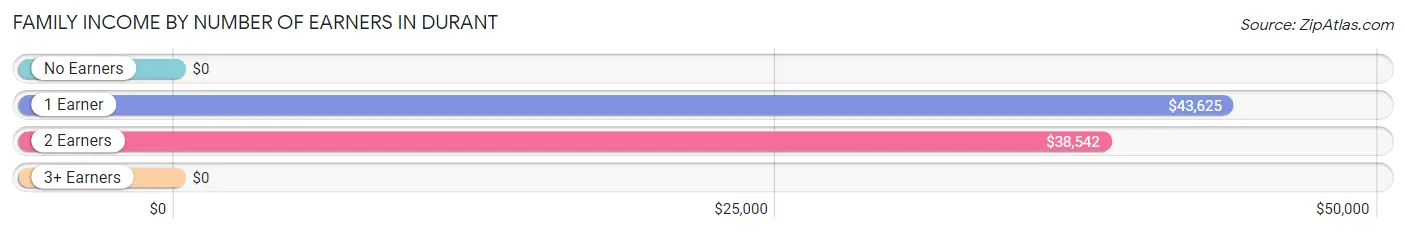
Family Income by Number of Earners in Durant
| Number of Earners | # Families | Median Income |
| No Earners | 199 (42.5%) | $0 |
| 1 Earner | 185 (39.5%) | $43,625 |
| 2 Earners | 79 (16.9%) | $38,542 |
| 3+ Earners | 5 (1.1%) | $0 |
| Total | 468 (100.0%) | $29,115 |
Household Income in Durant
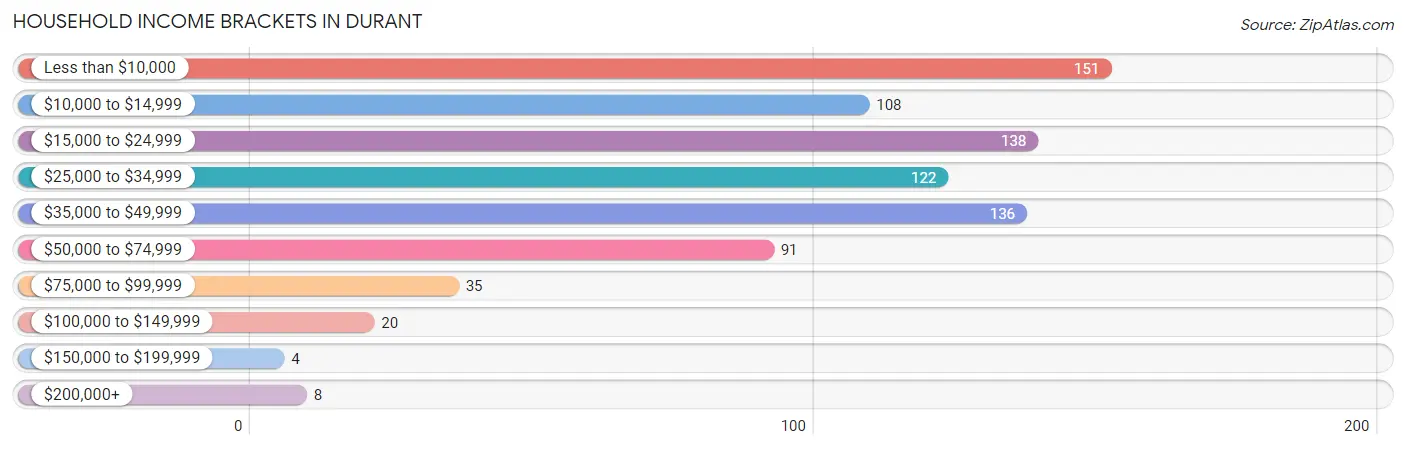
Household Income Brackets in Durant
With 151 households falling in the category, the less than $10,000 income range is the most frequent in Durant, accounting for 18.6% of all households. In contrast, only 4 households (0.5%) fall into the $150,000 to $199,999 income bracket, making it the least populous group.
| Income Bracket | # Households | % Households |
| Less than $10,000 | 151 | 18.6% |
| $10,000 to $14,999 | 108 | 13.3% |
| $15,000 to $24,999 | 138 | 17.0% |
| $25,000 to $34,999 | 122 | 15.0% |
| $35,000 to $49,999 | 136 | 16.7% |
| $50,000 to $74,999 | 91 | 11.2% |
| $75,000 to $99,999 | 35 | 4.3% |
| $100,000 to $149,999 | 20 | 2.5% |
| $150,000 to $199,999 | 4 | 0.5% |
| $200,000+ | 8 | 1.0% |
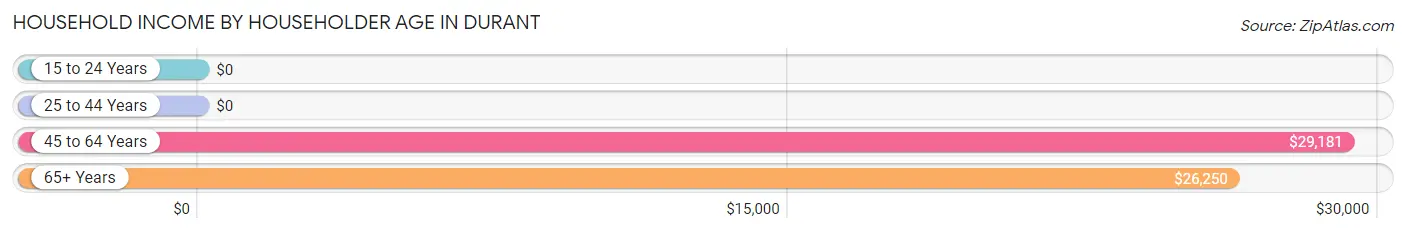
Household Income by Householder Age in Durant
The median household income in Durant is $25,552, with the highest median household income of $29,181 found in the 45 to 64 years age bracket for the primary householder. A total of 373 households (45.9%) fall into this category. Meanwhile, the 15 to 24 years age bracket for the primary householder has the lowest median household income of $0, with 24 households (2.9%) in this group.
| Income Bracket | # Households | Median Income |
| 15 to 24 Years | 24 (2.9%) | $0 |
| 25 to 44 Years | 198 (24.3%) | $0 |
| 45 to 64 Years | 373 (45.9%) | $29,181 |
| 65+ Years | 218 (26.8%) | $26,250 |
| Total | 813 (100.0%) | $25,552 |
Poverty in Durant
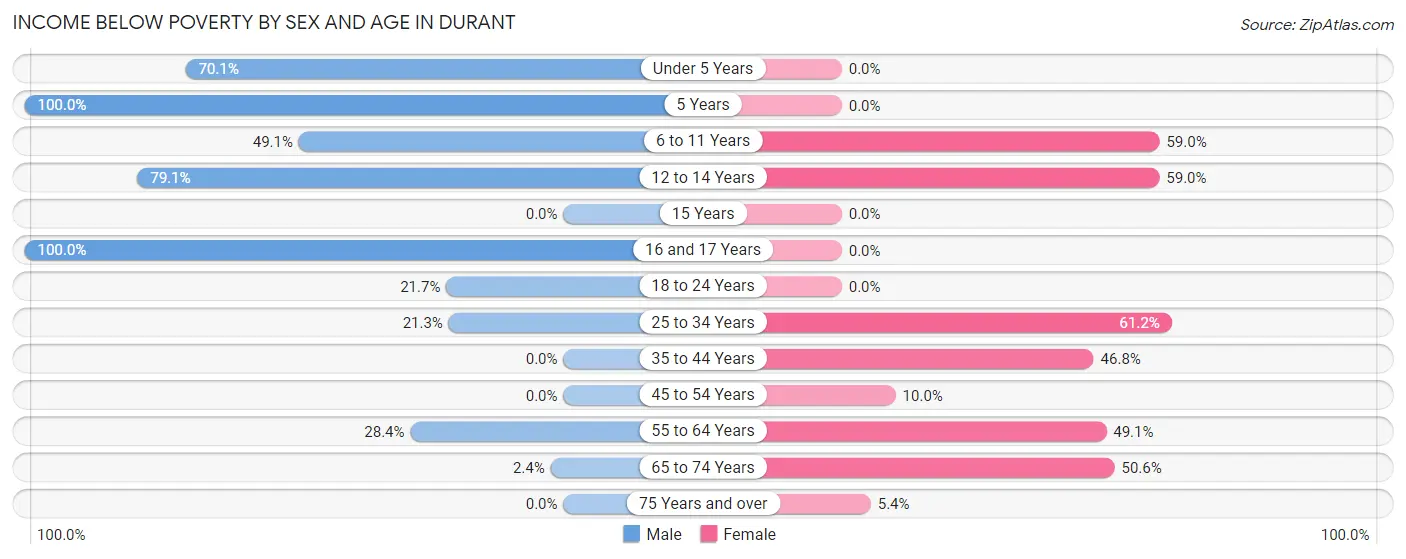
Income Below Poverty by Sex and Age in Durant
With 29.4% poverty level for males and 32.7% for females among the residents of Durant, 5 year old males and 25 to 34 year old females are the most vulnerable to poverty, with 8 males (100.0%) and 90 females (61.2%) in their respective age groups living below the poverty level.
| Age Bracket | Male | Female |
| Under 5 Years | 54 (70.1%) | 0 (0.0%) |
| 5 Years | 8 (100.0%) | 0 (0.0%) |
| 6 to 11 Years | 110 (49.1%) | 23 (59.0%) |
| 12 to 14 Years | 34 (79.1%) | 56 (59.0%) |
| 15 Years | 0 (0.0%) | 0 (0.0%) |
| 16 and 17 Years | 12 (100.0%) | 0 (0.0%) |
| 18 to 24 Years | 5 (21.7%) | 0 (0.0%) |
| 25 to 34 Years | 20 (21.3%) | 90 (61.2%) |
| 35 to 44 Years | 0 (0.0%) | 36 (46.8%) |
| 45 to 54 Years | 0 (0.0%) | 14 (10.0%) |
| 55 to 64 Years | 48 (28.4%) | 81 (49.1%) |
| 65 to 74 Years | 3 (2.4%) | 41 (50.6%) |
| 75 Years and over | 0 (0.0%) | 5 (5.4%) |
| Total | 294 (29.4%) | 346 (32.7%) |
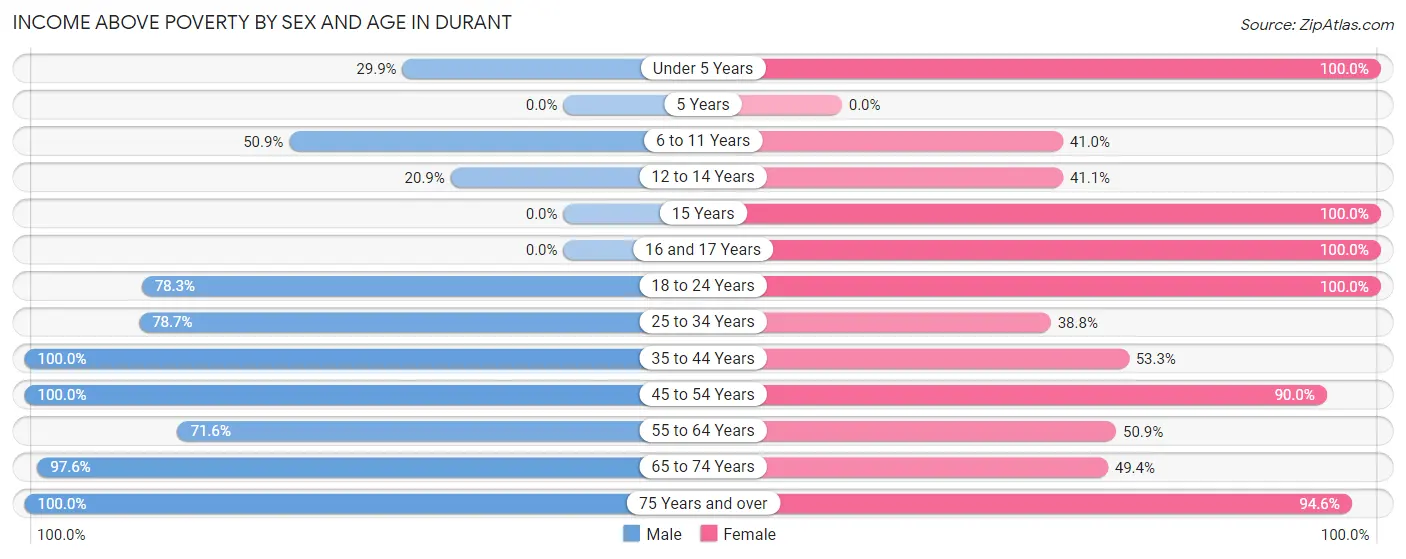
Income Above Poverty by Sex and Age in Durant
According to the poverty statistics in Durant, males aged 35 to 44 years and females aged under 5 years are the age groups that are most secure financially, with 100.0% of males and 100.0% of females in these age groups living above the poverty line.
| Age Bracket | Male | Female |
| Under 5 Years | 23 (29.9%) | 93 (100.0%) |
| 5 Years | 0 (0.0%) | 0 (0.0%) |
| 6 to 11 Years | 114 (50.9%) | 16 (41.0%) |
| 12 to 14 Years | 9 (20.9%) | 39 (41.0%) |
| 15 Years | 0 (0.0%) | 35 (100.0%) |
| 16 and 17 Years | 0 (0.0%) | 40 (100.0%) |
| 18 to 24 Years | 18 (78.3%) | 52 (100.0%) |
| 25 to 34 Years | 74 (78.7%) | 57 (38.8%) |
| 35 to 44 Years | 33 (100.0%) | 41 (53.2%) |
| 45 to 54 Years | 142 (100.0%) | 126 (90.0%) |
| 55 to 64 Years | 121 (71.6%) | 84 (50.9%) |
| 65 to 74 Years | 123 (97.6%) | 40 (49.4%) |
| 75 Years and over | 48 (100.0%) | 88 (94.6%) |
| Total | 705 (70.6%) | 711 (67.3%) |
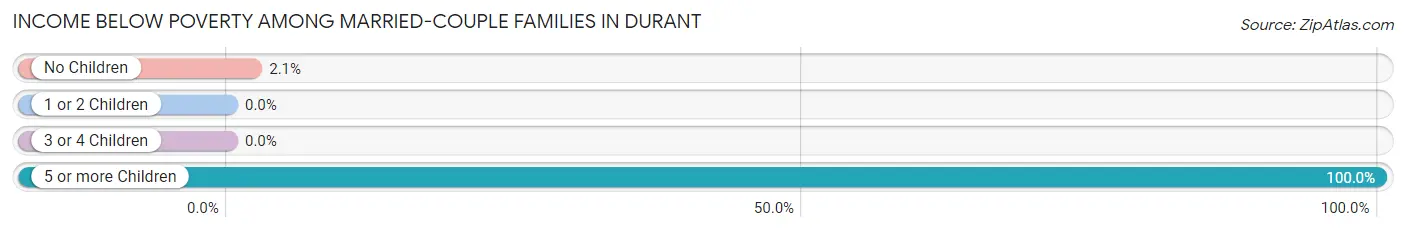
Income Below Poverty Among Married-Couple Families in Durant
The poverty statistics for married-couple families in Durant show that 7.9% or 18 of the total 229 families live below the poverty line. Families with 5 or more children have the highest poverty rate of 100.0%, comprising of 15 families. On the other hand, families with 1 or 2 children have the lowest poverty rate of 0.0%, which includes 0 families.
| Children | Above Poverty | Below Poverty |
| No Children | 139 (97.9%) | 3 (2.1%) |
| 1 or 2 Children | 37 (100.0%) | 0 (0.0%) |
| 3 or 4 Children | 35 (100.0%) | 0 (0.0%) |
| 5 or more Children | 0 (0.0%) | 15 (100.0%) |
| Total | 211 (92.1%) | 18 (7.9%) |
Income Below Poverty Among Single-Parent Households in Durant
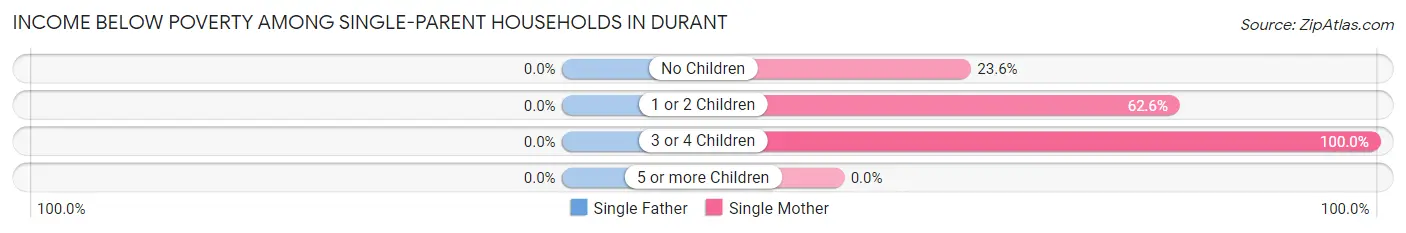
| Children | Single Father | Single Mother |
| No Children | 0 (0.0%) | 17 (23.6%) |
| 1 or 2 Children | 0 (0.0%) | 77 (62.6%) |
| 3 or 4 Children | 0 (0.0%) | 34 (100.0%) |
| 5 or more Children | 0 (0.0%) | 0 (0.0%) |
| Total | 0 (0.0%) | 128 (55.9%) |
Income Below Poverty Among Married-Couple vs Single-Parent Households in Durant
The poverty data for Durant shows that 18 of the married-couple family households (7.9%) and 128 of the single-parent households (53.6%) are living below the poverty level. Within the married-couple family households, those with 5 or more children have the highest poverty rate, with 15 households (100.0%) falling below the poverty line. Among the single-parent households, those with 3 or 4 children have the highest poverty rate, with 34 household (100.0%) living below poverty.
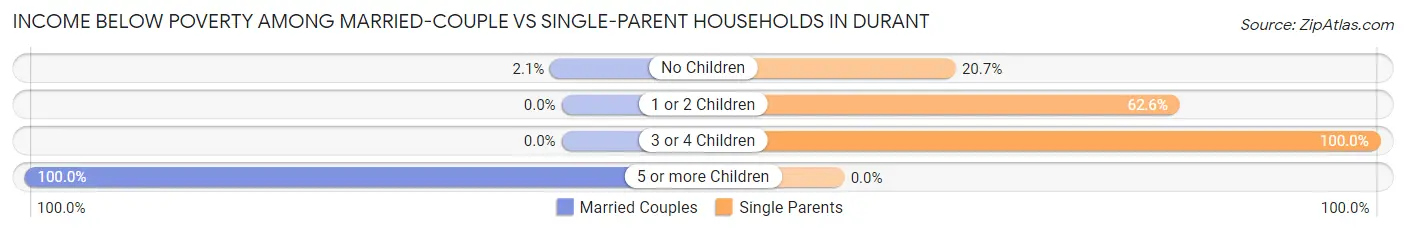
| Children | Married-Couple Families | Single-Parent Households |
| No Children | 3 (2.1%) | 17 (20.7%) |
| 1 or 2 Children | 0 (0.0%) | 77 (62.6%) |
| 3 or 4 Children | 0 (0.0%) | 34 (100.0%) |
| 5 or more Children | 15 (100.0%) | 0 (0.0%) |
| Total | 18 (7.9%) | 128 (53.6%) |
Employment Characteristics in Durant
Employment by Class of Employer in Durant
Among the 546 employed individuals in Durant, private company employees (417 | 76.4%), state government employees (105 | 19.2%), and local government employees (16 | 2.9%) make up the most common classes of employment.
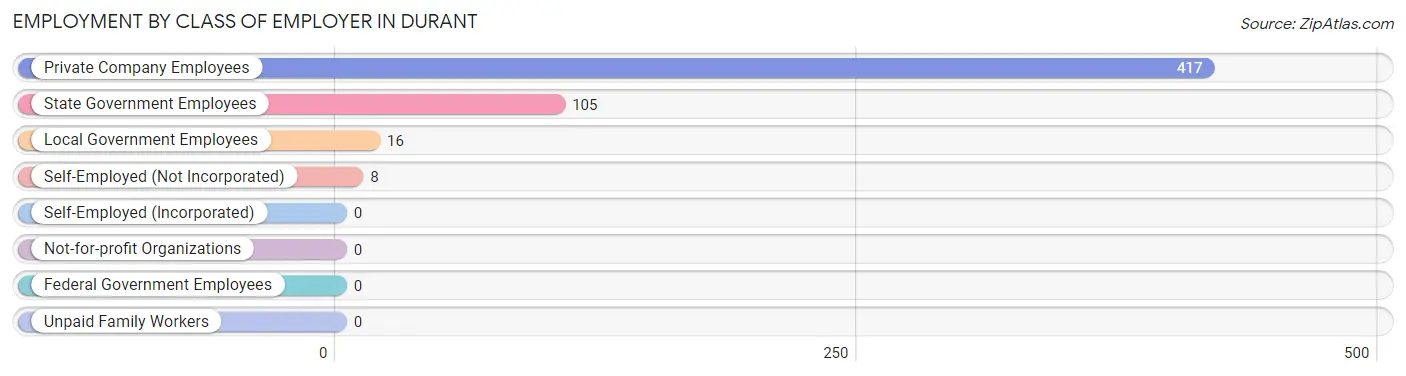
| Employer Class | # Employees | % Employees |
| Private Company Employees | 417 | 76.4% |
| Self-Employed (Incorporated) | 0 | 0.0% |
| Self-Employed (Not Incorporated) | 8 | 1.5% |
| Not-for-profit Organizations | 0 | 0.0% |
| Local Government Employees | 16 | 2.9% |
| State Government Employees | 105 | 19.2% |
| Federal Government Employees | 0 | 0.0% |
| Unpaid Family Workers | 0 | 0.0% |
| Total | 546 | 100.0% |
Employment Status by Age in Durant
According to the labor force statistics for Durant, out of the total population over 16 years of age (1,519), 41.3% or 627 individuals are in the labor force, with 10.0% or 63 of them unemployed. The age group with the highest labor force participation rate is 20 to 24 years, with 85.5% or 59 individuals in the labor force. Within the labor force, the 16 to 19 years age range has the highest percentage of unemployed individuals, with 100.0% or 6 of them being unemployed.
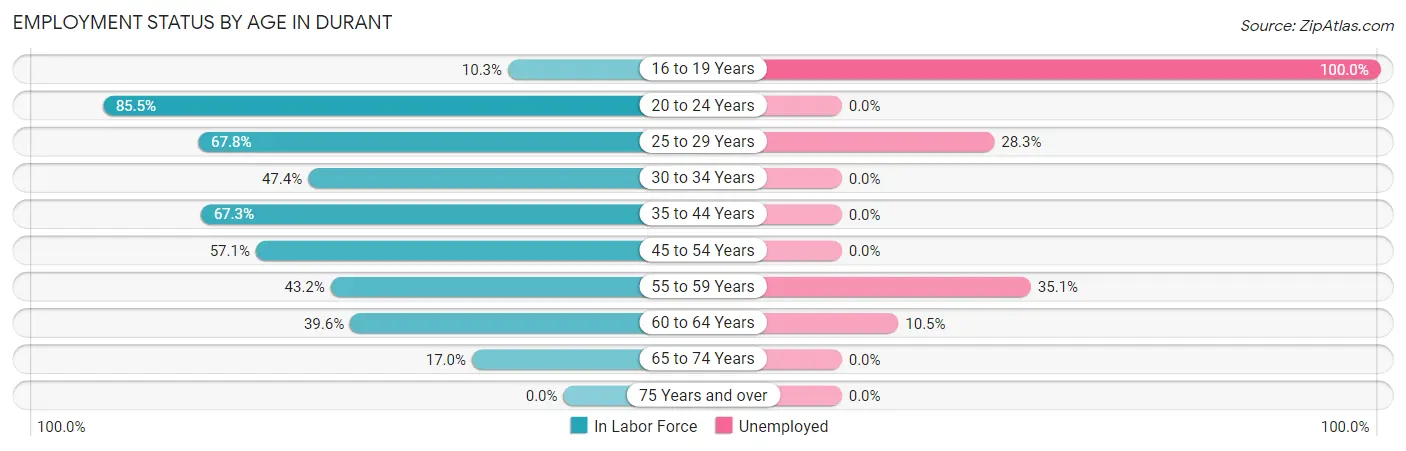
| Age Bracket | In Labor Force | Unemployed |
| 16 to 19 Years | 6 (10.3%) | 6 (100.0%) |
| 20 to 24 Years | 59 (85.5%) | 0 (0.0%) |
| 25 to 29 Years | 99 (67.8%) | 28 (28.3%) |
| 30 to 34 Years | 45 (47.4%) | 0 (0.0%) |
| 35 to 44 Years | 74 (67.3%) | 0 (0.0%) |
| 45 to 54 Years | 161 (57.1%) | 0 (0.0%) |
| 55 to 59 Years | 57 (43.2%) | 20 (35.1%) |
| 60 to 64 Years | 86 (39.6%) | 9 (10.5%) |
| 65 to 74 Years | 40 (17.0%) | 0 (0.0%) |
| 75 Years and over | 0 (0.0%) | 0 (0.0%) |
| Total | 627 (41.3%) | 63 (10.0%) |
Employment Status by Educational Attainment in Durant
According to labor force statistics for Durant, 53.2% of individuals (522) out of the total population between 25 and 64 years of age (982) are in the labor force, with 10.9% or 57 of them being unemployed. The group with the highest labor force participation rate are those with the educational attainment of bachelor's degree or higher, with 71.0% or 44 individuals in the labor force. Within the labor force, individuals with less than high school education have the highest percentage of unemployment, with 35.1% or 20 of them being unemployed.
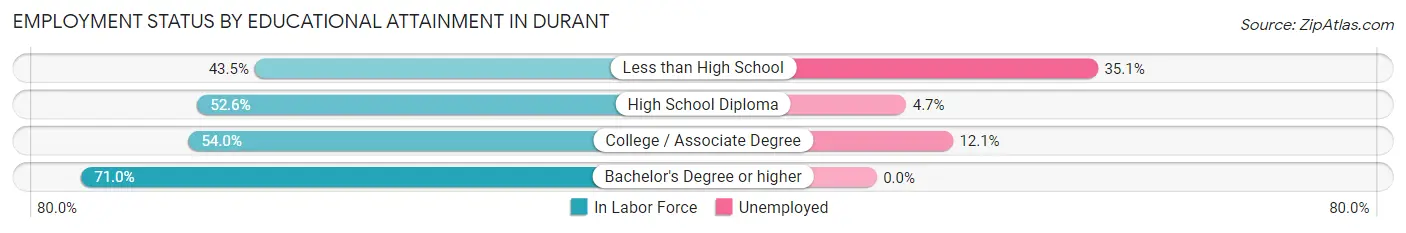
| Educational Attainment | In Labor Force | Unemployed |
| Less than High School | 57 (43.5%) | 46 (35.1%) |
| High School Diploma | 190 (52.6%) | 17 (4.7%) |
| College / Associate Degree | 231 (54.0%) | 52 (12.1%) |
| Bachelor's Degree or higher | 44 (71.0%) | 0 (0.0%) |
| Total | 522 (53.2%) | 107 (10.9%) |
Employment Occupations by Sex in Durant
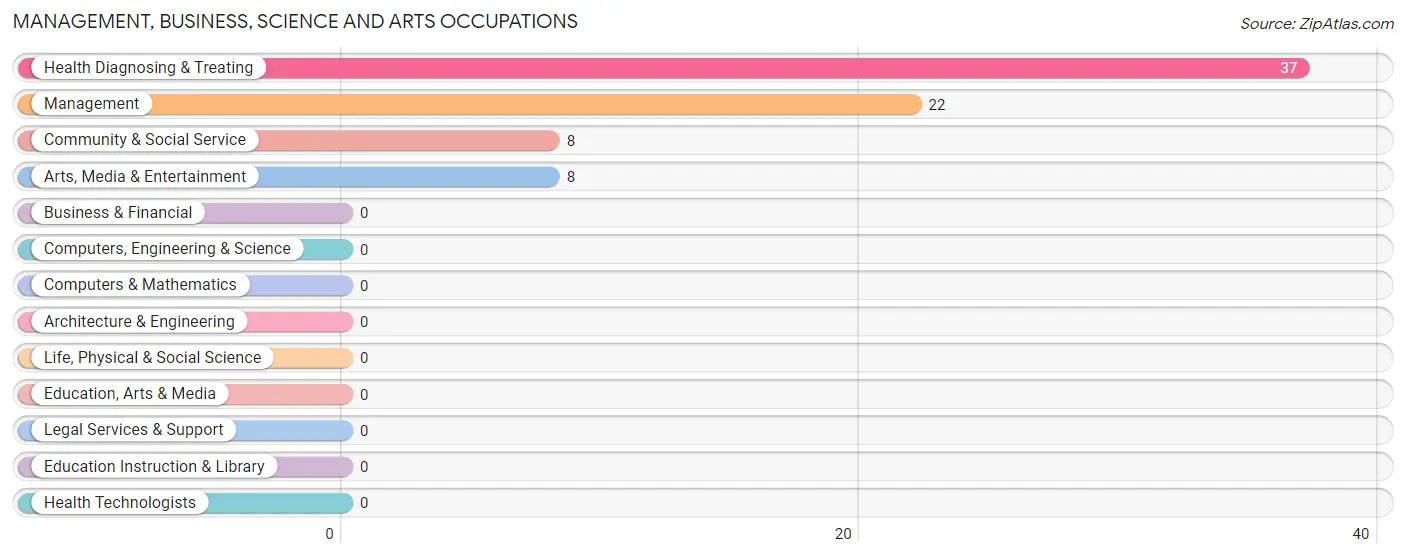
Management, Business, Science and Arts Occupations
The most common Management, Business, Science and Arts occupations in Durant are Health Diagnosing & Treating (37 | 6.6%), Management (22 | 3.9%), Community & Social Service (8 | 1.4%), and Arts, Media & Entertainment (8 | 1.4%).
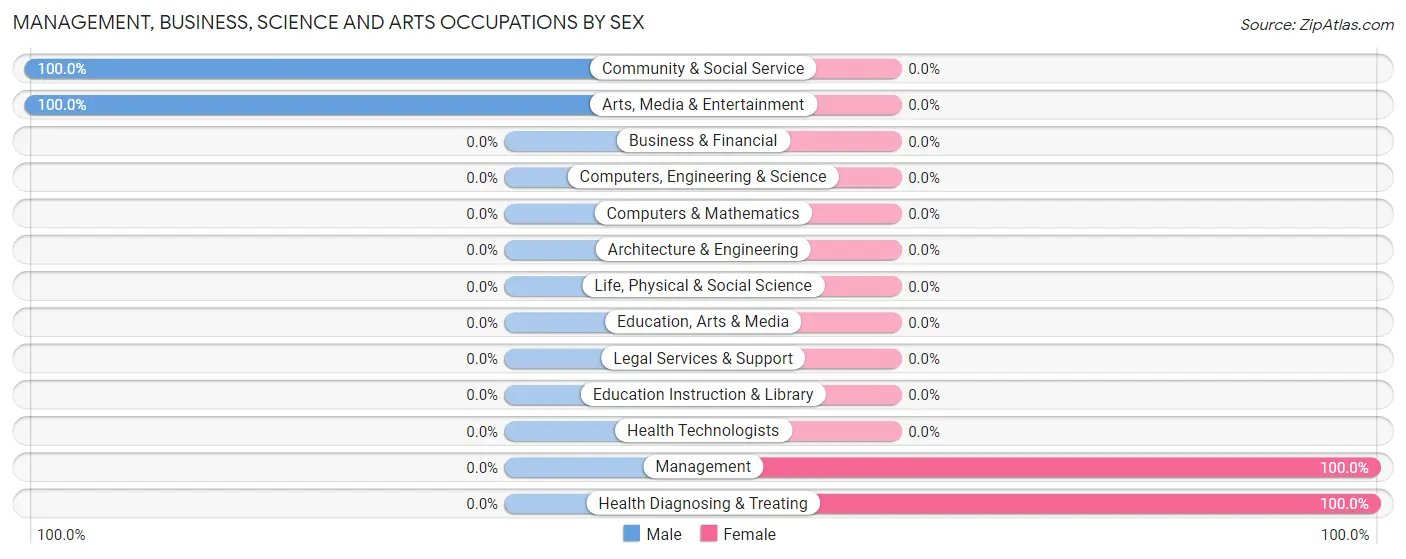
Management, Business, Science and Arts Occupations by Sex
Within the Management, Business, Science and Arts occupations in Durant, the most male-oriented occupations are Community & Social Service (100.0%), and Arts, Media & Entertainment (100.0%), while the most female-oriented occupations are Management (100.0%), and Health Diagnosing & Treating (100.0%).
| Occupation | Male | Female |
| Management | 0 (0.0%) | 22 (100.0%) |
| Business & Financial | 0 (0.0%) | 0 (0.0%) |
| Computers, Engineering & Science | 0 (0.0%) | 0 (0.0%) |
| Computers & Mathematics | 0 (0.0%) | 0 (0.0%) |
| Architecture & Engineering | 0 (0.0%) | 0 (0.0%) |
| Life, Physical & Social Science | 0 (0.0%) | 0 (0.0%) |
| Community & Social Service | 8 (100.0%) | 0 (0.0%) |
| Education, Arts & Media | 0 (0.0%) | 0 (0.0%) |
| Legal Services & Support | 0 (0.0%) | 0 (0.0%) |
| Education Instruction & Library | 0 (0.0%) | 0 (0.0%) |
| Arts, Media & Entertainment | 8 (100.0%) | 0 (0.0%) |
| Health Diagnosing & Treating | 0 (0.0%) | 37 (100.0%) |
| Health Technologists | 0 (0.0%) | 0 (0.0%) |
| Total (Category) | 8 (11.9%) | 59 (88.1%) |
| Total (Overall) | 192 (34.0%) | 372 (66.0%) |
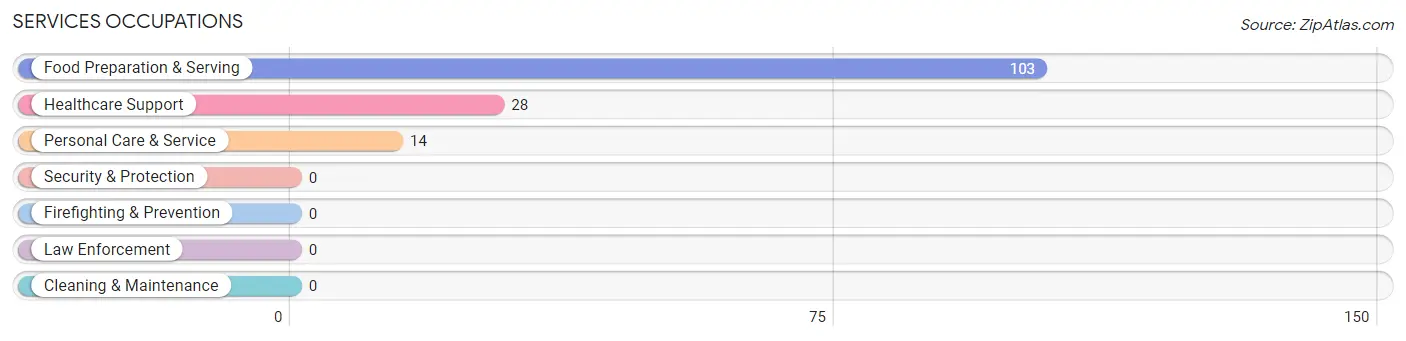
Services Occupations
The most common Services occupations in Durant are Food Preparation & Serving (103 | 18.3%), Healthcare Support (28 | 5.0%), and Personal Care & Service (14 | 2.5%).
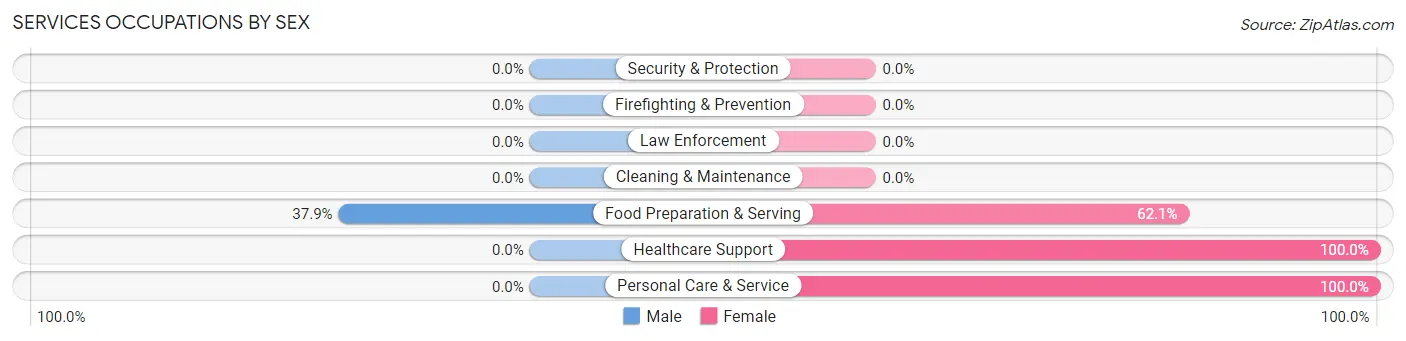
Services Occupations by Sex
| Occupation | Male | Female |
| Healthcare Support | 0 (0.0%) | 28 (100.0%) |
| Security & Protection | 0 (0.0%) | 0 (0.0%) |
| Firefighting & Prevention | 0 (0.0%) | 0 (0.0%) |
| Law Enforcement | 0 (0.0%) | 0 (0.0%) |
| Food Preparation & Serving | 39 (37.9%) | 64 (62.1%) |
| Cleaning & Maintenance | 0 (0.0%) | 0 (0.0%) |
| Personal Care & Service | 0 (0.0%) | 14 (100.0%) |
| Total (Category) | 39 (26.9%) | 106 (73.1%) |
| Total (Overall) | 192 (34.0%) | 372 (66.0%) |
Sales and Office Occupations
The most common Sales and Office occupations in Durant are Sales & Related (73 | 12.9%), and Office & Administration (31 | 5.5%).
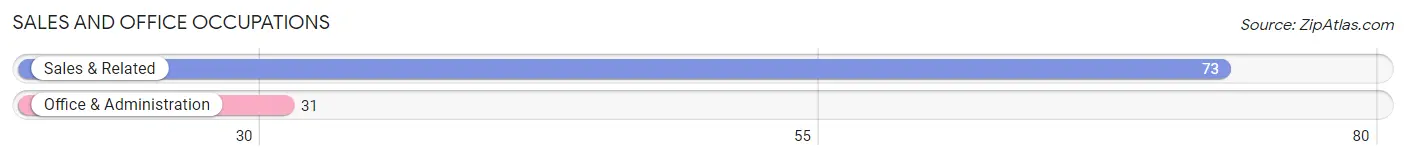
Sales and Office Occupations by Sex
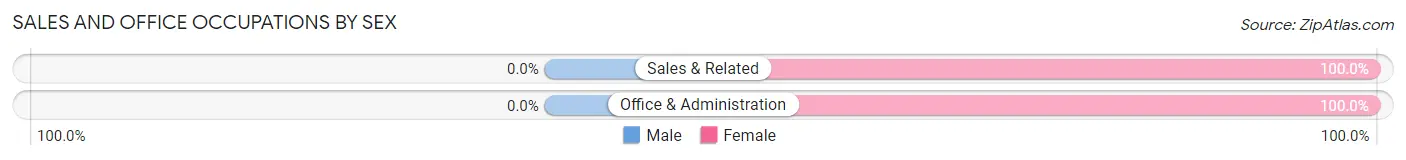
| Occupation | Male | Female |
| Sales & Related | 0 (0.0%) | 73 (100.0%) |
| Office & Administration | 0 (0.0%) | 31 (100.0%) |
| Total (Category) | 0 (0.0%) | 104 (100.0%) |
| Total (Overall) | 192 (34.0%) | 372 (66.0%) |
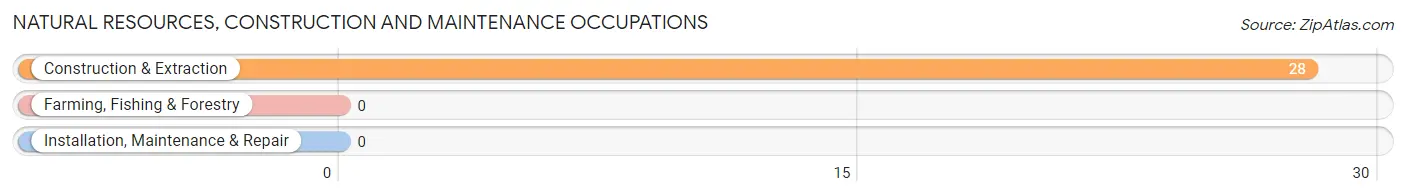
Natural Resources, Construction and Maintenance Occupations
The most common Natural Resources, Construction and Maintenance occupations in Durant are , and Construction & Extraction (28 | 5.0%).
Natural Resources, Construction and Maintenance Occupations by Sex
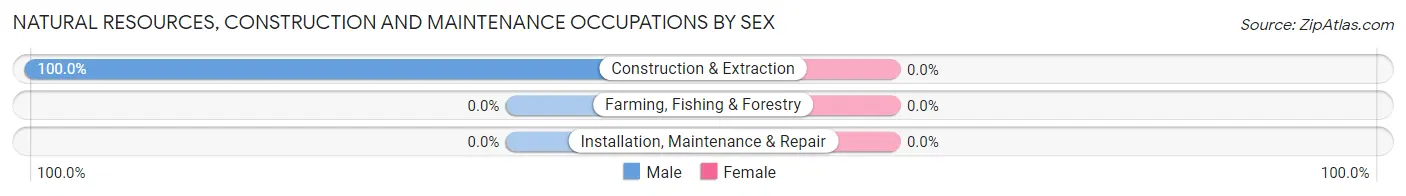
| Occupation | Male | Female |
| Farming, Fishing & Forestry | 0 (0.0%) | 0 (0.0%) |
| Construction & Extraction | 28 (100.0%) | 0 (0.0%) |
| Installation, Maintenance & Repair | 0 (0.0%) | 0 (0.0%) |
| Total (Category) | 28 (100.0%) | 0 (0.0%) |
| Total (Overall) | 192 (34.0%) | 372 (66.0%) |
Production, Transportation and Moving Occupations
The most common Production, Transportation and Moving occupations in Durant are Production (123 | 21.8%), Material Moving (91 | 16.1%), and Transportation (6 | 1.1%).
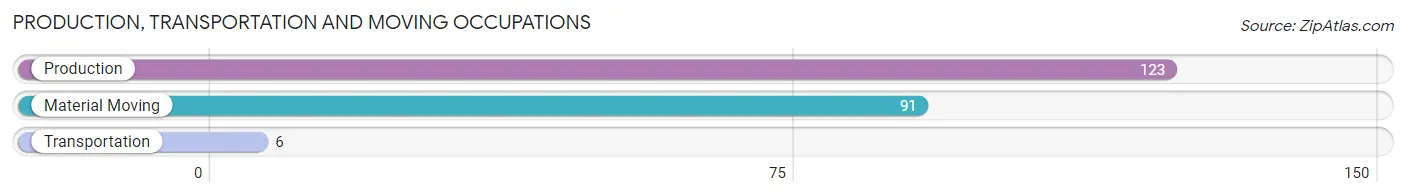
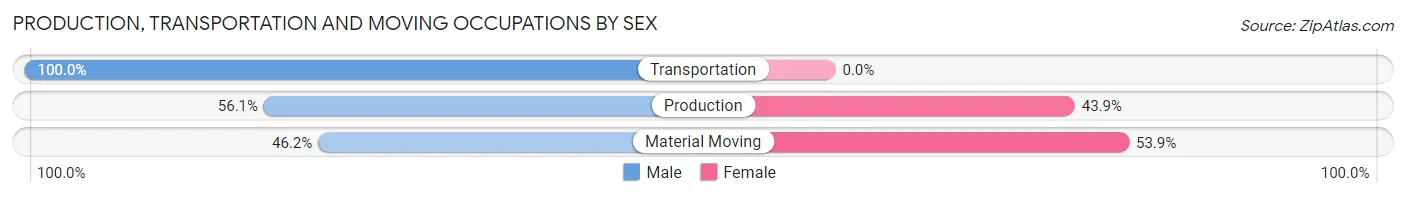
Production, Transportation and Moving Occupations by Sex
| Occupation | Male | Female |
| Production | 69 (56.1%) | 54 (43.9%) |
| Transportation | 6 (100.0%) | 0 (0.0%) |
| Material Moving | 42 (46.2%) | 49 (53.8%) |
| Total (Category) | 117 (53.2%) | 103 (46.8%) |
| Total (Overall) | 192 (34.0%) | 372 (66.0%) |
Employment Industries by Sex in Durant
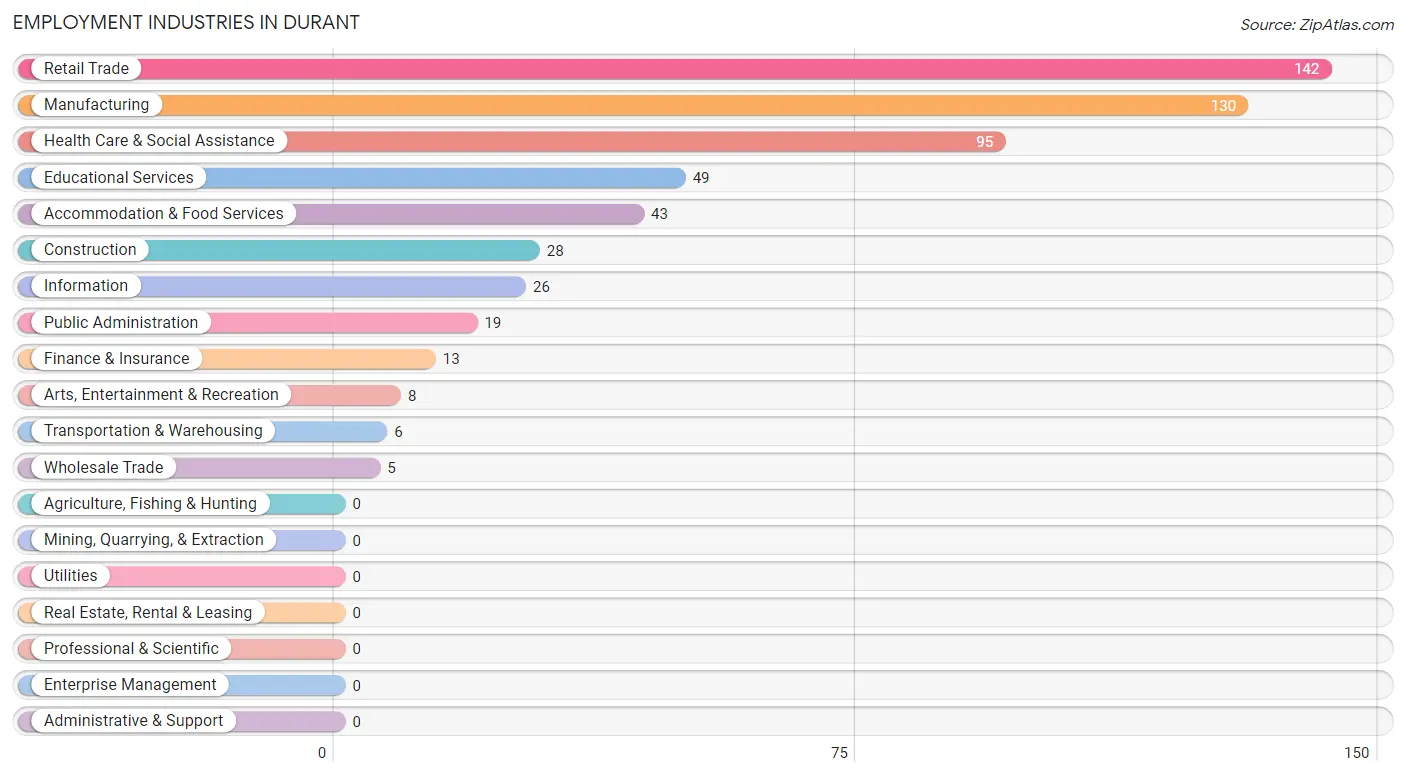
Employment Industries in Durant
The major employment industries in Durant include Retail Trade (142 | 25.2%), Manufacturing (130 | 23.1%), Health Care & Social Assistance (95 | 16.8%), Educational Services (49 | 8.7%), and Accommodation & Food Services (43 | 7.6%).
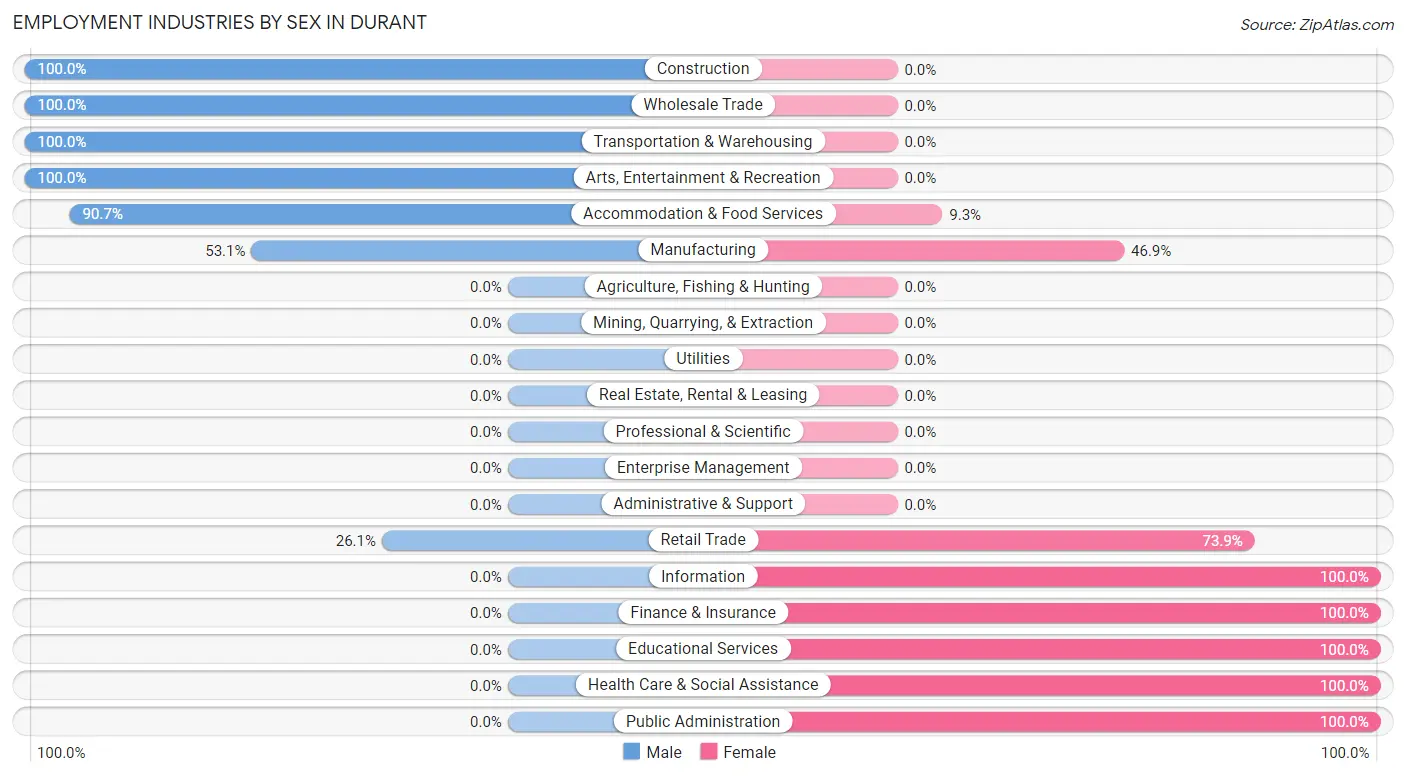
Employment Industries by Sex in Durant
The Durant industries that see more men than women are Construction (100.0%), Wholesale Trade (100.0%), and Transportation & Warehousing (100.0%), whereas the industries that tend to have a higher number of women are Information (100.0%), Finance & Insurance (100.0%), and Educational Services (100.0%).
| Industry | Male | Female |
| Agriculture, Fishing & Hunting | 0 (0.0%) | 0 (0.0%) |
| Mining, Quarrying, & Extraction | 0 (0.0%) | 0 (0.0%) |
| Construction | 28 (100.0%) | 0 (0.0%) |
| Manufacturing | 69 (53.1%) | 61 (46.9%) |
| Wholesale Trade | 5 (100.0%) | 0 (0.0%) |
| Retail Trade | 37 (26.1%) | 105 (73.9%) |
| Transportation & Warehousing | 6 (100.0%) | 0 (0.0%) |
| Utilities | 0 (0.0%) | 0 (0.0%) |
| Information | 0 (0.0%) | 26 (100.0%) |
| Finance & Insurance | 0 (0.0%) | 13 (100.0%) |
| Real Estate, Rental & Leasing | 0 (0.0%) | 0 (0.0%) |
| Professional & Scientific | 0 (0.0%) | 0 (0.0%) |
| Enterprise Management | 0 (0.0%) | 0 (0.0%) |
| Administrative & Support | 0 (0.0%) | 0 (0.0%) |
| Educational Services | 0 (0.0%) | 49 (100.0%) |
| Health Care & Social Assistance | 0 (0.0%) | 95 (100.0%) |
| Arts, Entertainment & Recreation | 8 (100.0%) | 0 (0.0%) |
| Accommodation & Food Services | 39 (90.7%) | 4 (9.3%) |
| Public Administration | 0 (0.0%) | 19 (100.0%) |
| Total | 192 (34.0%) | 372 (66.0%) |
Education in Durant
School Enrollment in Durant
The most common levels of schooling among the 689 students in Durant are elementary school (249 | 36.1%), nursery / preschool (147 | 21.3%), and middle school (147 | 21.3%).
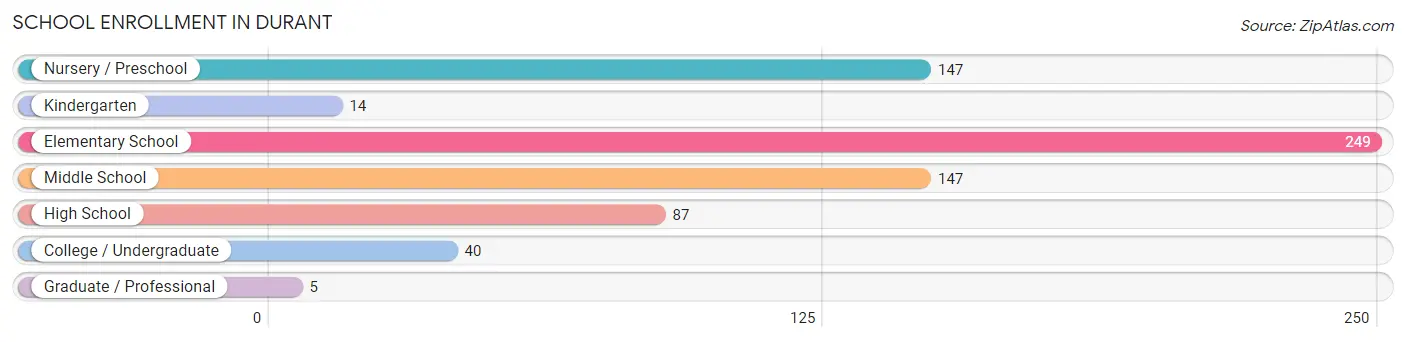
| School Level | # Students | % Students |
| Nursery / Preschool | 147 | 21.3% |
| Kindergarten | 14 | 2.0% |
| Elementary School | 249 | 36.1% |
| Middle School | 147 | 21.3% |
| High School | 87 | 12.6% |
| College / Undergraduate | 40 | 5.8% |
| Graduate / Professional | 5 | 0.7% |
| Total | 689 | 100.0% |
School Enrollment by Age by Funding Source in Durant
Out of a total of 689 students who are enrolled in schools in Durant, 19 (2.8%) attend a private institution, while the remaining 670 (97.2%) are enrolled in public schools. The age group of 35 years and over has the highest likelihood of being enrolled in private schools, with 10 (52.6% in the age bracket) enrolled. Conversely, the age group of 3 to 4 year olds has the lowest likelihood of being enrolled in a private school, with 139 (100.0% in the age bracket) attending a public institution.
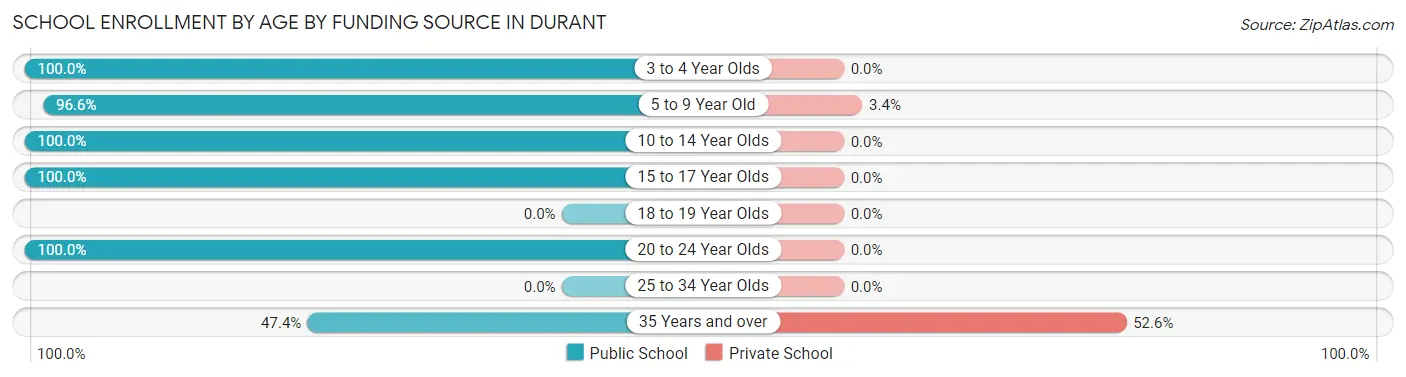
| Age Bracket | Public School | Private School |
| 3 to 4 Year Olds | 139 (100.0%) | 0 (0.0%) |
| 5 to 9 Year Old | 253 (96.6%) | 9 (3.4%) |
| 10 to 14 Year Olds | 147 (100.0%) | 0 (0.0%) |
| 15 to 17 Year Olds | 87 (100.0%) | 0 (0.0%) |
| 18 to 19 Year Olds | 0 (0.0%) | 0 (0.0%) |
| 20 to 24 Year Olds | 35 (100.0%) | 0 (0.0%) |
| 25 to 34 Year Olds | 0 (0.0%) | 0 (0.0%) |
| 35 Years and over | 9 (47.4%) | 10 (52.6%) |
| Total | 670 (97.2%) | 19 (2.8%) |
Educational Attainment by Field of Study in Durant
Education (44 | 44.0%), business (31 | 31.0%), arts & humanities (8 | 8.0%), bio, nature & agricultural (7 | 7.0%), and multidisciplinary studies (5 | 5.0%) are the most common fields of study among 100 individuals in Durant who have obtained a bachelor's degree or higher.
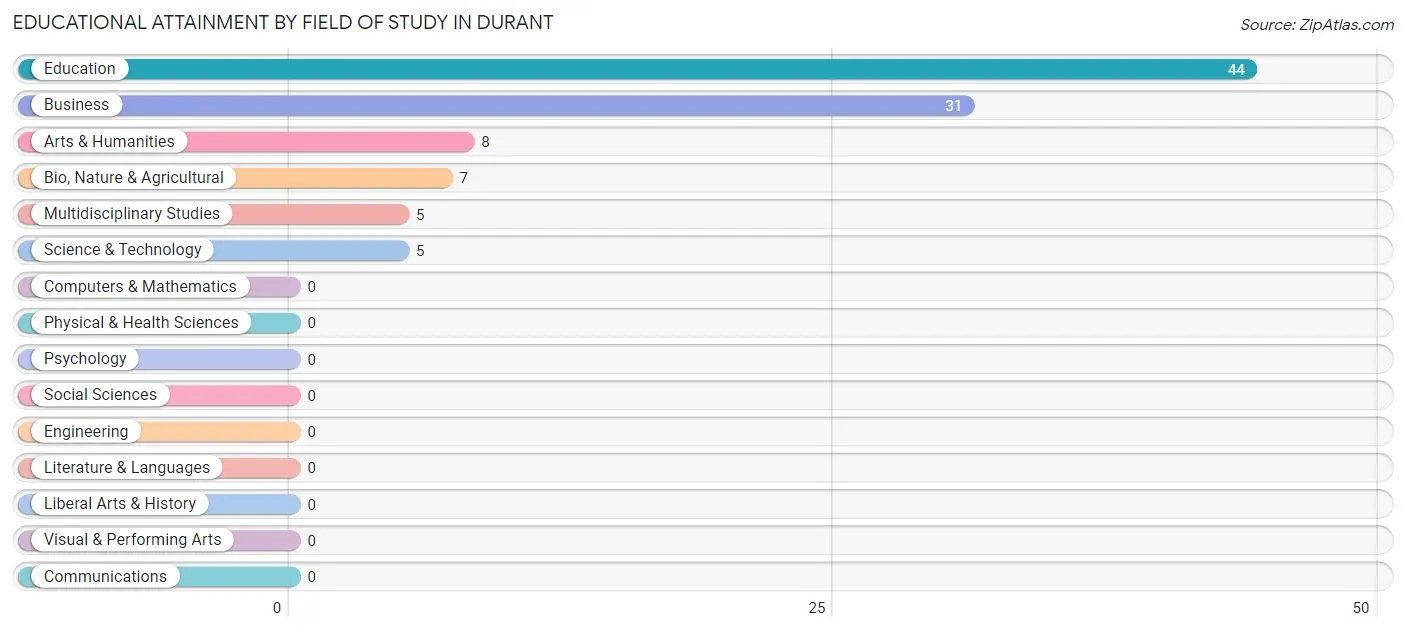
| Field of Study | # Graduates | % Graduates |
| Computers & Mathematics | 0 | 0.0% |
| Bio, Nature & Agricultural | 7 | 7.0% |
| Physical & Health Sciences | 0 | 0.0% |
| Psychology | 0 | 0.0% |
| Social Sciences | 0 | 0.0% |
| Engineering | 0 | 0.0% |
| Multidisciplinary Studies | 5 | 5.0% |
| Science & Technology | 5 | 5.0% |
| Business | 31 | 31.0% |
| Education | 44 | 44.0% |
| Literature & Languages | 0 | 0.0% |
| Liberal Arts & History | 0 | 0.0% |
| Visual & Performing Arts | 0 | 0.0% |
| Communications | 0 | 0.0% |
| Arts & Humanities | 8 | 8.0% |
| Total | 100 | 100.0% |
Transportation & Commute in Durant
Vehicle Availability by Sex in Durant
The most prevalent vehicle ownership categories in Durant are males with 2 vehicles (113, accounting for 64.9%) and females with 2 vehicles (219, making up 30.4%).
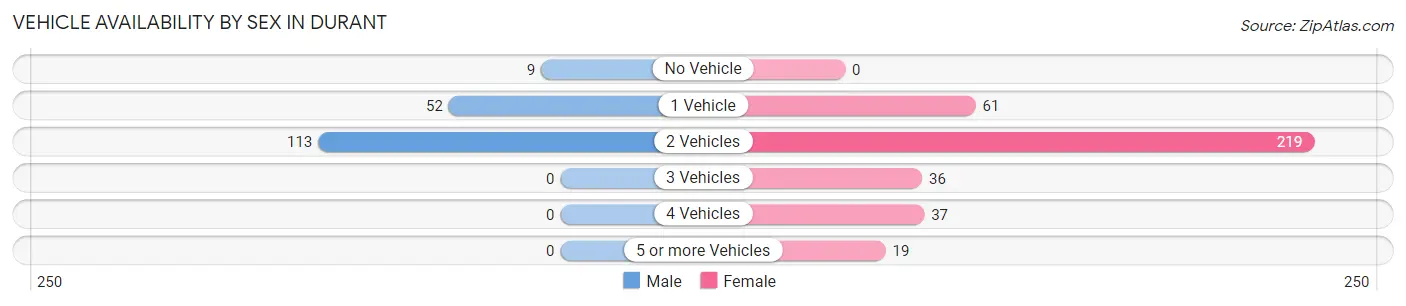
| Vehicles Available | Male | Female |
| No Vehicle | 9 (5.2%) | 0 (0.0%) |
| 1 Vehicle | 52 (29.9%) | 61 (16.4%) |
| 2 Vehicles | 113 (64.9%) | 219 (58.9%) |
| 3 Vehicles | 0 (0.0%) | 36 (9.7%) |
| 4 Vehicles | 0 (0.0%) | 37 (10.0%) |
| 5 or more Vehicles | 0 (0.0%) | 19 (5.1%) |
| Total | 174 (100.0%) | 372 (100.0%) |
Commute Time in Durant
The most frequently occuring commute durations in Durant are 10 to 14 minutes (124 commuters, 23.8%), 30 to 34 minutes (77 commuters, 14.8%), and 45 to 59 minutes (72 commuters, 13.9%).
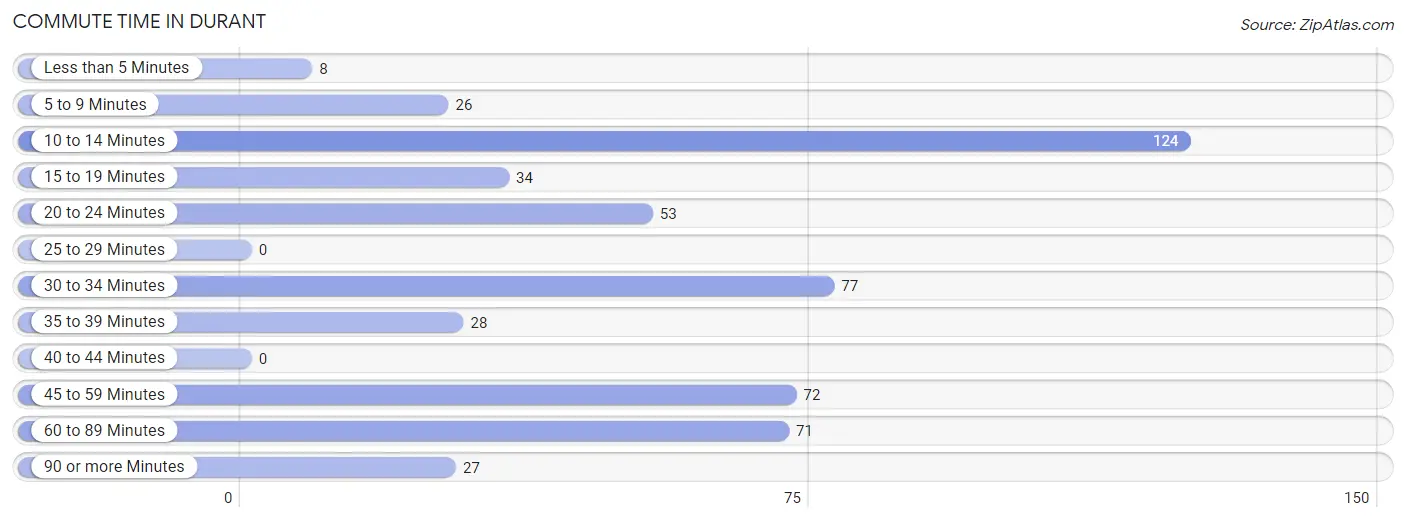
| Commute Time | # Commuters | % Commuters |
| Less than 5 Minutes | 8 | 1.5% |
| 5 to 9 Minutes | 26 | 5.0% |
| 10 to 14 Minutes | 124 | 23.8% |
| 15 to 19 Minutes | 34 | 6.5% |
| 20 to 24 Minutes | 53 | 10.2% |
| 25 to 29 Minutes | 0 | 0.0% |
| 30 to 34 Minutes | 77 | 14.8% |
| 35 to 39 Minutes | 28 | 5.4% |
| 40 to 44 Minutes | 0 | 0.0% |
| 45 to 59 Minutes | 72 | 13.9% |
| 60 to 89 Minutes | 71 | 13.7% |
| 90 or more Minutes | 27 | 5.2% |
Commute Time by Sex in Durant
The most common commute times in Durant are 30 to 34 minutes (55 commuters, 31.6%) for males and 10 to 14 minutes (101 commuters, 29.2%) for females.
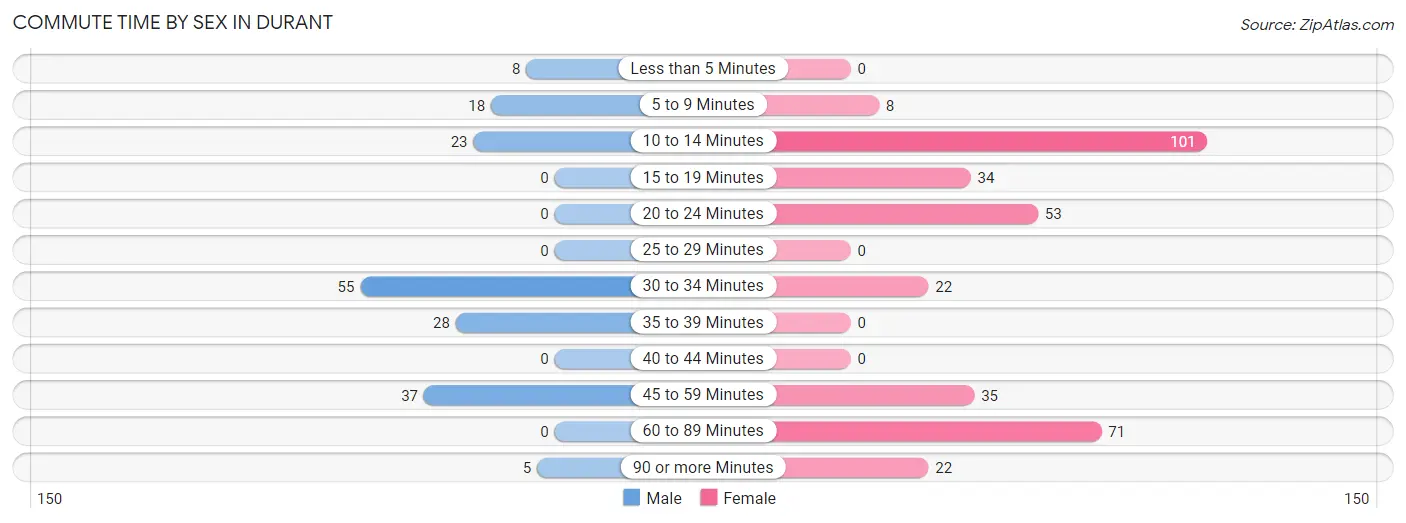
| Commute Time | Male | Female |
| Less than 5 Minutes | 8 (4.6%) | 0 (0.0%) |
| 5 to 9 Minutes | 18 (10.3%) | 8 (2.3%) |
| 10 to 14 Minutes | 23 (13.2%) | 101 (29.2%) |
| 15 to 19 Minutes | 0 (0.0%) | 34 (9.8%) |
| 20 to 24 Minutes | 0 (0.0%) | 53 (15.3%) |
| 25 to 29 Minutes | 0 (0.0%) | 0 (0.0%) |
| 30 to 34 Minutes | 55 (31.6%) | 22 (6.4%) |
| 35 to 39 Minutes | 28 (16.1%) | 0 (0.0%) |
| 40 to 44 Minutes | 0 (0.0%) | 0 (0.0%) |
| 45 to 59 Minutes | 37 (21.3%) | 35 (10.1%) |
| 60 to 89 Minutes | 0 (0.0%) | 71 (20.5%) |
| 90 or more Minutes | 5 (2.9%) | 22 (6.4%) |
Time of Departure to Work by Sex in Durant
The most frequent times of departure to work in Durant are 4:00 PM to 11:59 PM (65, 37.4%) for males and 6:30 AM to 6:59 AM (67, 19.4%) for females.
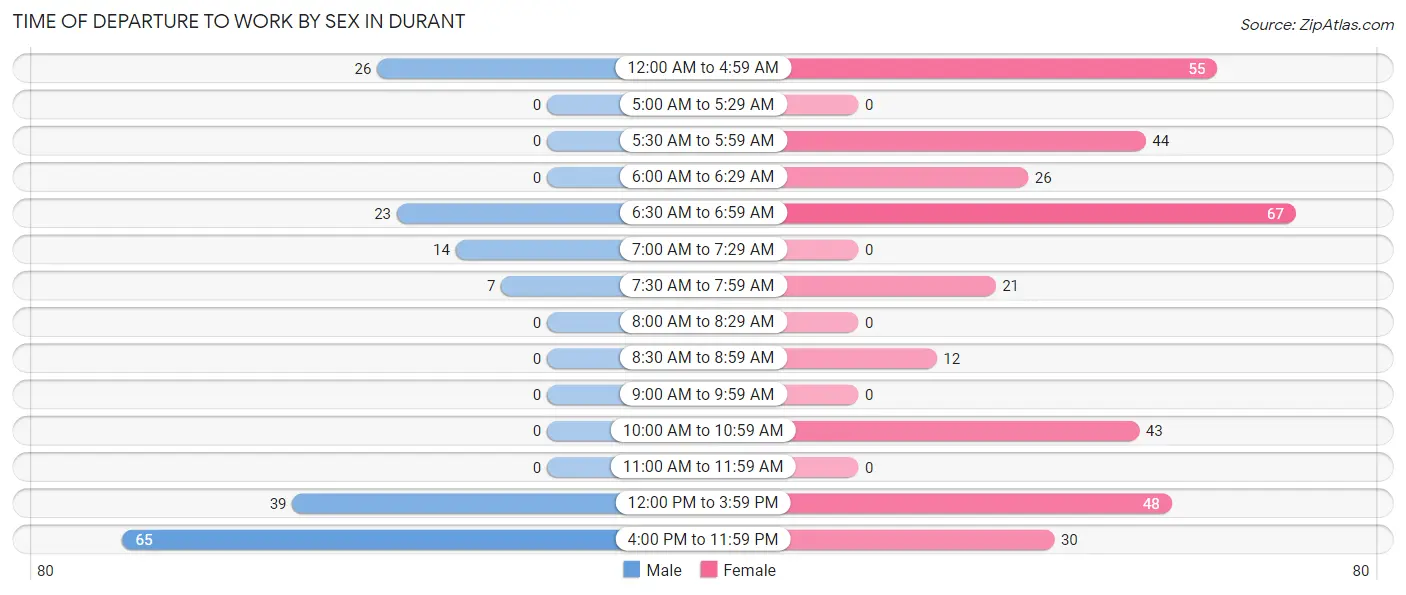
| Time of Departure | Male | Female |
| 12:00 AM to 4:59 AM | 26 (14.9%) | 55 (15.9%) |
| 5:00 AM to 5:29 AM | 0 (0.0%) | 0 (0.0%) |
| 5:30 AM to 5:59 AM | 0 (0.0%) | 44 (12.7%) |
| 6:00 AM to 6:29 AM | 0 (0.0%) | 26 (7.5%) |
| 6:30 AM to 6:59 AM | 23 (13.2%) | 67 (19.4%) |
| 7:00 AM to 7:29 AM | 14 (8.1%) | 0 (0.0%) |
| 7:30 AM to 7:59 AM | 7 (4.0%) | 21 (6.1%) |
| 8:00 AM to 8:29 AM | 0 (0.0%) | 0 (0.0%) |
| 8:30 AM to 8:59 AM | 0 (0.0%) | 12 (3.5%) |
| 9:00 AM to 9:59 AM | 0 (0.0%) | 0 (0.0%) |
| 10:00 AM to 10:59 AM | 0 (0.0%) | 43 (12.4%) |
| 11:00 AM to 11:59 AM | 0 (0.0%) | 0 (0.0%) |
| 12:00 PM to 3:59 PM | 39 (22.4%) | 48 (13.9%) |
| 4:00 PM to 11:59 PM | 65 (37.4%) | 30 (8.7%) |
| Total | 174 (100.0%) | 346 (100.0%) |
Housing Occupancy in Durant
Occupancy by Ownership in Durant
Of the total 813 dwellings in Durant, owner-occupied units account for 463 (57.0%), while renter-occupied units make up 350 (43.0%).
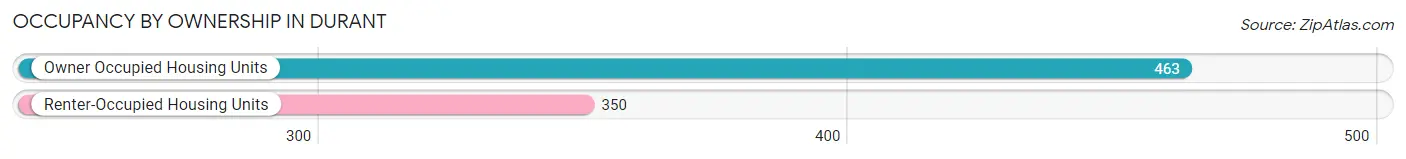
| Occupancy | # Housing Units | % Housing Units |
| Owner Occupied Housing Units | 463 | 57.0% |
| Renter-Occupied Housing Units | 350 | 43.0% |
| Total Occupied Housing Units | 813 | 100.0% |
Occupancy by Household Size in Durant
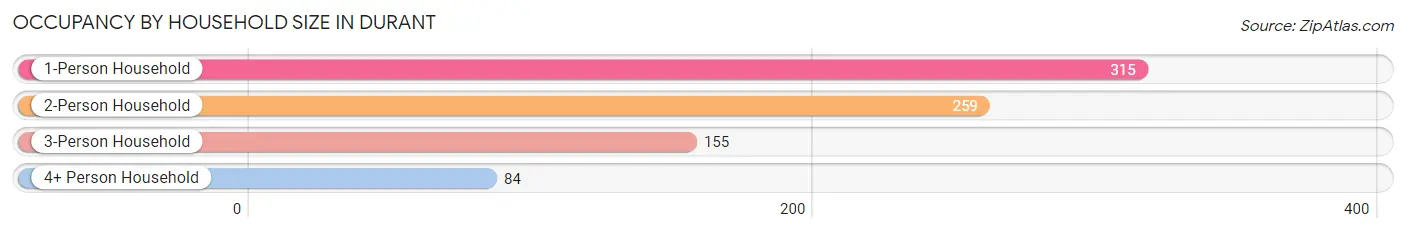
| Household Size | # Housing Units | % Housing Units |
| 1-Person Household | 315 | 38.8% |
| 2-Person Household | 259 | 31.9% |
| 3-Person Household | 155 | 19.1% |
| 4+ Person Household | 84 | 10.3% |
| Total Housing Units | 813 | 100.0% |
Occupancy by Ownership by Household Size in Durant
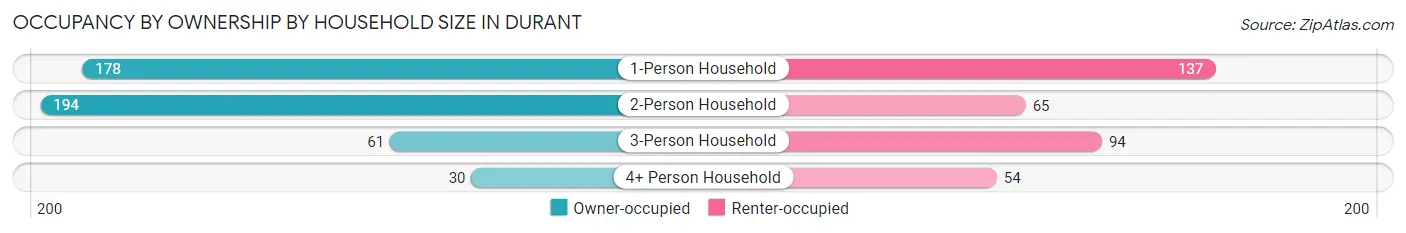
| Household Size | Owner-occupied | Renter-occupied |
| 1-Person Household | 178 (56.5%) | 137 (43.5%) |
| 2-Person Household | 194 (74.9%) | 65 (25.1%) |
| 3-Person Household | 61 (39.4%) | 94 (60.7%) |
| 4+ Person Household | 30 (35.7%) | 54 (64.3%) |
| Total Housing Units | 463 (57.0%) | 350 (43.0%) |
Occupancy by Educational Attainment in Durant
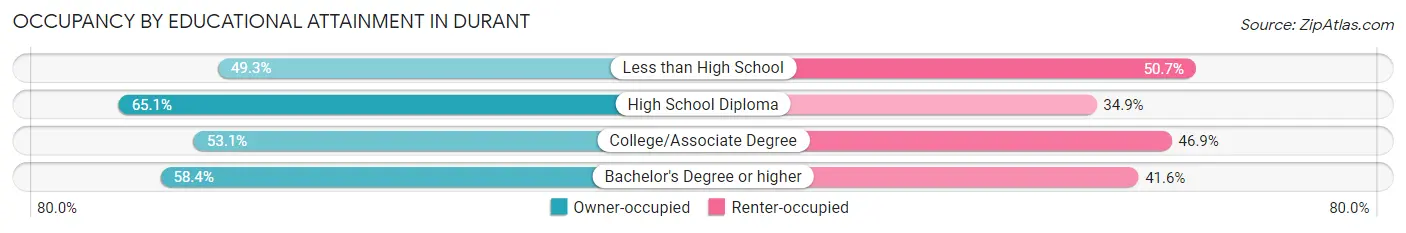
| Household Size | Owner-occupied | Renter-occupied |
| Less than High School | 72 (49.3%) | 74 (50.7%) |
| High School Diploma | 177 (65.1%) | 95 (34.9%) |
| College/Associate Degree | 169 (53.1%) | 149 (46.9%) |
| Bachelor's Degree or higher | 45 (58.4%) | 32 (41.6%) |
Occupancy by Age of Householder in Durant
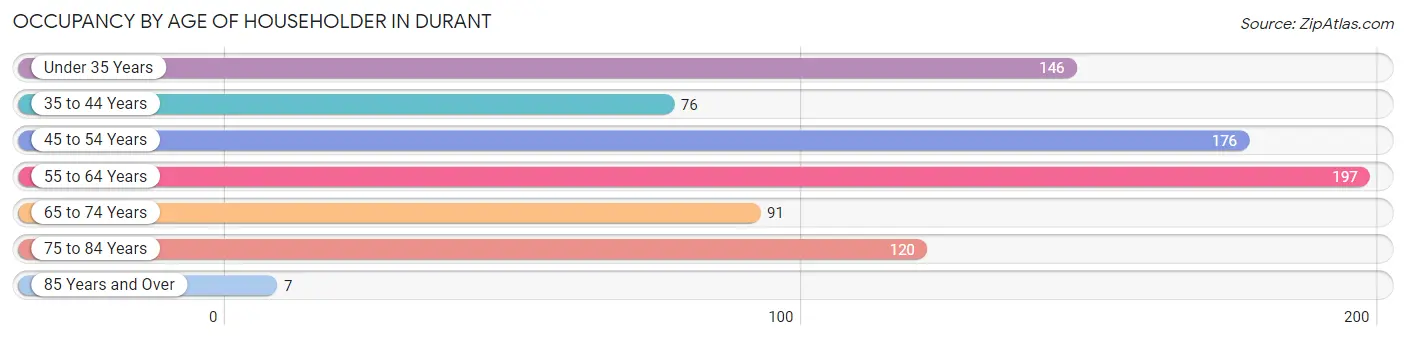
| Age Bracket | # Households | % Households |
| Under 35 Years | 146 | 18.0% |
| 35 to 44 Years | 76 | 9.3% |
| 45 to 54 Years | 176 | 21.6% |
| 55 to 64 Years | 197 | 24.2% |
| 65 to 74 Years | 91 | 11.2% |
| 75 to 84 Years | 120 | 14.8% |
| 85 Years and Over | 7 | 0.9% |
| Total | 813 | 100.0% |
Housing Finances in Durant
Median Income by Occupancy in Durant
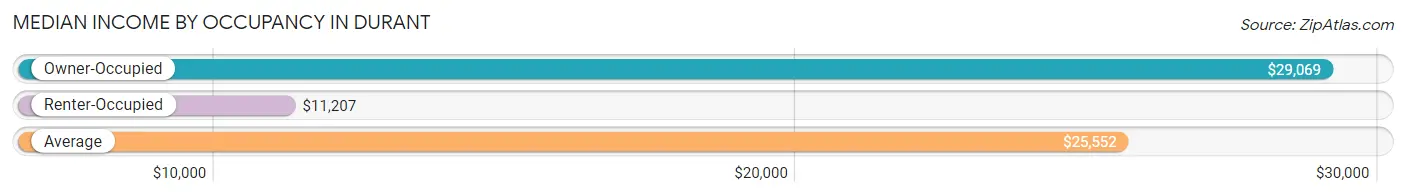
| Occupancy Type | # Households | Median Income |
| Owner-Occupied | 463 (57.0%) | $29,069 |
| Renter-Occupied | 350 (43.0%) | $11,207 |
| Average | 813 (100.0%) | $25,552 |
Occupancy by Householder Income Bracket in Durant
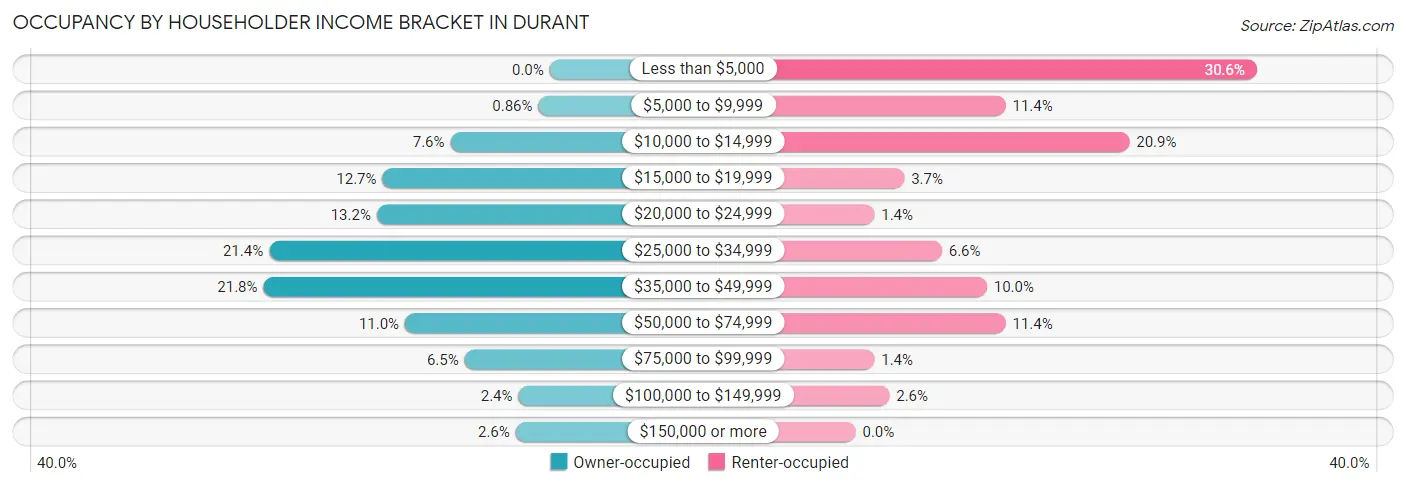
| Income Bracket | Owner-occupied | Renter-occupied |
| Less than $5,000 | 0 (0.0%) | 107 (30.6%) |
| $5,000 to $9,999 | 4 (0.9%) | 40 (11.4%) |
| $10,000 to $14,999 | 35 (7.6%) | 73 (20.9%) |
| $15,000 to $19,999 | 59 (12.7%) | 13 (3.7%) |
| $20,000 to $24,999 | 61 (13.2%) | 5 (1.4%) |
| $25,000 to $34,999 | 99 (21.4%) | 23 (6.6%) |
| $35,000 to $49,999 | 101 (21.8%) | 35 (10.0%) |
| $50,000 to $74,999 | 51 (11.0%) | 40 (11.4%) |
| $75,000 to $99,999 | 30 (6.5%) | 5 (1.4%) |
| $100,000 to $149,999 | 11 (2.4%) | 9 (2.6%) |
| $150,000 or more | 12 (2.6%) | 0 (0.0%) |
| Total | 463 (100.0%) | 350 (100.0%) |
Monthly Housing Cost Tiers in Durant
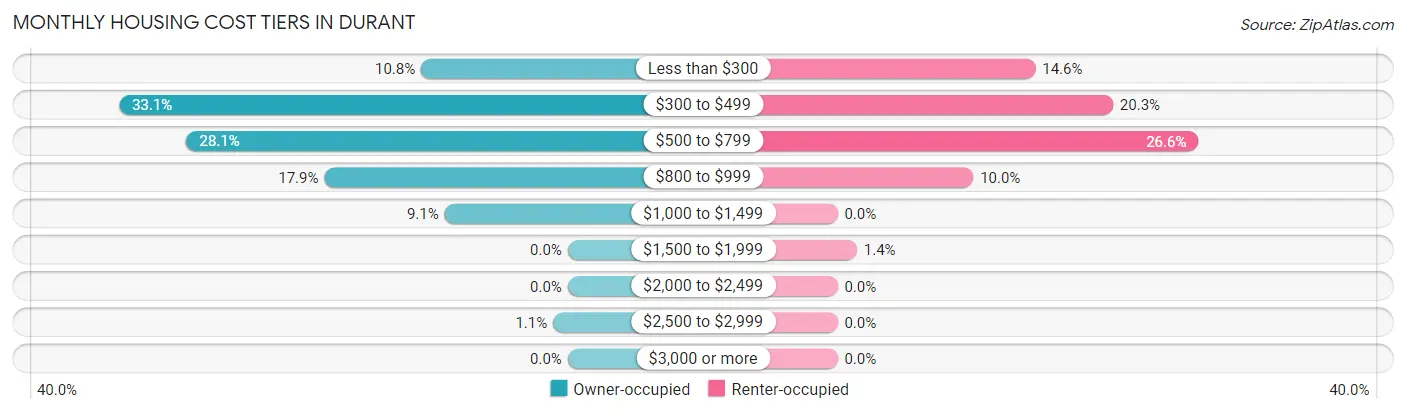
| Monthly Cost | Owner-occupied | Renter-occupied |
| Less than $300 | 50 (10.8%) | 51 (14.6%) |
| $300 to $499 | 153 (33.1%) | 71 (20.3%) |
| $500 to $799 | 130 (28.1%) | 93 (26.6%) |
| $800 to $999 | 83 (17.9%) | 35 (10.0%) |
| $1,000 to $1,499 | 42 (9.1%) | 0 (0.0%) |
| $1,500 to $1,999 | 0 (0.0%) | 5 (1.4%) |
| $2,000 to $2,499 | 0 (0.0%) | 0 (0.0%) |
| $2,500 to $2,999 | 5 (1.1%) | 0 (0.0%) |
| $3,000 or more | 0 (0.0%) | 0 (0.0%) |
| Total | 463 (100.0%) | 350 (100.0%) |
Physical Housing Characteristics in Durant
Housing Structures in Durant
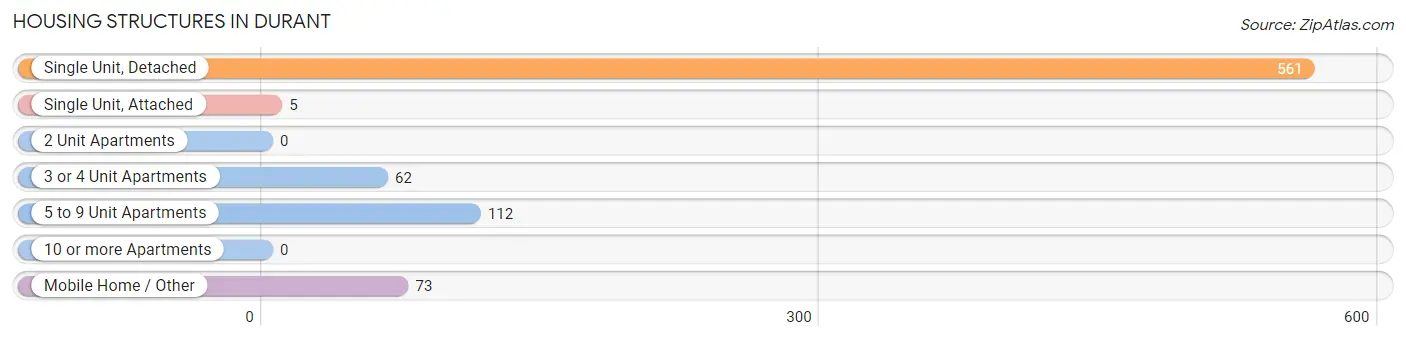
| Structure Type | # Housing Units | % Housing Units |
| Single Unit, Detached | 561 | 69.0% |
| Single Unit, Attached | 5 | 0.6% |
| 2 Unit Apartments | 0 | 0.0% |
| 3 or 4 Unit Apartments | 62 | 7.6% |
| 5 to 9 Unit Apartments | 112 | 13.8% |
| 10 or more Apartments | 0 | 0.0% |
| Mobile Home / Other | 73 | 9.0% |
| Total | 813 | 100.0% |
Housing Structures by Occupancy in Durant
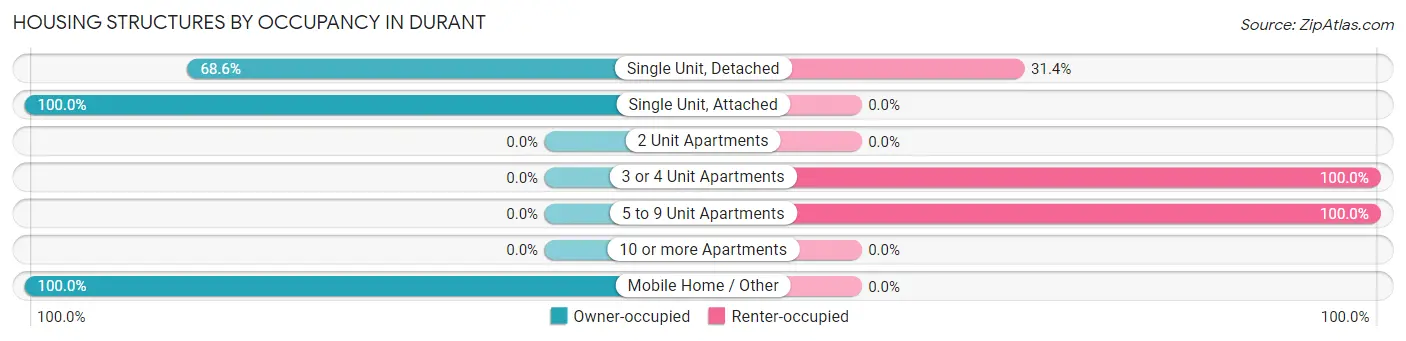
| Structure Type | Owner-occupied | Renter-occupied |
| Single Unit, Detached | 385 (68.6%) | 176 (31.4%) |
| Single Unit, Attached | 5 (100.0%) | 0 (0.0%) |
| 2 Unit Apartments | 0 (0.0%) | 0 (0.0%) |
| 3 or 4 Unit Apartments | 0 (0.0%) | 62 (100.0%) |
| 5 to 9 Unit Apartments | 0 (0.0%) | 112 (100.0%) |
| 10 or more Apartments | 0 (0.0%) | 0 (0.0%) |
| Mobile Home / Other | 73 (100.0%) | 0 (0.0%) |
| Total | 463 (57.0%) | 350 (43.0%) |
Housing Structures by Number of Rooms in Durant
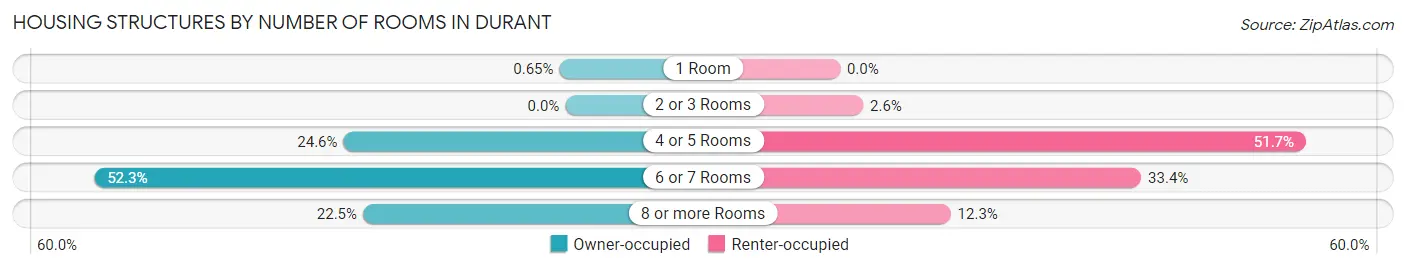
| Number of Rooms | Owner-occupied | Renter-occupied |
| 1 Room | 3 (0.6%) | 0 (0.0%) |
| 2 or 3 Rooms | 0 (0.0%) | 9 (2.6%) |
| 4 or 5 Rooms | 114 (24.6%) | 181 (51.7%) |
| 6 or 7 Rooms | 242 (52.3%) | 117 (33.4%) |
| 8 or more Rooms | 104 (22.5%) | 43 (12.3%) |
| Total | 463 (100.0%) | 350 (100.0%) |
Housing Structure by Heating Type in Durant
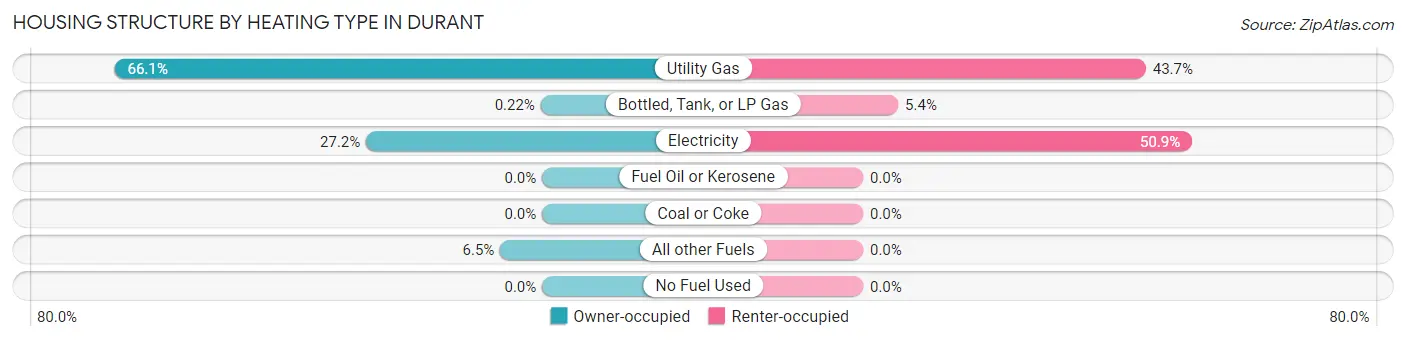
| Heating Type | Owner-occupied | Renter-occupied |
| Utility Gas | 306 (66.1%) | 153 (43.7%) |
| Bottled, Tank, or LP Gas | 1 (0.2%) | 19 (5.4%) |
| Electricity | 126 (27.2%) | 178 (50.9%) |
| Fuel Oil or Kerosene | 0 (0.0%) | 0 (0.0%) |
| Coal or Coke | 0 (0.0%) | 0 (0.0%) |
| All other Fuels | 30 (6.5%) | 0 (0.0%) |
| No Fuel Used | 0 (0.0%) | 0 (0.0%) |
| Total | 463 (100.0%) | 350 (100.0%) |
Household Vehicle Usage in Durant
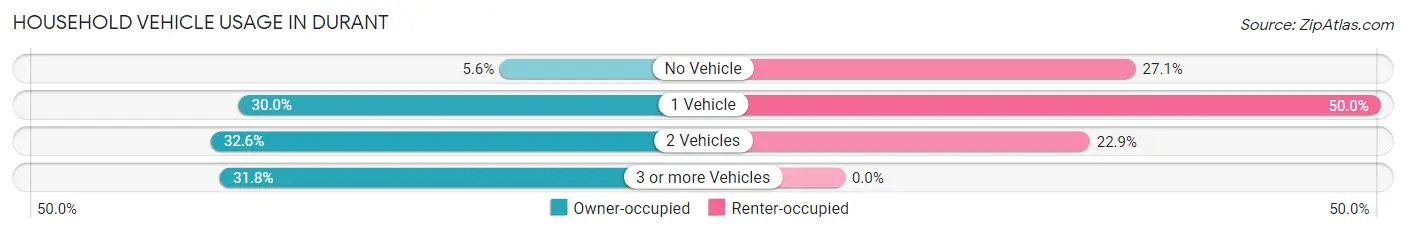
| Vehicles per Household | Owner-occupied | Renter-occupied |
| No Vehicle | 26 (5.6%) | 95 (27.1%) |
| 1 Vehicle | 139 (30.0%) | 175 (50.0%) |
| 2 Vehicles | 151 (32.6%) | 80 (22.9%) |
| 3 or more Vehicles | 147 (31.8%) | 0 (0.0%) |
| Total | 463 (100.0%) | 350 (100.0%) |
Real Estate & Mortgages in Durant
Real Estate and Mortgage Overview in Durant
| Characteristic | Without Mortgage | With Mortgage |
| Housing Units | 256 | 207 |
| Median Property Value | $53,100 | $57,900 |
| Median Household Income | $43,000 | $7 |
| Monthly Housing Costs | $355 | $0 |
| Real Estate Taxes | $541 | $118 |
Property Value by Mortgage Status in Durant
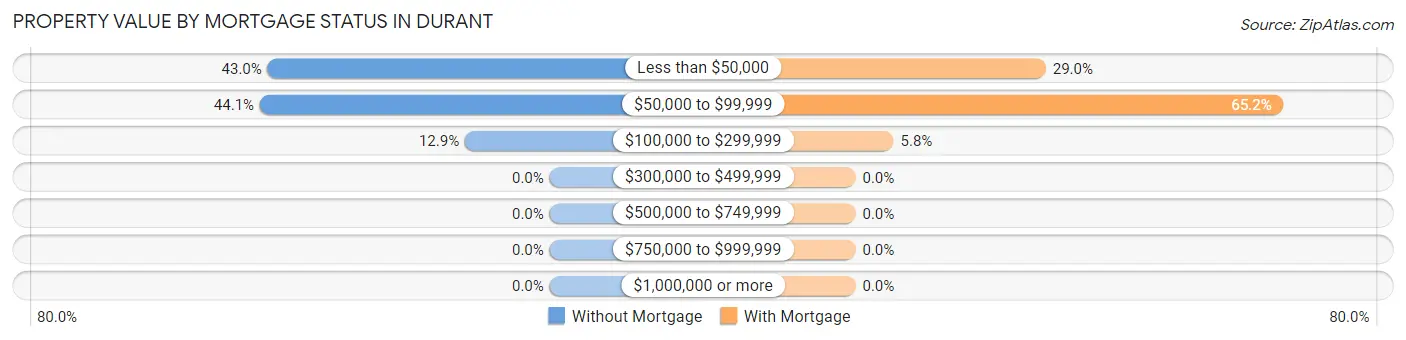
| Property Value | Without Mortgage | With Mortgage |
| Less than $50,000 | 110 (43.0%) | 60 (29.0%) |
| $50,000 to $99,999 | 113 (44.1%) | 135 (65.2%) |
| $100,000 to $299,999 | 33 (12.9%) | 12 (5.8%) |
| $300,000 to $499,999 | 0 (0.0%) | 0 (0.0%) |
| $500,000 to $749,999 | 0 (0.0%) | 0 (0.0%) |
| $750,000 to $999,999 | 0 (0.0%) | 0 (0.0%) |
| $1,000,000 or more | 0 (0.0%) | 0 (0.0%) |
| Total | 256 (100.0%) | 207 (100.0%) |
Household Income by Mortgage Status in Durant
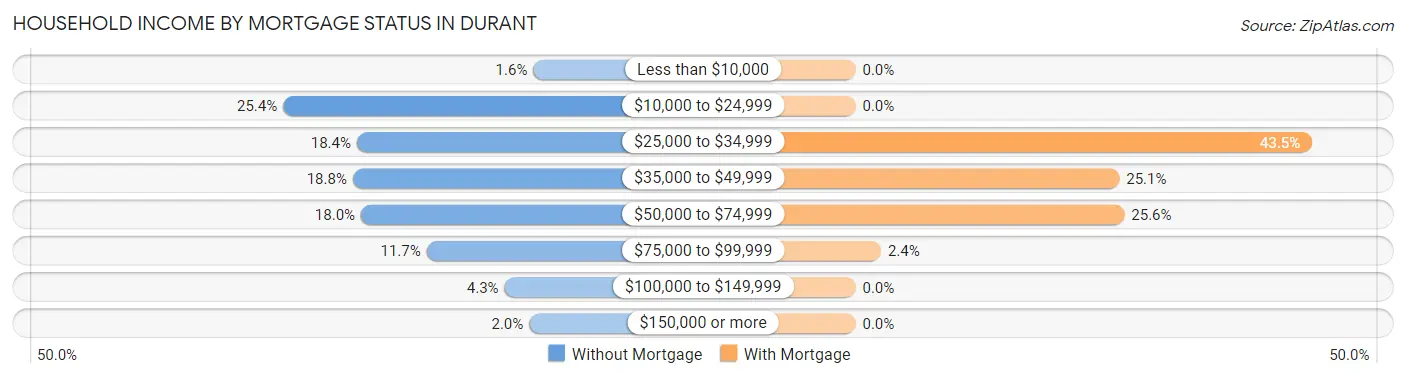
| Household Income | Without Mortgage | With Mortgage |
| Less than $10,000 | 4 (1.6%) | 0 (0.0%) |
| $10,000 to $24,999 | 65 (25.4%) | 0 (0.0%) |
| $25,000 to $34,999 | 47 (18.4%) | 90 (43.5%) |
| $35,000 to $49,999 | 48 (18.8%) | 52 (25.1%) |
| $50,000 to $74,999 | 46 (18.0%) | 53 (25.6%) |
| $75,000 to $99,999 | 30 (11.7%) | 5 (2.4%) |
| $100,000 to $149,999 | 11 (4.3%) | 0 (0.0%) |
| $150,000 or more | 5 (1.9%) | 0 (0.0%) |
| Total | 256 (100.0%) | 207 (100.0%) |
Property Value to Household Income Ratio in Durant
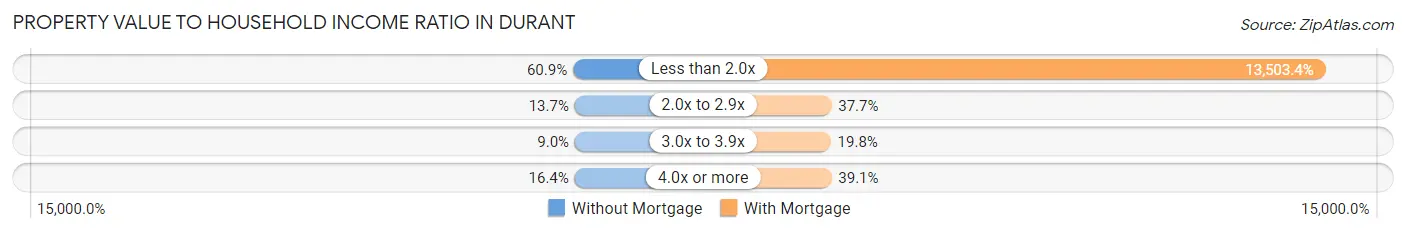
| Value-to-Income Ratio | Without Mortgage | With Mortgage |
| Less than 2.0x | 156 (60.9%) | 27,952 (13,503.4%) |
| 2.0x to 2.9x | 35 (13.7%) | 78 (37.7%) |
| 3.0x to 3.9x | 23 (9.0%) | 41 (19.8%) |
| 4.0x or more | 42 (16.4%) | 81 (39.1%) |
| Total | 256 (100.0%) | 207 (100.0%) |
Real Estate Taxes by Mortgage Status in Durant
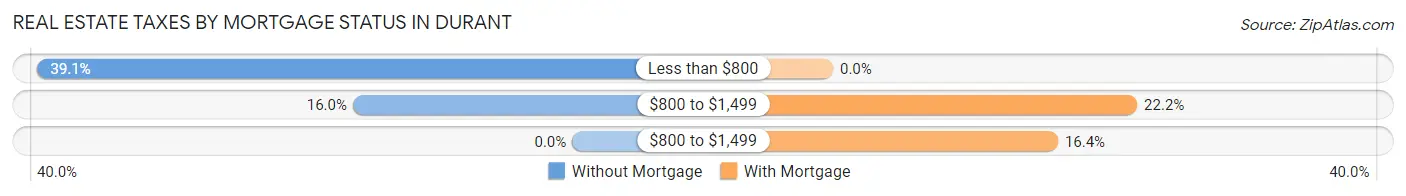
| Property Taxes | Without Mortgage | With Mortgage |
| Less than $800 | 100 (39.1%) | 0 (0.0%) |
| $800 to $1,499 | 41 (16.0%) | 46 (22.2%) |
| $800 to $1,499 | 0 (0.0%) | 34 (16.4%) |
| Total | 256 (100.0%) | 207 (100.0%) |
Health & Disability in Durant
Health Insurance Coverage by Age in Durant
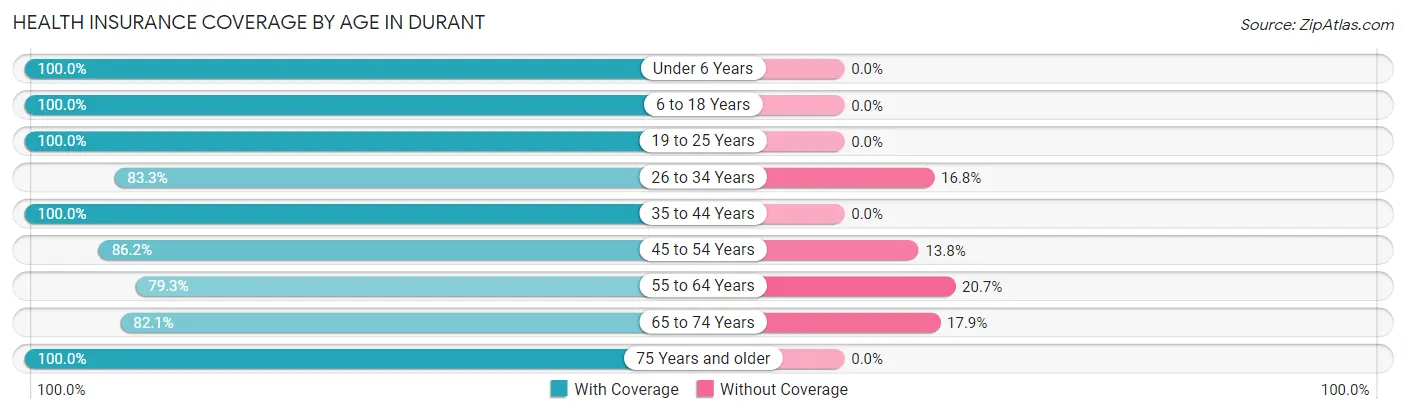
| Age Bracket | With Coverage | Without Coverage |
| Under 6 Years | 178 (100.0%) | 0 (0.0%) |
| 6 to 18 Years | 488 (100.0%) | 0 (0.0%) |
| 19 to 25 Years | 107 (100.0%) | 0 (0.0%) |
| 26 to 34 Years | 174 (83.3%) | 35 (16.8%) |
| 35 to 44 Years | 110 (100.0%) | 0 (0.0%) |
| 45 to 54 Years | 243 (86.2%) | 39 (13.8%) |
| 55 to 64 Years | 265 (79.3%) | 69 (20.7%) |
| 65 to 74 Years | 170 (82.1%) | 37 (17.9%) |
| 75 Years and older | 141 (100.0%) | 0 (0.0%) |
| Total | 1,876 (91.2%) | 180 (8.7%) |
Health Insurance Coverage by Citizenship Status in Durant
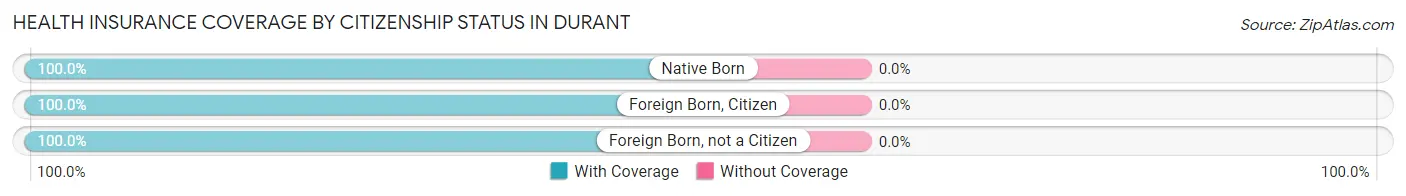
| Citizenship Status | With Coverage | Without Coverage |
| Native Born | 178 (100.0%) | 0 (0.0%) |
| Foreign Born, Citizen | 488 (100.0%) | 0 (0.0%) |
| Foreign Born, not a Citizen | 107 (100.0%) | 0 (0.0%) |
Health Insurance Coverage by Household Income in Durant
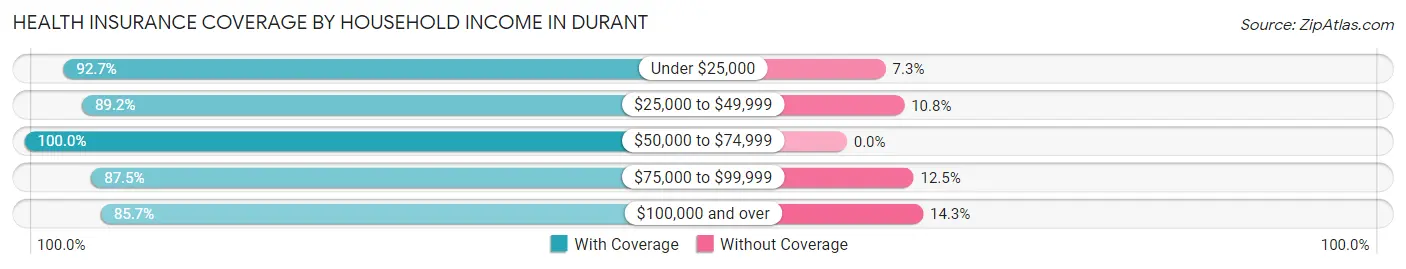
| Household Income | With Coverage | Without Coverage |
| Under $25,000 | 700 (92.7%) | 55 (7.3%) |
| $25,000 to $49,999 | 796 (89.2%) | 96 (10.8%) |
| $50,000 to $74,999 | 186 (100.0%) | 0 (0.0%) |
| $75,000 to $99,999 | 140 (87.5%) | 20 (12.5%) |
| $100,000 and over | 54 (85.7%) | 9 (14.3%) |
Public vs Private Health Insurance Coverage by Age in Durant
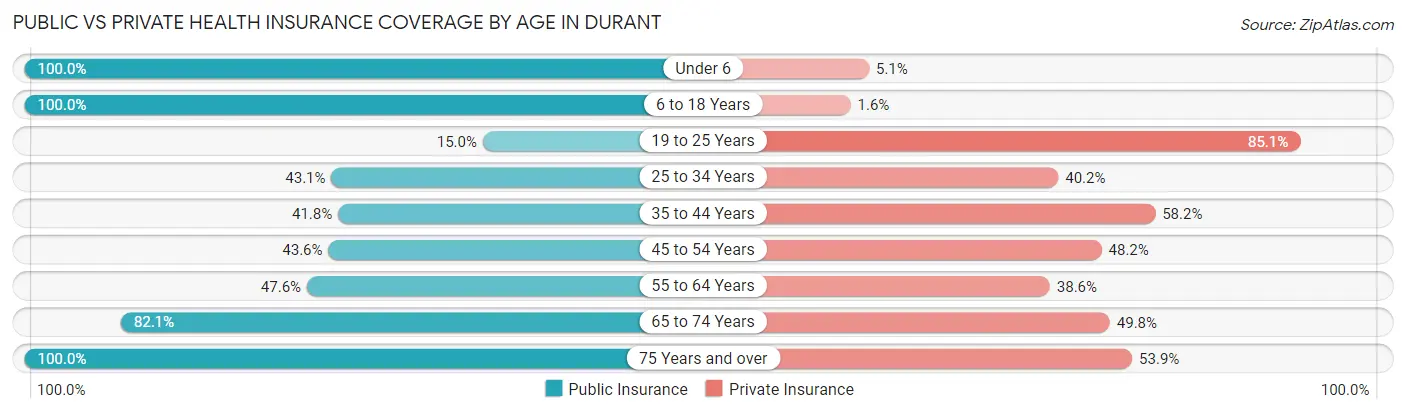
| Age Bracket | Public Insurance | Private Insurance |
| Under 6 | 178 (100.0%) | 9 (5.1%) |
| 6 to 18 Years | 488 (100.0%) | 8 (1.6%) |
| 19 to 25 Years | 16 (14.9%) | 91 (85.1%) |
| 25 to 34 Years | 90 (43.1%) | 84 (40.2%) |
| 35 to 44 Years | 46 (41.8%) | 64 (58.2%) |
| 45 to 54 Years | 123 (43.6%) | 136 (48.2%) |
| 55 to 64 Years | 159 (47.6%) | 129 (38.6%) |
| 65 to 74 Years | 170 (82.1%) | 103 (49.8%) |
| 75 Years and over | 141 (100.0%) | 76 (53.9%) |
| Total | 1,411 (68.6%) | 700 (34.1%) |
Disability Status by Sex by Age in Durant
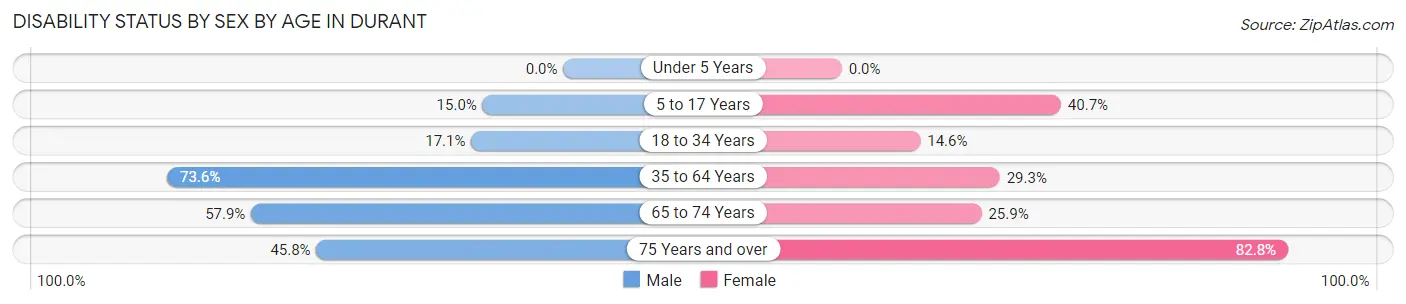
| Age Bracket | Male | Female |
| Under 5 Years | 0 (0.0%) | 0 (0.0%) |
| 5 to 17 Years | 43 (15.0%) | 85 (40.7%) |
| 18 to 34 Years | 20 (17.1%) | 29 (14.6%) |
| 35 to 64 Years | 253 (73.6%) | 112 (29.3%) |
| 65 to 74 Years | 73 (57.9%) | 21 (25.9%) |
| 75 Years and over | 22 (45.8%) | 77 (82.8%) |
Disability Class by Sex by Age in Durant
Disability Class: Hearing Difficulty
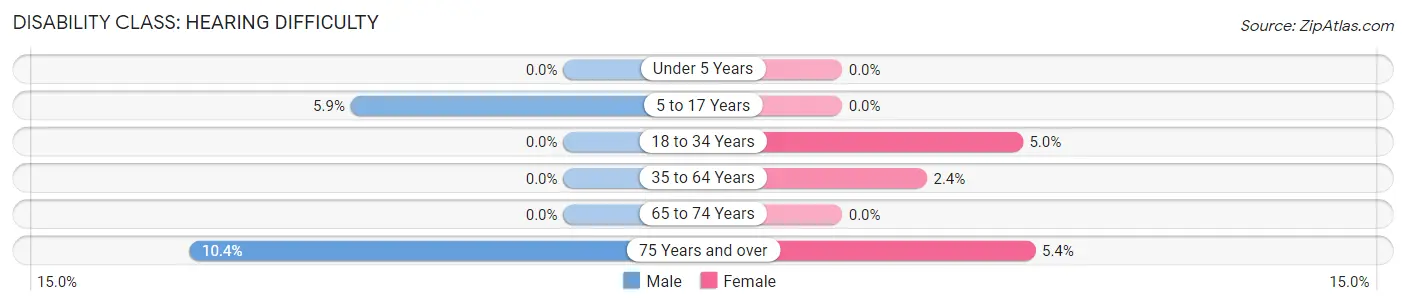
| Age Bracket | Male | Female |
| Under 5 Years | 0 (0.0%) | 0 (0.0%) |
| 5 to 17 Years | 17 (5.9%) | 0 (0.0%) |
| 18 to 34 Years | 0 (0.0%) | 10 (5.0%) |
| 35 to 64 Years | 0 (0.0%) | 9 (2.4%) |
| 65 to 74 Years | 0 (0.0%) | 0 (0.0%) |
| 75 Years and over | 5 (10.4%) | 5 (5.4%) |
Disability Class: Vision Difficulty
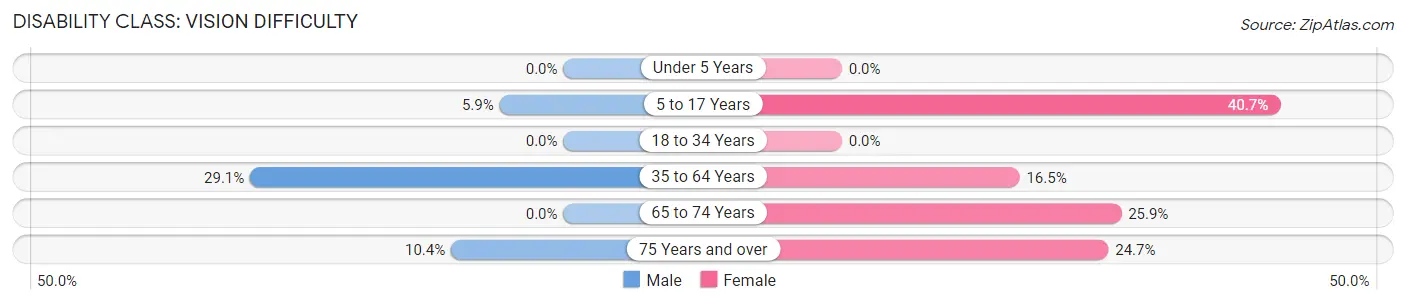
| Age Bracket | Male | Female |
| Under 5 Years | 0 (0.0%) | 0 (0.0%) |
| 5 to 17 Years | 17 (5.9%) | 85 (40.7%) |
| 18 to 34 Years | 0 (0.0%) | 0 (0.0%) |
| 35 to 64 Years | 100 (29.1%) | 63 (16.5%) |
| 65 to 74 Years | 0 (0.0%) | 21 (25.9%) |
| 75 Years and over | 5 (10.4%) | 23 (24.7%) |
Disability Class: Cognitive Difficulty
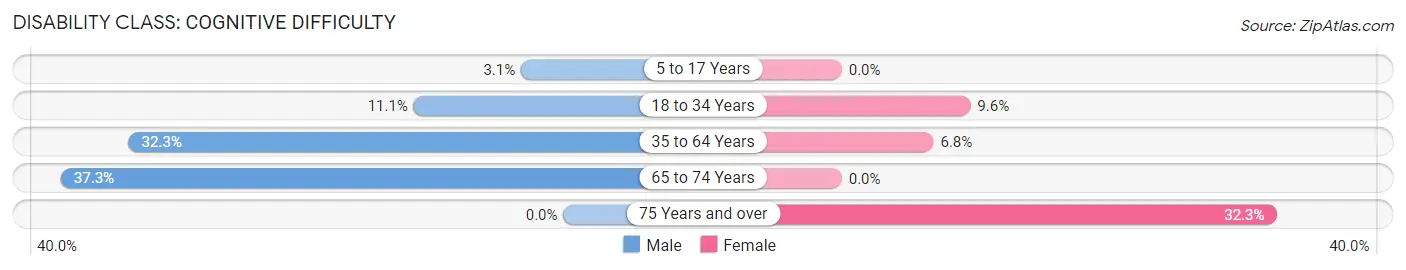
| Age Bracket | Male | Female |
| 5 to 17 Years | 9 (3.1%) | 0 (0.0%) |
| 18 to 34 Years | 13 (11.1%) | 19 (9.6%) |
| 35 to 64 Years | 111 (32.3%) | 26 (6.8%) |
| 65 to 74 Years | 47 (37.3%) | 0 (0.0%) |
| 75 Years and over | 0 (0.0%) | 30 (32.3%) |
Disability Class: Ambulatory Difficulty
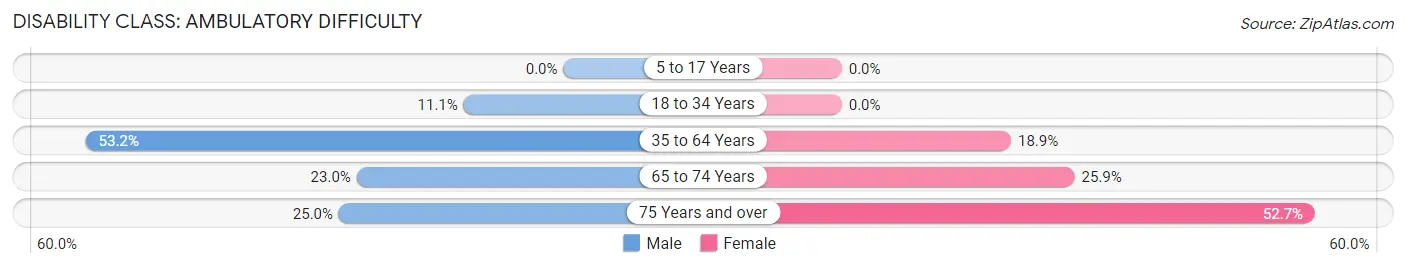
| Age Bracket | Male | Female |
| 5 to 17 Years | 0 (0.0%) | 0 (0.0%) |
| 18 to 34 Years | 13 (11.1%) | 0 (0.0%) |
| 35 to 64 Years | 183 (53.2%) | 72 (18.9%) |
| 65 to 74 Years | 29 (23.0%) | 21 (25.9%) |
| 75 Years and over | 12 (25.0%) | 49 (52.7%) |
Disability Class: Self-Care Difficulty
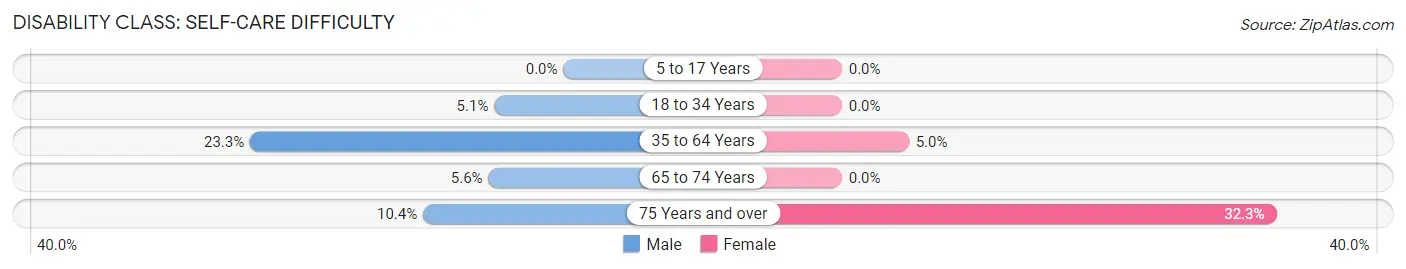
| Age Bracket | Male | Female |
| 5 to 17 Years | 0 (0.0%) | 0 (0.0%) |
| 18 to 34 Years | 6 (5.1%) | 0 (0.0%) |
| 35 to 64 Years | 80 (23.3%) | 19 (5.0%) |
| 65 to 74 Years | 7 (5.6%) | 0 (0.0%) |
| 75 Years and over | 5 (10.4%) | 30 (32.3%) |
Technology Access in Durant
Computing Device Access in Durant
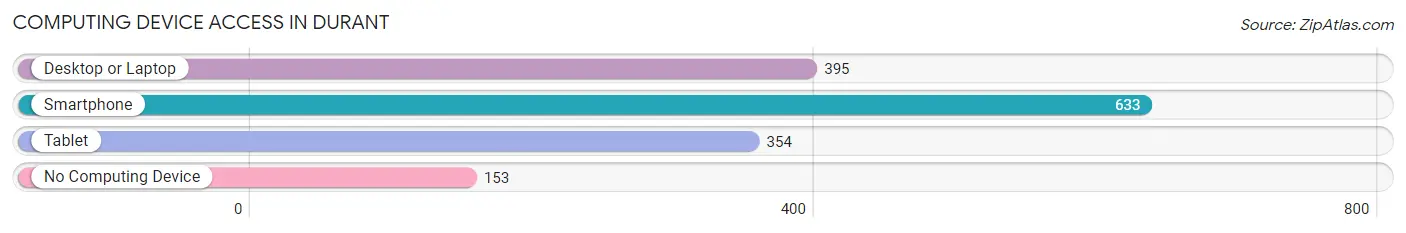
| Device Type | # Households | % Households |
| Desktop or Laptop | 395 | 48.6% |
| Smartphone | 633 | 77.9% |
| Tablet | 354 | 43.5% |
| No Computing Device | 153 | 18.8% |
| Total | 813 | 100.0% |
Internet Access in Durant
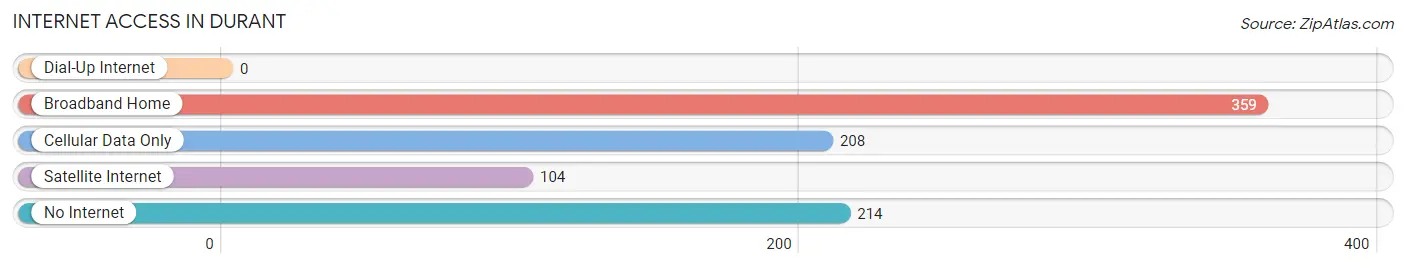
| Internet Type | # Households | % Households |
| Dial-Up Internet | 0 | 0.0% |
| Broadband Home | 359 | 44.2% |
| Cellular Data Only | 208 | 25.6% |
| Satellite Internet | 104 | 12.8% |
| No Internet | 214 | 26.3% |
| Total | 813 | 100.0% |
Durant Summary
Durant is a city located in Holmes County, Mississippi. It is the county seat of Holmes County and is located in the heart of the Mississippi Delta. The city has a population of 2,845 as of the 2010 census.
History
Durant was founded in 1871 by the Holmes County Board of Supervisors. The city was named after William Durant, a prominent local landowner. The city was incorporated in 1873 and was the first incorporated city in Holmes County.
Durant was a major center of activity during the Civil War. The city was the site of a major battle in 1863, when Union forces under General Ulysses S. Grant defeated Confederate forces under General John C. Pemberton. The city was also the site of a major skirmish in 1864, when Confederate forces under General Nathan Bedford Forrest attacked Union forces under General Stephen A. Hurlbut.
Geography
Durant is located in the heart of the Mississippi Delta, in the northwest corner of Holmes County. The city is situated at the intersection of U.S. Route 51 and Mississippi Highway 12. The city is located approximately 25 miles south of Greenwood, Mississippi, and approximately 50 miles north of Jackson, Mississippi.
The city is located in a flat, low-lying area, with an elevation of approximately 200 feet above sea level. The city is located in the Yazoo-Mississippi Delta, which is characterized by flat, fertile land and numerous rivers and streams. The city is located near the Yazoo River, which is a major tributary of the Mississippi River.
Economy
Durant is a small, rural city with a largely agricultural economy. The city is home to several small businesses, including a grocery store, a hardware store, and a few restaurants. The city is also home to several manufacturing companies, including a furniture factory and a woodworking plant.
The city is also home to several agricultural businesses, including a cotton gin, a grain elevator, and a feed mill. The city is also home to several farms, which produce cotton, soybeans, corn, and other crops.
Demographics
As of the 2010 census, Durant had a population of 2,845. The racial makeup of the city was 79.3% African American, 19.2% White, 0.3% Native American, 0.2% Asian, and 0.9% from other races. The median household income was $20,938, and the median family income was $25,938.
The city is served by the Holmes County School District, which includes two elementary schools, one middle school, and one high school. The city is also home to a branch of the Holmes Community College.
Conclusion
Durant is a small, rural city located in the heart of the Mississippi Delta. The city has a long and rich history, and is home to a largely agricultural economy. The city has a population of 2,845, and is served by the Holmes County School District. Durant is a unique and vibrant city, and is a great place to live and work.
Common Questions
What is the Total Population of Durant?
Total Population of Durant is 2,133.
What is the Total Male Population of Durant?
Total Male Population of Durant is 1,042.
What is the Total Female Population of Durant?
Total Female Population of Durant is 1,091.
What is the Ratio of Males per 100 Females in Durant?
There are 95.51 Males per 100 Females in Durant.
What is the Ratio of Females per 100 Males in Durant?
There are 104.70 Females per 100 Males in Durant.
What is the Median Population Age in Durant?
Median Population Age in Durant is 42.2 Years.
What is the Average Family Size in Durant
Average Family Size in Durant is 3.6 People.
What is the Average Household Size in Durant
Average Household Size in Durant is 2.5 People.
What is Per Capita Income in Durant?
Per Capita income in Durant is $18,139.
What is the Median Family Income in Durant?
Median Family Income in Durant is $29,115.
What is the Median Household income in Durant?
Median Household Income in Durant is $25,552.
What is Income or Wage Gap in Durant?
Income or Wage Gap in Durant is 15.0%.
Women in Durant earn 85.0 cents for every dollar earned by a man.
What is Inequality or Gini Index in Durant?
Inequality or Gini Index in Durant is 0.55.
How Large is the Labor Force in Durant?
There are 627 People in the Labor Forcein in Durant.
What is the Percentage of People in the Labor Force in Durant?
41.3% of People are in the Labor Force in Durant.
What is the Unemployment Rate in Durant?
Unemployment Rate in Durant is 10.0%.