Derma, MS
Derma Map

Derma Overview
819
TOTAL POPULATION
427
MALE POPULATION
392
FEMALE POPULATION
108.93
MALES / 100 FEMALES
91.80
FEMALES / 100 MALES
38.9
MEDIAN AGE
3.3
AVG FAMILY SIZE
2.5
AVG HOUSEHOLD SIZE
$19,022
PER CAPITA INCOME
$50,677
AVG FAMILY INCOME
$41,250
AVG HOUSEHOLD INCOME
34.2%
WAGE / INCOME GAP [ % ]
65.8¢/ $1
WAGE / INCOME GAP [ $ ]
$12,880
FAMILY INCOME DEFICIT
0.38
INEQUALITY / GINI INDEX
351
LABOR FORCE [ PEOPLE ]
55.1%
PERCENT IN LABOR FORCE
7.4%
UNEMPLOYMENT RATE
Derma Zip Codes
Derma Area Codes
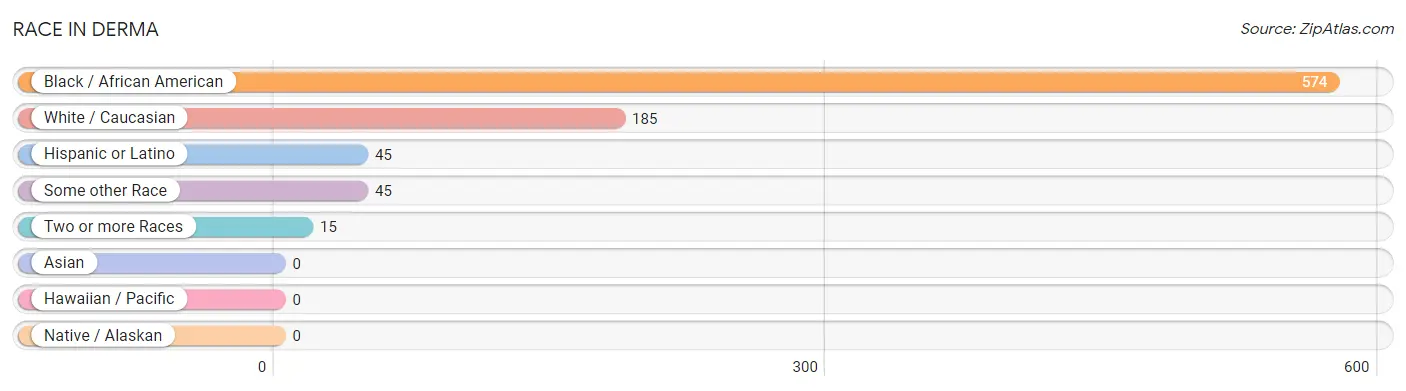
Race in Derma
The most populous races in Derma are Black / African American (574 | 70.1%), White / Caucasian (185 | 22.6%), and Hispanic or Latino (45 | 5.5%).
| Race | # Population | % Population |
| Asian | 0 | 0.0% |
| Black / African American | 574 | 70.1% |
| Hawaiian / Pacific | 0 | 0.0% |
| Hispanic or Latino | 45 | 5.5% |
| Native / Alaskan | 0 | 0.0% |
| White / Caucasian | 185 | 22.6% |
| Two or more Races | 15 | 1.8% |
| Some other Race | 45 | 5.5% |
| Total | 819 | 100.0% |
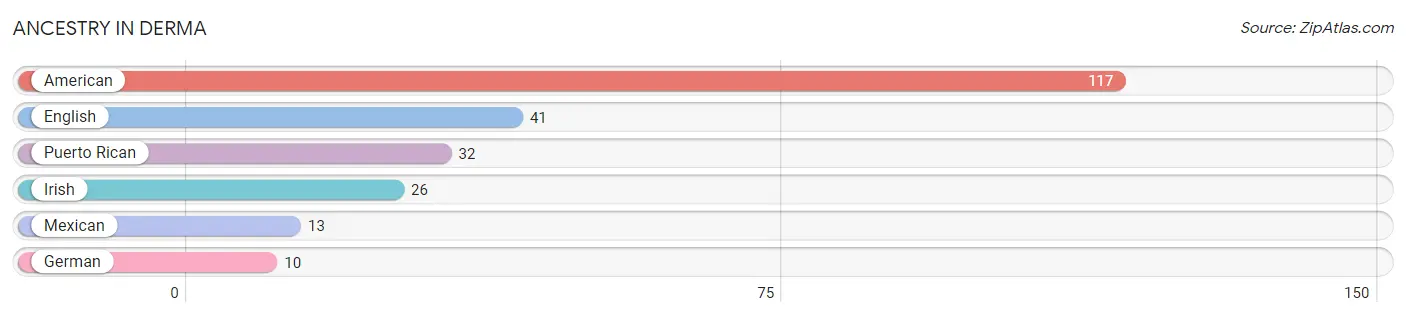
Ancestry in Derma
The most populous ancestries reported in Derma are American (117 | 14.3%), English (41 | 5.0%), Puerto Rican (32 | 3.9%), Irish (26 | 3.2%), and Mexican (13 | 1.6%), together accounting for 28.0% of all Derma residents.
| Ancestry | # Population | % Population |
| American | 117 | 14.3% |
| English | 41 | 5.0% |
| German | 10 | 1.2% |
| Irish | 26 | 3.2% |
| Mexican | 13 | 1.6% |
| Puerto Rican | 32 | 3.9% | View All 6 Rows |
Immigrants in Derma

| Immigration Origin | # Population | % Population | View All 0 Rows |
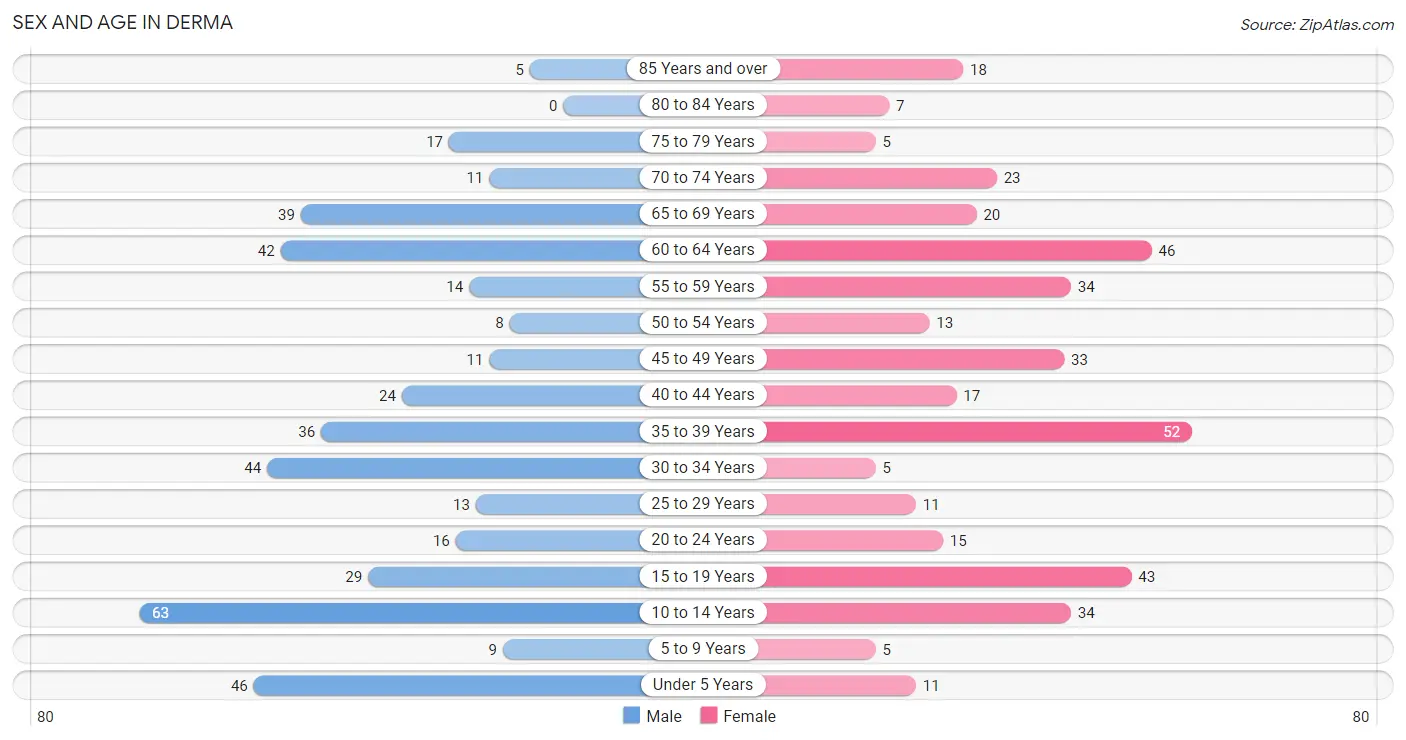
Sex and Age in Derma
Sex and Age in Derma
The most populous age groups in Derma are 10 to 14 Years (63 | 14.7%) for men and 35 to 39 Years (52 | 13.3%) for women.
| Age Bracket | Male | Female |
| Under 5 Years | 46 (10.8%) | 11 (2.8%) |
| 5 to 9 Years | 9 (2.1%) | 5 (1.3%) |
| 10 to 14 Years | 63 (14.7%) | 34 (8.7%) |
| 15 to 19 Years | 29 (6.8%) | 43 (11.0%) |
| 20 to 24 Years | 16 (3.7%) | 15 (3.8%) |
| 25 to 29 Years | 13 (3.0%) | 11 (2.8%) |
| 30 to 34 Years | 44 (10.3%) | 5 (1.3%) |
| 35 to 39 Years | 36 (8.4%) | 52 (13.3%) |
| 40 to 44 Years | 24 (5.6%) | 17 (4.3%) |
| 45 to 49 Years | 11 (2.6%) | 33 (8.4%) |
| 50 to 54 Years | 8 (1.9%) | 13 (3.3%) |
| 55 to 59 Years | 14 (3.3%) | 34 (8.7%) |
| 60 to 64 Years | 42 (9.8%) | 46 (11.7%) |
| 65 to 69 Years | 39 (9.1%) | 20 (5.1%) |
| 70 to 74 Years | 11 (2.6%) | 23 (5.9%) |
| 75 to 79 Years | 17 (4.0%) | 5 (1.3%) |
| 80 to 84 Years | 0 (0.0%) | 7 (1.8%) |
| 85 Years and over | 5 (1.2%) | 18 (4.6%) |
| Total | 427 (100.0%) | 392 (100.0%) |
Families and Households in Derma
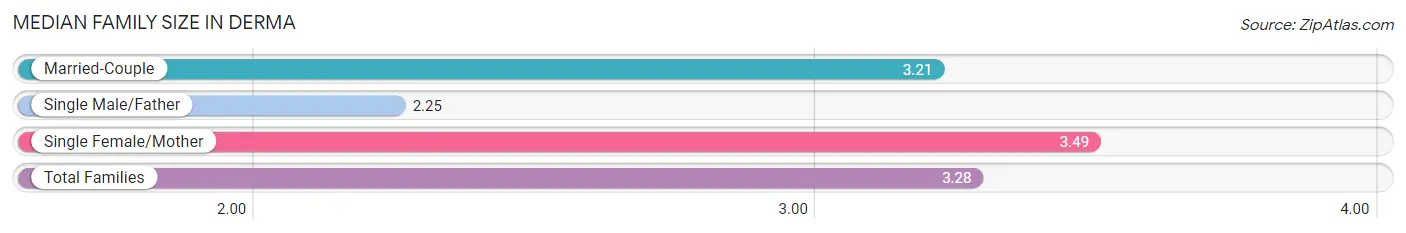
Median Family Size in Derma
The median family size in Derma is 3.28 persons per family, with single female/mother families (81 | 39.5%) accounting for the largest median family size of 3.49 persons per family. On the other hand, single male/father families (8 | 3.9%) represent the smallest median family size with 2.25 persons per family.
| Family Type | # Families | Family Size |
| Married-Couple | 116 (56.6%) | 3.21 |
| Single Male/Father | 8 (3.9%) | 2.25 |
| Single Female/Mother | 81 (39.5%) | 3.49 |
| Total Families | 205 (100.0%) | 3.28 |
Median Household Size in Derma
The median household size in Derma is 2.53 persons per household, with single female/mother households (81 | 25.0%) accounting for the largest median household size of 3.6 persons per household. non-family households (119 | 36.7%) represent the smallest median household size with 1.12 persons per household.
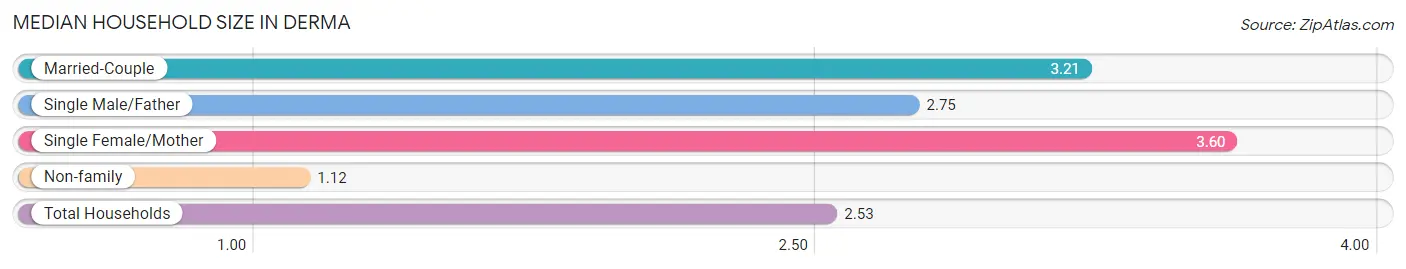
| Household Type | # Households | Household Size |
| Married-Couple | 116 (35.8%) | 3.21 |
| Single Male/Father | 8 (2.5%) | 2.75 |
| Single Female/Mother | 81 (25.0%) | 3.60 |
| Non-family | 119 (36.7%) | 1.12 |
| Total Households | 324 (100.0%) | 2.53 |
Household Size by Marriage Status in Derma
Out of a total of 324 households in Derma, 205 (63.3%) are family households, while 119 (36.7%) are nonfamily households. The most numerous type of family households are 2-person households, comprising 84, and the most common type of nonfamily households are 1-person households, comprising 112.
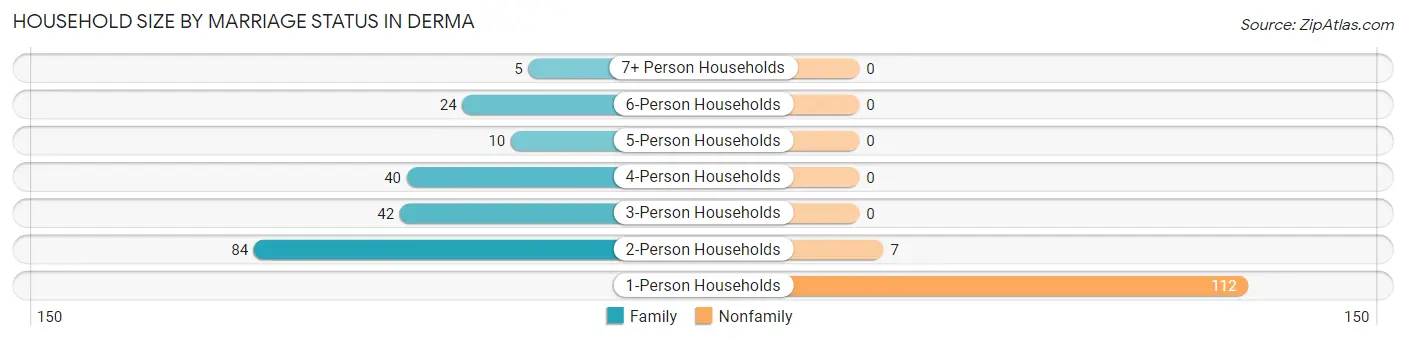
| Household Size | Family Households | Nonfamily Households |
| 1-Person Households | - | 112 (34.6%) |
| 2-Person Households | 84 (25.9%) | 7 (2.2%) |
| 3-Person Households | 42 (13.0%) | 0 (0.0%) |
| 4-Person Households | 40 (12.3%) | 0 (0.0%) |
| 5-Person Households | 10 (3.1%) | 0 (0.0%) |
| 6-Person Households | 24 (7.4%) | 0 (0.0%) |
| 7+ Person Households | 5 (1.5%) | 0 (0.0%) |
| Total | 205 (63.3%) | 119 (36.7%) |
Female Fertility in Derma
Fertility by Age in Derma
Average fertility rate in Derma is 49.0 births per 1,000 women. Women in the age bracket of 20 to 34 years have the highest fertility rate with 226.0 births per 1,000 women. Women in the age bracket of 20 to 34 years acount for 77.8% of all women with births.
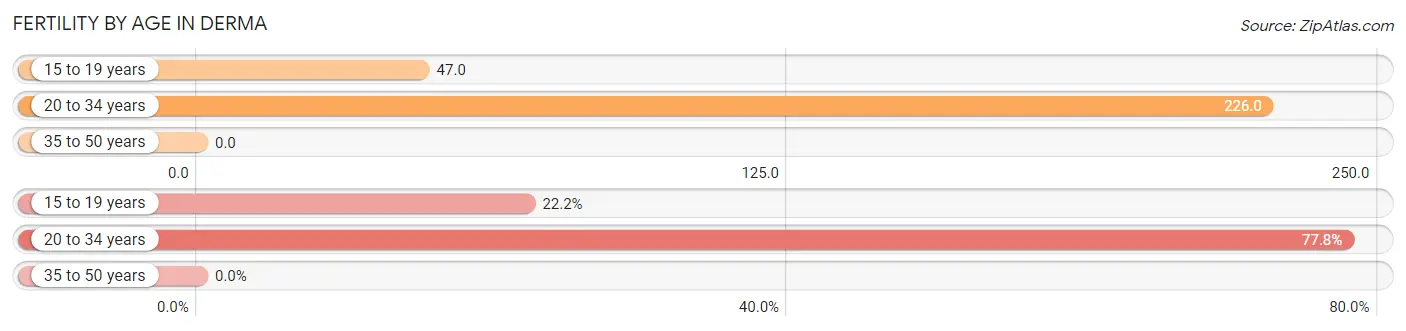
| Age Bracket | Women with Births | Births / 1,000 Women |
| 15 to 19 years | 2 (22.2%) | 47.0 |
| 20 to 34 years | 7 (77.8%) | 226.0 |
| 35 to 50 years | 0 (0.0%) | 0.0 |
| Total | 9 (100.0%) | 49.0 |
Fertility by Age by Marriage Status in Derma
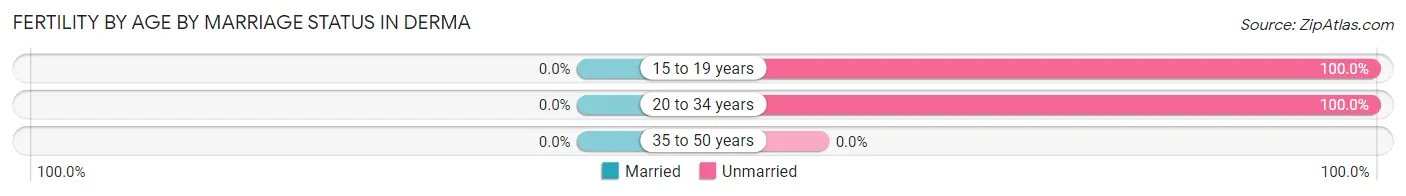
| Age Bracket | Married | Unmarried |
| 15 to 19 years | 0 (0.0%) | 2 (100.0%) |
| 20 to 34 years | 0 (0.0%) | 7 (100.0%) |
| 35 to 50 years | 0 (0.0%) | 0 (0.0%) |
| Total | 0 (0.0%) | 9 (100.0%) |
Fertility by Education in Derma
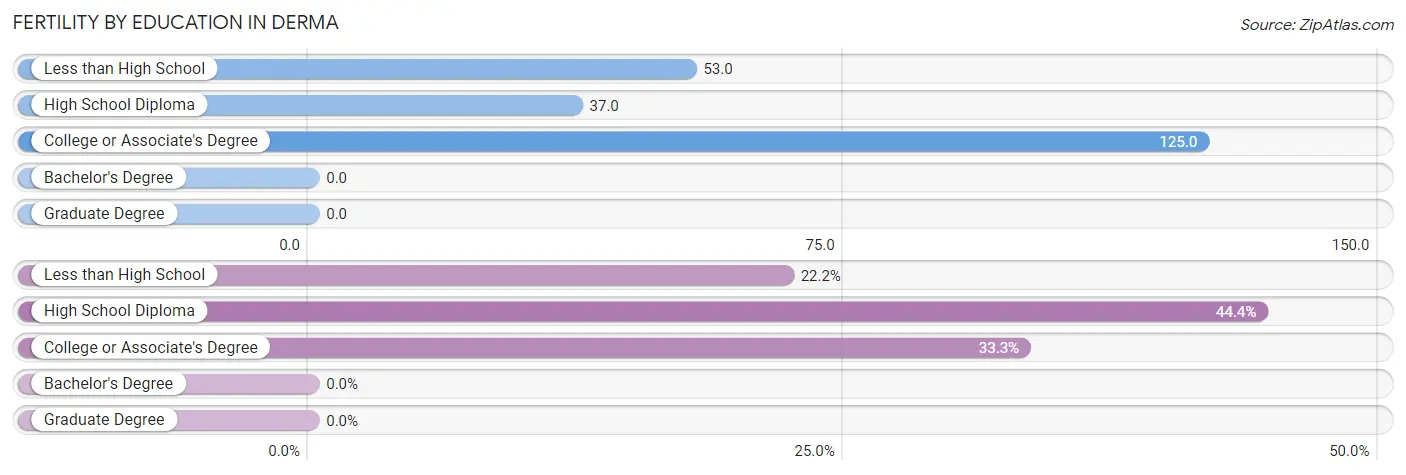
| Educational Attainment | Women with Births | Births / 1,000 Women |
| Less than High School | 2 (22.2%) | 53.0 |
| High School Diploma | 4 (44.4%) | 37.0 |
| College or Associate's Degree | 3 (33.3%) | 125.0 |
| Bachelor's Degree | 0 (0.0%) | 0.0 |
| Graduate Degree | 0 (0.0%) | 0.0 |
| Total | 9 (100.0%) | 49.0 |
Fertility by Education by Marriage Status in Derma
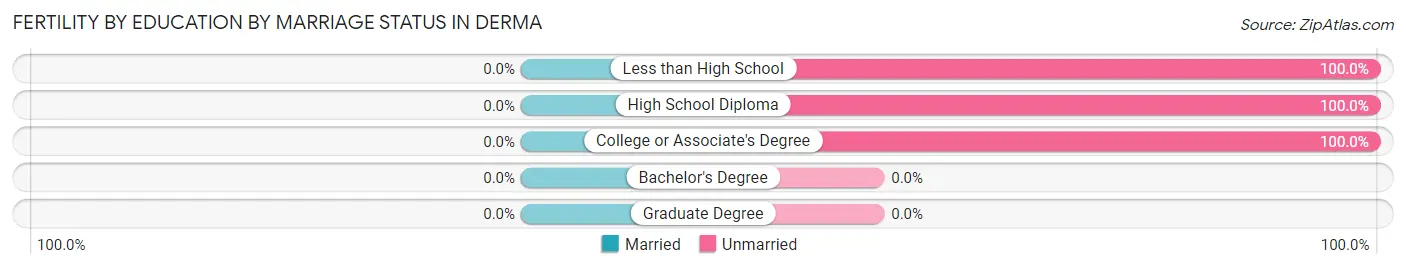
| Educational Attainment | Married | Unmarried |
| Less than High School | 0 (0.0%) | 2 (100.0%) |
| High School Diploma | 0 (0.0%) | 4 (100.0%) |
| College or Associate's Degree | 0 (0.0%) | 3 (100.0%) |
| Bachelor's Degree | 0 (0.0%) | 0 (0.0%) |
| Graduate Degree | 0 (0.0%) | 0 (0.0%) |
| Total | 0 (0.0%) | 9 (100.0%) |
Income in Derma
Income Overview in Derma
Per Capita Income in Derma is $19,022, while median incomes of families and households are $50,677 and $41,250 respectively.
| Characteristic | Number | Measure |
| Per Capita Income | 819 | $19,022 |
| Median Family Income | 205 | $50,677 |
| Mean Family Income | 205 | $54,849 |
| Median Household Income | 324 | $41,250 |
| Mean Household Income | 324 | $47,587 |
| Income Deficit | 205 | $12,880 |
| Wage / Income Gap (%) | 819 | 34.25% |
| Wage / Income Gap ($) | 819 | 65.75¢ per $1 |
| Gini / Inequality Index | 819 | 0.38 |
Earnings by Sex in Derma
Average Earnings in Derma are $30,938, $38,125 for men and $25,069 for women, a difference of 34.3%.
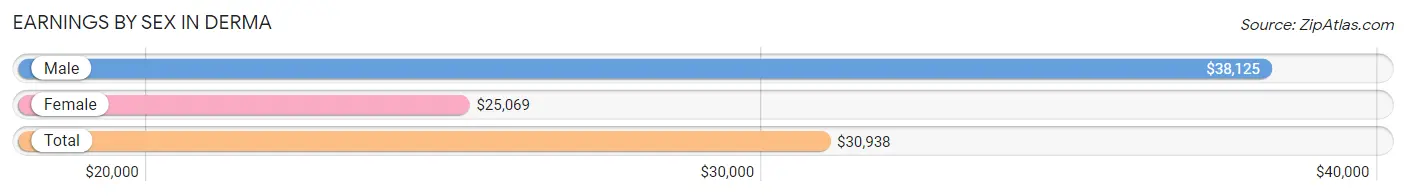
| Sex | Number | Average Earnings |
| Male | 150 (41.5%) | $38,125 |
| Female | 211 (58.5%) | $25,069 |
| Total | 361 (100.0%) | $30,938 |
Earnings by Sex by Income Bracket in Derma
The most common earnings brackets in Derma are $30,000 to $34,999 for men (26 | 17.3%) and $30,000 to $34,999 for women (37 | 17.5%).
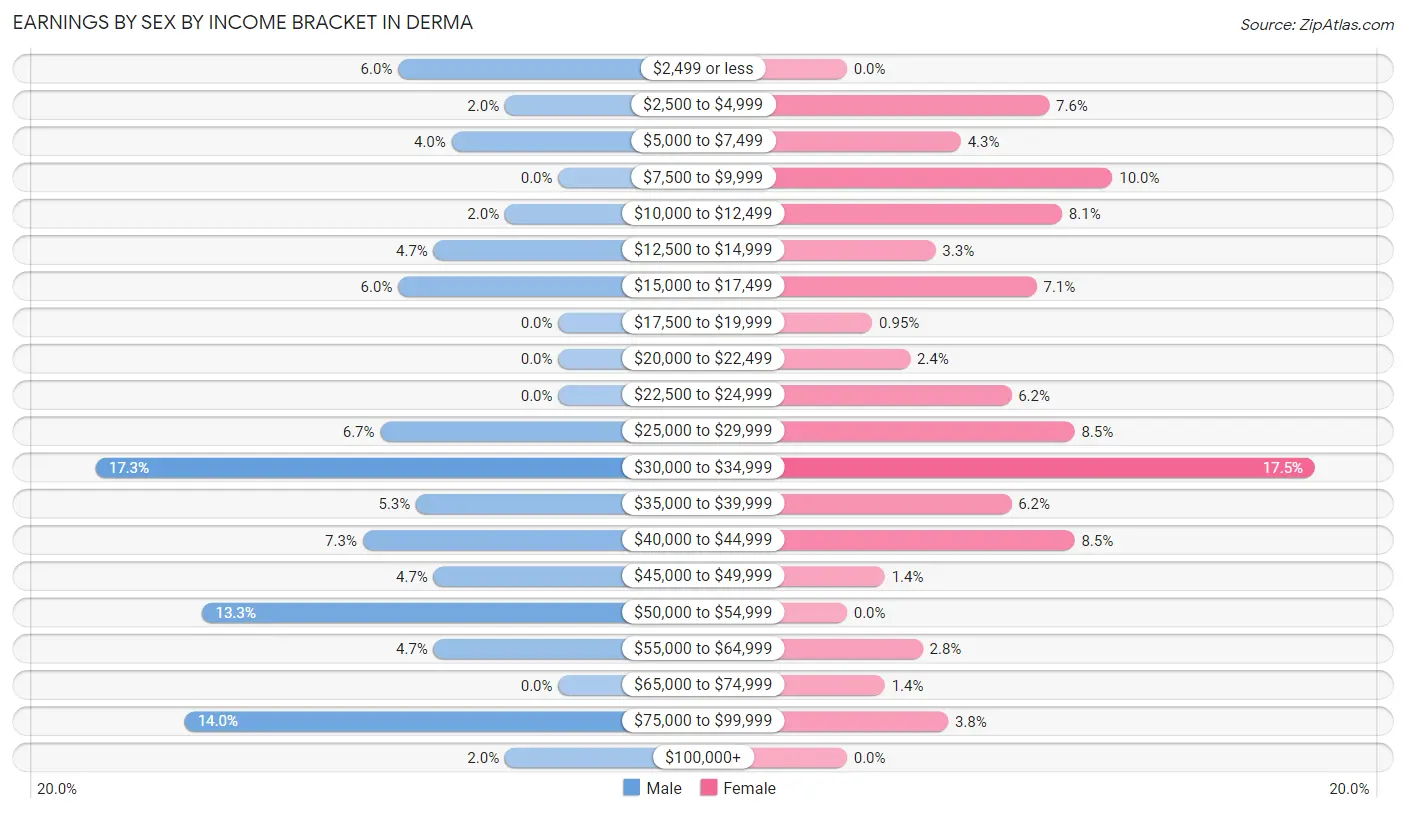
| Income | Male | Female |
| $2,499 or less | 9 (6.0%) | 0 (0.0%) |
| $2,500 to $4,999 | 3 (2.0%) | 16 (7.6%) |
| $5,000 to $7,499 | 6 (4.0%) | 9 (4.3%) |
| $7,500 to $9,999 | 0 (0.0%) | 21 (10.0%) |
| $10,000 to $12,499 | 3 (2.0%) | 17 (8.1%) |
| $12,500 to $14,999 | 7 (4.7%) | 7 (3.3%) |
| $15,000 to $17,499 | 9 (6.0%) | 15 (7.1%) |
| $17,500 to $19,999 | 0 (0.0%) | 2 (0.9%) |
| $20,000 to $22,499 | 0 (0.0%) | 5 (2.4%) |
| $22,500 to $24,999 | 0 (0.0%) | 13 (6.2%) |
| $25,000 to $29,999 | 10 (6.7%) | 18 (8.5%) |
| $30,000 to $34,999 | 26 (17.3%) | 37 (17.5%) |
| $35,000 to $39,999 | 8 (5.3%) | 13 (6.2%) |
| $40,000 to $44,999 | 11 (7.3%) | 18 (8.5%) |
| $45,000 to $49,999 | 7 (4.7%) | 3 (1.4%) |
| $50,000 to $54,999 | 20 (13.3%) | 0 (0.0%) |
| $55,000 to $64,999 | 7 (4.7%) | 6 (2.8%) |
| $65,000 to $74,999 | 0 (0.0%) | 3 (1.4%) |
| $75,000 to $99,999 | 21 (14.0%) | 8 (3.8%) |
| $100,000+ | 3 (2.0%) | 0 (0.0%) |
| Total | 150 (100.0%) | 211 (100.0%) |
Earnings by Sex by Educational Attainment in Derma
Average earnings in Derma are $39,375 for men and $26,477 for women, a difference of 32.8%. Men with an educational attainment of high school diploma enjoy the highest average annual earnings of $41,667, while those with less than high school education earn the least with $33,021. Women with an educational attainment of bachelor's degree earn the most with the average annual earnings of $77,813, while those with high school diploma education have the smallest earnings of $18,125.
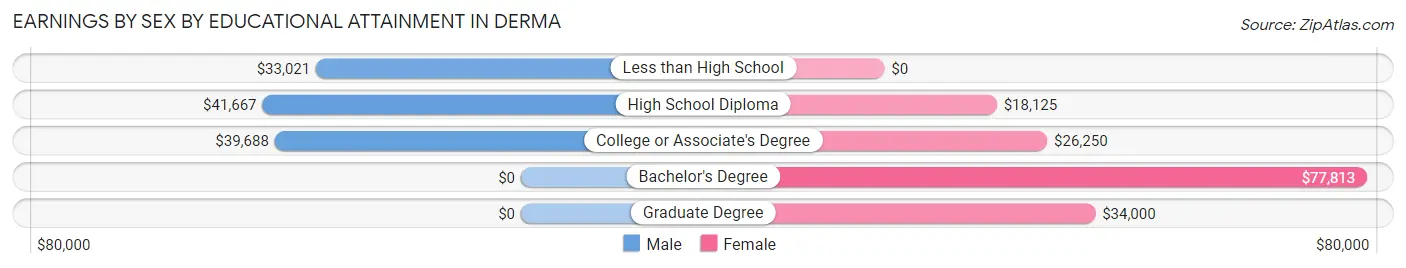
| Educational Attainment | Male Income | Female Income |
| Less than High School | $33,021 | $0 |
| High School Diploma | $41,667 | $18,125 |
| College or Associate's Degree | $39,688 | $26,250 |
| Bachelor's Degree | - | - |
| Graduate Degree | - | - |
| Total | $39,375 | $26,477 |
Family Income in Derma
Family Income Brackets in Derma
According to the Derma family income data, there are 61 families falling into the $50,000 to $74,999 income range, which is the most common income bracket and makes up 29.8% of all families.
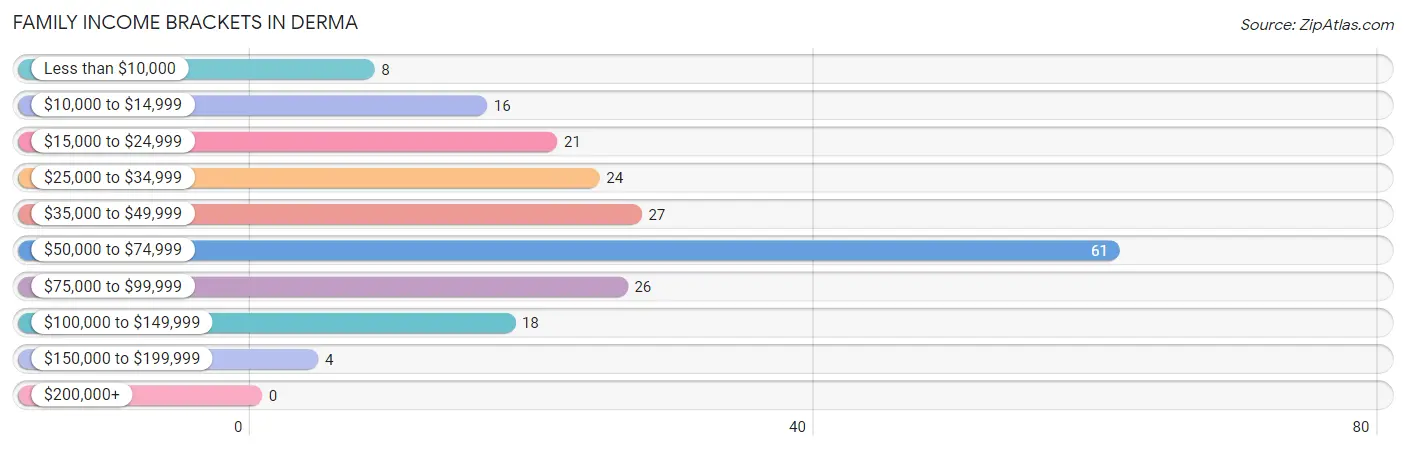
| Income Bracket | # Families | % Families |
| Less than $10,000 | 8 | 3.9% |
| $10,000 to $14,999 | 16 | 7.8% |
| $15,000 to $24,999 | 21 | 10.2% |
| $25,000 to $34,999 | 24 | 11.7% |
| $35,000 to $49,999 | 27 | 13.2% |
| $50,000 to $74,999 | 61 | 29.8% |
| $75,000 to $99,999 | 26 | 12.7% |
| $100,000 to $149,999 | 18 | 8.8% |
| $150,000 to $199,999 | 4 | 2.0% |
| $200,000+ | 0 | 0.0% |
Family Income by Famaliy Size in Derma
2-person families (88 | 42.9%) account for the highest median family income in Derma with $46,250 per family, while 2-person families (88 | 42.9%) have the highest median income of $23,125 per family member.
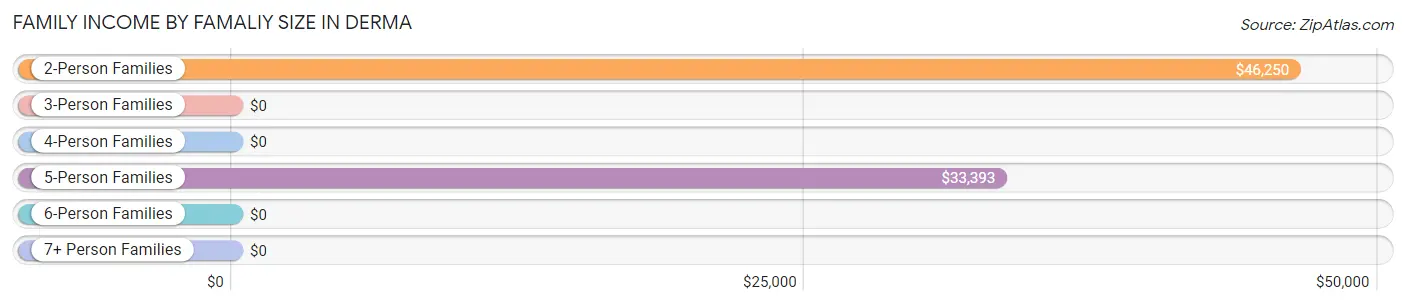
| Income Bracket | # Families | Median Income |
| 2-Person Families | 88 (42.9%) | $46,250 |
| 3-Person Families | 38 (18.5%) | $0 |
| 4-Person Families | 40 (19.5%) | $0 |
| 5-Person Families | 15 (7.3%) | $33,393 |
| 6-Person Families | 24 (11.7%) | $0 |
| 7+ Person Families | 0 (0.0%) | $0 |
| Total | 205 (100.0%) | $50,677 |
Family Income by Number of Earners in Derma
The median family income in Derma is $50,677, with families comprising 3+ earners (18) having the highest median family income of $106,000, while families with no earners (39) have the lowest median family income of $21,875, accounting for 8.8% and 19.0% of families, respectively.
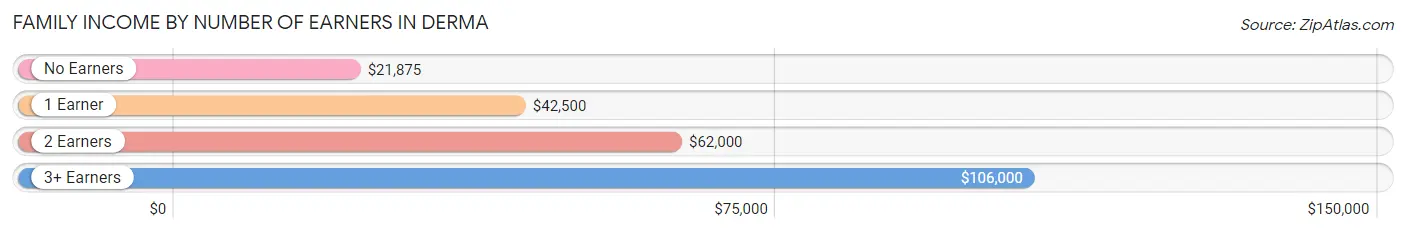
| Number of Earners | # Families | Median Income |
| No Earners | 39 (19.0%) | $21,875 |
| 1 Earner | 58 (28.3%) | $42,500 |
| 2 Earners | 90 (43.9%) | $62,000 |
| 3+ Earners | 18 (8.8%) | $106,000 |
| Total | 205 (100.0%) | $50,677 |
Household Income in Derma
Household Income Brackets in Derma
With 88 households falling in the category, the $50,000 to $74,999 income range is the most frequent in Derma, accounting for 27.2% of all households.
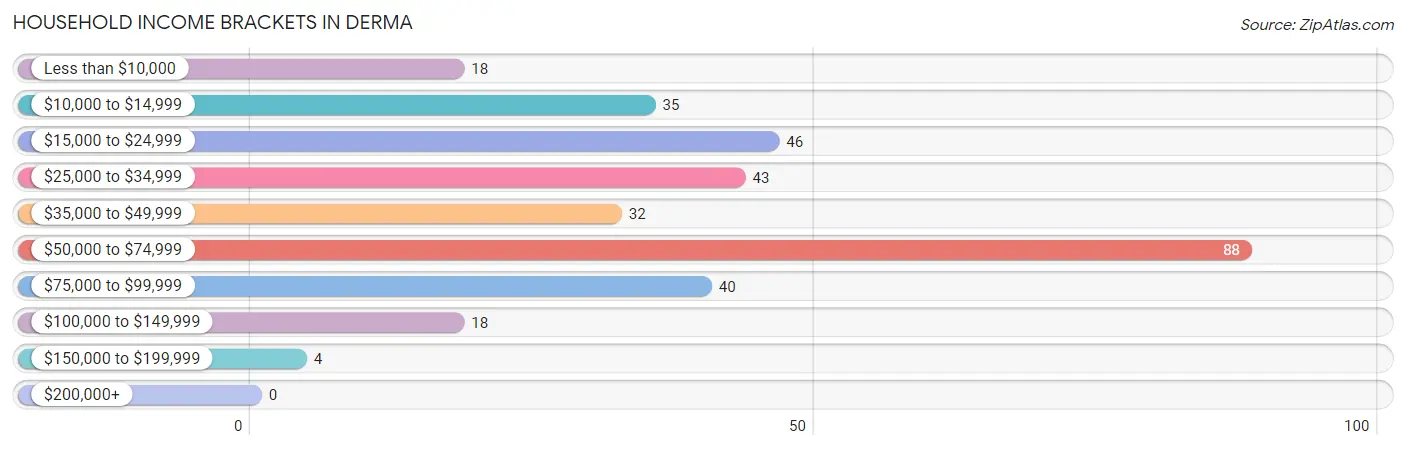
| Income Bracket | # Households | % Households |
| Less than $10,000 | 18 | 5.6% |
| $10,000 to $14,999 | 35 | 10.8% |
| $15,000 to $24,999 | 46 | 14.2% |
| $25,000 to $34,999 | 43 | 13.3% |
| $35,000 to $49,999 | 32 | 9.9% |
| $50,000 to $74,999 | 88 | 27.2% |
| $75,000 to $99,999 | 40 | 12.3% |
| $100,000 to $149,999 | 18 | 5.6% |
| $150,000 to $199,999 | 4 | 1.2% |
| $200,000+ | 0 | 0.0% |
Household Income by Householder Age in Derma
The median household income in Derma is $41,250, with the highest median household income of $51,583 found in the 25 to 44 years age bracket for the primary householder. A total of 93 households (28.7%) fall into this category. Meanwhile, the 15 to 24 years age bracket for the primary householder has the lowest median household income of $0, with 4 households (1.2%) in this group.
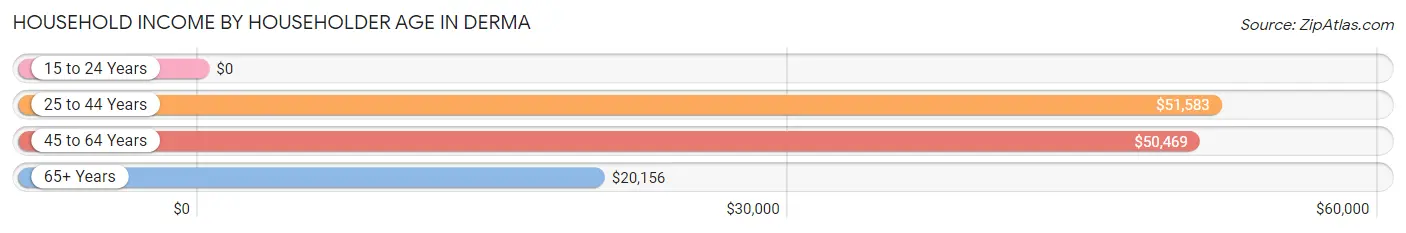
| Income Bracket | # Households | Median Income |
| 15 to 24 Years | 4 (1.2%) | $0 |
| 25 to 44 Years | 93 (28.7%) | $51,583 |
| 45 to 64 Years | 141 (43.5%) | $50,469 |
| 65+ Years | 86 (26.5%) | $20,156 |
| Total | 324 (100.0%) | $41,250 |
Poverty in Derma
Income Below Poverty by Sex and Age in Derma
With 34.9% poverty level for males and 26.8% for females among the residents of Derma, 6 to 11 year old males and 6 to 11 year old females are the most vulnerable to poverty, with 36 males (78.3%) and 10 females (100.0%) in their respective age groups living below the poverty level.
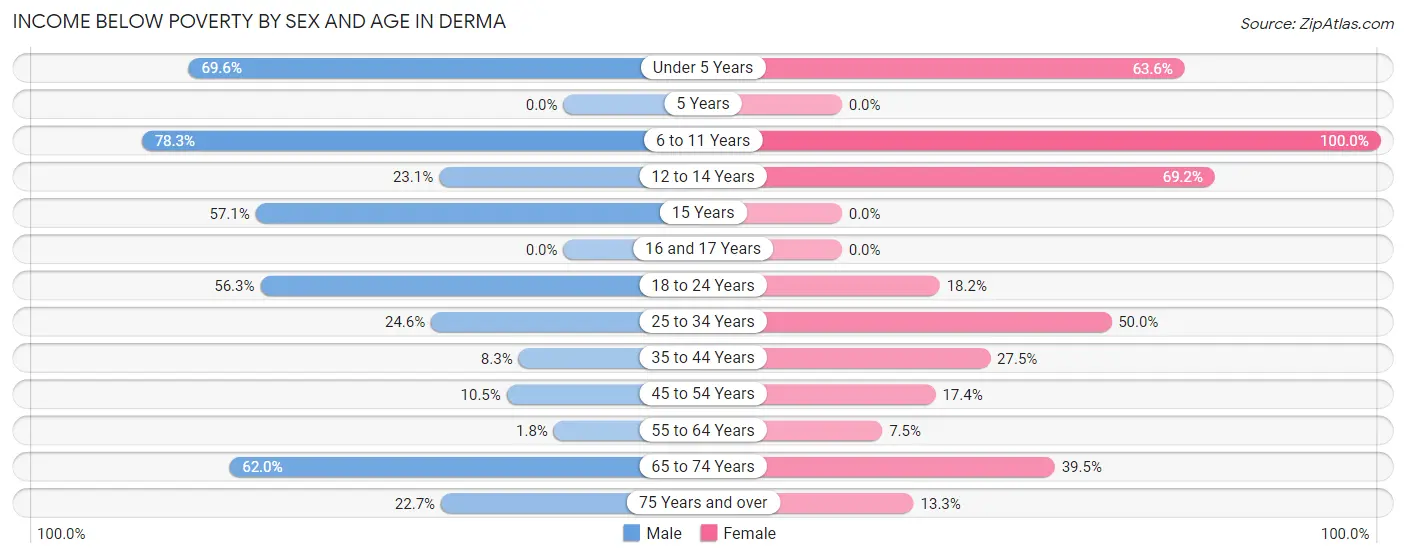
| Age Bracket | Male | Female |
| Under 5 Years | 32 (69.6%) | 7 (63.6%) |
| 5 Years | 0 (0.0%) | 0 (0.0%) |
| 6 to 11 Years | 36 (78.3%) | 10 (100.0%) |
| 12 to 14 Years | 6 (23.1%) | 18 (69.2%) |
| 15 Years | 8 (57.1%) | 0 (0.0%) |
| 16 and 17 Years | 0 (0.0%) | 0 (0.0%) |
| 18 to 24 Years | 9 (56.2%) | 8 (18.2%) |
| 25 to 34 Years | 14 (24.6%) | 8 (50.0%) |
| 35 to 44 Years | 5 (8.3%) | 19 (27.5%) |
| 45 to 54 Years | 2 (10.5%) | 8 (17.4%) |
| 55 to 64 Years | 1 (1.8%) | 6 (7.5%) |
| 65 to 74 Years | 31 (62.0%) | 17 (39.5%) |
| 75 Years and over | 5 (22.7%) | 4 (13.3%) |
| Total | 149 (34.9%) | 105 (26.8%) |
Income Above Poverty by Sex and Age in Derma
According to the poverty statistics in Derma, males aged 16 and 17 years and females aged 5 years are the age groups that are most secure financially, with 100.0% of males and 100.0% of females in these age groups living above the poverty line.
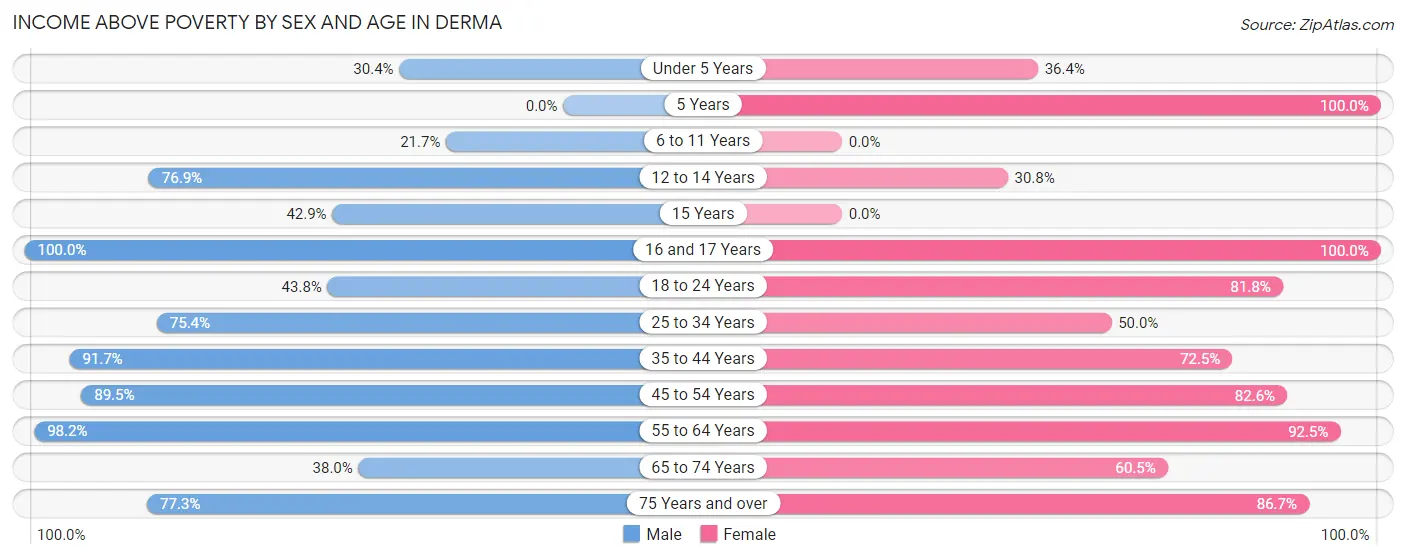
| Age Bracket | Male | Female |
| Under 5 Years | 14 (30.4%) | 4 (36.4%) |
| 5 Years | 0 (0.0%) | 3 (100.0%) |
| 6 to 11 Years | 10 (21.7%) | 0 (0.0%) |
| 12 to 14 Years | 20 (76.9%) | 8 (30.8%) |
| 15 Years | 6 (42.9%) | 0 (0.0%) |
| 16 and 17 Years | 15 (100.0%) | 14 (100.0%) |
| 18 to 24 Years | 7 (43.8%) | 36 (81.8%) |
| 25 to 34 Years | 43 (75.4%) | 8 (50.0%) |
| 35 to 44 Years | 55 (91.7%) | 50 (72.5%) |
| 45 to 54 Years | 17 (89.5%) | 38 (82.6%) |
| 55 to 64 Years | 55 (98.2%) | 74 (92.5%) |
| 65 to 74 Years | 19 (38.0%) | 26 (60.5%) |
| 75 Years and over | 17 (77.3%) | 26 (86.7%) |
| Total | 278 (65.1%) | 287 (73.2%) |
Income Below Poverty Among Married-Couple Families in Derma
The poverty statistics for married-couple families in Derma show that 18.1% or 21 of the total 116 families live below the poverty line. Families with 3 or 4 children have the highest poverty rate of 100.0%, comprising of 7 families. On the other hand, families with no children have the lowest poverty rate of 5.4%, which includes 4 families.
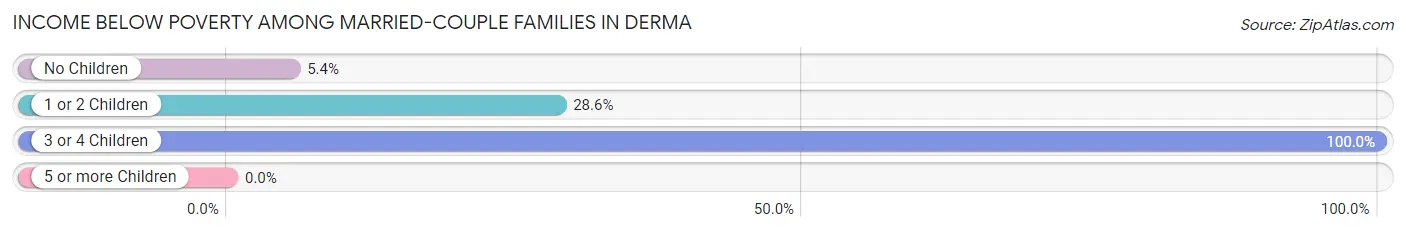
| Children | Above Poverty | Below Poverty |
| No Children | 70 (94.6%) | 4 (5.4%) |
| 1 or 2 Children | 25 (71.4%) | 10 (28.6%) |
| 3 or 4 Children | 0 (0.0%) | 7 (100.0%) |
| 5 or more Children | 0 (0.0%) | 0 (0.0%) |
| Total | 95 (81.9%) | 21 (18.1%) |
Income Below Poverty Among Single-Parent Households in Derma
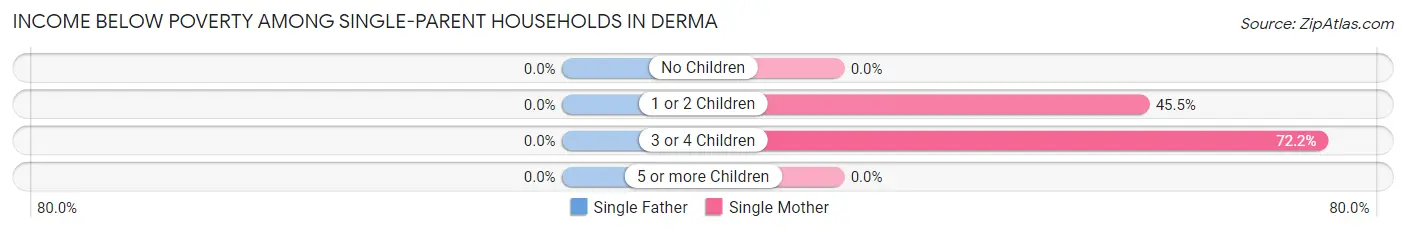
| Children | Single Father | Single Mother |
| No Children | 0 (0.0%) | 0 (0.0%) |
| 1 or 2 Children | 0 (0.0%) | 15 (45.5%) |
| 3 or 4 Children | 0 (0.0%) | 13 (72.2%) |
| 5 or more Children | 0 (0.0%) | 0 (0.0%) |
| Total | 0 (0.0%) | 28 (34.6%) |
Income Below Poverty Among Married-Couple vs Single-Parent Households in Derma
The poverty data for Derma shows that 21 of the married-couple family households (18.1%) and 28 of the single-parent households (31.5%) are living below the poverty level. Within the married-couple family households, those with 3 or 4 children have the highest poverty rate, with 7 households (100.0%) falling below the poverty line. Among the single-parent households, those with 3 or 4 children have the highest poverty rate, with 13 household (72.2%) living below poverty.
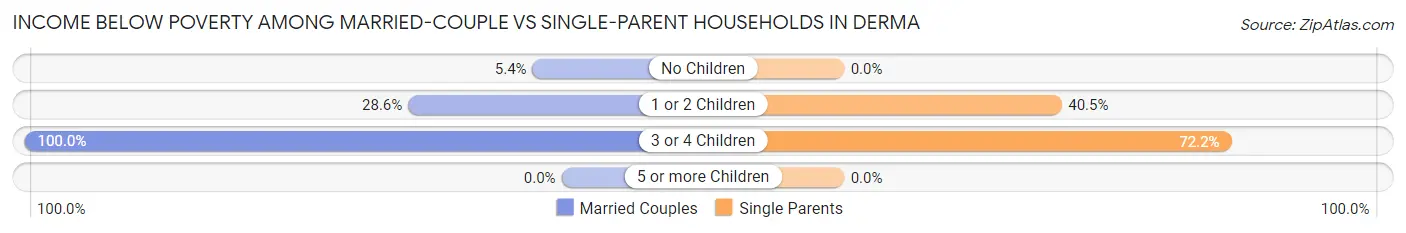
| Children | Married-Couple Families | Single-Parent Households |
| No Children | 4 (5.4%) | 0 (0.0%) |
| 1 or 2 Children | 10 (28.6%) | 15 (40.5%) |
| 3 or 4 Children | 7 (100.0%) | 13 (72.2%) |
| 5 or more Children | 0 (0.0%) | 0 (0.0%) |
| Total | 21 (18.1%) | 28 (31.5%) |
Employment Characteristics in Derma
Employment by Class of Employer in Derma
Among the 305 employed individuals in Derma, private company employees (261 | 85.6%), state government employees (25 | 8.2%), and not-for-profit organizations (7 | 2.3%) make up the most common classes of employment.
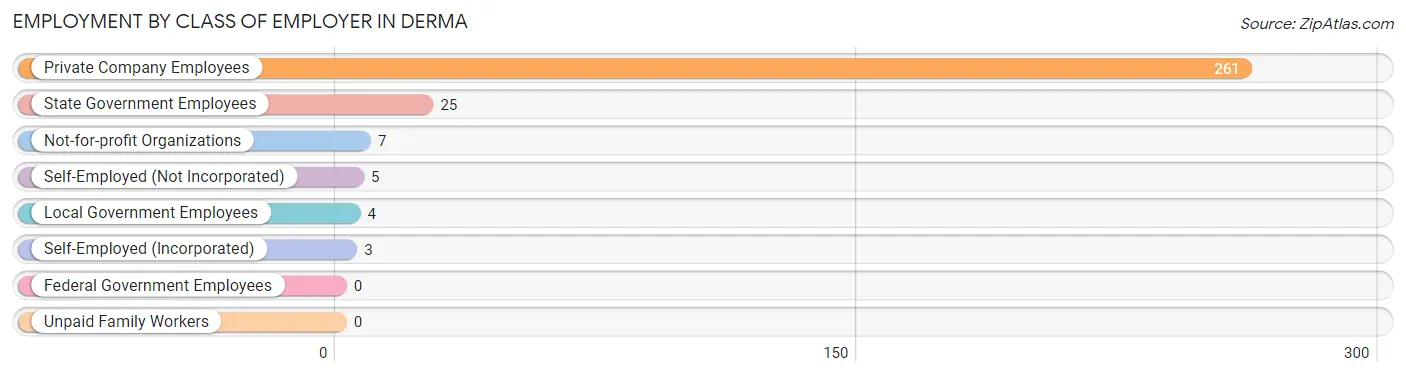
| Employer Class | # Employees | % Employees |
| Private Company Employees | 261 | 85.6% |
| Self-Employed (Incorporated) | 3 | 1.0% |
| Self-Employed (Not Incorporated) | 5 | 1.6% |
| Not-for-profit Organizations | 7 | 2.3% |
| Local Government Employees | 4 | 1.3% |
| State Government Employees | 25 | 8.2% |
| Federal Government Employees | 0 | 0.0% |
| Unpaid Family Workers | 0 | 0.0% |
| Total | 305 | 100.0% |
Employment Status by Age in Derma
According to the labor force statistics for Derma, out of the total population over 16 years of age (637), 55.1% or 351 individuals are in the labor force, with 7.4% or 26 of them unemployed. The age group with the highest labor force participation rate is 25 to 29 years, with 83.3% or 20 individuals in the labor force. Within the labor force, the 20 to 24 years age range has the highest percentage of unemployed individuals, with 36.4% or 8 of them being unemployed.
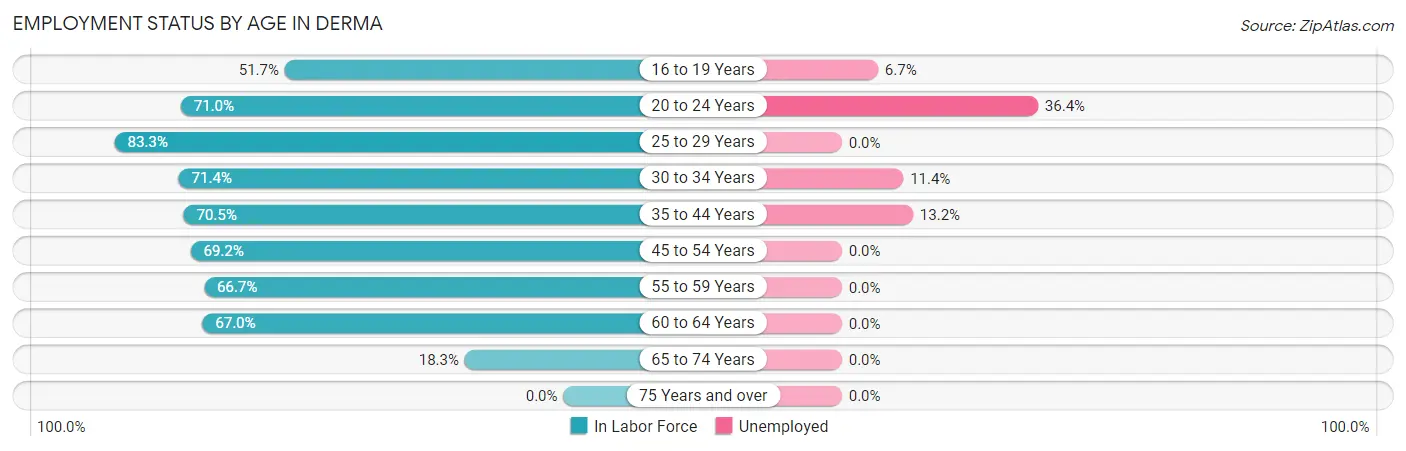
| Age Bracket | In Labor Force | Unemployed |
| 16 to 19 Years | 30 (51.7%) | 2 (6.7%) |
| 20 to 24 Years | 22 (71.0%) | 8 (36.4%) |
| 25 to 29 Years | 20 (83.3%) | 0 (0.0%) |
| 30 to 34 Years | 35 (71.4%) | 4 (11.4%) |
| 35 to 44 Years | 91 (70.5%) | 12 (13.2%) |
| 45 to 54 Years | 45 (69.2%) | 0 (0.0%) |
| 55 to 59 Years | 32 (66.7%) | 0 (0.0%) |
| 60 to 64 Years | 59 (67.0%) | 0 (0.0%) |
| 65 to 74 Years | 17 (18.3%) | 0 (0.0%) |
| 75 Years and over | 0 (0.0%) | 0 (0.0%) |
| Total | 351 (55.1%) | 26 (7.4%) |
Employment Status by Educational Attainment in Derma
According to labor force statistics for Derma, 70.0% of individuals (282) out of the total population between 25 and 64 years of age (403) are in the labor force, with 5.7% or 16 of them being unemployed. The group with the highest labor force participation rate are those with the educational attainment of bachelor's degree or higher, with 100.0% or 39 individuals in the labor force. Within the labor force, individuals with less than high school education have the highest percentage of unemployment, with 29.1% or 16 of them being unemployed.
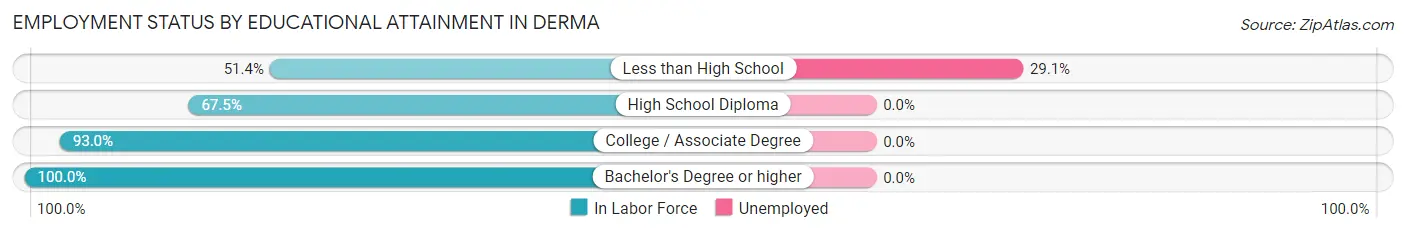
| Educational Attainment | In Labor Force | Unemployed |
| Less than High School | 55 (51.4%) | 31 (29.1%) |
| High School Diploma | 135 (67.5%) | 0 (0.0%) |
| College / Associate Degree | 53 (93.0%) | 0 (0.0%) |
| Bachelor's Degree or higher | 39 (100.0%) | 0 (0.0%) |
| Total | 282 (70.0%) | 23 (5.7%) |
Employment Occupations by Sex in Derma
Management, Business, Science and Arts Occupations
The most common Management, Business, Science and Arts occupations in Derma are Health Diagnosing & Treating (24 | 7.4%), Health Technologists (16 | 4.9%), Computers, Engineering & Science (7 | 2.1%), Computers & Mathematics (7 | 2.1%), and Management (3 | 0.9%).

Management, Business, Science and Arts Occupations by Sex
Within the Management, Business, Science and Arts occupations in Derma, the most male-oriented occupations are Management (100.0%), Education, Arts & Media (100.0%), and Community & Social Service (33.3%), while the most female-oriented occupations are Business & Financial (100.0%), Computers, Engineering & Science (100.0%), and Computers & Mathematics (100.0%).
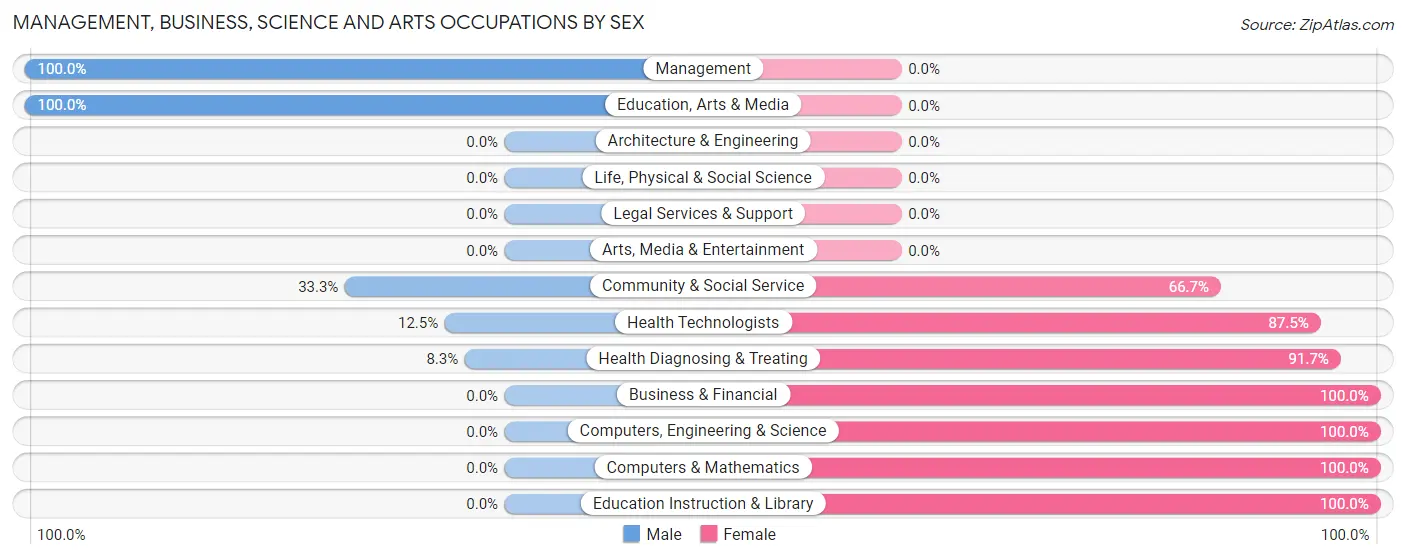
| Occupation | Male | Female |
| Management | 3 (100.0%) | 0 (0.0%) |
| Business & Financial | 0 (0.0%) | 3 (100.0%) |
| Computers, Engineering & Science | 0 (0.0%) | 7 (100.0%) |
| Computers & Mathematics | 0 (0.0%) | 7 (100.0%) |
| Architecture & Engineering | 0 (0.0%) | 0 (0.0%) |
| Life, Physical & Social Science | 0 (0.0%) | 0 (0.0%) |
| Community & Social Service | 1 (33.3%) | 2 (66.7%) |
| Education, Arts & Media | 1 (100.0%) | 0 (0.0%) |
| Legal Services & Support | 0 (0.0%) | 0 (0.0%) |
| Education Instruction & Library | 0 (0.0%) | 2 (100.0%) |
| Arts, Media & Entertainment | 0 (0.0%) | 0 (0.0%) |
| Health Diagnosing & Treating | 2 (8.3%) | 22 (91.7%) |
| Health Technologists | 2 (12.5%) | 14 (87.5%) |
| Total (Category) | 6 (15.0%) | 34 (85.0%) |
| Total (Overall) | 146 (44.9%) | 179 (55.1%) |
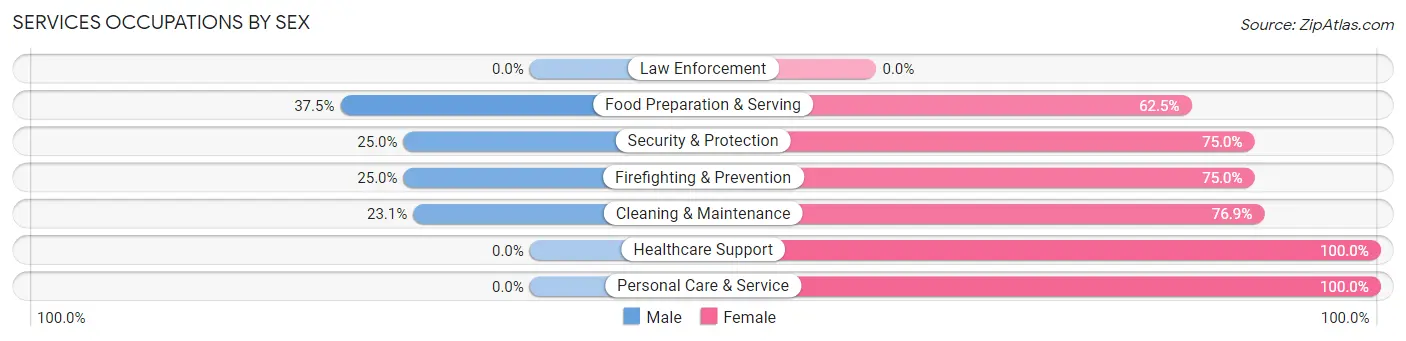
Services Occupations
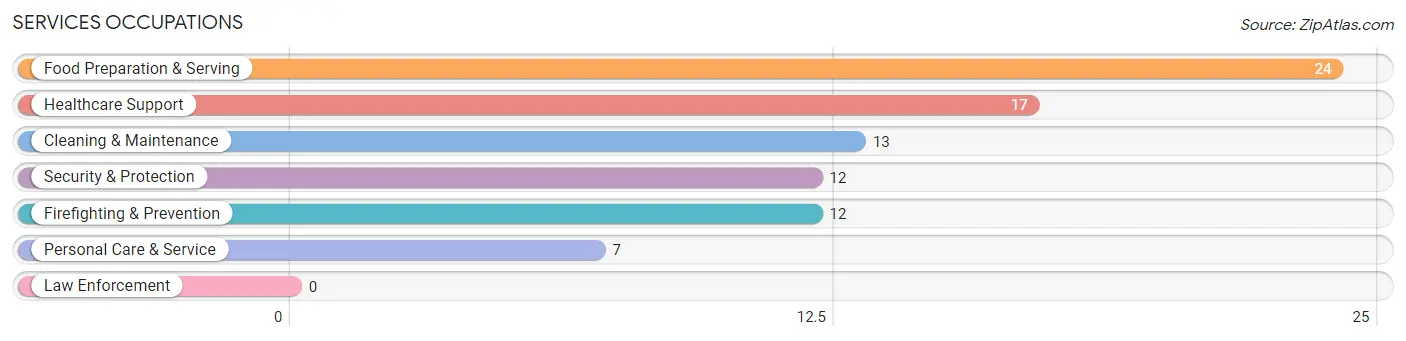
The most common Services occupations in Derma are Food Preparation & Serving (24 | 7.4%), Healthcare Support (17 | 5.2%), Cleaning & Maintenance (13 | 4.0%), Security & Protection (12 | 3.7%), and Firefighting & Prevention (12 | 3.7%).
Services Occupations by Sex
Within the Services occupations in Derma, the most male-oriented occupations are Food Preparation & Serving (37.5%), Security & Protection (25.0%), and Firefighting & Prevention (25.0%), while the most female-oriented occupations are Healthcare Support (100.0%), Personal Care & Service (100.0%), and Cleaning & Maintenance (76.9%).
| Occupation | Male | Female |
| Healthcare Support | 0 (0.0%) | 17 (100.0%) |
| Security & Protection | 3 (25.0%) | 9 (75.0%) |
| Firefighting & Prevention | 3 (25.0%) | 9 (75.0%) |
| Law Enforcement | 0 (0.0%) | 0 (0.0%) |
| Food Preparation & Serving | 9 (37.5%) | 15 (62.5%) |
| Cleaning & Maintenance | 3 (23.1%) | 10 (76.9%) |
| Personal Care & Service | 0 (0.0%) | 7 (100.0%) |
| Total (Category) | 15 (20.5%) | 58 (79.4%) |
| Total (Overall) | 146 (44.9%) | 179 (55.1%) |
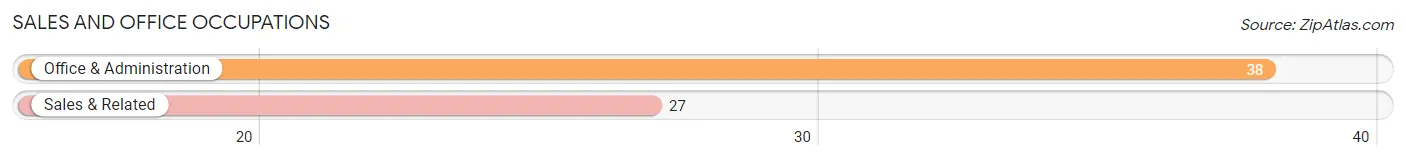
Sales and Office Occupations
The most common Sales and Office occupations in Derma are Office & Administration (38 | 11.7%), and Sales & Related (27 | 8.3%).
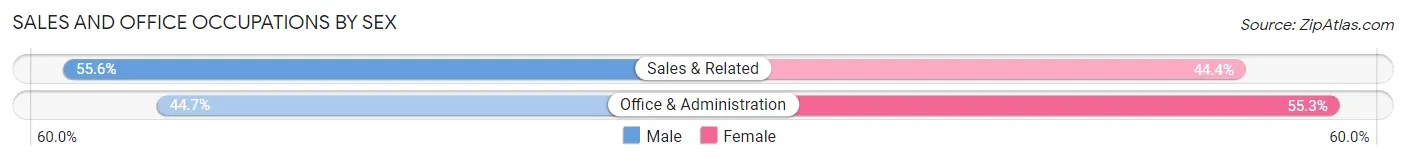
Sales and Office Occupations by Sex
| Occupation | Male | Female |
| Sales & Related | 15 (55.6%) | 12 (44.4%) |
| Office & Administration | 17 (44.7%) | 21 (55.3%) |
| Total (Category) | 32 (49.2%) | 33 (50.8%) |
| Total (Overall) | 146 (44.9%) | 179 (55.1%) |
Natural Resources, Construction and Maintenance Occupations
The most common Natural Resources, Construction and Maintenance occupations in Derma are Installation, Maintenance & Repair (12 | 3.7%), and Construction & Extraction (8 | 2.5%).
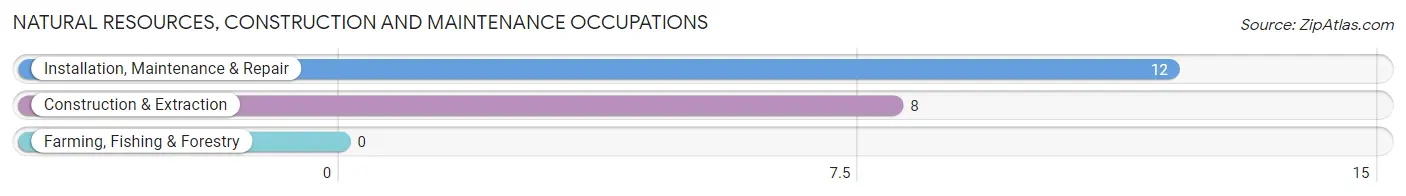
Natural Resources, Construction and Maintenance Occupations by Sex
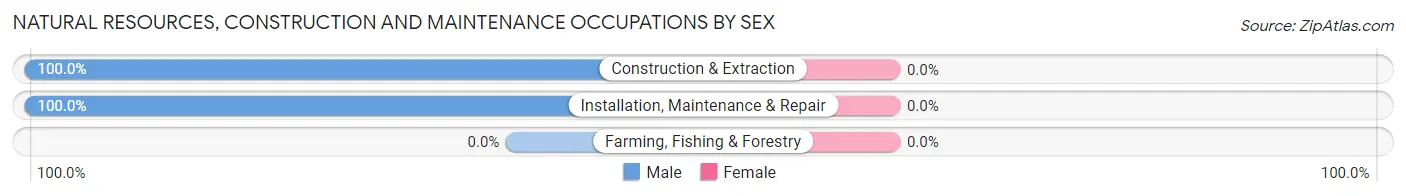
| Occupation | Male | Female |
| Farming, Fishing & Forestry | 0 (0.0%) | 0 (0.0%) |
| Construction & Extraction | 8 (100.0%) | 0 (0.0%) |
| Installation, Maintenance & Repair | 12 (100.0%) | 0 (0.0%) |
| Total (Category) | 20 (100.0%) | 0 (0.0%) |
| Total (Overall) | 146 (44.9%) | 179 (55.1%) |
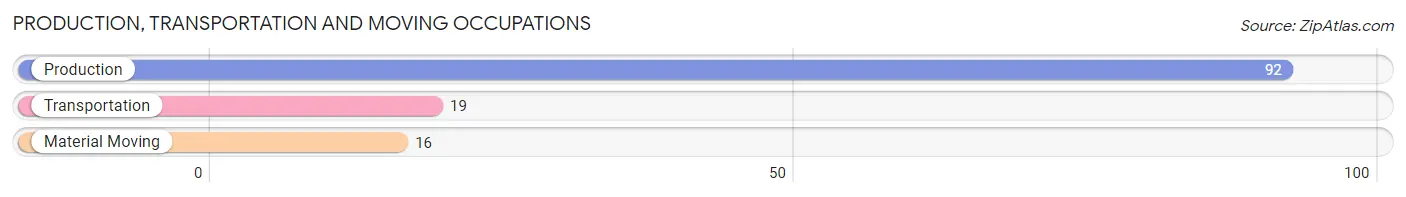
Production, Transportation and Moving Occupations
The most common Production, Transportation and Moving occupations in Derma are Production (92 | 28.3%), Transportation (19 | 5.9%), and Material Moving (16 | 4.9%).
Production, Transportation and Moving Occupations by Sex
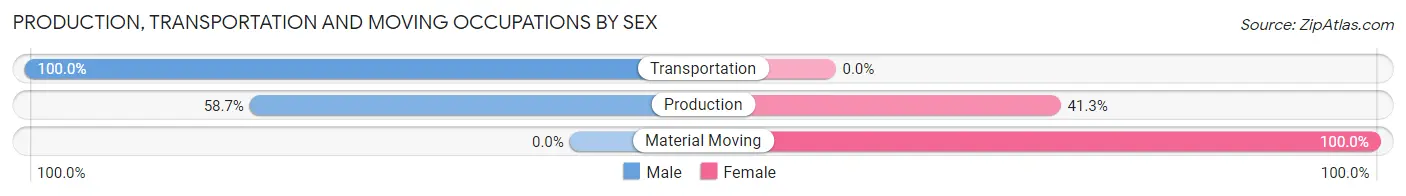
| Occupation | Male | Female |
| Production | 54 (58.7%) | 38 (41.3%) |
| Transportation | 19 (100.0%) | 0 (0.0%) |
| Material Moving | 0 (0.0%) | 16 (100.0%) |
| Total (Category) | 73 (57.5%) | 54 (42.5%) |
| Total (Overall) | 146 (44.9%) | 179 (55.1%) |
Employment Industries by Sex in Derma
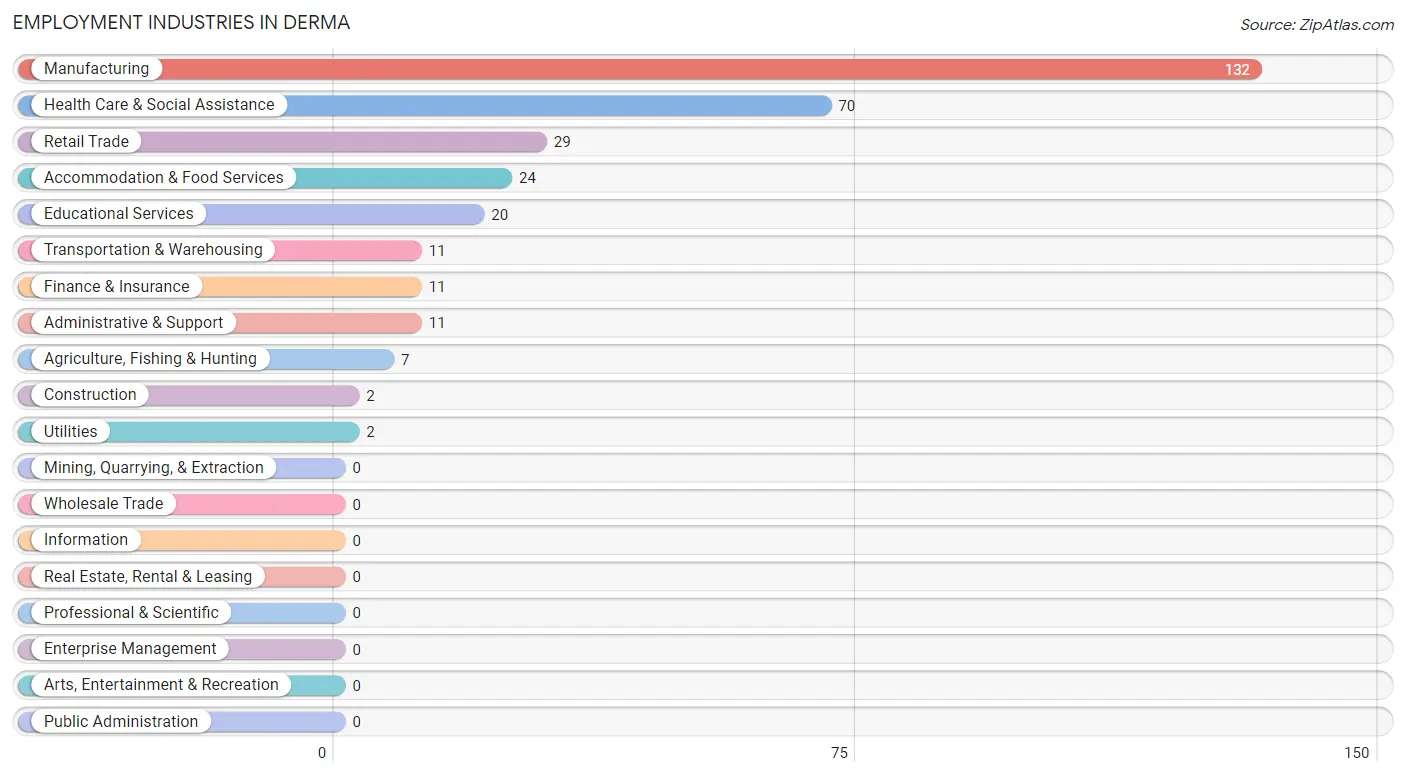
Employment Industries in Derma
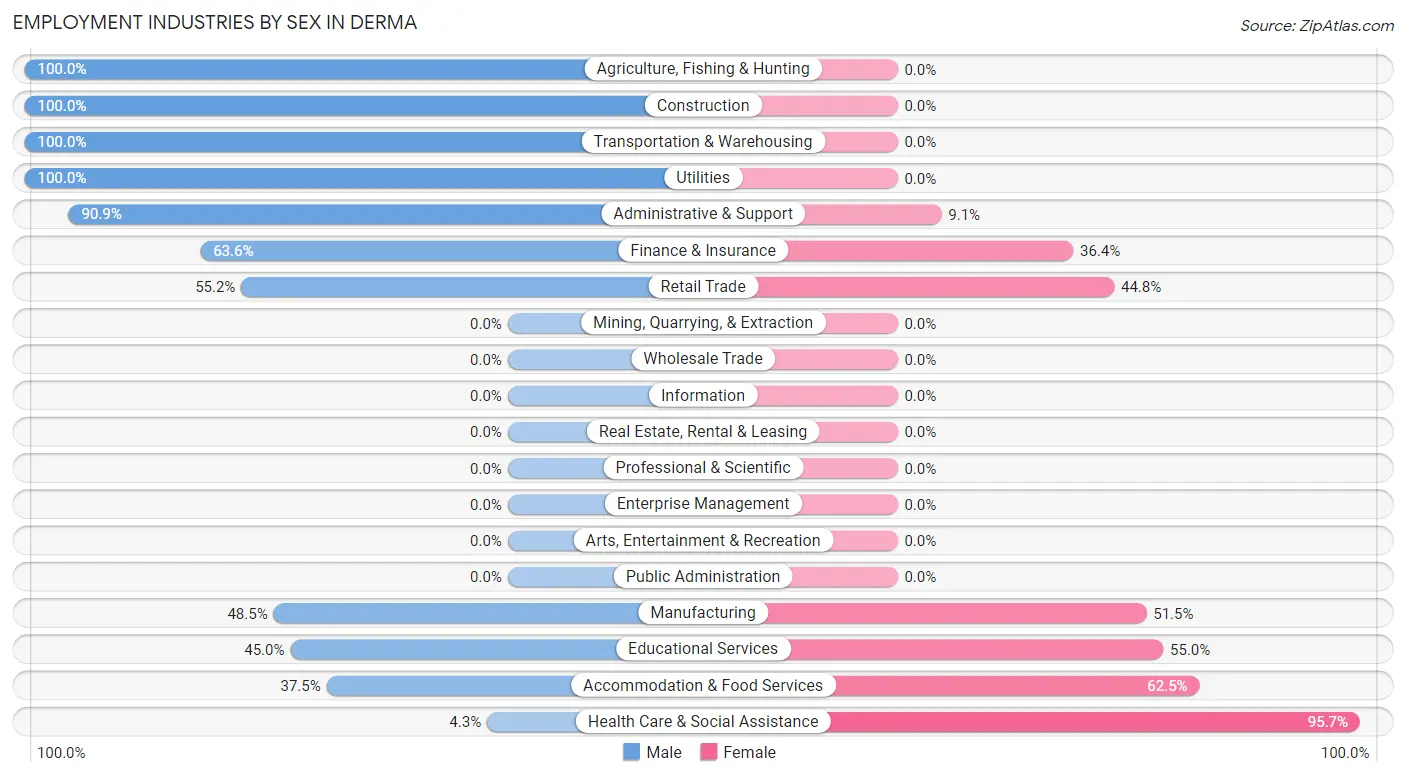
The major employment industries in Derma include Manufacturing (132 | 40.6%), Health Care & Social Assistance (70 | 21.5%), Retail Trade (29 | 8.9%), Accommodation & Food Services (24 | 7.4%), and Educational Services (20 | 6.1%).
Employment Industries by Sex in Derma
The Derma industries that see more men than women are Agriculture, Fishing & Hunting (100.0%), Construction (100.0%), and Transportation & Warehousing (100.0%), whereas the industries that tend to have a higher number of women are Health Care & Social Assistance (95.7%), Accommodation & Food Services (62.5%), and Educational Services (55.0%).
| Industry | Male | Female |
| Agriculture, Fishing & Hunting | 7 (100.0%) | 0 (0.0%) |
| Mining, Quarrying, & Extraction | 0 (0.0%) | 0 (0.0%) |
| Construction | 2 (100.0%) | 0 (0.0%) |
| Manufacturing | 64 (48.5%) | 68 (51.5%) |
| Wholesale Trade | 0 (0.0%) | 0 (0.0%) |
| Retail Trade | 16 (55.2%) | 13 (44.8%) |
| Transportation & Warehousing | 11 (100.0%) | 0 (0.0%) |
| Utilities | 2 (100.0%) | 0 (0.0%) |
| Information | 0 (0.0%) | 0 (0.0%) |
| Finance & Insurance | 7 (63.6%) | 4 (36.4%) |
| Real Estate, Rental & Leasing | 0 (0.0%) | 0 (0.0%) |
| Professional & Scientific | 0 (0.0%) | 0 (0.0%) |
| Enterprise Management | 0 (0.0%) | 0 (0.0%) |
| Administrative & Support | 10 (90.9%) | 1 (9.1%) |
| Educational Services | 9 (45.0%) | 11 (55.0%) |
| Health Care & Social Assistance | 3 (4.3%) | 67 (95.7%) |
| Arts, Entertainment & Recreation | 0 (0.0%) | 0 (0.0%) |
| Accommodation & Food Services | 9 (37.5%) | 15 (62.5%) |
| Public Administration | 0 (0.0%) | 0 (0.0%) |
| Total | 146 (44.9%) | 179 (55.1%) |
Education in Derma
School Enrollment in Derma
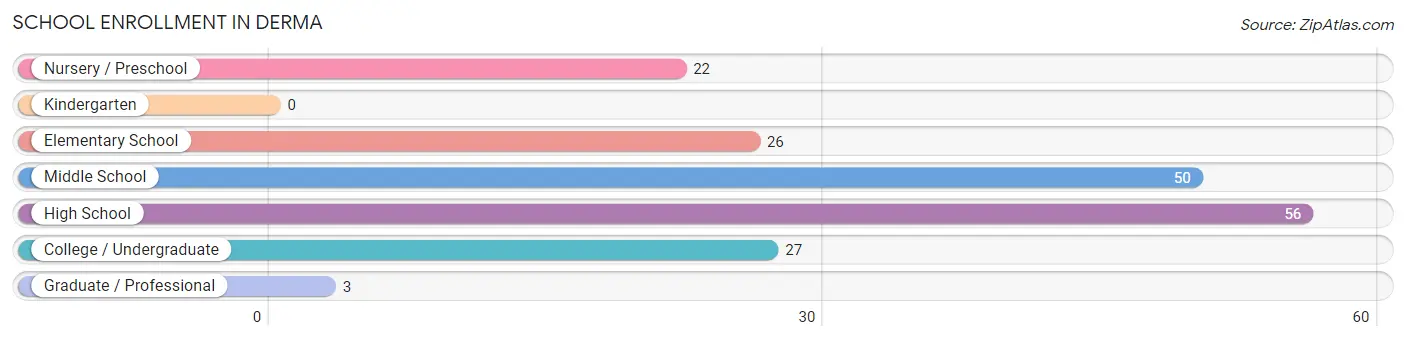
The most common levels of schooling among the 184 students in Derma are high school (56 | 30.4%), middle school (50 | 27.2%), and college / undergraduate (27 | 14.7%).
| School Level | # Students | % Students |
| Nursery / Preschool | 22 | 12.0% |
| Kindergarten | 0 | 0.0% |
| Elementary School | 26 | 14.1% |
| Middle School | 50 | 27.2% |
| High School | 56 | 30.4% |
| College / Undergraduate | 27 | 14.7% |
| Graduate / Professional | 3 | 1.6% |
| Total | 184 | 100.0% |
School Enrollment by Age by Funding Source in Derma
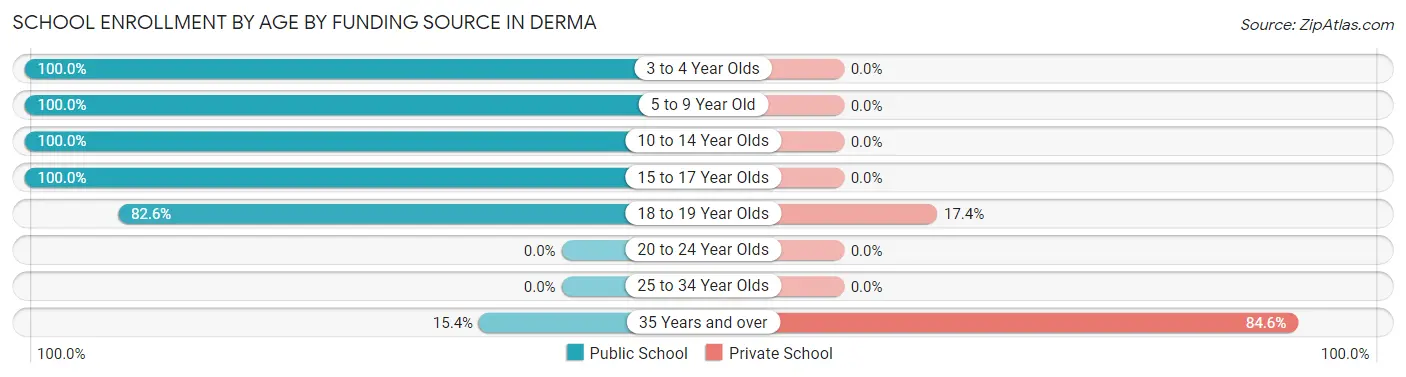
Out of a total of 184 students who are enrolled in schools in Derma, 15 (8.2%) attend a private institution, while the remaining 169 (91.8%) are enrolled in public schools. The age group of 35 years and over has the highest likelihood of being enrolled in private schools, with 11 (84.6% in the age bracket) enrolled. Conversely, the age group of 3 to 4 year olds has the lowest likelihood of being enrolled in a private school, with 22 (100.0% in the age bracket) attending a public institution.
| Age Bracket | Public School | Private School |
| 3 to 4 Year Olds | 22 (100.0%) | 0 (0.0%) |
| 5 to 9 Year Old | 8 (100.0%) | 0 (0.0%) |
| 10 to 14 Year Olds | 81 (100.0%) | 0 (0.0%) |
| 15 to 17 Year Olds | 37 (100.0%) | 0 (0.0%) |
| 18 to 19 Year Olds | 19 (82.6%) | 4 (17.4%) |
| 20 to 24 Year Olds | 0 (0.0%) | 0 (0.0%) |
| 25 to 34 Year Olds | 0 (0.0%) | 0 (0.0%) |
| 35 Years and over | 2 (15.4%) | 11 (84.6%) |
| Total | 169 (91.8%) | 15 (8.2%) |
Educational Attainment by Field of Study in Derma
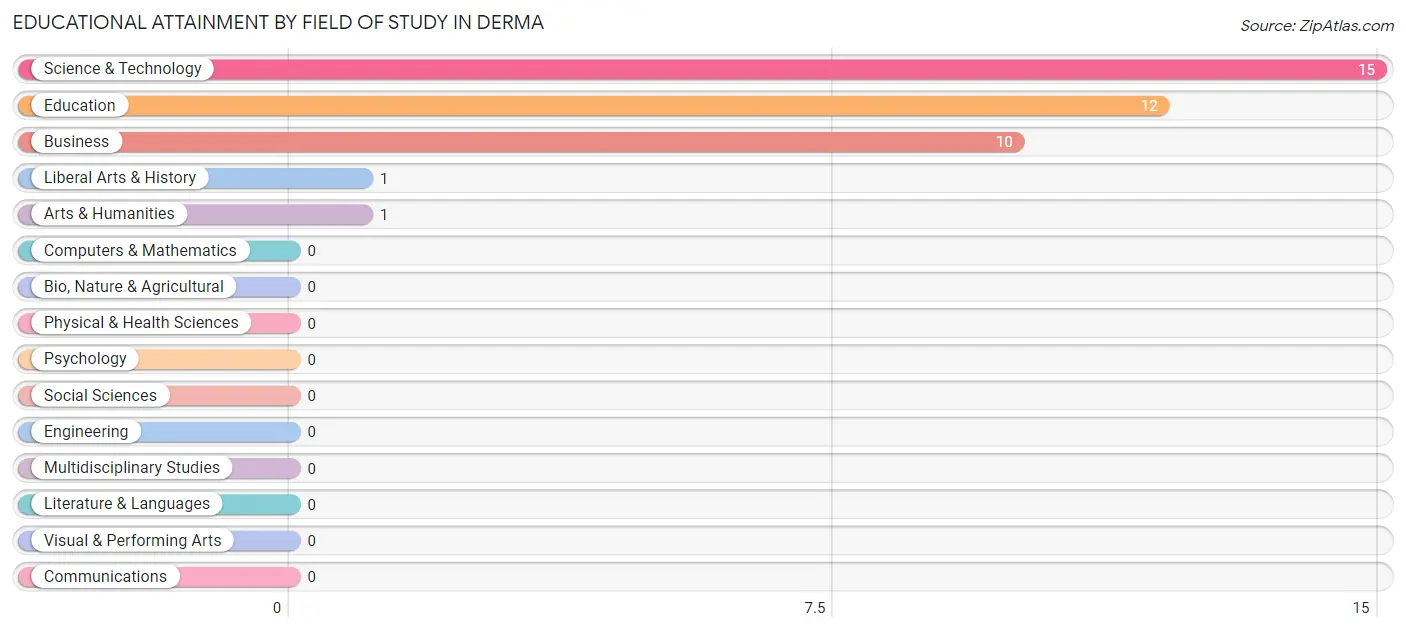
Science & technology (15 | 38.5%), education (12 | 30.8%), business (10 | 25.6%), liberal arts & history (1 | 2.6%), and arts & humanities (1 | 2.6%) are the most common fields of study among 39 individuals in Derma who have obtained a bachelor's degree or higher.
| Field of Study | # Graduates | % Graduates |
| Computers & Mathematics | 0 | 0.0% |
| Bio, Nature & Agricultural | 0 | 0.0% |
| Physical & Health Sciences | 0 | 0.0% |
| Psychology | 0 | 0.0% |
| Social Sciences | 0 | 0.0% |
| Engineering | 0 | 0.0% |
| Multidisciplinary Studies | 0 | 0.0% |
| Science & Technology | 15 | 38.5% |
| Business | 10 | 25.6% |
| Education | 12 | 30.8% |
| Literature & Languages | 0 | 0.0% |
| Liberal Arts & History | 1 | 2.6% |
| Visual & Performing Arts | 0 | 0.0% |
| Communications | 0 | 0.0% |
| Arts & Humanities | 1 | 2.6% |
| Total | 39 | 100.0% |
Transportation & Commute in Derma
Vehicle Availability by Sex in Derma
The most prevalent vehicle ownership categories in Derma are males with 2 vehicles (52, accounting for 40.6%) and females with 2 vehicles (76, making up 29.4%).
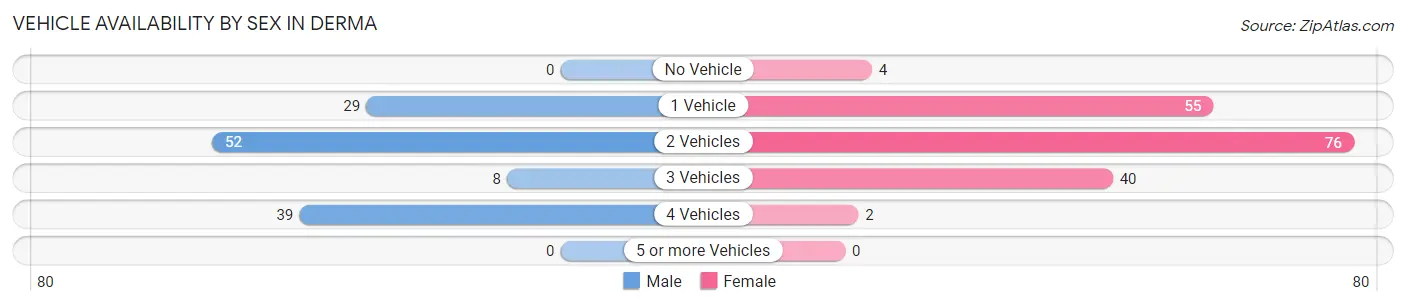
| Vehicles Available | Male | Female |
| No Vehicle | 0 (0.0%) | 4 (2.3%) |
| 1 Vehicle | 29 (22.7%) | 55 (31.1%) |
| 2 Vehicles | 52 (40.6%) | 76 (42.9%) |
| 3 Vehicles | 8 (6.2%) | 40 (22.6%) |
| 4 Vehicles | 39 (30.5%) | 2 (1.1%) |
| 5 or more Vehicles | 0 (0.0%) | 0 (0.0%) |
| Total | 128 (100.0%) | 177 (100.0%) |
Commute Time in Derma
The most frequently occuring commute durations in Derma are 45 to 59 minutes (59 commuters, 19.3%), 5 to 9 minutes (56 commuters, 18.4%), and 10 to 14 minutes (44 commuters, 14.4%).
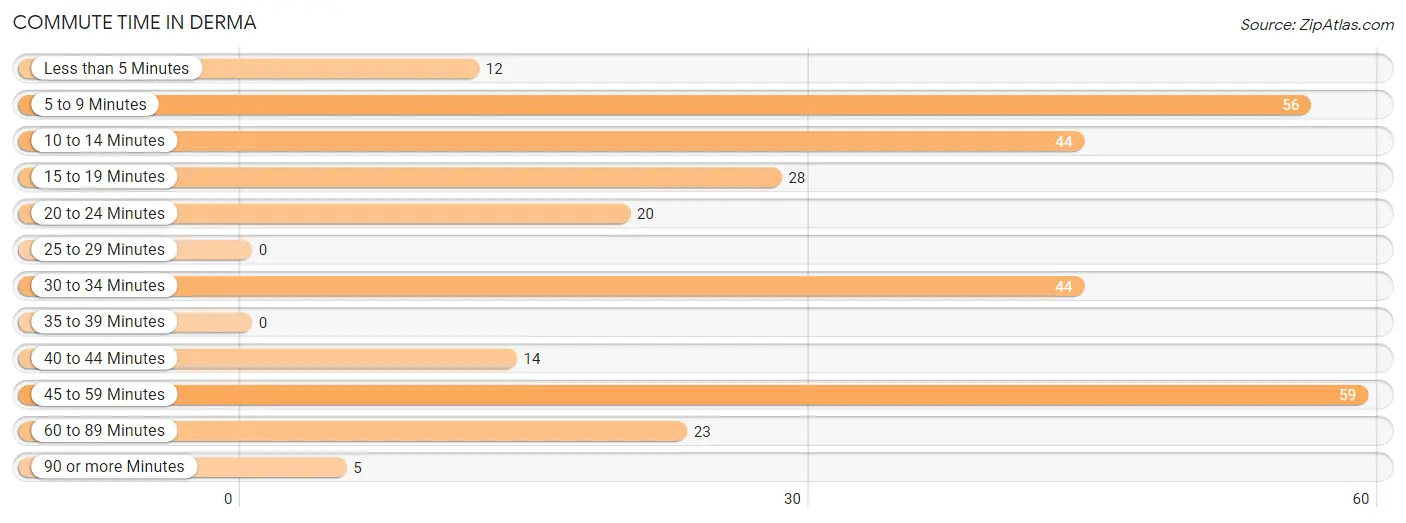
| Commute Time | # Commuters | % Commuters |
| Less than 5 Minutes | 12 | 3.9% |
| 5 to 9 Minutes | 56 | 18.4% |
| 10 to 14 Minutes | 44 | 14.4% |
| 15 to 19 Minutes | 28 | 9.2% |
| 20 to 24 Minutes | 20 | 6.6% |
| 25 to 29 Minutes | 0 | 0.0% |
| 30 to 34 Minutes | 44 | 14.4% |
| 35 to 39 Minutes | 0 | 0.0% |
| 40 to 44 Minutes | 14 | 4.6% |
| 45 to 59 Minutes | 59 | 19.3% |
| 60 to 89 Minutes | 23 | 7.5% |
| 90 or more Minutes | 5 | 1.6% |
Commute Time by Sex in Derma
The most common commute times in Derma are 30 to 34 minutes (25 commuters, 19.5%) for males and 5 to 9 minutes (39 commuters, 22.0%) for females.
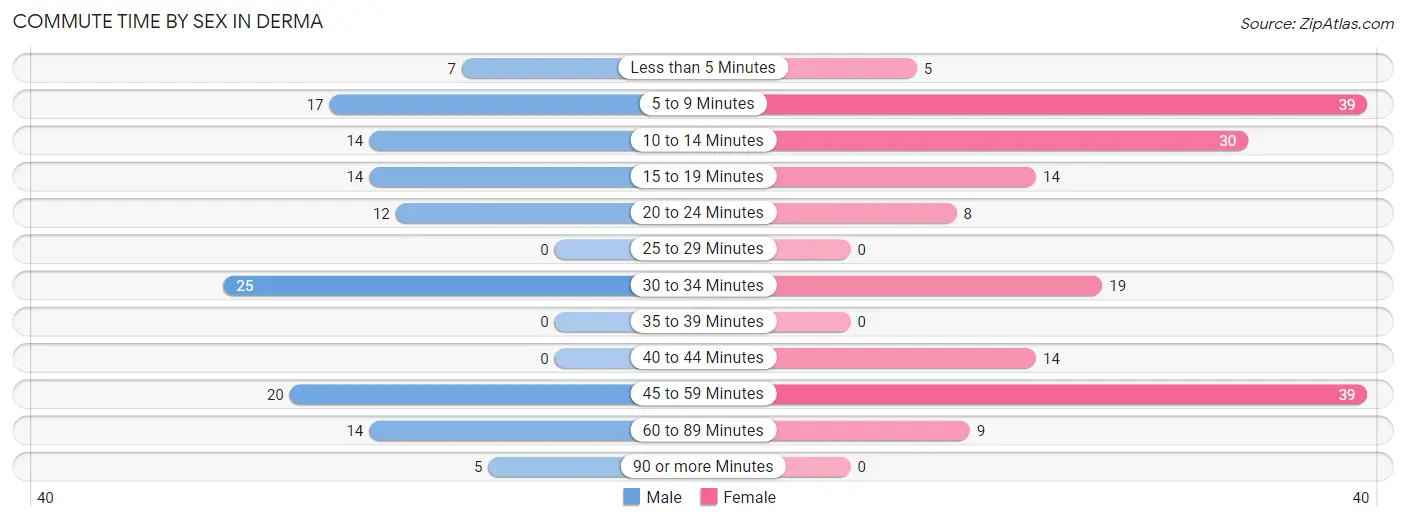
| Commute Time | Male | Female |
| Less than 5 Minutes | 7 (5.5%) | 5 (2.8%) |
| 5 to 9 Minutes | 17 (13.3%) | 39 (22.0%) |
| 10 to 14 Minutes | 14 (10.9%) | 30 (17.0%) |
| 15 to 19 Minutes | 14 (10.9%) | 14 (7.9%) |
| 20 to 24 Minutes | 12 (9.4%) | 8 (4.5%) |
| 25 to 29 Minutes | 0 (0.0%) | 0 (0.0%) |
| 30 to 34 Minutes | 25 (19.5%) | 19 (10.7%) |
| 35 to 39 Minutes | 0 (0.0%) | 0 (0.0%) |
| 40 to 44 Minutes | 0 (0.0%) | 14 (7.9%) |
| 45 to 59 Minutes | 20 (15.6%) | 39 (22.0%) |
| 60 to 89 Minutes | 14 (10.9%) | 9 (5.1%) |
| 90 or more Minutes | 5 (3.9%) | 0 (0.0%) |
Time of Departure to Work by Sex in Derma
The most frequent times of departure to work in Derma are 5:30 AM to 5:59 AM (56, 43.8%) for males and 4:00 PM to 11:59 PM (50, 28.2%) for females.
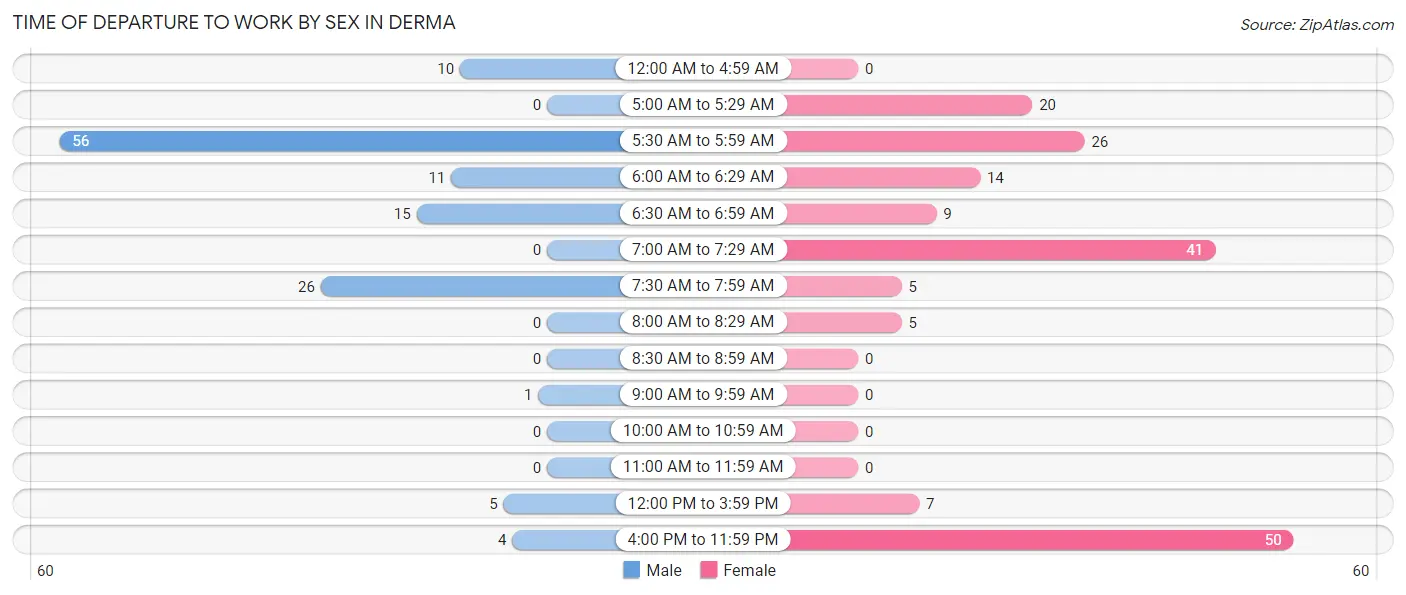
| Time of Departure | Male | Female |
| 12:00 AM to 4:59 AM | 10 (7.8%) | 0 (0.0%) |
| 5:00 AM to 5:29 AM | 0 (0.0%) | 20 (11.3%) |
| 5:30 AM to 5:59 AM | 56 (43.8%) | 26 (14.7%) |
| 6:00 AM to 6:29 AM | 11 (8.6%) | 14 (7.9%) |
| 6:30 AM to 6:59 AM | 15 (11.7%) | 9 (5.1%) |
| 7:00 AM to 7:29 AM | 0 (0.0%) | 41 (23.2%) |
| 7:30 AM to 7:59 AM | 26 (20.3%) | 5 (2.8%) |
| 8:00 AM to 8:29 AM | 0 (0.0%) | 5 (2.8%) |
| 8:30 AM to 8:59 AM | 0 (0.0%) | 0 (0.0%) |
| 9:00 AM to 9:59 AM | 1 (0.8%) | 0 (0.0%) |
| 10:00 AM to 10:59 AM | 0 (0.0%) | 0 (0.0%) |
| 11:00 AM to 11:59 AM | 0 (0.0%) | 0 (0.0%) |
| 12:00 PM to 3:59 PM | 5 (3.9%) | 7 (4.0%) |
| 4:00 PM to 11:59 PM | 4 (3.1%) | 50 (28.2%) |
| Total | 128 (100.0%) | 177 (100.0%) |
Housing Occupancy in Derma
Occupancy by Ownership in Derma
Of the total 324 dwellings in Derma, owner-occupied units account for 186 (57.4%), while renter-occupied units make up 138 (42.6%).
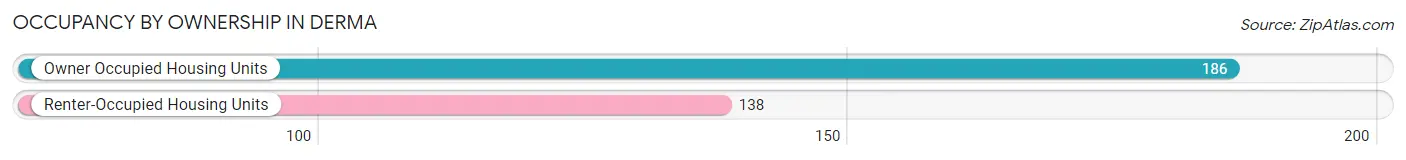
| Occupancy | # Housing Units | % Housing Units |
| Owner Occupied Housing Units | 186 | 57.4% |
| Renter-Occupied Housing Units | 138 | 42.6% |
| Total Occupied Housing Units | 324 | 100.0% |
Occupancy by Household Size in Derma
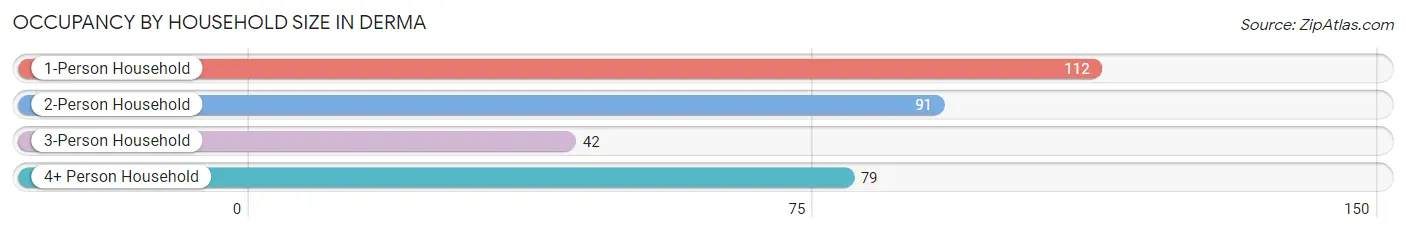
| Household Size | # Housing Units | % Housing Units |
| 1-Person Household | 112 | 34.6% |
| 2-Person Household | 91 | 28.1% |
| 3-Person Household | 42 | 13.0% |
| 4+ Person Household | 79 | 24.4% |
| Total Housing Units | 324 | 100.0% |
Occupancy by Ownership by Household Size in Derma
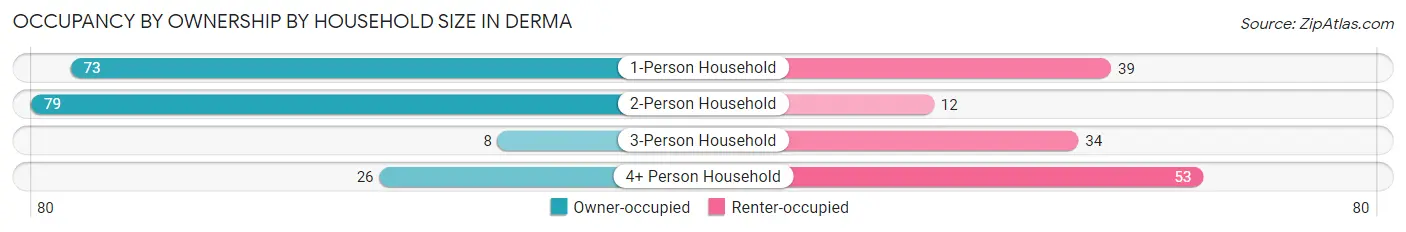
| Household Size | Owner-occupied | Renter-occupied |
| 1-Person Household | 73 (65.2%) | 39 (34.8%) |
| 2-Person Household | 79 (86.8%) | 12 (13.2%) |
| 3-Person Household | 8 (19.1%) | 34 (80.9%) |
| 4+ Person Household | 26 (32.9%) | 53 (67.1%) |
| Total Housing Units | 186 (57.4%) | 138 (42.6%) |
Occupancy by Educational Attainment in Derma
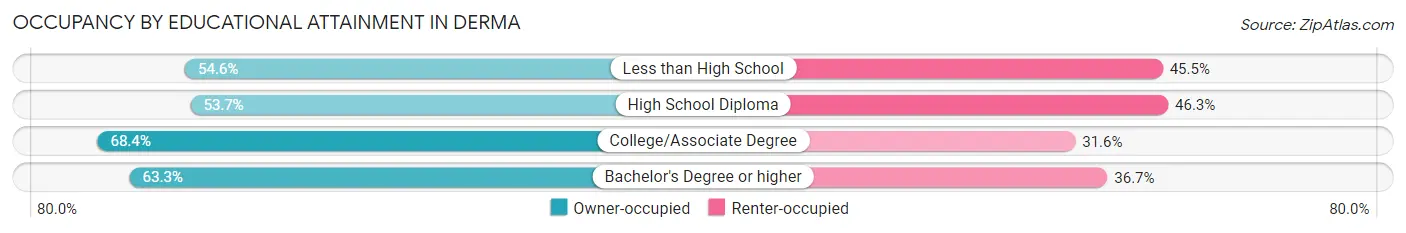
| Household Size | Owner-occupied | Renter-occupied |
| Less than High School | 48 (54.5%) | 40 (45.5%) |
| High School Diploma | 80 (53.7%) | 69 (46.3%) |
| College/Associate Degree | 39 (68.4%) | 18 (31.6%) |
| Bachelor's Degree or higher | 19 (63.3%) | 11 (36.7%) |
Occupancy by Age of Householder in Derma

| Age Bracket | # Households | % Households |
| Under 35 Years | 27 | 8.3% |
| 35 to 44 Years | 70 | 21.6% |
| 45 to 54 Years | 43 | 13.3% |
| 55 to 64 Years | 98 | 30.2% |
| 65 to 74 Years | 60 | 18.5% |
| 75 to 84 Years | 13 | 4.0% |
| 85 Years and Over | 13 | 4.0% |
| Total | 324 | 100.0% |
Housing Finances in Derma
Median Income by Occupancy in Derma
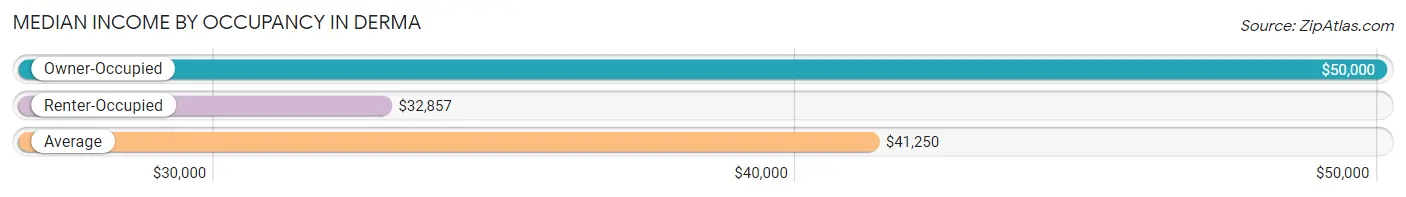
| Occupancy Type | # Households | Median Income |
| Owner-Occupied | 186 (57.4%) | $50,000 |
| Renter-Occupied | 138 (42.6%) | $32,857 |
| Average | 324 (100.0%) | $41,250 |
Occupancy by Householder Income Bracket in Derma
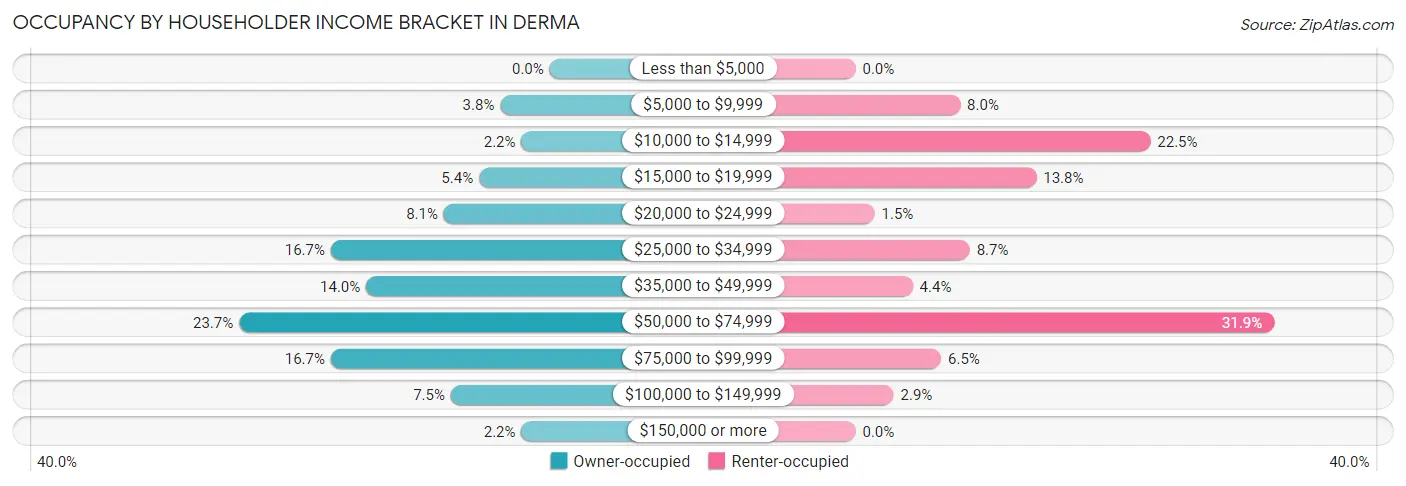
| Income Bracket | Owner-occupied | Renter-occupied |
| Less than $5,000 | 0 (0.0%) | 0 (0.0%) |
| $5,000 to $9,999 | 7 (3.8%) | 11 (8.0%) |
| $10,000 to $14,999 | 4 (2.1%) | 31 (22.5%) |
| $15,000 to $19,999 | 10 (5.4%) | 19 (13.8%) |
| $20,000 to $24,999 | 15 (8.1%) | 2 (1.5%) |
| $25,000 to $34,999 | 31 (16.7%) | 12 (8.7%) |
| $35,000 to $49,999 | 26 (14.0%) | 6 (4.3%) |
| $50,000 to $74,999 | 44 (23.7%) | 44 (31.9%) |
| $75,000 to $99,999 | 31 (16.7%) | 9 (6.5%) |
| $100,000 to $149,999 | 14 (7.5%) | 4 (2.9%) |
| $150,000 or more | 4 (2.1%) | 0 (0.0%) |
| Total | 186 (100.0%) | 138 (100.0%) |
Monthly Housing Cost Tiers in Derma
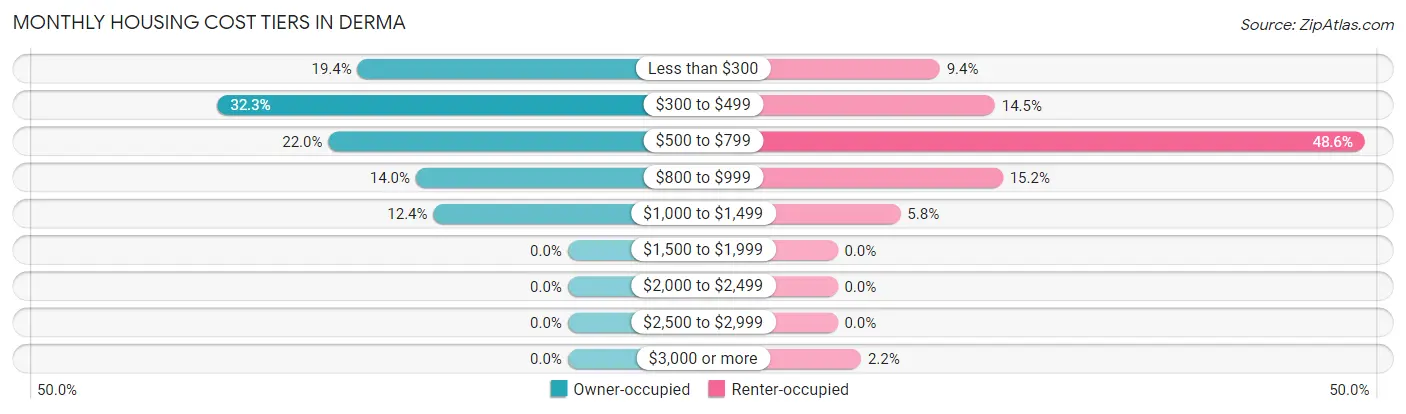
| Monthly Cost | Owner-occupied | Renter-occupied |
| Less than $300 | 36 (19.4%) | 13 (9.4%) |
| $300 to $499 | 60 (32.3%) | 20 (14.5%) |
| $500 to $799 | 41 (22.0%) | 67 (48.5%) |
| $800 to $999 | 26 (14.0%) | 21 (15.2%) |
| $1,000 to $1,499 | 23 (12.4%) | 8 (5.8%) |
| $1,500 to $1,999 | 0 (0.0%) | 0 (0.0%) |
| $2,000 to $2,499 | 0 (0.0%) | 0 (0.0%) |
| $2,500 to $2,999 | 0 (0.0%) | 0 (0.0%) |
| $3,000 or more | 0 (0.0%) | 3 (2.2%) |
| Total | 186 (100.0%) | 138 (100.0%) |
Physical Housing Characteristics in Derma
Housing Structures in Derma
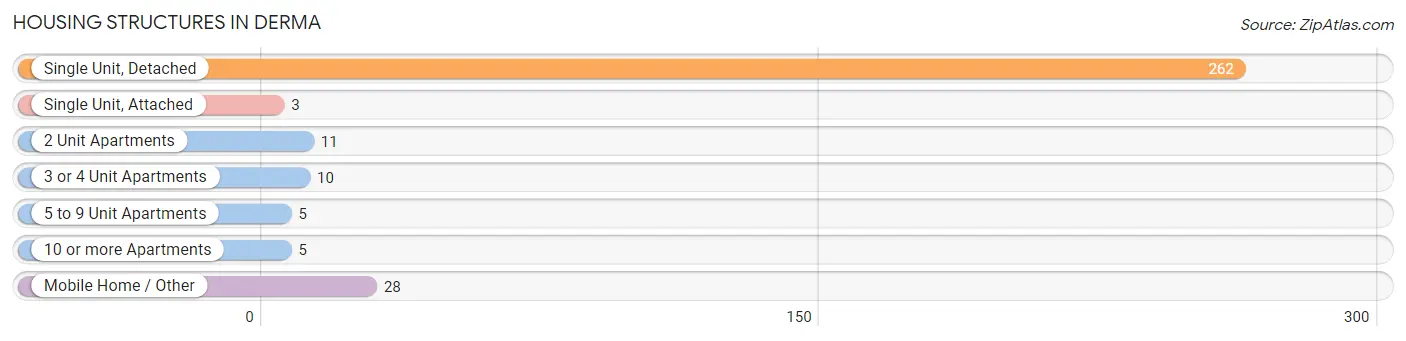
| Structure Type | # Housing Units | % Housing Units |
| Single Unit, Detached | 262 | 80.9% |
| Single Unit, Attached | 3 | 0.9% |
| 2 Unit Apartments | 11 | 3.4% |
| 3 or 4 Unit Apartments | 10 | 3.1% |
| 5 to 9 Unit Apartments | 5 | 1.5% |
| 10 or more Apartments | 5 | 1.5% |
| Mobile Home / Other | 28 | 8.6% |
| Total | 324 | 100.0% |
Housing Structures by Occupancy in Derma
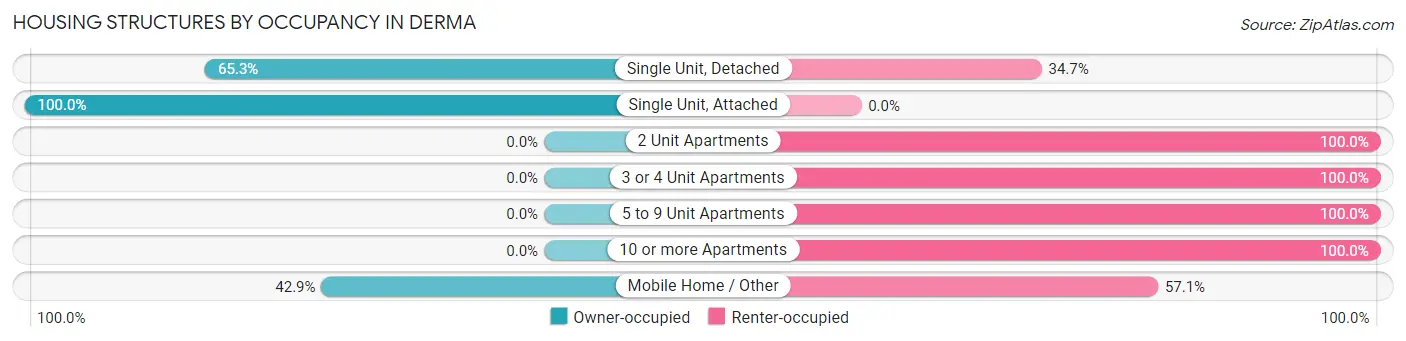
| Structure Type | Owner-occupied | Renter-occupied |
| Single Unit, Detached | 171 (65.3%) | 91 (34.7%) |
| Single Unit, Attached | 3 (100.0%) | 0 (0.0%) |
| 2 Unit Apartments | 0 (0.0%) | 11 (100.0%) |
| 3 or 4 Unit Apartments | 0 (0.0%) | 10 (100.0%) |
| 5 to 9 Unit Apartments | 0 (0.0%) | 5 (100.0%) |
| 10 or more Apartments | 0 (0.0%) | 5 (100.0%) |
| Mobile Home / Other | 12 (42.9%) | 16 (57.1%) |
| Total | 186 (57.4%) | 138 (42.6%) |
Housing Structures by Number of Rooms in Derma
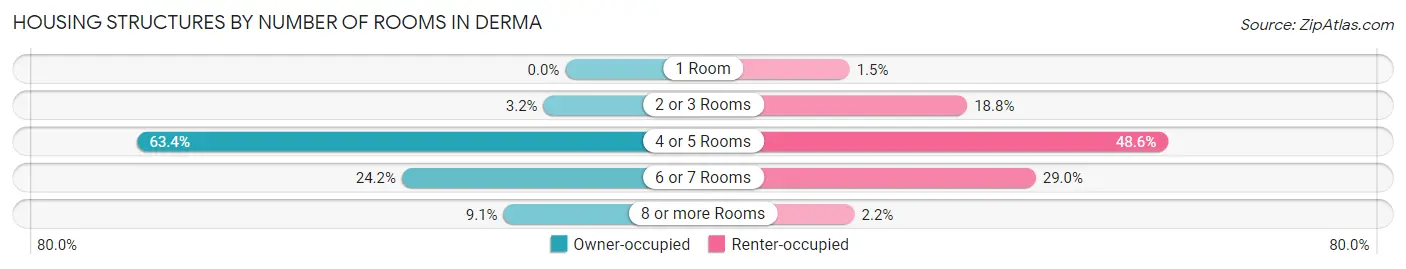
| Number of Rooms | Owner-occupied | Renter-occupied |
| 1 Room | 0 (0.0%) | 2 (1.5%) |
| 2 or 3 Rooms | 6 (3.2%) | 26 (18.8%) |
| 4 or 5 Rooms | 118 (63.4%) | 67 (48.5%) |
| 6 or 7 Rooms | 45 (24.2%) | 40 (29.0%) |
| 8 or more Rooms | 17 (9.1%) | 3 (2.2%) |
| Total | 186 (100.0%) | 138 (100.0%) |
Housing Structure by Heating Type in Derma
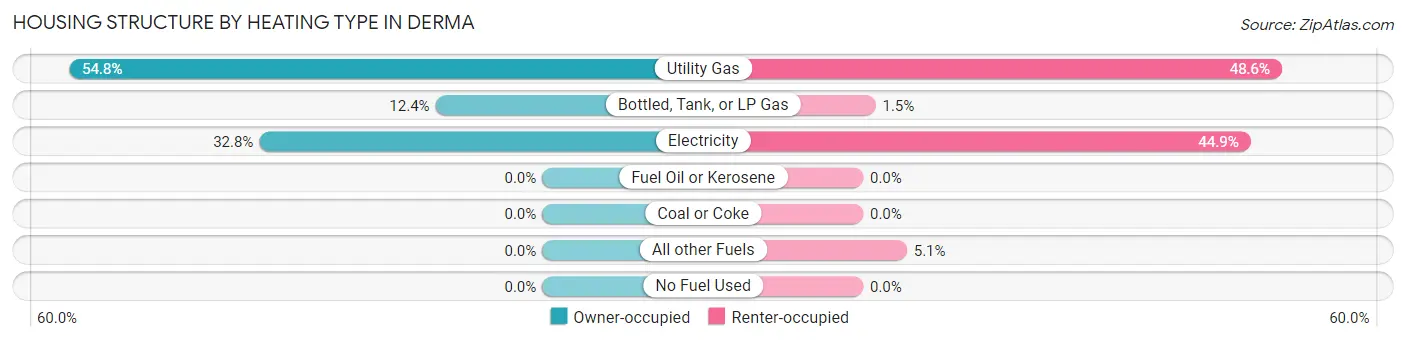
| Heating Type | Owner-occupied | Renter-occupied |
| Utility Gas | 102 (54.8%) | 67 (48.5%) |
| Bottled, Tank, or LP Gas | 23 (12.4%) | 2 (1.5%) |
| Electricity | 61 (32.8%) | 62 (44.9%) |
| Fuel Oil or Kerosene | 0 (0.0%) | 0 (0.0%) |
| Coal or Coke | 0 (0.0%) | 0 (0.0%) |
| All other Fuels | 0 (0.0%) | 7 (5.1%) |
| No Fuel Used | 0 (0.0%) | 0 (0.0%) |
| Total | 186 (100.0%) | 138 (100.0%) |
Household Vehicle Usage in Derma
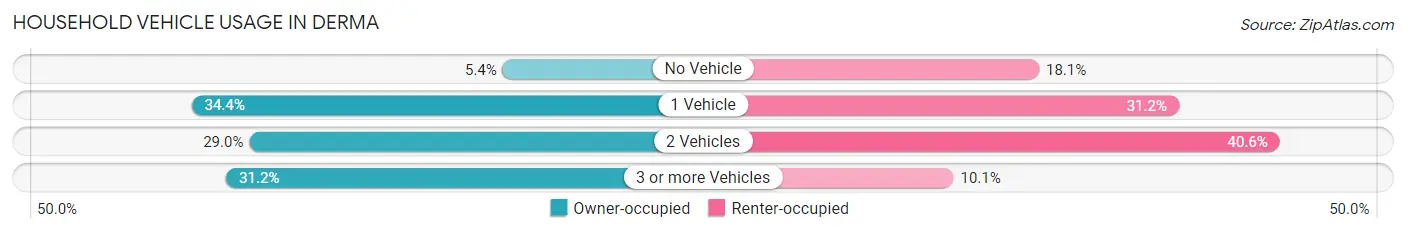
| Vehicles per Household | Owner-occupied | Renter-occupied |
| No Vehicle | 10 (5.4%) | 25 (18.1%) |
| 1 Vehicle | 64 (34.4%) | 43 (31.2%) |
| 2 Vehicles | 54 (29.0%) | 56 (40.6%) |
| 3 or more Vehicles | 58 (31.2%) | 14 (10.1%) |
| Total | 186 (100.0%) | 138 (100.0%) |
Real Estate & Mortgages in Derma
Real Estate and Mortgage Overview in Derma
| Characteristic | Without Mortgage | With Mortgage |
| Housing Units | 99 | 87 |
| Median Property Value | $59,600 | $73,500 |
| Median Household Income | $50,703 | $3 |
| Monthly Housing Costs | $332 | $0 |
| Real Estate Taxes | $612 | $41 |
Property Value by Mortgage Status in Derma
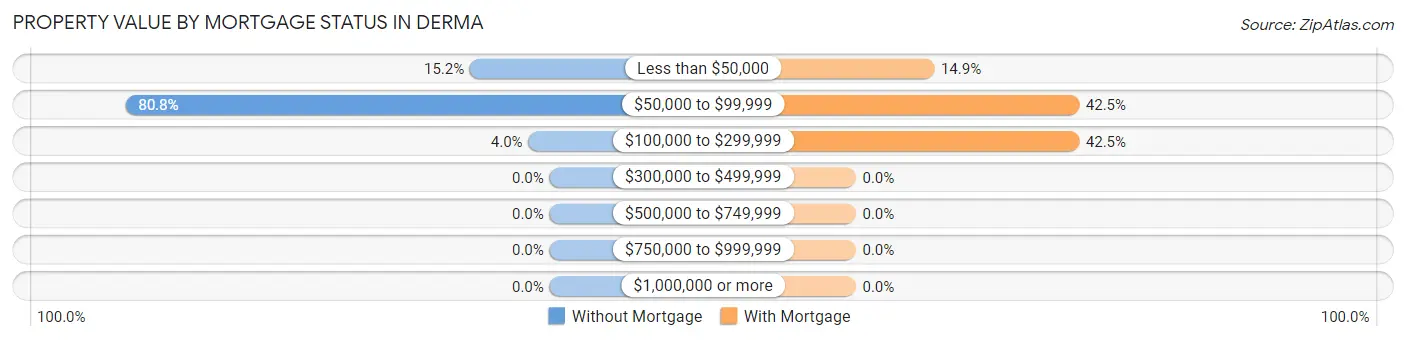
| Property Value | Without Mortgage | With Mortgage |
| Less than $50,000 | 15 (15.1%) | 13 (14.9%) |
| $50,000 to $99,999 | 80 (80.8%) | 37 (42.5%) |
| $100,000 to $299,999 | 4 (4.0%) | 37 (42.5%) |
| $300,000 to $499,999 | 0 (0.0%) | 0 (0.0%) |
| $500,000 to $749,999 | 0 (0.0%) | 0 (0.0%) |
| $750,000 to $999,999 | 0 (0.0%) | 0 (0.0%) |
| $1,000,000 or more | 0 (0.0%) | 0 (0.0%) |
| Total | 99 (100.0%) | 87 (100.0%) |
Household Income by Mortgage Status in Derma
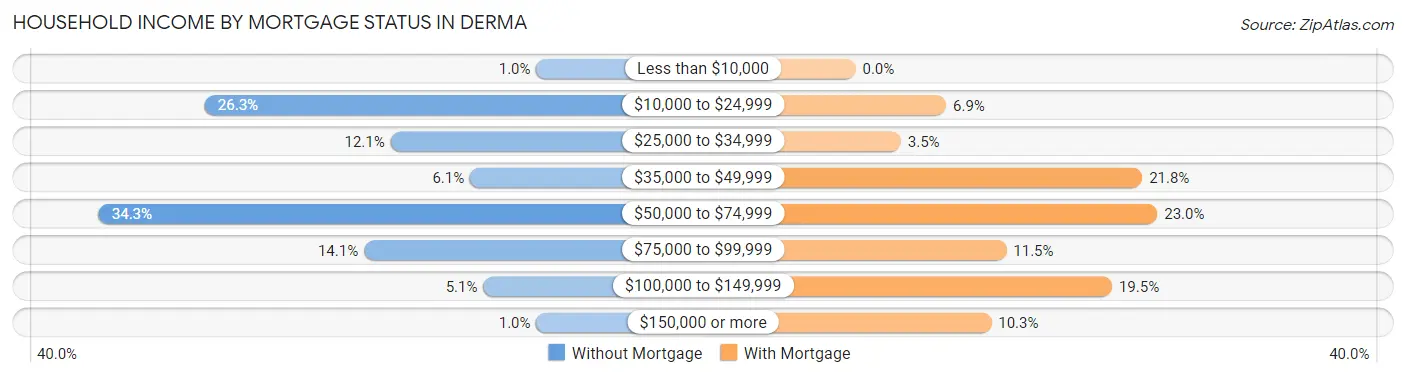
| Household Income | Without Mortgage | With Mortgage |
| Less than $10,000 | 1 (1.0%) | 0 (0.0%) |
| $10,000 to $24,999 | 26 (26.3%) | 6 (6.9%) |
| $25,000 to $34,999 | 12 (12.1%) | 3 (3.5%) |
| $35,000 to $49,999 | 6 (6.1%) | 19 (21.8%) |
| $50,000 to $74,999 | 34 (34.3%) | 20 (23.0%) |
| $75,000 to $99,999 | 14 (14.1%) | 10 (11.5%) |
| $100,000 to $149,999 | 5 (5.1%) | 17 (19.5%) |
| $150,000 or more | 1 (1.0%) | 9 (10.3%) |
| Total | 99 (100.0%) | 87 (100.0%) |
Property Value to Household Income Ratio in Derma
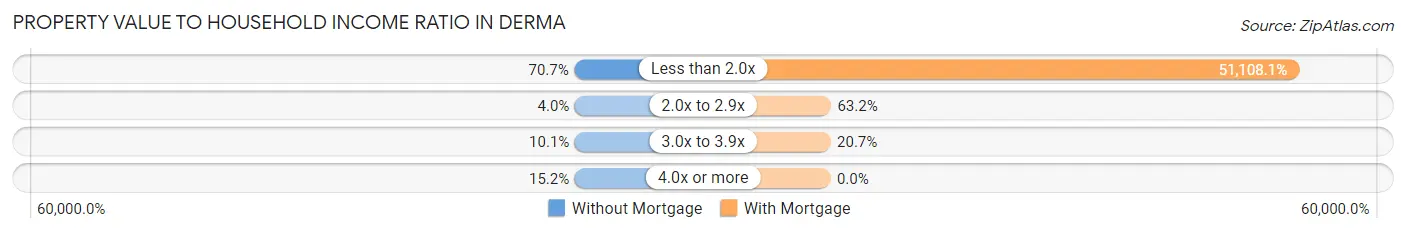
| Value-to-Income Ratio | Without Mortgage | With Mortgage |
| Less than 2.0x | 70 (70.7%) | 44,464 (51,108.0%) |
| 2.0x to 2.9x | 4 (4.0%) | 55 (63.2%) |
| 3.0x to 3.9x | 10 (10.1%) | 18 (20.7%) |
| 4.0x or more | 15 (15.1%) | 0 (0.0%) |
| Total | 99 (100.0%) | 87 (100.0%) |
Real Estate Taxes by Mortgage Status in Derma
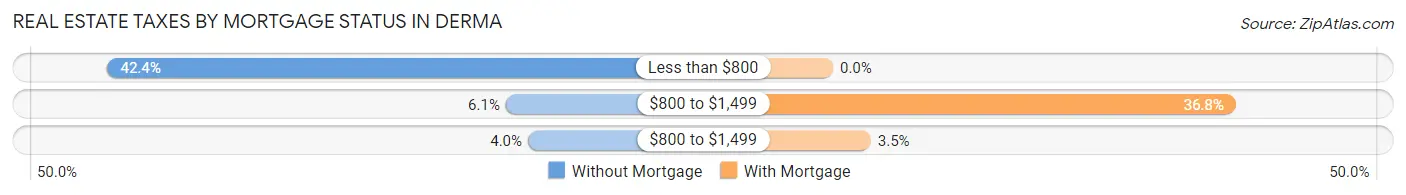
| Property Taxes | Without Mortgage | With Mortgage |
| Less than $800 | 42 (42.4%) | 0 (0.0%) |
| $800 to $1,499 | 6 (6.1%) | 32 (36.8%) |
| $800 to $1,499 | 4 (4.0%) | 3 (3.5%) |
| Total | 99 (100.0%) | 87 (100.0%) |
Health & Disability in Derma
Health Insurance Coverage by Age in Derma
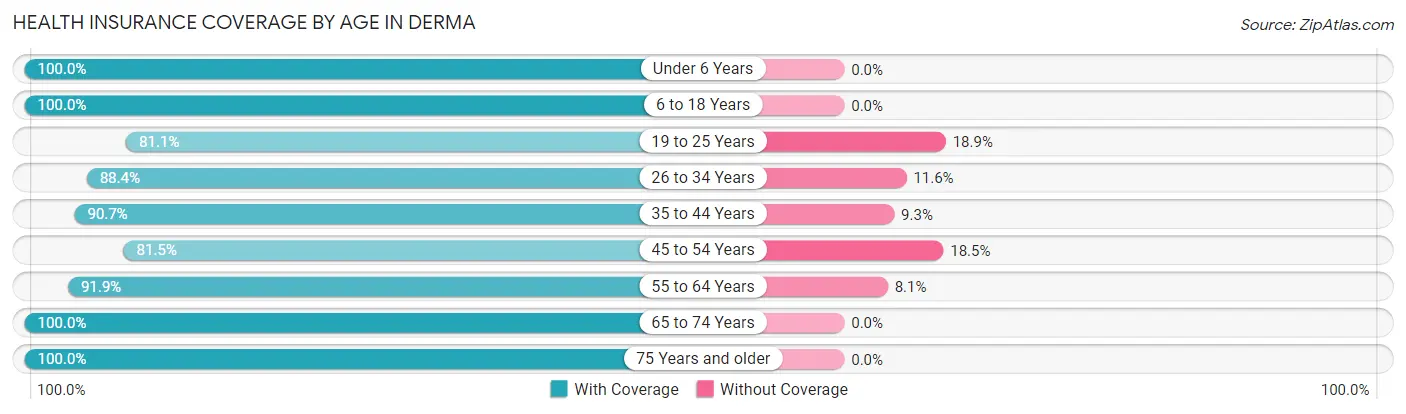
| Age Bracket | With Coverage | Without Coverage |
| Under 6 Years | 60 (100.0%) | 0 (0.0%) |
| 6 to 18 Years | 178 (100.0%) | 0 (0.0%) |
| 19 to 25 Years | 30 (81.1%) | 7 (18.9%) |
| 26 to 34 Years | 61 (88.4%) | 8 (11.6%) |
| 35 to 44 Years | 117 (90.7%) | 12 (9.3%) |
| 45 to 54 Years | 53 (81.5%) | 12 (18.5%) |
| 55 to 64 Years | 125 (91.9%) | 11 (8.1%) |
| 65 to 74 Years | 93 (100.0%) | 0 (0.0%) |
| 75 Years and older | 52 (100.0%) | 0 (0.0%) |
| Total | 769 (93.9%) | 50 (6.1%) |
Health Insurance Coverage by Citizenship Status in Derma
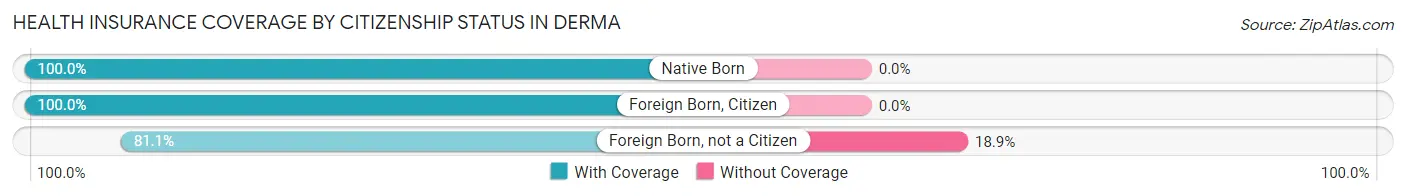
| Citizenship Status | With Coverage | Without Coverage |
| Native Born | 60 (100.0%) | 0 (0.0%) |
| Foreign Born, Citizen | 178 (100.0%) | 0 (0.0%) |
| Foreign Born, not a Citizen | 30 (81.1%) | 7 (18.9%) |
Health Insurance Coverage by Household Income in Derma
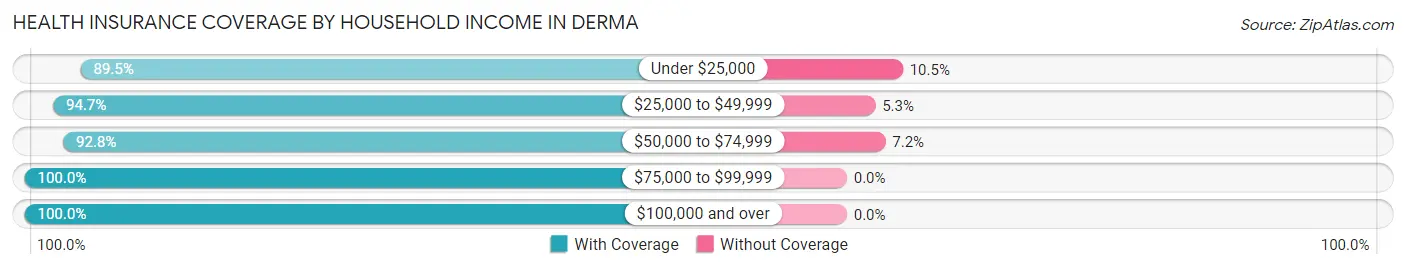
| Household Income | With Coverage | Without Coverage |
| Under $25,000 | 188 (89.5%) | 22 (10.5%) |
| $25,000 to $49,999 | 160 (94.7%) | 9 (5.3%) |
| $50,000 to $74,999 | 244 (92.8%) | 19 (7.2%) |
| $75,000 to $99,999 | 112 (100.0%) | 0 (0.0%) |
| $100,000 and over | 65 (100.0%) | 0 (0.0%) |
Public vs Private Health Insurance Coverage by Age in Derma
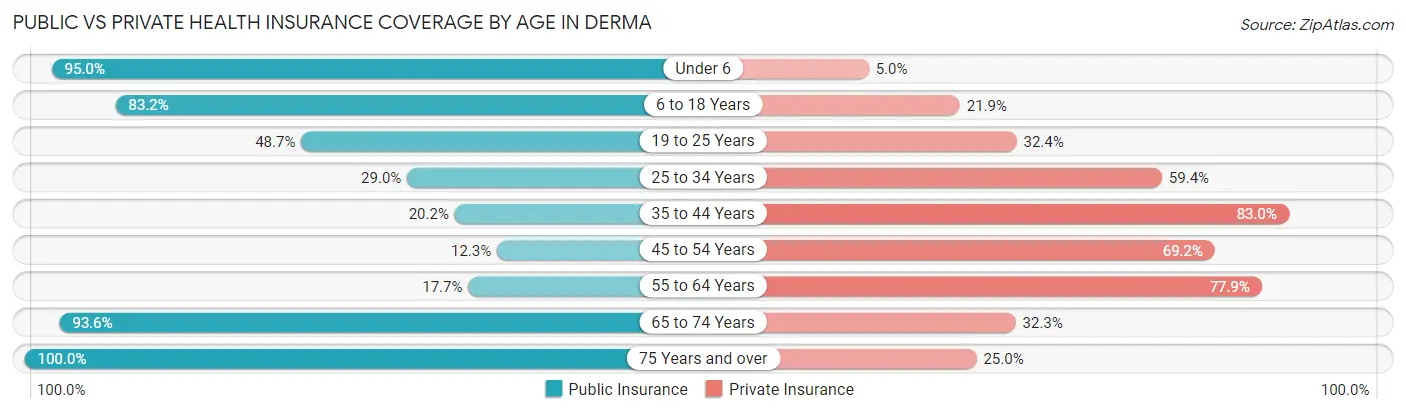
| Age Bracket | Public Insurance | Private Insurance |
| Under 6 | 57 (95.0%) | 3 (5.0%) |
| 6 to 18 Years | 148 (83.2%) | 39 (21.9%) |
| 19 to 25 Years | 18 (48.6%) | 12 (32.4%) |
| 25 to 34 Years | 20 (29.0%) | 41 (59.4%) |
| 35 to 44 Years | 26 (20.2%) | 107 (83.0%) |
| 45 to 54 Years | 8 (12.3%) | 45 (69.2%) |
| 55 to 64 Years | 24 (17.6%) | 106 (77.9%) |
| 65 to 74 Years | 87 (93.5%) | 30 (32.3%) |
| 75 Years and over | 52 (100.0%) | 13 (25.0%) |
| Total | 440 (53.7%) | 396 (48.3%) |
Disability Status by Sex by Age in Derma
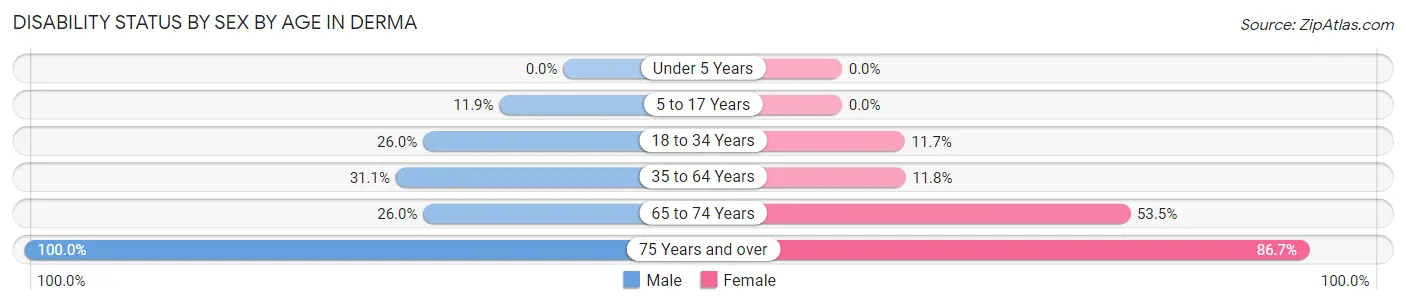
| Age Bracket | Male | Female |
| Under 5 Years | 0 (0.0%) | 0 (0.0%) |
| 5 to 17 Years | 12 (11.9%) | 0 (0.0%) |
| 18 to 34 Years | 19 (26.0%) | 7 (11.7%) |
| 35 to 64 Years | 42 (31.1%) | 23 (11.8%) |
| 65 to 74 Years | 13 (26.0%) | 23 (53.5%) |
| 75 Years and over | 22 (100.0%) | 26 (86.7%) |
Disability Class by Sex by Age in Derma
Disability Class: Hearing Difficulty
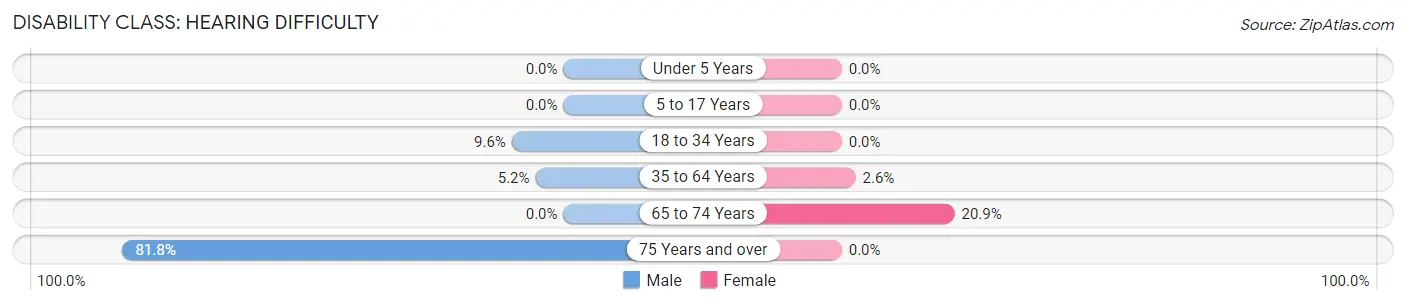
| Age Bracket | Male | Female |
| Under 5 Years | 0 (0.0%) | 0 (0.0%) |
| 5 to 17 Years | 0 (0.0%) | 0 (0.0%) |
| 18 to 34 Years | 7 (9.6%) | 0 (0.0%) |
| 35 to 64 Years | 7 (5.2%) | 5 (2.6%) |
| 65 to 74 Years | 0 (0.0%) | 9 (20.9%) |
| 75 Years and over | 18 (81.8%) | 0 (0.0%) |
Disability Class: Vision Difficulty
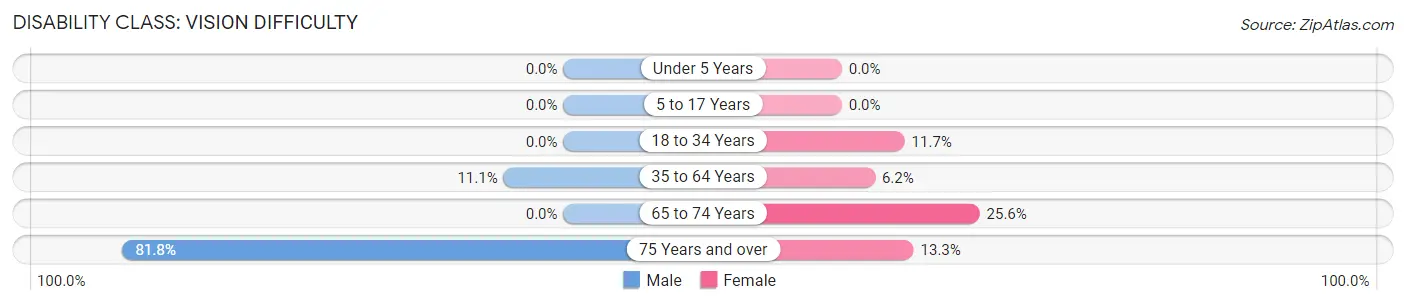
| Age Bracket | Male | Female |
| Under 5 Years | 0 (0.0%) | 0 (0.0%) |
| 5 to 17 Years | 0 (0.0%) | 0 (0.0%) |
| 18 to 34 Years | 0 (0.0%) | 7 (11.7%) |
| 35 to 64 Years | 15 (11.1%) | 12 (6.1%) |
| 65 to 74 Years | 0 (0.0%) | 11 (25.6%) |
| 75 Years and over | 18 (81.8%) | 4 (13.3%) |
Disability Class: Cognitive Difficulty
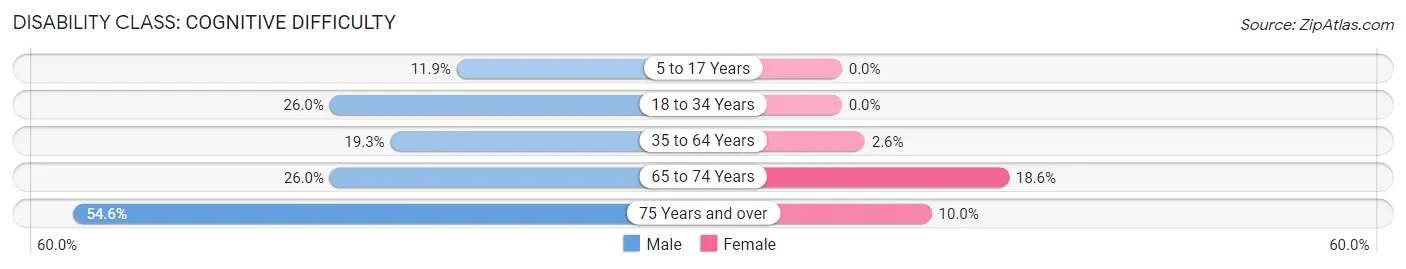
| Age Bracket | Male | Female |
| 5 to 17 Years | 12 (11.9%) | 0 (0.0%) |
| 18 to 34 Years | 19 (26.0%) | 0 (0.0%) |
| 35 to 64 Years | 26 (19.3%) | 5 (2.6%) |
| 65 to 74 Years | 13 (26.0%) | 8 (18.6%) |
| 75 Years and over | 12 (54.5%) | 3 (10.0%) |
Disability Class: Ambulatory Difficulty
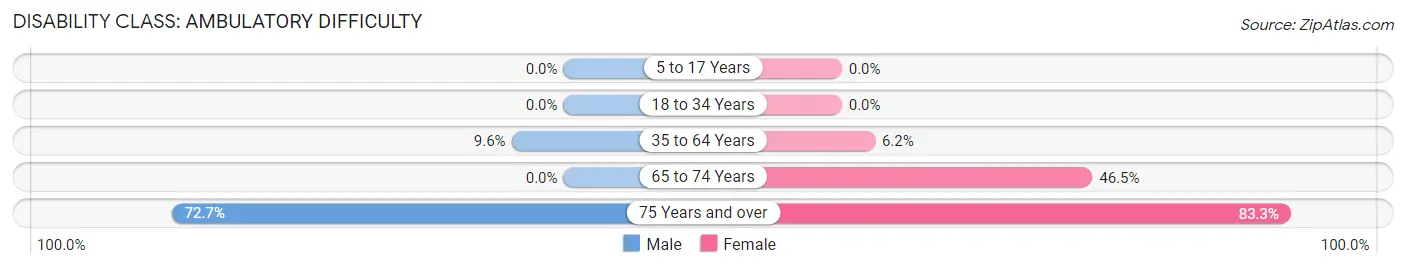
| Age Bracket | Male | Female |
| 5 to 17 Years | 0 (0.0%) | 0 (0.0%) |
| 18 to 34 Years | 0 (0.0%) | 0 (0.0%) |
| 35 to 64 Years | 13 (9.6%) | 12 (6.1%) |
| 65 to 74 Years | 0 (0.0%) | 20 (46.5%) |
| 75 Years and over | 16 (72.7%) | 25 (83.3%) |
Disability Class: Self-Care Difficulty
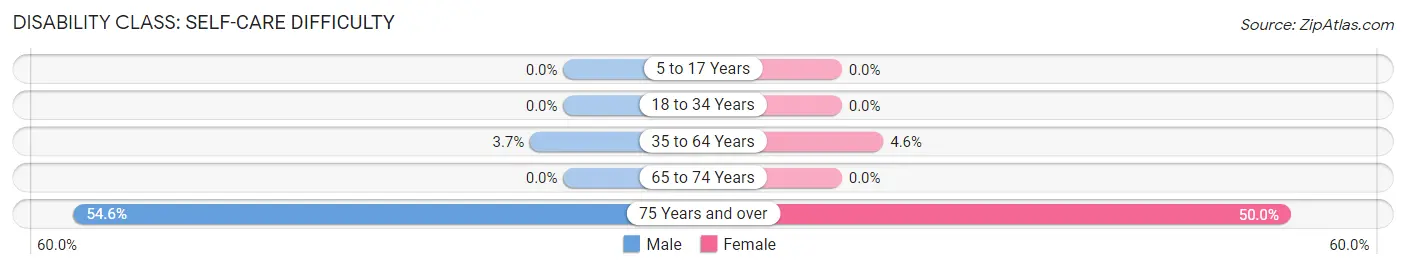
| Age Bracket | Male | Female |
| 5 to 17 Years | 0 (0.0%) | 0 (0.0%) |
| 18 to 34 Years | 0 (0.0%) | 0 (0.0%) |
| 35 to 64 Years | 5 (3.7%) | 9 (4.6%) |
| 65 to 74 Years | 0 (0.0%) | 0 (0.0%) |
| 75 Years and over | 12 (54.5%) | 15 (50.0%) |
Technology Access in Derma
Computing Device Access in Derma
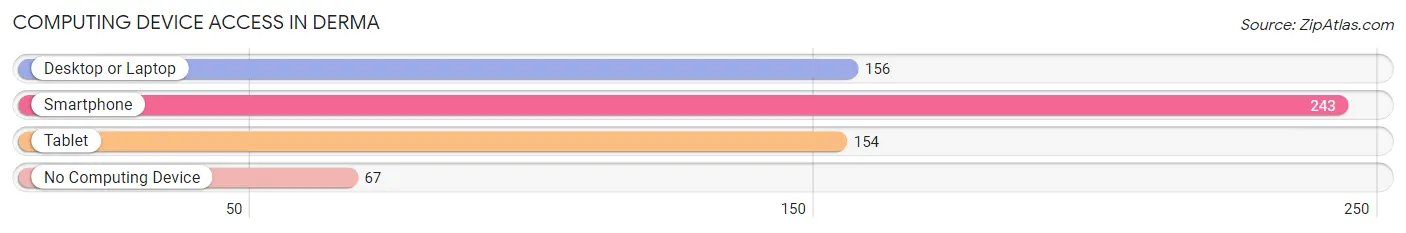
| Device Type | # Households | % Households |
| Desktop or Laptop | 156 | 48.1% |
| Smartphone | 243 | 75.0% |
| Tablet | 154 | 47.5% |
| No Computing Device | 67 | 20.7% |
| Total | 324 | 100.0% |
Internet Access in Derma
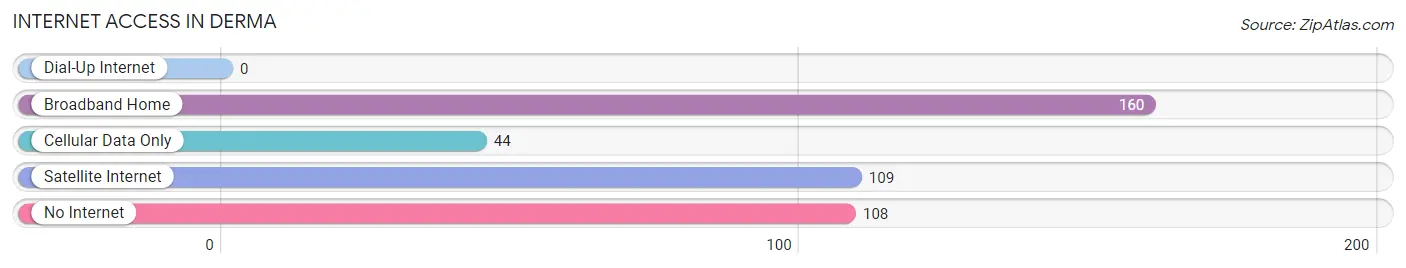
| Internet Type | # Households | % Households |
| Dial-Up Internet | 0 | 0.0% |
| Broadband Home | 160 | 49.4% |
| Cellular Data Only | 44 | 13.6% |
| Satellite Internet | 109 | 33.6% |
| No Internet | 108 | 33.3% |
| Total | 324 | 100.0% |
Derma Summary
Derma is a small town located in the state of Mississippi, United States. It is situated in the northern part of the state, near the border with Tennessee. The town has a population of approximately 1,500 people and is part of the DeSoto County.
History
Derma was founded in 1837 by a group of settlers from Tennessee. The town was named after the nearby Derma Creek, which was named after a Native American chief. The town was originally a farming community, but it soon became a trading center for the surrounding area. The town was also home to a number of small businesses, including a sawmill, a gristmill, and a cotton gin.
In the late 19th century, Derma became a popular destination for tourists. The town was known for its beautiful scenery and its many outdoor activities, such as fishing and hunting. The town also had a number of hotels and resorts, which attracted visitors from all over the country.
In the early 20th century, Derma experienced a period of economic decline. The town’s population decreased and many of the businesses closed. However, the town was able to recover in the mid-20th century, thanks to the development of the nearby Ross Barnett Reservoir. The reservoir provided the town with a new source of income and helped to revitalize the local economy.
Geography
Derma is located in the northern part of Mississippi, near the border with Tennessee. The town is situated in the hills of the Appalachian Mountains and is surrounded by forests and rolling hills. The town is located near the Ross Barnett Reservoir, which is a popular destination for fishing and boating.
The town has a humid subtropical climate, with hot summers and mild winters. The average annual temperature is around 70 degrees Fahrenheit (21 degrees Celsius). The town receives an average of 48 inches (122 cm) of precipitation each year.
Economy
Derma’s economy is largely based on tourism and agriculture. The town is home to a number of small businesses, including restaurants, shops, and hotels. The town also has a number of farms, which produce a variety of crops, including corn, soybeans, and cotton.
The town is also home to a number of manufacturing companies, which produce a variety of products, including furniture, clothing, and electronics. The town is also home to a number of small businesses, such as auto repair shops and beauty salons.
Demographics
As of the 2010 census, the population of Derma was 1,500 people. The town has a population density of approximately 545 people per square mile (210 people per square kilometer). The town is predominantly white, with approximately 95% of the population being white. The town also has a small African American population, with approximately 4% of the population being African American. The town also has a small Hispanic population, with approximately 1% of the population being Hispanic.
Common Questions
What is the Total Population of Derma?
Total Population of Derma is 819.
What is the Total Male Population of Derma?
Total Male Population of Derma is 427.
What is the Total Female Population of Derma?
Total Female Population of Derma is 392.
What is the Ratio of Males per 100 Females in Derma?
There are 108.93 Males per 100 Females in Derma.
What is the Ratio of Females per 100 Males in Derma?
There are 91.80 Females per 100 Males in Derma.
What is the Median Population Age in Derma?
Median Population Age in Derma is 38.9 Years.
What is the Average Family Size in Derma
Average Family Size in Derma is 3.3 People.
What is the Average Household Size in Derma
Average Household Size in Derma is 2.5 People.
What is Per Capita Income in Derma?
Per Capita income in Derma is $19,022.
What is the Median Family Income in Derma?
Median Family Income in Derma is $50,677.
What is the Median Household income in Derma?
Median Household Income in Derma is $41,250.
What is Income or Wage Gap in Derma?
Income or Wage Gap in Derma is 34.2%.
Women in Derma earn 65.8 cents for every dollar earned by a man.
What is Family Income Deficit in Derma?
Family Income Deficit in Derma is $12,880.
Families that are below poverty line in Derma earn $12,880 less on average than the poverty threshold level.
What is Inequality or Gini Index in Derma?
Inequality or Gini Index in Derma is 0.38.
How Large is the Labor Force in Derma?
There are 351 People in the Labor Forcein in Derma.
What is the Percentage of People in the Labor Force in Derma?
55.1% of People are in the Labor Force in Derma.
What is the Unemployment Rate in Derma?
Unemployment Rate in Derma is 7.4%.