Webster County, MS
Webster County Overview
9,942
TOTAL POPULATION
4,754
MALE POPULATION
5,188
FEMALE POPULATION
91.63
MALES / 100 FEMALES
109.13
FEMALES / 100 MALES
40.1
MEDIAN AGE
3.0
AVG FAMILY SIZE
2.4
AVG HOUSEHOLD SIZE
$27,836
PER CAPITA INCOME
$71,418
AVG FAMILY INCOME
$55,657
AVG HOUSEHOLD INCOME
38.6%
WAGE / INCOME GAP [ % ]
61.4¢/ $1
WAGE / INCOME GAP [ $ ]
0.41
INEQUALITY / GINI INDEX
4,393
LABOR FORCE [ PEOPLE ]
56.3%
PERCENT IN LABOR FORCE
6.4%
UNEMPLOYMENT RATE
Webster County Area Codes
Race in Webster County
The most populous races in Webster County are White / Caucasian (7,874 | 79.2%), Black / African American (1,838 | 18.5%), and Hispanic or Latino (157 | 1.6%).

| Race | # Population | % Population |
| Asian | 80 | 0.8% |
| Black / African American | 1,838 | 18.5% |
| Hawaiian / Pacific | 0 | 0.0% |
| Hispanic or Latino | 157 | 1.6% |
| Native / Alaskan | 12 | 0.1% |
| White / Caucasian | 7,874 | 79.2% |
| Two or more Races | 99 | 1.0% |
| Some other Race | 39 | 0.4% |
| Total | 9,942 | 100.0% |
Ancestry in Webster County
The most populous ancestries reported in Webster County are English (1,918 | 19.3%), American (1,582 | 15.9%), Irish (1,134 | 11.4%), German (438 | 4.4%), and African (263 | 2.6%), together accounting for 53.7% of all Webster County residents.

| Ancestry | # Population | % Population |
| African | 263 | 2.6% |
| American | 1,582 | 15.9% |
| Bhutanese | 4 | 0.0% |
| British | 40 | 0.4% |
| Cajun | 17 | 0.2% |
| Canadian | 5 | 0.1% |
| Central American | 1 | 0.0% |
| Cherokee | 3 | 0.0% |
| Dutch | 29 | 0.3% |
| Ecuadorian | 25 | 0.3% |
| English | 1,918 | 19.3% |
| European | 162 | 1.6% |
| French | 40 | 0.4% |
| French Canadian | 3 | 0.0% |
| German | 438 | 4.4% |
| Houma | 3 | 0.0% |
| Indian (Asian) | 59 | 0.6% |
| Iranian | 18 | 0.2% |
| Irish | 1,134 | 11.4% |
| Italian | 129 | 1.3% |
| Korean | 20 | 0.2% |
| Mexican | 87 | 0.9% |
| Northern European | 16 | 0.2% |
| Polish | 41 | 0.4% |
| Puerto Rican | 2 | 0.0% |
| Salvadoran | 1 | 0.0% |
| Scandinavian | 15 | 0.2% |
| Scotch-Irish | 143 | 1.4% |
| Scottish | 134 | 1.3% |
| South American | 25 | 0.3% |
| Subsaharan African | 263 | 2.6% |
| Swedish | 2 | 0.0% |
| Thai | 9 | 0.1% |
| Welsh | 24 | 0.2% | View All 34 Rows |
Immigrants in Webster County
The most numerous immigrant groups reported in Webster County came from Asia (57 | 0.6%), Eastern Asia (33 | 0.3%), China (29 | 0.3%), South Central Asia (16 | 0.2%), and Central America (11 | 0.1%), together accounting for 1.5% of all Webster County residents.

| Immigration Origin | # Population | % Population |
| Asia | 57 | 0.6% |
| Central America | 11 | 0.1% |
| China | 29 | 0.3% |
| Eastern Asia | 33 | 0.3% |
| El Salvador | 1 | 0.0% |
| England | 4 | 0.0% |
| Europe | 4 | 0.0% |
| India | 9 | 0.1% |
| Iran | 7 | 0.1% |
| Japan | 4 | 0.0% |
| Latin America | 11 | 0.1% |
| Mexico | 10 | 0.1% |
| Northern Europe | 4 | 0.0% |
| Philippines | 8 | 0.1% |
| South Central Asia | 16 | 0.2% |
| South Eastern Asia | 8 | 0.1% | View All 16 Rows |
Sex and Age in Webster County
Sex and Age in Webster County
The most populous age groups in Webster County are 15 to 19 Years (388 | 8.2%) for men and 15 to 19 Years (403 | 7.8%) for women.

| Age Bracket | Male | Female |
| Under 5 Years | 265 (5.6%) | 357 (6.9%) |
| 5 to 9 Years | 303 (6.4%) | 321 (6.2%) |
| 10 to 14 Years | 361 (7.6%) | 342 (6.6%) |
| 15 to 19 Years | 388 (8.2%) | 403 (7.8%) |
| 20 to 24 Years | 203 (4.3%) | 244 (4.7%) |
| 25 to 29 Years | 313 (6.6%) | 231 (4.4%) |
| 30 to 34 Years | 262 (5.5%) | 311 (6.0%) |
| 35 to 39 Years | 293 (6.2%) | 358 (6.9%) |
| 40 to 44 Years | 255 (5.4%) | 245 (4.7%) |
| 45 to 49 Years | 271 (5.7%) | 269 (5.2%) |
| 50 to 54 Years | 369 (7.8%) | 330 (6.4%) |
| 55 to 59 Years | 294 (6.2%) | 311 (6.0%) |
| 60 to 64 Years | 378 (8.0%) | 389 (7.5%) |
| 65 to 69 Years | 339 (7.1%) | 307 (5.9%) |
| 70 to 74 Years | 182 (3.8%) | 271 (5.2%) |
| 75 to 79 Years | 171 (3.6%) | 275 (5.3%) |
| 80 to 84 Years | 38 (0.8%) | 116 (2.2%) |
| 85 Years and over | 69 (1.5%) | 108 (2.1%) |
| Total | 4,754 (100.0%) | 5,188 (100.0%) |
Families and Households in Webster County
Median Family Size in Webster County
The median family size in Webster County is 2.98 persons per family, with married-couple families (2,004 | 71.9%) accounting for the largest median family size of 3.03 persons per family. On the other hand, single male/father families (143 | 5.1%) represent the smallest median family size with 2.70 persons per family.

| Family Type | # Families | Family Size |
| Married-Couple | 2,004 (71.9%) | 3.03 |
| Single Male/Father | 143 (5.1%) | 2.70 |
| Single Female/Mother | 639 (22.9%) | 2.90 |
| Total Families | 2,786 (100.0%) | 2.98 |
Median Household Size in Webster County
The median household size in Webster County is 2.42 persons per household, with single male/father households (143 | 3.5%) accounting for the largest median household size of 3.06 persons per household. non-family households (1,279 | 31.5%) represent the smallest median household size with 1.13 persons per household.

| Household Type | # Households | Household Size |
| Married-Couple | 2,004 (49.3%) | 3.04 |
| Single Male/Father | 143 (3.5%) | 3.06 |
| Single Female/Mother | 639 (15.7%) | 2.95 |
| Non-family | 1,279 (31.5%) | 1.13 |
| Total Households | 4,065 (100.0%) | 2.42 |
Household Size by Marriage Status in Webster County
Out of a total of 4,065 households in Webster County, 2,786 (68.5%) are family households, while 1,279 (31.5%) are nonfamily households. The most numerous type of family households are 2-person households, comprising 1,324, and the most common type of nonfamily households are 1-person households, comprising 1,110.

| Household Size | Family Households | Nonfamily Households |
| 1-Person Households | - | 1,110 (27.3%) |
| 2-Person Households | 1,324 (32.6%) | 148 (3.6%) |
| 3-Person Households | 635 (15.6%) | 21 (0.5%) |
| 4-Person Households | 478 (11.8%) | 0 (0.0%) |
| 5-Person Households | 314 (7.7%) | 0 (0.0%) |
| 6-Person Households | 35 (0.9%) | 0 (0.0%) |
| 7+ Person Households | 0 (0.0%) | 0 (0.0%) |
| Total | 2,786 (68.5%) | 1,279 (31.5%) |
Female Fertility in Webster County
Fertility by Age in Webster County
Average fertility rate in Webster County is 96.0 births per 1,000 women. Women in the age bracket of 20 to 34 years have the highest fertility rate with 183.0 births per 1,000 women. Women in the age bracket of 20 to 34 years acount for 68.6% of all women with births.
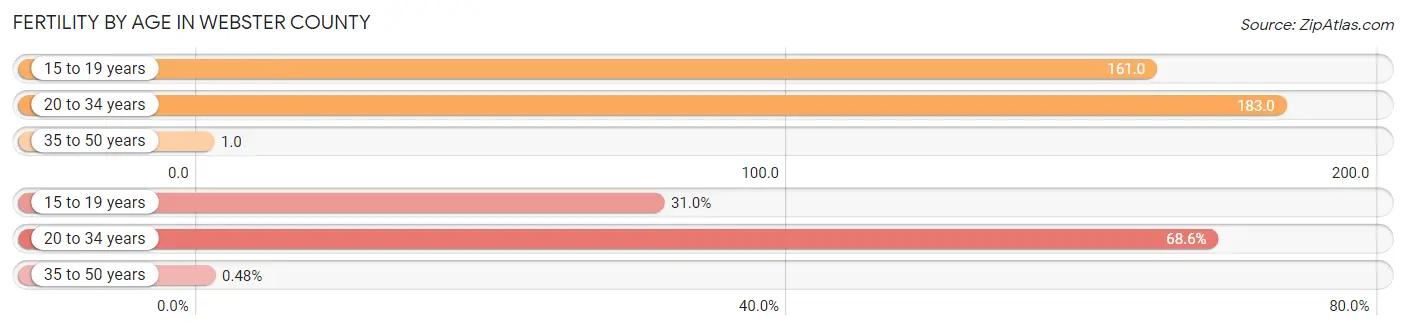
| Age Bracket | Women with Births | Births / 1,000 Women |
| 15 to 19 years | 65 (30.9%) | 161.0 |
| 20 to 34 years | 144 (68.6%) | 183.0 |
| 35 to 50 years | 1 (0.5%) | 1.0 |
| Total | 210 (100.0%) | 96.0 |
Fertility by Age by Marriage Status in Webster County
71.0% of women with births (210) in Webster County are married. The highest percentage of unmarried women with births falls into 35 to 50 years age bracket with 100.0% of them unmarried at the time of birth, while the lowest percentage of unmarried women with births belong to 15 to 19 years age bracket with 0.0% of them unmarried.

| Age Bracket | Married | Unmarried |
| 15 to 19 years | 65 (100.0%) | 0 (0.0%) |
| 20 to 34 years | 84 (58.3%) | 60 (41.7%) |
| 35 to 50 years | 0 (0.0%) | 1 (100.0%) |
| Total | 149 (71.0%) | 61 (29.0%) |
Fertility by Education in Webster County
Average fertility rate in Webster County is 96.0 births per 1,000 women. Women with the education attainment of less than high school have the highest fertility rate of 168.0 births per 1,000 women, while women with the education attainment of bachelor's degree have the lowest fertility at 18.0 births per 1,000 women. Women with the education attainment of less than high school represent 30.9% of all women with births.

| Educational Attainment | Women with Births | Births / 1,000 Women |
| Less than High School | 65 (30.9%) | 168.0 |
| High School Diploma | 61 (29.0%) | 100.0 |
| College or Associate's Degree | 65 (30.9%) | 78.0 |
| Bachelor's Degree | 4 (1.9%) | 18.0 |
| Graduate Degree | 15 (7.1%) | 121.0 |
| Total | 210 (100.0%) | 96.0 |
Fertility by Education by Marriage Status in Webster County
29.0% of women with births in Webster County are unmarried. Women with the educational attainment of less than high school are most likely to be married with 100.0% of them married at childbirth, while women with the educational attainment of college or associate's degree are least likely to be married with 93.9% of them unmarried at childbirth.
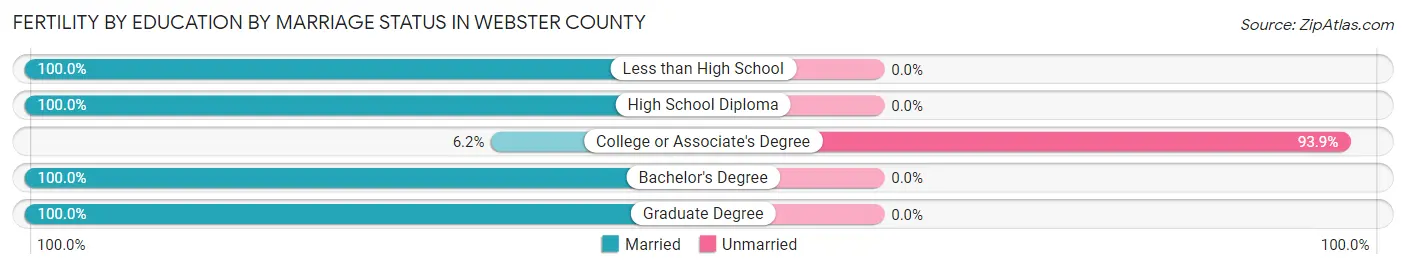
| Educational Attainment | Married | Unmarried |
| Less than High School | 65 (100.0%) | 0 (0.0%) |
| High School Diploma | 61 (100.0%) | 0 (0.0%) |
| College or Associate's Degree | 4 (6.1%) | 61 (93.9%) |
| Bachelor's Degree | 4 (100.0%) | 0 (0.0%) |
| Graduate Degree | 15 (100.0%) | 0 (0.0%) |
| Total | 149 (71.0%) | 61 (29.0%) |
Income in Webster County
Income Overview in Webster County
Per Capita Income in Webster County is $27,836, while median incomes of families and households are $71,418 and $55,657 respectively.
| Characteristic | Number | Measure |
| Per Capita Income | 9,942 | $27,836 |
| Median Family Income | 2,786 | $71,418 |
| Mean Family Income | 2,786 | $79,428 |
| Median Household Income | 4,065 | $55,657 |
| Mean Household Income | 4,065 | $65,778 |
| Income Deficit | 2,786 | $0 |
| Wage / Income Gap (%) | 9,942 | 38.65% |
| Wage / Income Gap ($) | 9,942 | 61.35¢ per $1 |
| Gini / Inequality Index | 9,942 | 0.41 |
Earnings by Sex in Webster County
Average Earnings in Webster County are $37,833, $46,396 for men and $28,464 for women, a difference of 38.7%.
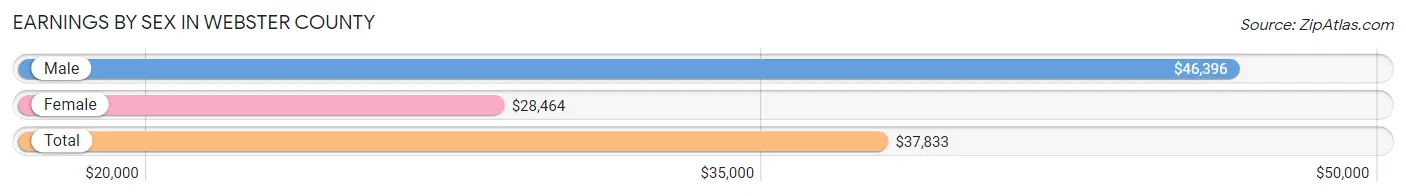
| Sex | Number | Average Earnings |
| Male | 2,475 (51.7%) | $46,396 |
| Female | 2,313 (48.3%) | $28,464 |
| Total | 4,788 (100.0%) | $37,833 |
Earnings by Sex by Income Bracket in Webster County
The most common earnings brackets in Webster County are $55,000 to $64,999 for men (344 | 13.9%) and $2,500 to $4,999 for women (261 | 11.3%).

| Income | Male | Female |
| $2,499 or less | 77 (3.1%) | 163 (7.0%) |
| $2,500 to $4,999 | 59 (2.4%) | 261 (11.3%) |
| $5,000 to $7,499 | 27 (1.1%) | 97 (4.2%) |
| $7,500 to $9,999 | 89 (3.6%) | 136 (5.9%) |
| $10,000 to $12,499 | 98 (4.0%) | 33 (1.4%) |
| $12,500 to $14,999 | 27 (1.1%) | 45 (1.9%) |
| $15,000 to $17,499 | 11 (0.4%) | 79 (3.4%) |
| $17,500 to $19,999 | 39 (1.6%) | 109 (4.7%) |
| $20,000 to $22,499 | 62 (2.5%) | 37 (1.6%) |
| $22,500 to $24,999 | 42 (1.7%) | 22 (0.9%) |
| $25,000 to $29,999 | 55 (2.2%) | 204 (8.8%) |
| $30,000 to $34,999 | 147 (5.9%) | 235 (10.2%) |
| $35,000 to $39,999 | 160 (6.5%) | 171 (7.4%) |
| $40,000 to $44,999 | 230 (9.3%) | 62 (2.7%) |
| $45,000 to $49,999 | 251 (10.1%) | 127 (5.5%) |
| $50,000 to $54,999 | 84 (3.4%) | 114 (4.9%) |
| $55,000 to $64,999 | 344 (13.9%) | 257 (11.1%) |
| $65,000 to $74,999 | 185 (7.5%) | 50 (2.2%) |
| $75,000 to $99,999 | 206 (8.3%) | 81 (3.5%) |
| $100,000+ | 282 (11.4%) | 30 (1.3%) |
| Total | 2,475 (100.0%) | 2,313 (100.0%) |
Earnings by Sex by Educational Attainment in Webster County
Average earnings in Webster County are $48,587 for men and $33,979 for women, a difference of 30.1%. Men with an educational attainment of graduate degree enjoy the highest average annual earnings of $67,955, while those with high school diploma education earn the least with $45,313. Women with an educational attainment of graduate degree earn the most with the average annual earnings of $56,912, while those with high school diploma education have the smallest earnings of $26,601.

| Educational Attainment | Male Income | Female Income |
| Less than High School | $46,940 | $0 |
| High School Diploma | $45,313 | $26,601 |
| College or Associate's Degree | $58,322 | $31,653 |
| Bachelor's Degree | $65,313 | $40,833 |
| Graduate Degree | $67,955 | $56,912 |
| Total | $48,587 | $33,979 |
Family Income in Webster County
Family Income Brackets in Webster County
According to the Webster County family income data, there are 638 families falling into the $50,000 to $74,999 income range, which is the most common income bracket and makes up 22.9% of all families. Conversely, the $10,000 to $14,999 income bracket is the least frequent group with only 84 families (3.0%) belonging to this category.

| Income Bracket | # Families | % Families |
| Less than $10,000 | 123 | 4.4% |
| $10,000 to $14,999 | 84 | 3.0% |
| $15,000 to $24,999 | 114 | 4.1% |
| $25,000 to $34,999 | 217 | 7.8% |
| $35,000 to $49,999 | 301 | 10.8% |
| $50,000 to $74,999 | 638 | 22.9% |
| $75,000 to $99,999 | 546 | 19.6% |
| $100,000 to $149,999 | 451 | 16.2% |
| $150,000 to $199,999 | 228 | 8.2% |
| $200,000+ | 86 | 3.1% |
Family Income by Famaliy Size in Webster County
4-person families (447 | 16.0%) account for the highest median family income in Webster County with $98,711 per family, while 2-person families (1,344 | 48.2%) have the highest median income of $29,962 per family member.

| Income Bracket | # Families | Median Income |
| 2-Person Families | 1,344 (48.2%) | $59,924 |
| 3-Person Families | 656 (23.5%) | $70,556 |
| 4-Person Families | 447 (16.0%) | $98,711 |
| 5-Person Families | 309 (11.1%) | $84,083 |
| 6-Person Families | 30 (1.1%) | $74,375 |
| 7+ Person Families | 0 (0.0%) | $0 |
| Total | 2,786 (100.0%) | $71,418 |
Family Income by Number of Earners in Webster County
The median family income in Webster County is $71,418, with families comprising 3+ earners (270) having the highest median family income of $121,023, while families with no earners (462) have the lowest median family income of $41,115, accounting for 9.7% and 16.6% of families, respectively.

| Number of Earners | # Families | Median Income |
| No Earners | 462 (16.6%) | $41,115 |
| 1 Earner | 889 (31.9%) | $52,734 |
| 2 Earners | 1,165 (41.8%) | $89,241 |
| 3+ Earners | 270 (9.7%) | $121,023 |
| Total | 2,786 (100.0%) | $71,418 |
Household Income in Webster County
Household Income Brackets in Webster County
With 780 households falling in the category, the $50,000 to $74,999 income range is the most frequent in Webster County, accounting for 19.2% of all households. In contrast, only 85 households (2.1%) fall into the $200,000+ income bracket, making it the least populous group.

| Income Bracket | # Households | % Households |
| Less than $10,000 | 260 | 6.4% |
| $10,000 to $14,999 | 252 | 6.2% |
| $15,000 to $24,999 | 370 | 9.1% |
| $25,000 to $34,999 | 394 | 9.7% |
| $35,000 to $49,999 | 557 | 13.7% |
| $50,000 to $74,999 | 780 | 19.2% |
| $75,000 to $99,999 | 602 | 14.8% |
| $100,000 to $149,999 | 533 | 13.1% |
| $150,000 to $199,999 | 232 | 5.7% |
| $200,000+ | 85 | 2.1% |
Household Income by Householder Age in Webster County
The median household income in Webster County is $55,657, with the highest median household income of $61,653 found in the 25 to 44 years age bracket for the primary householder. A total of 1,129 households (27.8%) fall into this category. Meanwhile, the 15 to 24 years age bracket for the primary householder has the lowest median household income of $0, with 100 households (2.5%) in this group.

| Income Bracket | # Households | Median Income |
| 15 to 24 Years | 100 (2.5%) | $0 |
| 25 to 44 Years | 1,129 (27.8%) | $61,653 |
| 45 to 64 Years | 1,580 (38.9%) | $61,429 |
| 65+ Years | 1,256 (30.9%) | $43,516 |
| Total | 4,065 (100.0%) | $55,657 |
Poverty in Webster County
Income Below Poverty by Sex and Age in Webster County
With 16.4% poverty level for males and 15.2% for females among the residents of Webster County, under 5 year old males and 5 year old females are the most vulnerable to poverty, with 106 males (41.4%) and 33 females (55.0%) in their respective age groups living below the poverty level.
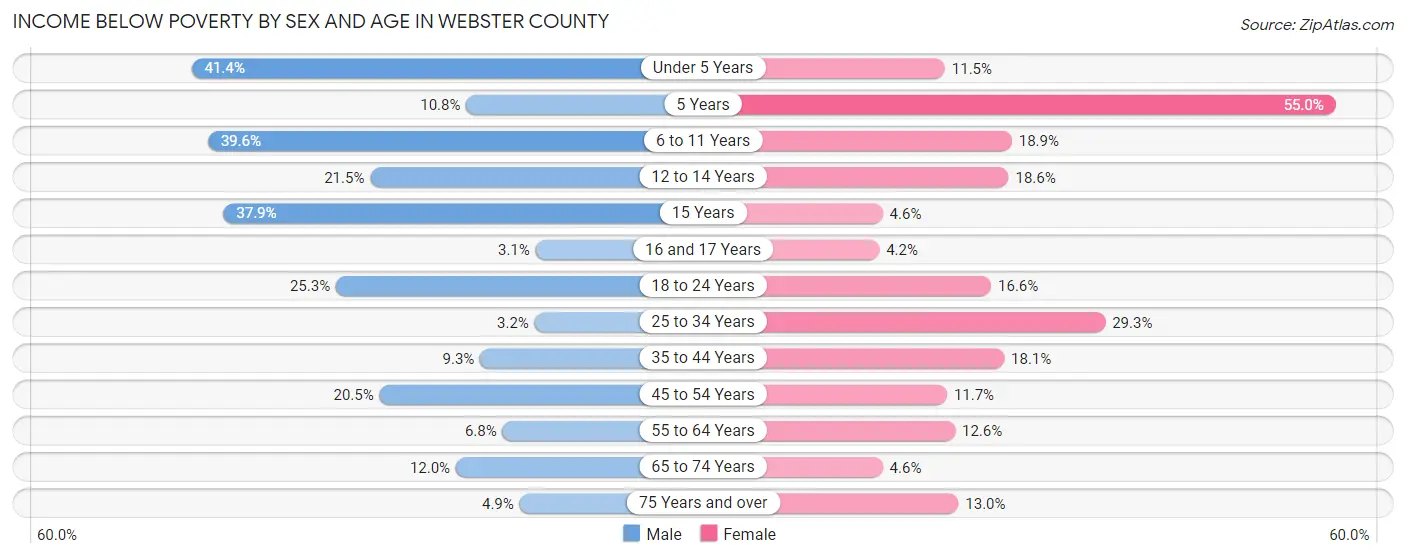
| Age Bracket | Male | Female |
| Under 5 Years | 106 (41.4%) | 41 (11.5%) |
| 5 Years | 8 (10.8%) | 33 (55.0%) |
| 6 to 11 Years | 158 (39.6%) | 60 (18.9%) |
| 12 to 14 Years | 40 (21.5%) | 52 (18.6%) |
| 15 Years | 39 (37.9%) | 4 (4.5%) |
| 16 and 17 Years | 3 (3.1%) | 5 (4.2%) |
| 18 to 24 Years | 98 (25.3%) | 73 (16.6%) |
| 25 to 34 Years | 18 (3.2%) | 159 (29.3%) |
| 35 to 44 Years | 50 (9.3%) | 109 (18.1%) |
| 45 to 54 Years | 130 (20.5%) | 70 (11.7%) |
| 55 to 64 Years | 45 (6.8%) | 88 (12.6%) |
| 65 to 74 Years | 61 (12.0%) | 26 (4.5%) |
| 75 Years and over | 13 (4.9%) | 61 (13.0%) |
| Total | 769 (16.4%) | 781 (15.2%) |
Income Above Poverty by Sex and Age in Webster County
According to the poverty statistics in Webster County, males aged 16 and 17 years and females aged 16 and 17 years are the age groups that are most secure financially, with 96.9% of males and 95.8% of females in these age groups living above the poverty line.
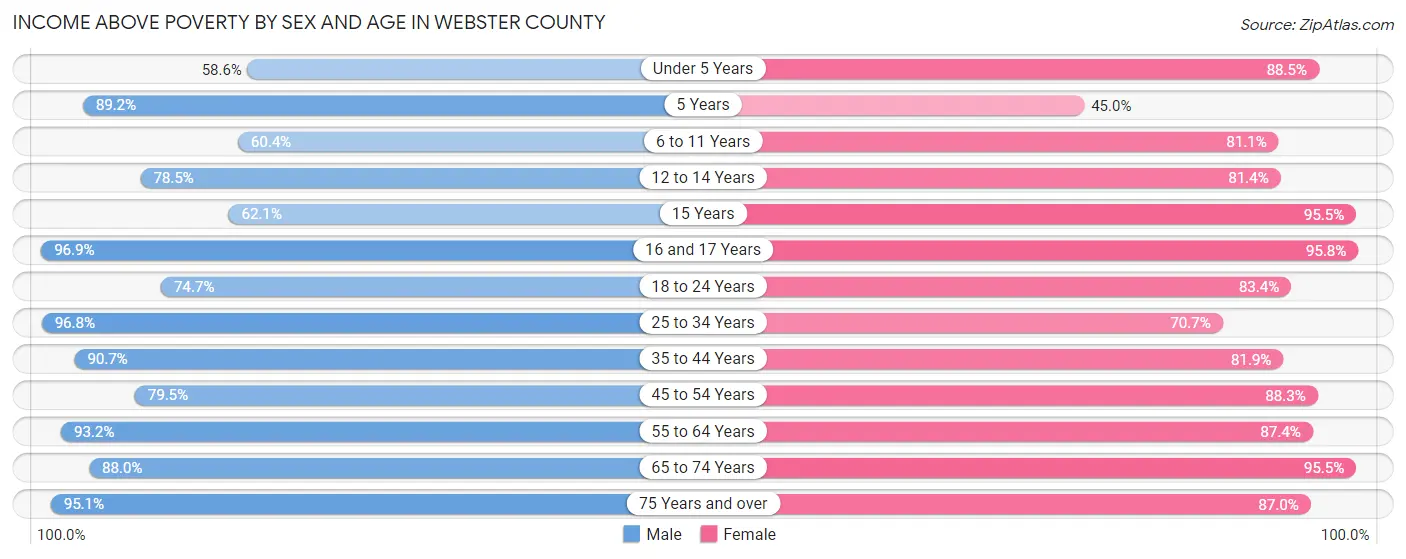
| Age Bracket | Male | Female |
| Under 5 Years | 150 (58.6%) | 316 (88.5%) |
| 5 Years | 66 (89.2%) | 27 (45.0%) |
| 6 to 11 Years | 241 (60.4%) | 257 (81.1%) |
| 12 to 14 Years | 146 (78.5%) | 228 (81.4%) |
| 15 Years | 64 (62.1%) | 84 (95.5%) |
| 16 and 17 Years | 94 (96.9%) | 115 (95.8%) |
| 18 to 24 Years | 289 (74.7%) | 366 (83.4%) |
| 25 to 34 Years | 547 (96.8%) | 383 (70.7%) |
| 35 to 44 Years | 490 (90.7%) | 494 (81.9%) |
| 45 to 54 Years | 505 (79.5%) | 528 (88.3%) |
| 55 to 64 Years | 620 (93.2%) | 610 (87.4%) |
| 65 to 74 Years | 449 (88.0%) | 546 (95.5%) |
| 75 Years and over | 254 (95.1%) | 409 (87.0%) |
| Total | 3,915 (83.6%) | 4,363 (84.8%) |
Income Below Poverty Among Married-Couple Families in Webster County
The poverty statistics for married-couple families in Webster County show that 3.9% or 79 of the total 2,004 families live below the poverty line. Families with 3 or 4 children have the highest poverty rate of 11.0%, comprising of 16 families. On the other hand, families with no children have the lowest poverty rate of 2.8%, which includes 32 families.

| Children | Above Poverty | Below Poverty |
| No Children | 1,126 (97.2%) | 32 (2.8%) |
| 1 or 2 Children | 669 (95.6%) | 31 (4.4%) |
| 3 or 4 Children | 130 (89.0%) | 16 (11.0%) |
| 5 or more Children | 0 (0.0%) | 0 (0.0%) |
| Total | 1,925 (96.1%) | 79 (3.9%) |
Income Below Poverty Among Single-Parent Households in Webster County
According to the poverty data in Webster County, 12.6% or 18 single-father households and 35.0% or 224 single-mother households are living below the poverty line. Among single-father households, those with 1 or 2 children have the highest poverty rate, with 9 households (13.9%) experiencing poverty. Likewise, among single-mother households, those with 3 or 4 children have the highest poverty rate, with 58 households (100.0%) falling below the poverty line.
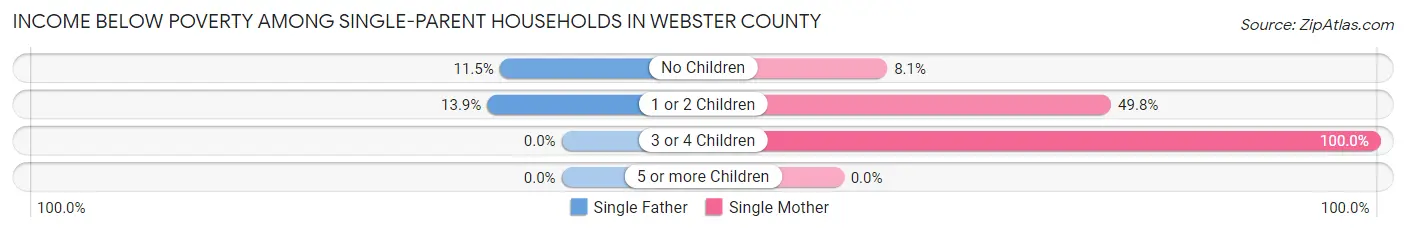
| Children | Single Father | Single Mother |
| No Children | 9 (11.5%) | 24 (8.1%) |
| 1 or 2 Children | 9 (13.9%) | 142 (49.8%) |
| 3 or 4 Children | 0 (0.0%) | 58 (100.0%) |
| 5 or more Children | 0 (0.0%) | 0 (0.0%) |
| Total | 18 (12.6%) | 224 (35.0%) |
Income Below Poverty Among Married-Couple vs Single-Parent Households in Webster County
The poverty data for Webster County shows that 79 of the married-couple family households (3.9%) and 242 of the single-parent households (30.9%) are living below the poverty level. Within the married-couple family households, those with 3 or 4 children have the highest poverty rate, with 16 households (11.0%) falling below the poverty line. Among the single-parent households, those with 3 or 4 children have the highest poverty rate, with 58 household (100.0%) living below poverty.

| Children | Married-Couple Families | Single-Parent Households |
| No Children | 32 (2.8%) | 33 (8.8%) |
| 1 or 2 Children | 31 (4.4%) | 151 (43.1%) |
| 3 or 4 Children | 16 (11.0%) | 58 (100.0%) |
| 5 or more Children | 0 (0.0%) | 0 (0.0%) |
| Total | 79 (3.9%) | 242 (30.9%) |
Employment Characteristics in Webster County
Employment by Class of Employer in Webster County
Among the 3,990 employed individuals in Webster County, private company employees (2,701 | 67.7%), state government employees (453 | 11.4%), and self-employed (not incorporated) (254 | 6.4%) make up the most common classes of employment.
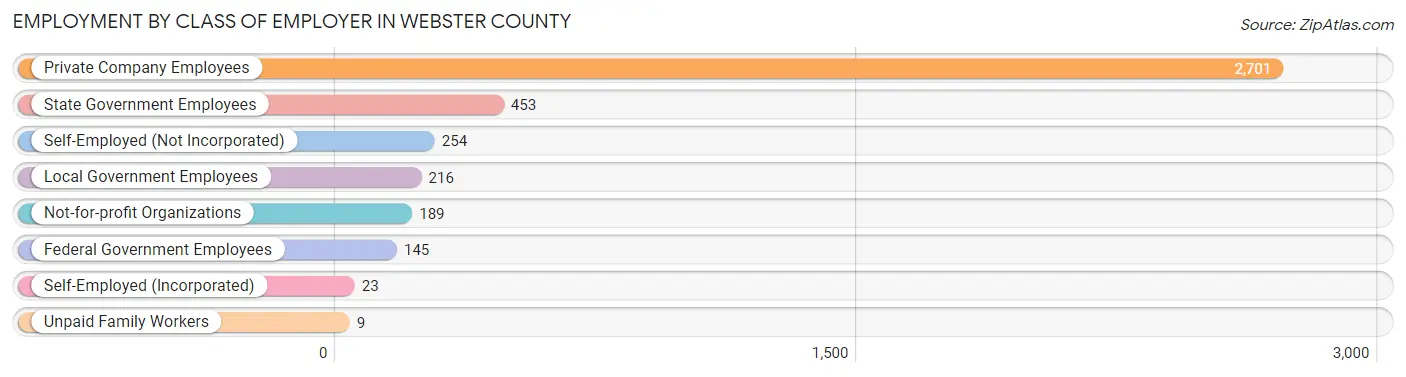
| Employer Class | # Employees | % Employees |
| Private Company Employees | 2,701 | 67.7% |
| Self-Employed (Incorporated) | 23 | 0.6% |
| Self-Employed (Not Incorporated) | 254 | 6.4% |
| Not-for-profit Organizations | 189 | 4.7% |
| Local Government Employees | 216 | 5.4% |
| State Government Employees | 453 | 11.4% |
| Federal Government Employees | 145 | 3.6% |
| Unpaid Family Workers | 9 | 0.2% |
| Total | 3,990 | 100.0% |
Employment Status by Age in Webster County
According to the labor force statistics for Webster County, out of the total population over 16 years of age (7,802), 56.3% or 4,393 individuals are in the labor force, with 6.4% or 281 of them unemployed. The age group with the highest labor force participation rate is 30 to 34 years, with 82.9% or 475 individuals in the labor force. Within the labor force, the 16 to 19 years age range has the highest percentage of unemployed individuals, with 34.5% or 90 of them being unemployed.

| Age Bracket | In Labor Force | Unemployed |
| 16 to 19 Years | 261 (43.5%) | 90 (34.5%) |
| 20 to 24 Years | 357 (79.9%) | 25 (7.0%) |
| 25 to 29 Years | 371 (68.2%) | 79 (21.3%) |
| 30 to 34 Years | 475 (82.9%) | 24 (5.1%) |
| 35 to 44 Years | 882 (76.6%) | 25 (2.8%) |
| 45 to 54 Years | 930 (75.1%) | 25 (2.7%) |
| 55 to 59 Years | 378 (62.5%) | 0 (0.0%) |
| 60 to 64 Years | 396 (51.6%) | 0 (0.0%) |
| 65 to 74 Years | 307 (27.9%) | 12 (3.9%) |
| 75 Years and over | 35 (4.5%) | 0 (0.0%) |
| Total | 4,393 (56.3%) | 281 (6.4%) |
Employment Status by Educational Attainment in Webster County
According to labor force statistics for Webster County, 70.3% of individuals (3,430) out of the total population between 25 and 64 years of age (4,879) are in the labor force, with 4.5% or 154 of them being unemployed. The group with the highest labor force participation rate are those with the educational attainment of bachelor's degree or higher, with 87.0% or 694 individuals in the labor force. Within the labor force, individuals with less than high school education have the highest percentage of unemployment, with 27.8% or 96 of them being unemployed.

| Educational Attainment | In Labor Force | Unemployed |
| Less than High School | 345 (51.3%) | 187 (27.8%) |
| High School Diploma | 1,196 (68.6%) | 35 (2.0%) |
| College / Associate Degree | 1,198 (71.9%) | 37 (2.2%) |
| Bachelor's Degree or higher | 694 (87.0%) | 8 (1.0%) |
| Total | 3,430 (70.3%) | 220 (4.5%) |
Employment Occupations by Sex in Webster County
Management, Business, Science and Arts Occupations
The most common Management, Business, Science and Arts occupations in Webster County are Management (329 | 8.0%), Community & Social Service (314 | 7.6%), Health Diagnosing & Treating (313 | 7.6%), Health Technologists (255 | 6.2%), and Education, Arts & Media (154 | 3.7%).

Management, Business, Science and Arts Occupations by Sex
Within the Management, Business, Science and Arts occupations in Webster County, the most male-oriented occupations are Computers & Mathematics (100.0%), Business & Financial (79.3%), and Computers, Engineering & Science (69.4%), while the most female-oriented occupations are Education Instruction & Library (89.9%), Education, Arts & Media (89.6%), and Community & Social Service (89.2%).

| Occupation | Male | Female |
| Management | 144 (43.8%) | 185 (56.2%) |
| Business & Financial | 96 (79.3%) | 25 (20.7%) |
| Computers, Engineering & Science | 93 (69.4%) | 41 (30.6%) |
| Computers & Mathematics | 46 (100.0%) | 0 (0.0%) |
| Architecture & Engineering | 26 (51.0%) | 25 (49.0%) |
| Life, Physical & Social Science | 21 (56.8%) | 16 (43.2%) |
| Community & Social Service | 34 (10.8%) | 280 (89.2%) |
| Education, Arts & Media | 16 (10.4%) | 138 (89.6%) |
| Legal Services & Support | 0 (0.0%) | 0 (0.0%) |
| Education Instruction & Library | 15 (10.1%) | 134 (89.9%) |
| Arts, Media & Entertainment | 3 (27.3%) | 8 (72.7%) |
| Health Diagnosing & Treating | 57 (18.2%) | 256 (81.8%) |
| Health Technologists | 55 (21.6%) | 200 (78.4%) |
| Total (Category) | 424 (35.0%) | 787 (65.0%) |
| Total (Overall) | 2,217 (53.9%) | 1,895 (46.1%) |
Services Occupations
The most common Services occupations in Webster County are Food Preparation & Serving (208 | 5.1%), Healthcare Support (205 | 5.0%), Cleaning & Maintenance (173 | 4.2%), Personal Care & Service (144 | 3.5%), and Security & Protection (72 | 1.8%).

Services Occupations by Sex
Within the Services occupations in Webster County, the most male-oriented occupations are Security & Protection (100.0%), Firefighting & Prevention (100.0%), and Law Enforcement (100.0%), while the most female-oriented occupations are Healthcare Support (100.0%), Personal Care & Service (100.0%), and Food Preparation & Serving (59.1%).

| Occupation | Male | Female |
| Healthcare Support | 0 (0.0%) | 205 (100.0%) |
| Security & Protection | 72 (100.0%) | 0 (0.0%) |
| Firefighting & Prevention | 49 (100.0%) | 0 (0.0%) |
| Law Enforcement | 23 (100.0%) | 0 (0.0%) |
| Food Preparation & Serving | 85 (40.9%) | 123 (59.1%) |
| Cleaning & Maintenance | 96 (55.5%) | 77 (44.5%) |
| Personal Care & Service | 0 (0.0%) | 144 (100.0%) |
| Total (Category) | 253 (31.6%) | 549 (68.4%) |
| Total (Overall) | 2,217 (53.9%) | 1,895 (46.1%) |
Sales and Office Occupations
The most common Sales and Office occupations in Webster County are Office & Administration (540 | 13.1%), and Sales & Related (276 | 6.7%).

Sales and Office Occupations by Sex

| Occupation | Male | Female |
| Sales & Related | 208 (75.4%) | 68 (24.6%) |
| Office & Administration | 137 (25.4%) | 403 (74.6%) |
| Total (Category) | 345 (42.3%) | 471 (57.7%) |
| Total (Overall) | 2,217 (53.9%) | 1,895 (46.1%) |
Natural Resources, Construction and Maintenance Occupations
The most common Natural Resources, Construction and Maintenance occupations in Webster County are Installation, Maintenance & Repair (264 | 6.4%), Construction & Extraction (259 | 6.3%), and Farming, Fishing & Forestry (33 | 0.8%).

Natural Resources, Construction and Maintenance Occupations by Sex
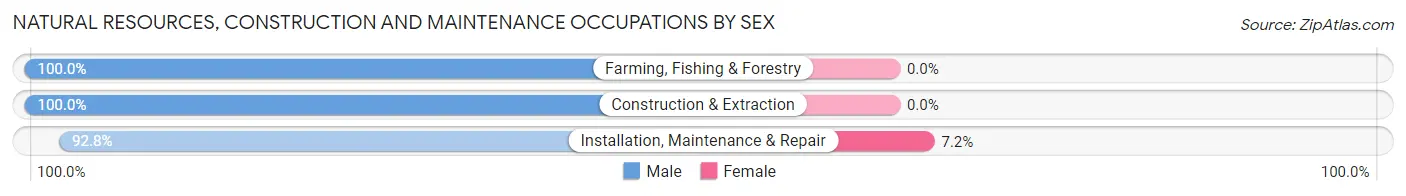
| Occupation | Male | Female |
| Farming, Fishing & Forestry | 33 (100.0%) | 0 (0.0%) |
| Construction & Extraction | 259 (100.0%) | 0 (0.0%) |
| Installation, Maintenance & Repair | 245 (92.8%) | 19 (7.2%) |
| Total (Category) | 537 (96.6%) | 19 (3.4%) |
| Total (Overall) | 2,217 (53.9%) | 1,895 (46.1%) |
Production, Transportation and Moving Occupations
The most common Production, Transportation and Moving occupations in Webster County are Production (374 | 9.1%), Material Moving (212 | 5.2%), and Transportation (141 | 3.4%).

Production, Transportation and Moving Occupations by Sex
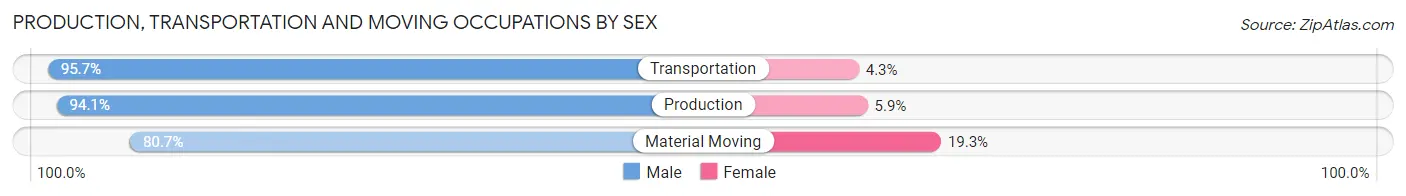
| Occupation | Male | Female |
| Production | 352 (94.1%) | 22 (5.9%) |
| Transportation | 135 (95.7%) | 6 (4.3%) |
| Material Moving | 171 (80.7%) | 41 (19.3%) |
| Total (Category) | 658 (90.5%) | 69 (9.5%) |
| Total (Overall) | 2,217 (53.9%) | 1,895 (46.1%) |
Employment Industries by Sex in Webster County
Employment Industries in Webster County
The major employment industries in Webster County include Health Care & Social Assistance (792 | 19.3%), Manufacturing (662 | 16.1%), Educational Services (445 | 10.8%), Retail Trade (420 | 10.2%), and Construction (277 | 6.7%).

Employment Industries by Sex in Webster County
The Webster County industries that see more men than women are Mining, Quarrying, & Extraction (100.0%), Information (100.0%), and Administrative & Support (97.4%), whereas the industries that tend to have a higher number of women are Arts, Entertainment & Recreation (100.0%), Health Care & Social Assistance (90.9%), and Finance & Insurance (87.7%).

| Industry | Male | Female |
| Agriculture, Fishing & Hunting | 79 (94.1%) | 5 (5.9%) |
| Mining, Quarrying, & Extraction | 14 (100.0%) | 0 (0.0%) |
| Construction | 268 (96.8%) | 9 (3.3%) |
| Manufacturing | 542 (81.9%) | 120 (18.1%) |
| Wholesale Trade | 38 (88.4%) | 5 (11.6%) |
| Retail Trade | 295 (70.2%) | 125 (29.8%) |
| Transportation & Warehousing | 97 (51.9%) | 90 (48.1%) |
| Utilities | 152 (95.6%) | 7 (4.4%) |
| Information | 18 (100.0%) | 0 (0.0%) |
| Finance & Insurance | 14 (12.3%) | 100 (87.7%) |
| Real Estate, Rental & Leasing | 20 (26.7%) | 55 (73.3%) |
| Professional & Scientific | 58 (53.7%) | 50 (46.3%) |
| Enterprise Management | 0 (0.0%) | 0 (0.0%) |
| Administrative & Support | 110 (97.4%) | 3 (2.6%) |
| Educational Services | 164 (36.8%) | 281 (63.1%) |
| Health Care & Social Assistance | 72 (9.1%) | 720 (90.9%) |
| Arts, Entertainment & Recreation | 0 (0.0%) | 21 (100.0%) |
| Accommodation & Food Services | 115 (43.4%) | 150 (56.6%) |
| Public Administration | 85 (50.0%) | 85 (50.0%) |
| Total | 2,217 (53.9%) | 1,895 (46.1%) |
Education in Webster County
School Enrollment in Webster County
The most common levels of schooling among the 2,234 students in Webster County are high school (603 | 27.0%), elementary school (501 | 22.4%), and middle school (474 | 21.2%).

| School Level | # Students | % Students |
| Nursery / Preschool | 121 | 5.4% |
| Kindergarten | 128 | 5.7% |
| Elementary School | 501 | 22.4% |
| Middle School | 474 | 21.2% |
| High School | 603 | 27.0% |
| College / Undergraduate | 348 | 15.6% |
| Graduate / Professional | 59 | 2.6% |
| Total | 2,234 | 100.0% |
School Enrollment by Age by Funding Source in Webster County
Out of a total of 2,234 students who are enrolled in schools in Webster County, 315 (14.1%) attend a private institution, while the remaining 1,919 (85.9%) are enrolled in public schools. The age group of 3 to 4 year olds has the highest likelihood of being enrolled in private schools, with 93 (82.3% in the age bracket) enrolled. Conversely, the age group of 18 to 19 year olds has the lowest likelihood of being enrolled in a private school, with 218 (100.0% in the age bracket) attending a public institution.

| Age Bracket | Public School | Private School |
| 3 to 4 Year Olds | 20 (17.7%) | 93 (82.3%) |
| 5 to 9 Year Old | 512 (95.5%) | 24 (4.5%) |
| 10 to 14 Year Olds | 557 (83.4%) | 111 (16.6%) |
| 15 to 17 Year Olds | 345 (85.2%) | 60 (14.8%) |
| 18 to 19 Year Olds | 218 (100.0%) | 0 (0.0%) |
| 20 to 24 Year Olds | 132 (84.1%) | 25 (15.9%) |
| 25 to 34 Year Olds | 69 (100.0%) | 0 (0.0%) |
| 35 Years and over | 66 (97.1%) | 2 (2.9%) |
| Total | 1,919 (85.9%) | 315 (14.1%) |
Educational Attainment by Field of Study in Webster County
Education (451 | 34.9%), business (225 | 17.4%), arts & humanities (170 | 13.2%), science & technology (133 | 10.3%), and engineering (100 | 7.7%) are the most common fields of study among 1,292 individuals in Webster County who have obtained a bachelor's degree or higher.
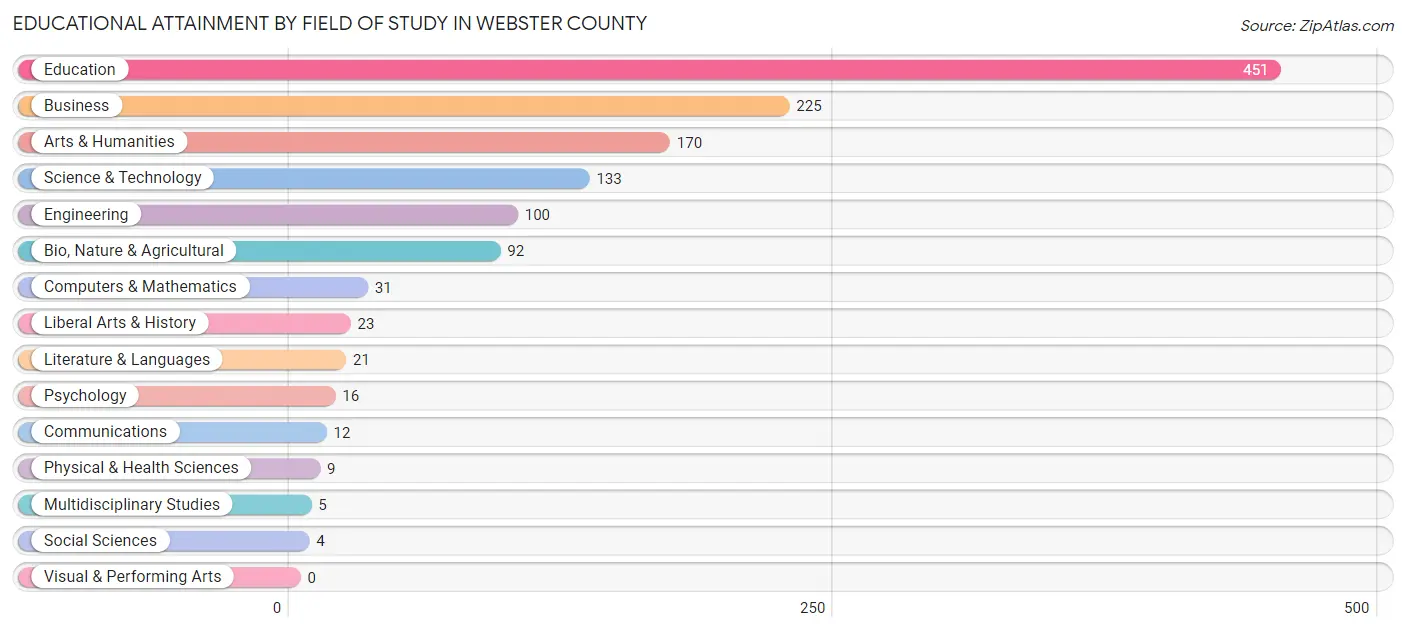
| Field of Study | # Graduates | % Graduates |
| Computers & Mathematics | 31 | 2.4% |
| Bio, Nature & Agricultural | 92 | 7.1% |
| Physical & Health Sciences | 9 | 0.7% |
| Psychology | 16 | 1.2% |
| Social Sciences | 4 | 0.3% |
| Engineering | 100 | 7.7% |
| Multidisciplinary Studies | 5 | 0.4% |
| Science & Technology | 133 | 10.3% |
| Business | 225 | 17.4% |
| Education | 451 | 34.9% |
| Literature & Languages | 21 | 1.6% |
| Liberal Arts & History | 23 | 1.8% |
| Visual & Performing Arts | 0 | 0.0% |
| Communications | 12 | 0.9% |
| Arts & Humanities | 170 | 13.2% |
| Total | 1,292 | 100.0% |
Transportation & Commute in Webster County
Vehicle Availability by Sex in Webster County
The most prevalent vehicle ownership categories in Webster County are males with 2 vehicles (788, accounting for 37.0%) and females with 2 vehicles (772, making up 42.3%).
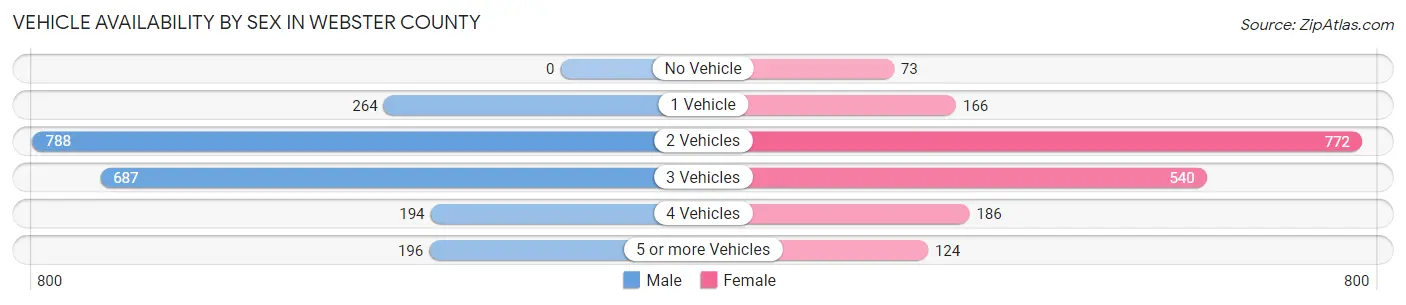
| Vehicles Available | Male | Female |
| No Vehicle | 0 (0.0%) | 73 (3.9%) |
| 1 Vehicle | 264 (12.4%) | 166 (8.9%) |
| 2 Vehicles | 788 (37.0%) | 772 (41.5%) |
| 3 Vehicles | 687 (32.3%) | 540 (29.0%) |
| 4 Vehicles | 194 (9.1%) | 186 (10.0%) |
| 5 or more Vehicles | 196 (9.2%) | 124 (6.7%) |
| Total | 2,129 (100.0%) | 1,861 (100.0%) |
Commute Time in Webster County
The most frequently occuring commute durations in Webster County are 30 to 34 minutes (682 commuters, 17.5%), 45 to 59 minutes (536 commuters, 13.7%), and 10 to 14 minutes (443 commuters, 11.4%).

| Commute Time | # Commuters | % Commuters |
| Less than 5 Minutes | 126 | 3.2% |
| 5 to 9 Minutes | 383 | 9.8% |
| 10 to 14 Minutes | 443 | 11.4% |
| 15 to 19 Minutes | 364 | 9.3% |
| 20 to 24 Minutes | 302 | 7.7% |
| 25 to 29 Minutes | 116 | 3.0% |
| 30 to 34 Minutes | 682 | 17.5% |
| 35 to 39 Minutes | 398 | 10.2% |
| 40 to 44 Minutes | 252 | 6.5% |
| 45 to 59 Minutes | 536 | 13.7% |
| 60 to 89 Minutes | 166 | 4.3% |
| 90 or more Minutes | 132 | 3.4% |
Commute Time by Sex in Webster County
The most common commute times in Webster County are 30 to 34 minutes (393 commuters, 19.0%) for males and 30 to 34 minutes (289 commuters, 15.8%) for females.
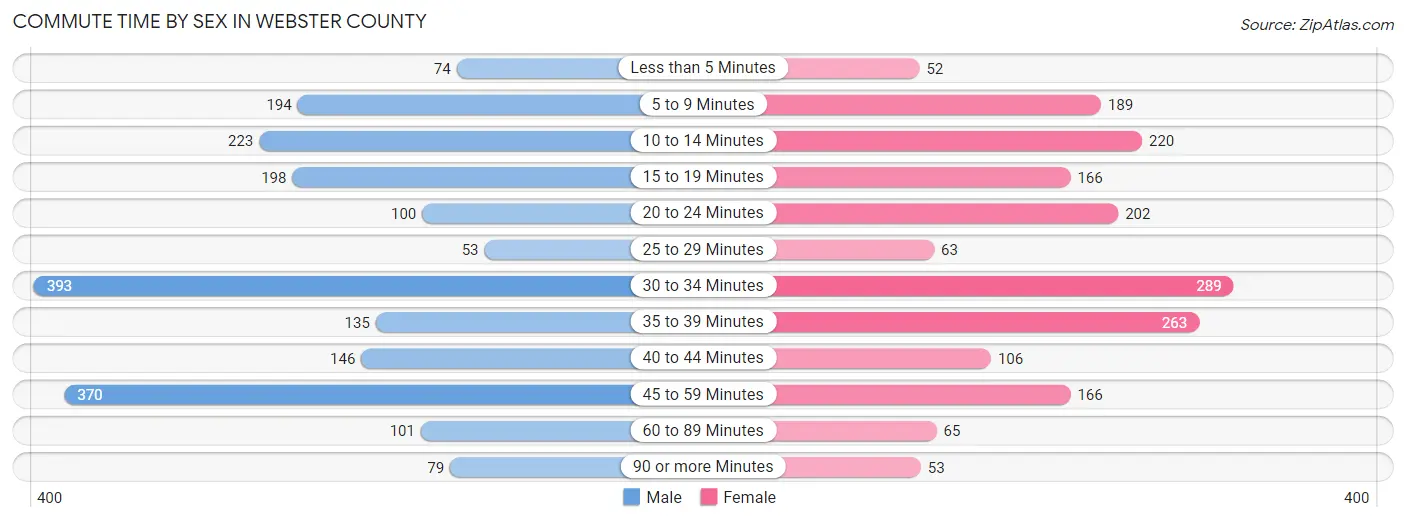
| Commute Time | Male | Female |
| Less than 5 Minutes | 74 (3.6%) | 52 (2.8%) |
| 5 to 9 Minutes | 194 (9.4%) | 189 (10.3%) |
| 10 to 14 Minutes | 223 (10.8%) | 220 (12.0%) |
| 15 to 19 Minutes | 198 (9.6%) | 166 (9.0%) |
| 20 to 24 Minutes | 100 (4.8%) | 202 (11.0%) |
| 25 to 29 Minutes | 53 (2.6%) | 63 (3.4%) |
| 30 to 34 Minutes | 393 (19.0%) | 289 (15.8%) |
| 35 to 39 Minutes | 135 (6.5%) | 263 (14.3%) |
| 40 to 44 Minutes | 146 (7.1%) | 106 (5.8%) |
| 45 to 59 Minutes | 370 (17.9%) | 166 (9.0%) |
| 60 to 89 Minutes | 101 (4.9%) | 65 (3.5%) |
| 90 or more Minutes | 79 (3.8%) | 53 (2.9%) |
Time of Departure to Work by Sex in Webster County
The most frequent times of departure to work in Webster County are 6:00 AM to 6:29 AM (405, 19.6%) for males and 7:00 AM to 7:29 AM (430, 23.4%) for females.

| Time of Departure | Male | Female |
| 12:00 AM to 4:59 AM | 219 (10.6%) | 123 (6.7%) |
| 5:00 AM to 5:29 AM | 90 (4.4%) | 11 (0.6%) |
| 5:30 AM to 5:59 AM | 230 (11.1%) | 48 (2.6%) |
| 6:00 AM to 6:29 AM | 405 (19.6%) | 181 (9.9%) |
| 6:30 AM to 6:59 AM | 144 (7.0%) | 184 (10.0%) |
| 7:00 AM to 7:29 AM | 290 (14.0%) | 430 (23.4%) |
| 7:30 AM to 7:59 AM | 234 (11.3%) | 387 (21.1%) |
| 8:00 AM to 8:29 AM | 38 (1.8%) | 203 (11.1%) |
| 8:30 AM to 8:59 AM | 25 (1.2%) | 93 (5.1%) |
| 9:00 AM to 9:59 AM | 81 (3.9%) | 90 (4.9%) |
| 10:00 AM to 10:59 AM | 15 (0.7%) | 0 (0.0%) |
| 11:00 AM to 11:59 AM | 15 (0.7%) | 0 (0.0%) |
| 12:00 PM to 3:59 PM | 81 (3.9%) | 69 (3.8%) |
| 4:00 PM to 11:59 PM | 199 (9.6%) | 15 (0.8%) |
| Total | 2,066 (100.0%) | 1,834 (100.0%) |
Housing Occupancy in Webster County
Occupancy by Ownership in Webster County
Of the total 4,065 dwellings in Webster County, owner-occupied units account for 3,166 (77.9%), while renter-occupied units make up 899 (22.1%).

| Occupancy | # Housing Units | % Housing Units |
| Owner Occupied Housing Units | 3,166 | 77.9% |
| Renter-Occupied Housing Units | 899 | 22.1% |
| Total Occupied Housing Units | 4,065 | 100.0% |
Occupancy by Household Size in Webster County
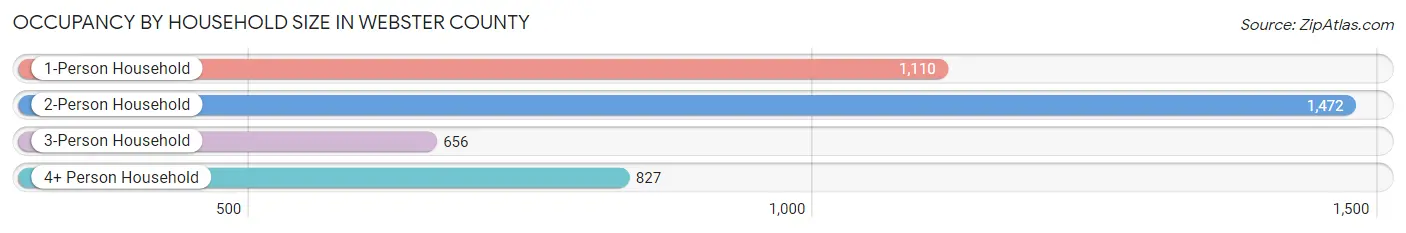
| Household Size | # Housing Units | % Housing Units |
| 1-Person Household | 1,110 | 27.3% |
| 2-Person Household | 1,472 | 36.2% |
| 3-Person Household | 656 | 16.1% |
| 4+ Person Household | 827 | 20.3% |
| Total Housing Units | 4,065 | 100.0% |
Occupancy by Ownership by Household Size in Webster County

| Household Size | Owner-occupied | Renter-occupied |
| 1-Person Household | 751 (67.7%) | 359 (32.3%) |
| 2-Person Household | 1,303 (88.5%) | 169 (11.5%) |
| 3-Person Household | 487 (74.2%) | 169 (25.8%) |
| 4+ Person Household | 625 (75.6%) | 202 (24.4%) |
| Total Housing Units | 3,166 (77.9%) | 899 (22.1%) |
Occupancy by Educational Attainment in Webster County

| Household Size | Owner-occupied | Renter-occupied |
| Less than High School | 297 (57.9%) | 216 (42.1%) |
| High School Diploma | 1,157 (79.8%) | 293 (20.2%) |
| College/Associate Degree | 1,031 (79.6%) | 264 (20.4%) |
| Bachelor's Degree or higher | 681 (84.4%) | 126 (15.6%) |
Occupancy by Age of Householder in Webster County

| Age Bracket | # Households | % Households |
| Under 35 Years | 621 | 15.3% |
| 35 to 44 Years | 608 | 15.0% |
| 45 to 54 Years | 749 | 18.4% |
| 55 to 64 Years | 831 | 20.4% |
| 65 to 74 Years | 772 | 19.0% |
| 75 to 84 Years | 374 | 9.2% |
| 85 Years and Over | 110 | 2.7% |
| Total | 4,065 | 100.0% |
Housing Finances in Webster County
Median Income by Occupancy in Webster County

| Occupancy Type | # Households | Median Income |
| Owner-Occupied | 3,166 (77.9%) | $62,989 |
| Renter-Occupied | 899 (22.1%) | $24,099 |
| Average | 4,065 (100.0%) | $55,657 |
Occupancy by Householder Income Bracket in Webster County

| Income Bracket | Owner-occupied | Renter-occupied |
| Less than $5,000 | 25 (0.8%) | 119 (13.2%) |
| $5,000 to $9,999 | 38 (1.2%) | 77 (8.6%) |
| $10,000 to $14,999 | 133 (4.2%) | 118 (13.1%) |
| $15,000 to $19,999 | 76 (2.4%) | 108 (12.0%) |
| $20,000 to $24,999 | 144 (4.5%) | 43 (4.8%) |
| $25,000 to $34,999 | 234 (7.4%) | 161 (17.9%) |
| $35,000 to $49,999 | 499 (15.8%) | 57 (6.3%) |
| $50,000 to $74,999 | 637 (20.1%) | 145 (16.1%) |
| $75,000 to $99,999 | 578 (18.3%) | 23 (2.6%) |
| $100,000 to $149,999 | 510 (16.1%) | 21 (2.3%) |
| $150,000 or more | 292 (9.2%) | 27 (3.0%) |
| Total | 3,166 (100.0%) | 899 (100.0%) |
Monthly Housing Cost Tiers in Webster County
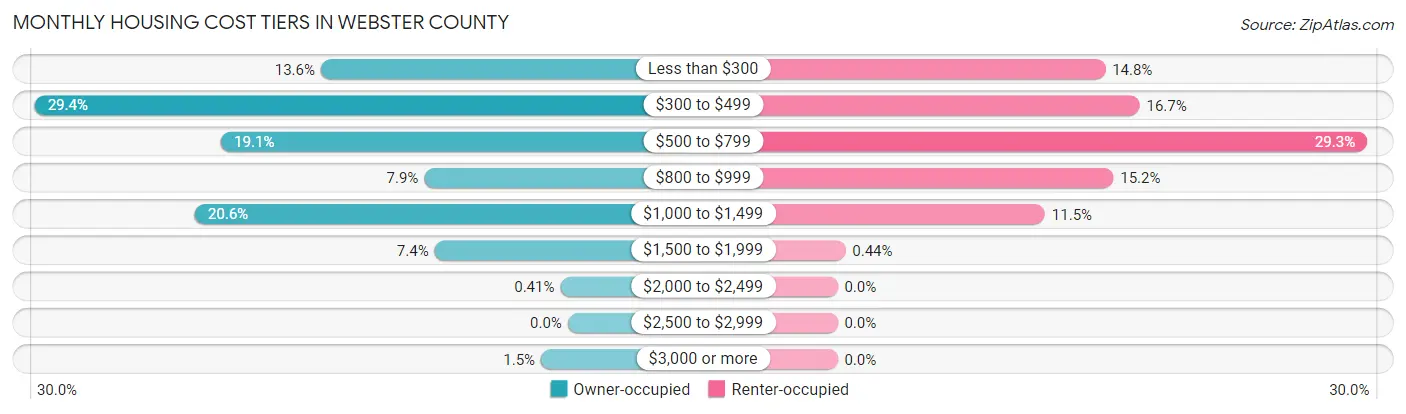
| Monthly Cost | Owner-occupied | Renter-occupied |
| Less than $300 | 432 (13.6%) | 133 (14.8%) |
| $300 to $499 | 932 (29.4%) | 150 (16.7%) |
| $500 to $799 | 606 (19.1%) | 263 (29.2%) |
| $800 to $999 | 251 (7.9%) | 137 (15.2%) |
| $1,000 to $1,499 | 652 (20.6%) | 103 (11.5%) |
| $1,500 to $1,999 | 233 (7.4%) | 4 (0.4%) |
| $2,000 to $2,499 | 13 (0.4%) | 0 (0.0%) |
| $2,500 to $2,999 | 0 (0.0%) | 0 (0.0%) |
| $3,000 or more | 47 (1.5%) | 0 (0.0%) |
| Total | 3,166 (100.0%) | 899 (100.0%) |
Physical Housing Characteristics in Webster County
Housing Structures in Webster County
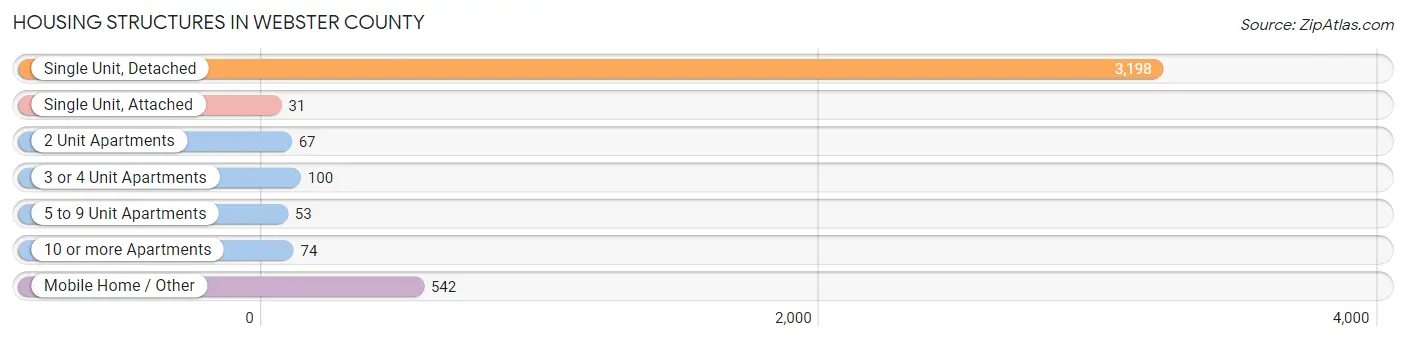
| Structure Type | # Housing Units | % Housing Units |
| Single Unit, Detached | 3,198 | 78.7% |
| Single Unit, Attached | 31 | 0.8% |
| 2 Unit Apartments | 67 | 1.7% |
| 3 or 4 Unit Apartments | 100 | 2.5% |
| 5 to 9 Unit Apartments | 53 | 1.3% |
| 10 or more Apartments | 74 | 1.8% |
| Mobile Home / Other | 542 | 13.3% |
| Total | 4,065 | 100.0% |
Housing Structures by Occupancy in Webster County

| Structure Type | Owner-occupied | Renter-occupied |
| Single Unit, Detached | 2,676 (83.7%) | 522 (16.3%) |
| Single Unit, Attached | 8 (25.8%) | 23 (74.2%) |
| 2 Unit Apartments | 0 (0.0%) | 67 (100.0%) |
| 3 or 4 Unit Apartments | 0 (0.0%) | 100 (100.0%) |
| 5 to 9 Unit Apartments | 9 (17.0%) | 44 (83.0%) |
| 10 or more Apartments | 0 (0.0%) | 74 (100.0%) |
| Mobile Home / Other | 473 (87.3%) | 69 (12.7%) |
| Total | 3,166 (77.9%) | 899 (22.1%) |
Housing Structures by Number of Rooms in Webster County

| Number of Rooms | Owner-occupied | Renter-occupied |
| 1 Room | 4 (0.1%) | 15 (1.7%) |
| 2 or 3 Rooms | 110 (3.5%) | 186 (20.7%) |
| 4 or 5 Rooms | 1,179 (37.2%) | 366 (40.7%) |
| 6 or 7 Rooms | 1,196 (37.8%) | 286 (31.8%) |
| 8 or more Rooms | 677 (21.4%) | 46 (5.1%) |
| Total | 3,166 (100.0%) | 899 (100.0%) |
Housing Structure by Heating Type in Webster County

| Heating Type | Owner-occupied | Renter-occupied |
| Utility Gas | 977 (30.9%) | 242 (26.9%) |
| Bottled, Tank, or LP Gas | 607 (19.2%) | 244 (27.1%) |
| Electricity | 1,524 (48.1%) | 413 (45.9%) |
| Fuel Oil or Kerosene | 0 (0.0%) | 0 (0.0%) |
| Coal or Coke | 0 (0.0%) | 0 (0.0%) |
| All other Fuels | 56 (1.8%) | 0 (0.0%) |
| No Fuel Used | 2 (0.1%) | 0 (0.0%) |
| Total | 3,166 (100.0%) | 899 (100.0%) |
Household Vehicle Usage in Webster County
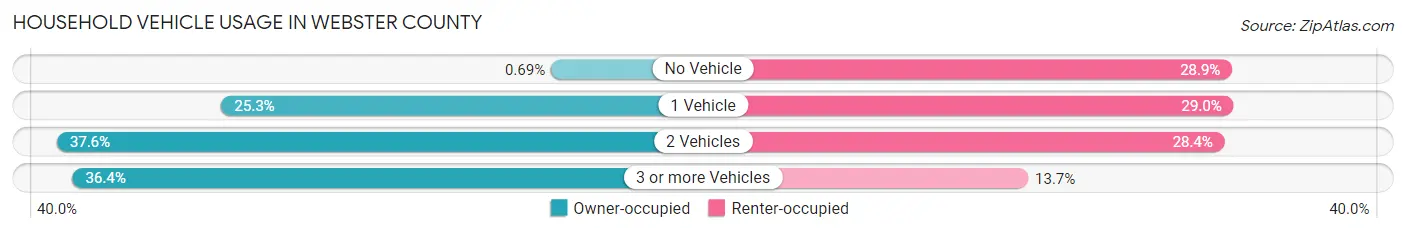
| Vehicles per Household | Owner-occupied | Renter-occupied |
| No Vehicle | 22 (0.7%) | 260 (28.9%) |
| 1 Vehicle | 801 (25.3%) | 261 (29.0%) |
| 2 Vehicles | 1,190 (37.6%) | 255 (28.4%) |
| 3 or more Vehicles | 1,153 (36.4%) | 123 (13.7%) |
| Total | 3,166 (100.0%) | 899 (100.0%) |
Real Estate & Mortgages in Webster County
Real Estate and Mortgage Overview in Webster County
| Characteristic | Without Mortgage | With Mortgage |
| Housing Units | 1,636 | 1,530 |
| Median Property Value | $97,900 | $120,700 |
| Median Household Income | $55,395 | $170 |
| Monthly Housing Costs | $354 | $47 |
| Real Estate Taxes | $526 | $287 |
Property Value by Mortgage Status in Webster County

| Property Value | Without Mortgage | With Mortgage |
| Less than $50,000 | 264 (16.1%) | 65 (4.3%) |
| $50,000 to $99,999 | 586 (35.8%) | 542 (35.4%) |
| $100,000 to $299,999 | 747 (45.7%) | 867 (56.7%) |
| $300,000 to $499,999 | 39 (2.4%) | 51 (3.3%) |
| $500,000 to $749,999 | 0 (0.0%) | 3 (0.2%) |
| $750,000 to $999,999 | 0 (0.0%) | 2 (0.1%) |
| $1,000,000 or more | 0 (0.0%) | 0 (0.0%) |
| Total | 1,636 (100.0%) | 1,530 (100.0%) |
Household Income by Mortgage Status in Webster County

| Household Income | Without Mortgage | With Mortgage |
| Less than $10,000 | 43 (2.6%) | 39 (2.5%) |
| $10,000 to $24,999 | 241 (14.7%) | 20 (1.3%) |
| $25,000 to $34,999 | 186 (11.4%) | 112 (7.3%) |
| $35,000 to $49,999 | 266 (16.3%) | 48 (3.1%) |
| $50,000 to $74,999 | 390 (23.8%) | 233 (15.2%) |
| $75,000 to $99,999 | 237 (14.5%) | 247 (16.1%) |
| $100,000 to $149,999 | 151 (9.2%) | 341 (22.3%) |
| $150,000 or more | 122 (7.5%) | 359 (23.5%) |
| Total | 1,636 (100.0%) | 1,530 (100.0%) |
Property Value to Household Income Ratio in Webster County

| Value-to-Income Ratio | Without Mortgage | With Mortgage |
| Less than 2.0x | 912 (55.7%) | 79,592 (5,202.1%) |
| 2.0x to 2.9x | 307 (18.8%) | 1,033 (67.5%) |
| 3.0x to 3.9x | 96 (5.9%) | 191 (12.5%) |
| 4.0x or more | 318 (19.4%) | 128 (8.4%) |
| Total | 1,636 (100.0%) | 1,530 (100.0%) |
Real Estate Taxes by Mortgage Status in Webster County

| Property Taxes | Without Mortgage | With Mortgage |
| Less than $800 | 782 (47.8%) | 11 (0.7%) |
| $800 to $1,499 | 285 (17.4%) | 658 (43.0%) |
| $800 to $1,499 | 123 (7.5%) | 265 (17.3%) |
| Total | 1,636 (100.0%) | 1,530 (100.0%) |
Health & Disability in Webster County
Health Insurance Coverage by Age in Webster County

| Age Bracket | With Coverage | Without Coverage |
| Under 6 Years | 577 (76.3%) | 179 (23.7%) |
| 6 to 18 Years | 1,641 (95.5%) | 77 (4.5%) |
| 19 to 25 Years | 556 (65.6%) | 291 (34.4%) |
| 26 to 34 Years | 827 (85.4%) | 142 (14.6%) |
| 35 to 44 Years | 976 (85.4%) | 167 (14.6%) |
| 45 to 54 Years | 884 (71.7%) | 349 (28.3%) |
| 55 to 64 Years | 1,241 (91.0%) | 122 (8.9%) |
| 65 to 74 Years | 1,082 (100.0%) | 0 (0.0%) |
| 75 Years and older | 737 (100.0%) | 0 (0.0%) |
| Total | 8,521 (86.5%) | 1,327 (13.5%) |
Health Insurance Coverage by Citizenship Status in Webster County

| Citizenship Status | With Coverage | Without Coverage |
| Native Born | 577 (76.3%) | 179 (23.7%) |
| Foreign Born, Citizen | 1,641 (95.5%) | 77 (4.5%) |
| Foreign Born, not a Citizen | 556 (65.6%) | 291 (34.4%) |
Health Insurance Coverage by Household Income in Webster County

| Household Income | With Coverage | Without Coverage |
| Under $25,000 | 1,232 (79.3%) | 321 (20.7%) |
| $25,000 to $49,999 | 1,517 (80.5%) | 367 (19.5%) |
| $50,000 to $74,999 | 1,674 (85.8%) | 277 (14.2%) |
| $75,000 to $99,999 | 1,744 (89.2%) | 211 (10.8%) |
| $100,000 and over | 2,354 (94.0%) | 151 (6.0%) |
Public vs Private Health Insurance Coverage by Age in Webster County

| Age Bracket | Public Insurance | Private Insurance |
| Under 6 | 328 (43.4%) | 272 (36.0%) |
| 6 to 18 Years | 756 (44.0%) | 938 (54.6%) |
| 19 to 25 Years | 128 (15.1%) | 433 (51.1%) |
| 25 to 34 Years | 122 (12.6%) | 720 (74.3%) |
| 35 to 44 Years | 135 (11.8%) | 869 (76.0%) |
| 45 to 54 Years | 205 (16.6%) | 722 (58.6%) |
| 55 to 64 Years | 378 (27.7%) | 943 (69.2%) |
| 65 to 74 Years | 1,064 (98.3%) | 551 (50.9%) |
| 75 Years and over | 737 (100.0%) | 489 (66.3%) |
| Total | 3,853 (39.1%) | 5,937 (60.3%) |
Disability Status by Sex by Age in Webster County

| Age Bracket | Male | Female |
| Under 5 Years | 0 (0.0%) | 0 (0.0%) |
| 5 to 17 Years | 31 (3.6%) | 82 (9.4%) |
| 18 to 34 Years | 55 (5.8%) | 67 (6.8%) |
| 35 to 64 Years | 455 (24.7%) | 433 (22.8%) |
| 65 to 74 Years | 186 (36.5%) | 231 (40.4%) |
| 75 Years and over | 164 (61.4%) | 305 (64.9%) |
Disability Class by Sex by Age in Webster County
Disability Class: Hearing Difficulty

| Age Bracket | Male | Female |
| Under 5 Years | 0 (0.0%) | 0 (0.0%) |
| 5 to 17 Years | 19 (2.2%) | 0 (0.0%) |
| 18 to 34 Years | 34 (3.6%) | 19 (1.9%) |
| 35 to 64 Years | 186 (10.1%) | 52 (2.7%) |
| 65 to 74 Years | 141 (27.7%) | 19 (3.3%) |
| 75 Years and over | 56 (21.0%) | 156 (33.2%) |
Disability Class: Vision Difficulty

| Age Bracket | Male | Female |
| Under 5 Years | 0 (0.0%) | 0 (0.0%) |
| 5 to 17 Years | 1 (0.1%) | 12 (1.4%) |
| 18 to 34 Years | 2 (0.2%) | 52 (5.3%) |
| 35 to 64 Years | 61 (3.3%) | 86 (4.5%) |
| 65 to 74 Years | 25 (4.9%) | 46 (8.0%) |
| 75 Years and over | 49 (18.3%) | 51 (10.8%) |
Disability Class: Cognitive Difficulty

| Age Bracket | Male | Female |
| 5 to 17 Years | 30 (3.5%) | 76 (8.7%) |
| 18 to 34 Years | 19 (2.0%) | 50 (5.1%) |
| 35 to 64 Years | 146 (7.9%) | 211 (11.1%) |
| 65 to 74 Years | 27 (5.3%) | 10 (1.8%) |
| 75 Years and over | 54 (20.2%) | 106 (22.6%) |
Disability Class: Ambulatory Difficulty

| Age Bracket | Male | Female |
| 5 to 17 Years | 0 (0.0%) | 6 (0.7%) |
| 18 to 34 Years | 0 (0.0%) | 3 (0.3%) |
| 35 to 64 Years | 276 (15.0%) | 285 (15.0%) |
| 65 to 74 Years | 86 (16.9%) | 172 (30.1%) |
| 75 Years and over | 76 (28.5%) | 249 (53.0%) |
Disability Class: Self-Care Difficulty

| Age Bracket | Male | Female |
| 5 to 17 Years | 0 (0.0%) | 6 (0.7%) |
| 18 to 34 Years | 0 (0.0%) | 0 (0.0%) |
| 35 to 64 Years | 32 (1.7%) | 19 (1.0%) |
| 65 to 74 Years | 37 (7.2%) | 47 (8.2%) |
| 75 Years and over | 38 (14.2%) | 115 (24.5%) |
Technology Access in Webster County
Computing Device Access in Webster County

| Device Type | # Households | % Households |
| Desktop or Laptop | 2,301 | 56.6% |
| Smartphone | 3,374 | 83.0% |
| Tablet | 1,718 | 42.3% |
| No Computing Device | 508 | 12.5% |
| Total | 4,065 | 100.0% |
Internet Access in Webster County

| Internet Type | # Households | % Households |
| Dial-Up Internet | 0 | 0.0% |
| Broadband Home | 1,763 | 43.4% |
| Cellular Data Only | 943 | 23.2% |
| Satellite Internet | 508 | 12.5% |
| No Internet | 961 | 23.6% |
| Total | 4,065 | 100.0% |
Webster County Summary
Webster County is located in the northeastern corner of Mississippi, and is bordered by the states of Tennessee and Arkansas. It is part of the Delta region of Mississippi, and is known for its rich agricultural heritage. The county was established in 1874, and is named after Daniel Webster, a prominent American statesman.
Geography
Webster County covers an area of 576 square miles, and is located in the northwestern corner of Mississippi. The county is mostly flat, with some rolling hills in the northern part. The terrain is mostly covered in forests, with some open fields and pastures. The county is drained by the Yocona River, which flows through the county from north to south.
The climate of Webster County is humid subtropical, with hot, humid summers and mild winters. The average annual temperature is around 70 degrees Fahrenheit, and the average annual precipitation is around 50 inches.
Demographics
As of the 2010 census, Webster County had a population of 10,253. The racial makeup of the county was 79.3% White, 18.3% African American, 0.3% Native American, 0.2% Asian, 0.1% Pacific Islander, 0.7% from other races, and 1.2% from two or more races. Hispanic or Latino of any race were 1.7% of the population.
The median income for a household in the county was $30,945, and the median income for a family was $37,917. The per capita income for the county was $15,845. About 22.2% of families and 27.2% of the population were below the poverty line, including 37.2% of those under age 18 and 22.2% of those age 65 or over.
Economy
Webster County has a largely agricultural economy, with the majority of the population employed in farming and related activities. The county is known for its cotton production, and is also a major producer of soybeans, corn, and other crops. Livestock production is also important to the local economy, with cattle, hogs, and poultry being raised in the area.
The county also has a small manufacturing sector, with several small factories producing furniture, textiles, and other goods. The county is also home to several small businesses, including restaurants, retail stores, and service providers.
The county is served by two major highways, US Highway 45 and Mississippi Highway 9. The county is also served by the Mississippi Delta Railroad, which runs through the county from north to south.
Conclusion
Webster County is a rural county located in the northeastern corner of Mississippi. The county is known for its rich agricultural heritage, and is a major producer of cotton, soybeans, and other crops. The county also has a small manufacturing sector, and is served by two major highways and the Mississippi Delta Railroad. The population of the county is largely white, with a small African American minority. The median income for a household in the county is around $30,000, and the poverty rate is around 22%.
Common Questions
What is the Total Population of Webster County?
Total Population of Webster County is 9,942.
What is the Total Male Population of Webster County?
Total Male Population of Webster County is 4,754.
What is the Total Female Population of Webster County?
Total Female Population of Webster County is 5,188.
What is the Ratio of Males per 100 Females in Webster County?
There are 91.63 Males per 100 Females in Webster County.
What is the Ratio of Females per 100 Males in Webster County?
There are 109.13 Females per 100 Males in Webster County.
What is the Median Population Age in Webster County?
Median Population Age in Webster County is 40.1 Years.
What is the Average Family Size in Webster County
Average Family Size in Webster County is 3.0 People.
What is the Average Household Size in Webster County
Average Household Size in Webster County is 2.4 People.
What is Per Capita Income in Webster County?
Per Capita income in Webster County is $27,836.
What is the Median Family Income in Webster County?
Median Family Income in Webster County is $71,418.
What is the Median Household income in Webster County?
Median Household Income in Webster County is $55,657.
What is Income or Wage Gap in Webster County?
Income or Wage Gap in Webster County is 38.6%.
Women in Webster County earn 61.4 cents for every dollar earned by a man.
What is Inequality or Gini Index in Webster County?
Inequality or Gini Index in Webster County is 0.41.
How Large is the Labor Force in Webster County?
There are 4,393 People in the Labor Forcein in Webster County.
What is the Percentage of People in the Labor Force in Webster County?
56.3% of People are in the Labor Force in Webster County.
What is the Unemployment Rate in Webster County?
Unemployment Rate in Webster County is 6.4%.