Tishomingo County, MS
Tishomingo County Map

Tishomingo County Overview
18,837
TOTAL POPULATION
9,169
MALE POPULATION
9,668
FEMALE POPULATION
94.84
MALES / 100 FEMALES
105.44
FEMALES / 100 MALES
43.6
MEDIAN AGE
2.8
AVG FAMILY SIZE
2.2
AVG HOUSEHOLD SIZE
$26,896
PER CAPITA INCOME
$67,880
AVG FAMILY INCOME
$45,545
AVG HOUSEHOLD INCOME
39.3%
WAGE / INCOME GAP [ % ]
60.7¢/ $1
WAGE / INCOME GAP [ $ ]
$10,214
FAMILY INCOME DEFICIT
0.47
INEQUALITY / GINI INDEX
7,787
LABOR FORCE [ PEOPLE ]
51.0%
PERCENT IN LABOR FORCE
3.5%
UNEMPLOYMENT RATE
Tishomingo County Area Codes
Race in Tishomingo County
The most populous races in Tishomingo County are White / Caucasian (17,303 | 91.9%), Two or more Races (922 | 4.9%), and Hispanic or Latino (663 | 3.5%).

| Race | # Population | % Population |
| Asian | 121 | 0.6% |
| Black / African American | 253 | 1.3% |
| Hawaiian / Pacific | 0 | 0.0% |
| Hispanic or Latino | 663 | 3.5% |
| Native / Alaskan | 82 | 0.4% |
| White / Caucasian | 17,303 | 91.9% |
| Two or more Races | 922 | 4.9% |
| Some other Race | 156 | 0.8% |
| Total | 18,837 | 100.0% |
Ancestry in Tishomingo County
The most populous ancestries reported in Tishomingo County are American (3,562 | 18.9%), Irish (2,614 | 13.9%), English (2,145 | 11.4%), German (850 | 4.5%), and Mexican (610 | 3.2%), together accounting for 51.9% of all Tishomingo County residents.

| Ancestry | # Population | % Population |
| African | 11 | 0.1% |
| American | 3,562 | 18.9% |
| Bhutanese | 9 | 0.1% |
| Brazilian | 5 | 0.0% |
| British | 79 | 0.4% |
| Cajun | 3 | 0.0% |
| Central American | 4 | 0.0% |
| Cherokee | 71 | 0.4% |
| Chickasaw | 19 | 0.1% |
| Choctaw | 31 | 0.2% |
| Colombian | 12 | 0.1% |
| Czech | 8 | 0.0% |
| Czechoslovakian | 14 | 0.1% |
| Danish | 29 | 0.2% |
| Dutch | 283 | 1.5% |
| English | 2,145 | 11.4% |
| European | 219 | 1.2% |
| French | 267 | 1.4% |
| French Canadian | 27 | 0.1% |
| German | 850 | 4.5% |
| Guatemalan | 4 | 0.0% |
| Houma | 55 | 0.3% |
| Indian (Asian) | 18 | 0.1% |
| Irish | 2,614 | 13.9% |
| Iroquois | 13 | 0.1% |
| Italian | 170 | 0.9% |
| Korean | 2 | 0.0% |
| Lithuanian | 5 | 0.0% |
| Maltese | 1 | 0.0% |
| Mexican | 610 | 3.2% |
| Northern European | 34 | 0.2% |
| Norwegian | 6 | 0.0% |
| Pakistani | 14 | 0.1% |
| Polish | 92 | 0.5% |
| Puerto Rican | 6 | 0.0% |
| Romanian | 13 | 0.1% |
| Russian | 47 | 0.3% |
| Scotch-Irish | 233 | 1.2% |
| Scottish | 287 | 1.5% |
| Slavic | 5 | 0.0% |
| Slovak | 2 | 0.0% |
| South American | 12 | 0.1% |
| Subsaharan African | 11 | 0.1% |
| Swedish | 29 | 0.2% |
| Swiss | 36 | 0.2% |
| Thai | 95 | 0.5% |
| Welsh | 46 | 0.2% | View All 47 Rows |
Immigrants in Tishomingo County
The most numerous immigrant groups reported in Tishomingo County came from Latin America (327 | 1.7%), Central America (322 | 1.7%), Mexico (318 | 1.7%), Asia (24 | 0.1%), and India (16 | 0.1%), together accounting for 5.4% of all Tishomingo County residents.

| Immigration Origin | # Population | % Population |
| Asia | 24 | 0.1% |
| Brazil | 5 | 0.0% |
| Central America | 322 | 1.7% |
| Czechoslovakia | 6 | 0.0% |
| Eastern Europe | 6 | 0.0% |
| Europe | 6 | 0.0% |
| Guatemala | 4 | 0.0% |
| India | 16 | 0.1% |
| Latin America | 327 | 1.7% |
| Mexico | 318 | 1.7% |
| Philippines | 2 | 0.0% |
| South America | 5 | 0.0% |
| South Central Asia | 16 | 0.1% |
| South Eastern Asia | 8 | 0.0% |
| Thailand | 6 | 0.0% | View All 15 Rows |
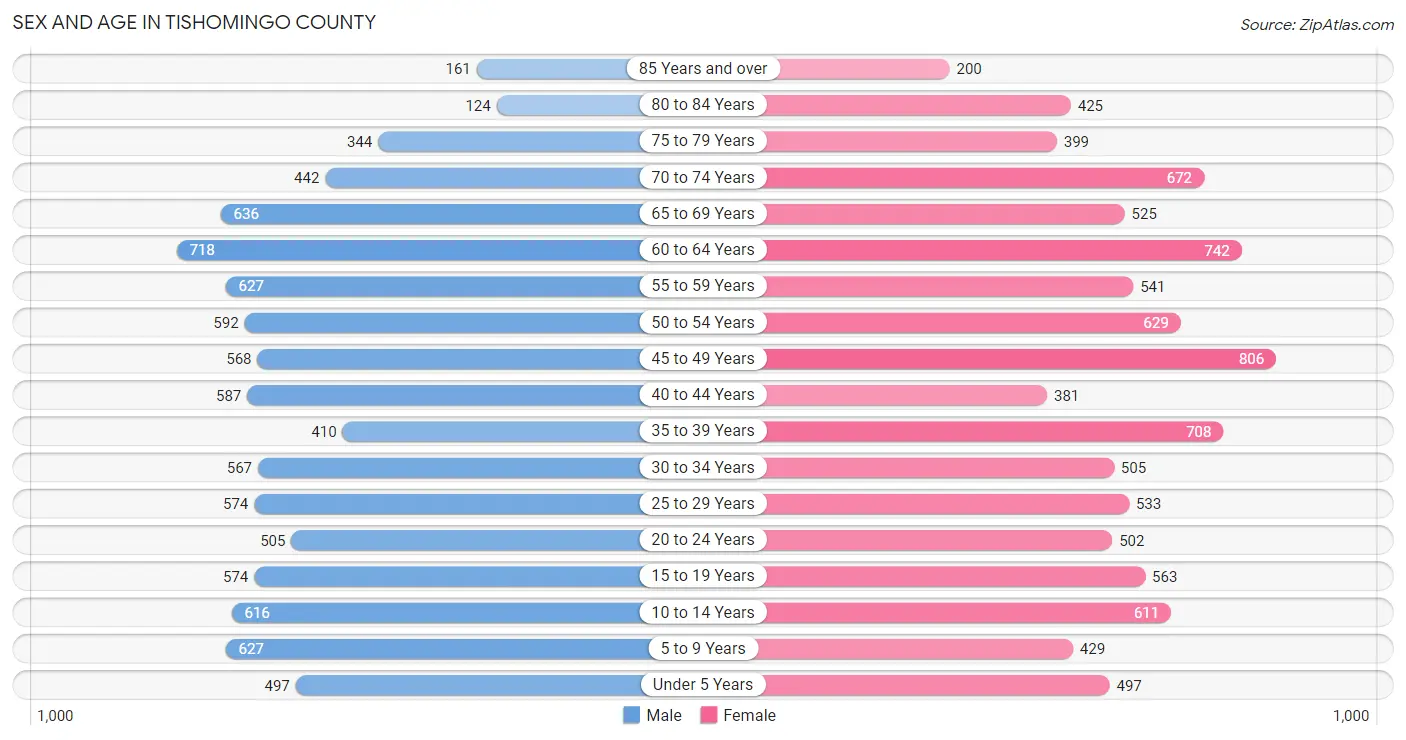
Sex and Age in Tishomingo County
Sex and Age in Tishomingo County
The most populous age groups in Tishomingo County are 60 to 64 Years (718 | 7.8%) for men and 45 to 49 Years (806 | 8.3%) for women.
| Age Bracket | Male | Female |
| Under 5 Years | 497 (5.4%) | 497 (5.1%) |
| 5 to 9 Years | 627 (6.8%) | 429 (4.4%) |
| 10 to 14 Years | 616 (6.7%) | 611 (6.3%) |
| 15 to 19 Years | 574 (6.3%) | 563 (5.8%) |
| 20 to 24 Years | 505 (5.5%) | 502 (5.2%) |
| 25 to 29 Years | 574 (6.3%) | 533 (5.5%) |
| 30 to 34 Years | 567 (6.2%) | 505 (5.2%) |
| 35 to 39 Years | 410 (4.5%) | 708 (7.3%) |
| 40 to 44 Years | 587 (6.4%) | 381 (3.9%) |
| 45 to 49 Years | 568 (6.2%) | 806 (8.3%) |
| 50 to 54 Years | 592 (6.5%) | 629 (6.5%) |
| 55 to 59 Years | 627 (6.8%) | 541 (5.6%) |
| 60 to 64 Years | 718 (7.8%) | 742 (7.7%) |
| 65 to 69 Years | 636 (6.9%) | 525 (5.4%) |
| 70 to 74 Years | 442 (4.8%) | 672 (7.0%) |
| 75 to 79 Years | 344 (3.7%) | 399 (4.1%) |
| 80 to 84 Years | 124 (1.3%) | 425 (4.4%) |
| 85 Years and over | 161 (1.8%) | 200 (2.1%) |
| Total | 9,169 (100.0%) | 9,668 (100.0%) |
Families and Households in Tishomingo County
Median Family Size in Tishomingo County
The median family size in Tishomingo County is 2.81 persons per family, with single female/mother families (804 | 15.3%) accounting for the largest median family size of 2.94 persons per family. On the other hand, married-couple families (4,115 | 78.5%) represent the smallest median family size with 2.78 persons per family.

| Family Type | # Families | Family Size |
| Married-Couple | 4,115 (78.5%) | 2.78 |
| Single Male/Father | 321 (6.1%) | 2.82 |
| Single Female/Mother | 804 (15.3%) | 2.94 |
| Total Families | 5,240 (100.0%) | 2.81 |
Median Household Size in Tishomingo County
The median household size in Tishomingo County is 2.19 persons per household, with single male/father households (321 | 3.8%) accounting for the largest median household size of 3.09 persons per household. non-family households (3,223 | 38.1%) represent the smallest median household size with 1.11 persons per household.

| Household Type | # Households | Household Size |
| Married-Couple | 4,115 (48.6%) | 2.80 |
| Single Male/Father | 321 (3.8%) | 3.09 |
| Single Female/Mother | 804 (9.5%) | 3.06 |
| Non-family | 3,223 (38.1%) | 1.11 |
| Total Households | 8,463 (100.0%) | 2.19 |
Household Size by Marriage Status in Tishomingo County
Out of a total of 8,463 households in Tishomingo County, 5,240 (61.9%) are family households, while 3,223 (38.1%) are nonfamily households. The most numerous type of family households are 2-person households, comprising 2,490, and the most common type of nonfamily households are 1-person households, comprising 2,857.

| Household Size | Family Households | Nonfamily Households |
| 1-Person Households | - | 2,857 (33.8%) |
| 2-Person Households | 2,490 (29.4%) | 341 (4.0%) |
| 3-Person Households | 1,296 (15.3%) | 0 (0.0%) |
| 4-Person Households | 746 (8.8%) | 0 (0.0%) |
| 5-Person Households | 545 (6.4%) | 25 (0.3%) |
| 6-Person Households | 144 (1.7%) | 0 (0.0%) |
| 7+ Person Households | 19 (0.2%) | 0 (0.0%) |
| Total | 5,240 (61.9%) | 3,223 (38.1%) |
Female Fertility in Tishomingo County
Fertility by Age in Tishomingo County
Average fertility rate in Tishomingo County is 43.0 births per 1,000 women. Women in the age bracket of 20 to 34 years have the highest fertility rate with 52.0 births per 1,000 women. Women in the age bracket of 35 to 50 years acount for 54.0% of all women with births.

| Age Bracket | Women with Births | Births / 1,000 Women |
| 15 to 19 years | 0 (0.0%) | 0.0 |
| 20 to 34 years | 80 (46.0%) | 52.0 |
| 35 to 50 years | 94 (54.0%) | 48.0 |
| Total | 174 (100.0%) | 43.0 |
Fertility by Age by Marriage Status in Tishomingo County
85.6% of women with births (174) in Tishomingo County are married. The highest percentage of unmarried women with births falls into 35 to 50 years age bracket with 16.0% of them unmarried at the time of birth, while the lowest percentage of unmarried women with births belong to 20 to 34 years age bracket with 12.5% of them unmarried.

| Age Bracket | Married | Unmarried |
| 15 to 19 years | 0 (0.0%) | 0 (0.0%) |
| 20 to 34 years | 70 (87.5%) | 10 (12.5%) |
| 35 to 50 years | 79 (84.0%) | 15 (16.0%) |
| Total | 149 (85.6%) | 25 (14.4%) |
Fertility by Education in Tishomingo County

| Educational Attainment | Women with Births | Births / 1,000 Women |
| Less than High School | 44 (25.3%) | 47.0 |
| High School Diploma | 34 (19.5%) | 40.0 |
| College or Associate's Degree | 40 (23.0%) | 26.0 |
| Bachelor's Degree | 56 (32.2%) | 116.0 |
| Graduate Degree | 0 (0.0%) | 0.0 |
| Total | 174 (100.0%) | 43.0 |
Fertility by Education by Marriage Status in Tishomingo County
14.4% of women with births in Tishomingo County are unmarried. Women with the educational attainment of high school diploma are most likely to be married with 100.0% of them married at childbirth, while women with the educational attainment of college or associate's degree are least likely to be married with 30.0% of them unmarried at childbirth.

| Educational Attainment | Married | Unmarried |
| Less than High School | 31 (70.5%) | 13 (29.5%) |
| High School Diploma | 34 (100.0%) | 0 (0.0%) |
| College or Associate's Degree | 28 (70.0%) | 12 (30.0%) |
| Bachelor's Degree | 56 (100.0%) | 0 (0.0%) |
| Graduate Degree | 0 (0.0%) | 0 (0.0%) |
| Total | 149 (85.6%) | 25 (14.4%) |
Income in Tishomingo County
Income Overview in Tishomingo County
Per Capita Income in Tishomingo County is $26,896, while median incomes of families and households are $67,880 and $45,545 respectively.
| Characteristic | Number | Measure |
| Per Capita Income | 18,837 | $26,896 |
| Median Family Income | 5,240 | $67,880 |
| Mean Family Income | 5,240 | $79,516 |
| Median Household Income | 8,463 | $45,545 |
| Mean Household Income | 8,463 | $60,901 |
| Income Deficit | 5,240 | $10,214 |
| Wage / Income Gap (%) | 18,837 | 39.29% |
| Wage / Income Gap ($) | 18,837 | 60.71¢ per $1 |
| Gini / Inequality Index | 18,837 | 0.47 |
Earnings by Sex in Tishomingo County
Average Earnings in Tishomingo County are $39,140, $47,902 for men and $29,080 for women, a difference of 39.3%.

| Sex | Number | Average Earnings |
| Male | 4,459 (54.0%) | $47,902 |
| Female | 3,792 (46.0%) | $29,080 |
| Total | 8,251 (100.0%) | $39,140 |
Earnings by Sex by Income Bracket in Tishomingo County
The most common earnings brackets in Tishomingo County are $55,000 to $64,999 for men (665 | 14.9%) and $15,000 to $17,499 for women (368 | 9.7%).

| Income | Male | Female |
| $2,499 or less | 55 (1.2%) | 218 (5.8%) |
| $2,500 to $4,999 | 106 (2.4%) | 151 (4.0%) |
| $5,000 to $7,499 | 136 (3.0%) | 141 (3.7%) |
| $7,500 to $9,999 | 106 (2.4%) | 141 (3.7%) |
| $10,000 to $12,499 | 67 (1.5%) | 113 (3.0%) |
| $12,500 to $14,999 | 199 (4.5%) | 124 (3.3%) |
| $15,000 to $17,499 | 14 (0.3%) | 368 (9.7%) |
| $17,500 to $19,999 | 130 (2.9%) | 133 (3.5%) |
| $20,000 to $22,499 | 79 (1.8%) | 155 (4.1%) |
| $22,500 to $24,999 | 147 (3.3%) | 83 (2.2%) |
| $25,000 to $29,999 | 268 (6.0%) | 347 (9.1%) |
| $30,000 to $34,999 | 309 (6.9%) | 240 (6.3%) |
| $35,000 to $39,999 | 176 (4.0%) | 212 (5.6%) |
| $40,000 to $44,999 | 254 (5.7%) | 219 (5.8%) |
| $45,000 to $49,999 | 301 (6.8%) | 267 (7.0%) |
| $50,000 to $54,999 | 464 (10.4%) | 99 (2.6%) |
| $55,000 to $64,999 | 665 (14.9%) | 171 (4.5%) |
| $65,000 to $74,999 | 234 (5.2%) | 317 (8.4%) |
| $75,000 to $99,999 | 298 (6.7%) | 167 (4.4%) |
| $100,000+ | 451 (10.1%) | 126 (3.3%) |
| Total | 4,459 (100.0%) | 3,792 (100.0%) |
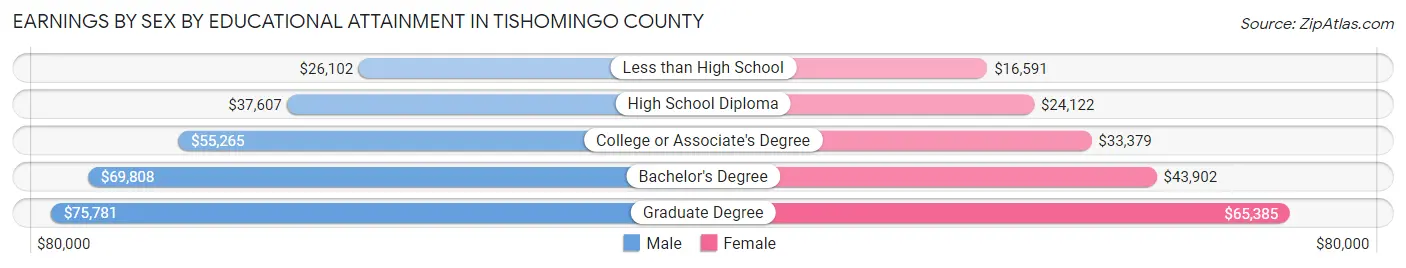
Earnings by Sex by Educational Attainment in Tishomingo County
Average earnings in Tishomingo County are $50,542 for men and $33,854 for women, a difference of 33.0%. Men with an educational attainment of graduate degree enjoy the highest average annual earnings of $75,781, while those with less than high school education earn the least with $26,102. Women with an educational attainment of graduate degree earn the most with the average annual earnings of $65,385, while those with less than high school education have the smallest earnings of $16,591.
| Educational Attainment | Male Income | Female Income |
| Less than High School | $26,102 | $16,591 |
| High School Diploma | $37,607 | $24,122 |
| College or Associate's Degree | $55,265 | $33,379 |
| Bachelor's Degree | $69,808 | $43,902 |
| Graduate Degree | $75,781 | $65,385 |
| Total | $50,542 | $33,854 |
Family Income in Tishomingo County
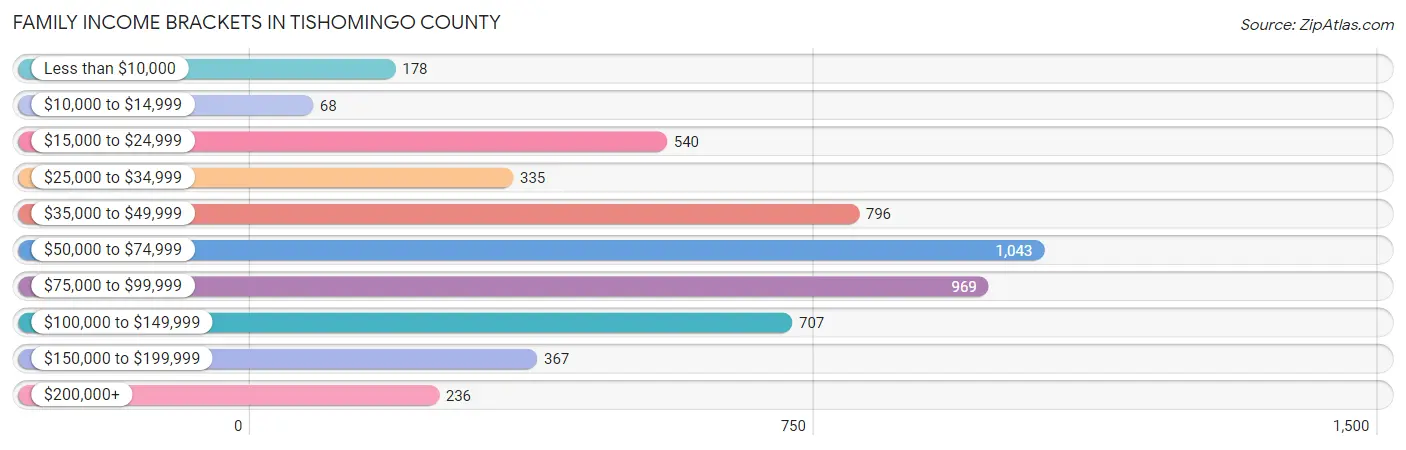
Family Income Brackets in Tishomingo County
According to the Tishomingo County family income data, there are 1,043 families falling into the $50,000 to $74,999 income range, which is the most common income bracket and makes up 19.9% of all families. Conversely, the $10,000 to $14,999 income bracket is the least frequent group with only 68 families (1.3%) belonging to this category.
| Income Bracket | # Families | % Families |
| Less than $10,000 | 178 | 3.4% |
| $10,000 to $14,999 | 68 | 1.3% |
| $15,000 to $24,999 | 540 | 10.3% |
| $25,000 to $34,999 | 335 | 6.4% |
| $35,000 to $49,999 | 796 | 15.2% |
| $50,000 to $74,999 | 1,043 | 19.9% |
| $75,000 to $99,999 | 969 | 18.5% |
| $100,000 to $149,999 | 707 | 13.5% |
| $150,000 to $199,999 | 367 | 7.0% |
| $200,000+ | 236 | 4.5% |
Family Income by Famaliy Size in Tishomingo County
4-person families (728 | 13.9%) account for the highest median family income in Tishomingo County with $96,250 per family, while 2-person families (2,533 | 48.3%) have the highest median income of $28,332 per family member.

| Income Bracket | # Families | Median Income |
| 2-Person Families | 2,533 (48.3%) | $56,663 |
| 3-Person Families | 1,340 (25.6%) | $78,864 |
| 4-Person Families | 728 (13.9%) | $96,250 |
| 5-Person Families | 511 (9.8%) | $83,260 |
| 6-Person Families | 109 (2.1%) | $65,417 |
| 7+ Person Families | 19 (0.4%) | $0 |
| Total | 5,240 (100.0%) | $67,880 |
Family Income by Number of Earners in Tishomingo County
The median family income in Tishomingo County is $67,880, with families comprising 3+ earners (463) having the highest median family income of $108,778, while families with no earners (1,181) have the lowest median family income of $37,542, accounting for 8.8% and 22.5% of families, respectively.

| Number of Earners | # Families | Median Income |
| No Earners | 1,181 (22.5%) | $37,542 |
| 1 Earner | 1,655 (31.6%) | $50,625 |
| 2 Earners | 1,941 (37.0%) | $96,030 |
| 3+ Earners | 463 (8.8%) | $108,778 |
| Total | 5,240 (100.0%) | $67,880 |
Household Income in Tishomingo County
Household Income Brackets in Tishomingo County
With 1,566 households falling in the category, the $50,000 to $74,999 income range is the most frequent in Tishomingo County, accounting for 18.5% of all households. In contrast, only 288 households (3.4%) fall into the $200,000+ income bracket, making it the least populous group.

| Income Bracket | # Households | % Households |
| Less than $10,000 | 787 | 9.3% |
| $10,000 to $14,999 | 618 | 7.3% |
| $15,000 to $24,999 | 1,320 | 15.6% |
| $25,000 to $34,999 | 643 | 7.6% |
| $35,000 to $49,999 | 1,049 | 12.4% |
| $50,000 to $74,999 | 1,566 | 18.5% |
| $75,000 to $99,999 | 1,075 | 12.7% |
| $100,000 to $149,999 | 787 | 9.3% |
| $150,000 to $199,999 | 330 | 3.9% |
| $200,000+ | 288 | 3.4% |
Household Income by Householder Age in Tishomingo County
The median household income in Tishomingo County is $45,545, with the highest median household income of $56,856 found in the 25 to 44 years age bracket for the primary householder. A total of 2,370 households (28.0%) fall into this category. Meanwhile, the 15 to 24 years age bracket for the primary householder has the lowest median household income of $0, with 406 households (4.8%) in this group.

| Income Bracket | # Households | Median Income |
| 15 to 24 Years | 406 (4.8%) | $0 |
| 25 to 44 Years | 2,370 (28.0%) | $56,856 |
| 45 to 64 Years | 3,000 (35.4%) | $53,068 |
| 65+ Years | 2,687 (31.8%) | $33,912 |
| Total | 8,463 (100.0%) | $45,545 |
Poverty in Tishomingo County
Income Below Poverty by Sex and Age in Tishomingo County
With 18.8% poverty level for males and 19.6% for females among the residents of Tishomingo County, 5 year old males and under 5 year old females are the most vulnerable to poverty, with 96 males (60.4%) and 185 females (37.2%) in their respective age groups living below the poverty level.

| Age Bracket | Male | Female |
| Under 5 Years | 92 (18.8%) | 185 (37.2%) |
| 5 Years | 96 (60.4%) | 17 (13.5%) |
| 6 to 11 Years | 192 (24.7%) | 89 (16.0%) |
| 12 to 14 Years | 71 (23.9%) | 30 (8.4%) |
| 15 Years | 33 (25.8%) | 50 (30.5%) |
| 16 and 17 Years | 80 (29.7%) | 36 (16.4%) |
| 18 to 24 Years | 132 (19.4%) | 208 (30.5%) |
| 25 to 34 Years | 87 (7.9%) | 216 (21.0%) |
| 35 to 44 Years | 198 (20.2%) | 272 (25.3%) |
| 45 to 54 Years | 66 (5.9%) | 217 (15.1%) |
| 55 to 64 Years | 338 (25.6%) | 148 (11.6%) |
| 65 to 74 Years | 176 (16.5%) | 218 (18.8%) |
| 75 Years and over | 136 (22.4%) | 178 (18.7%) |
| Total | 1,697 (18.8%) | 1,864 (19.6%) |
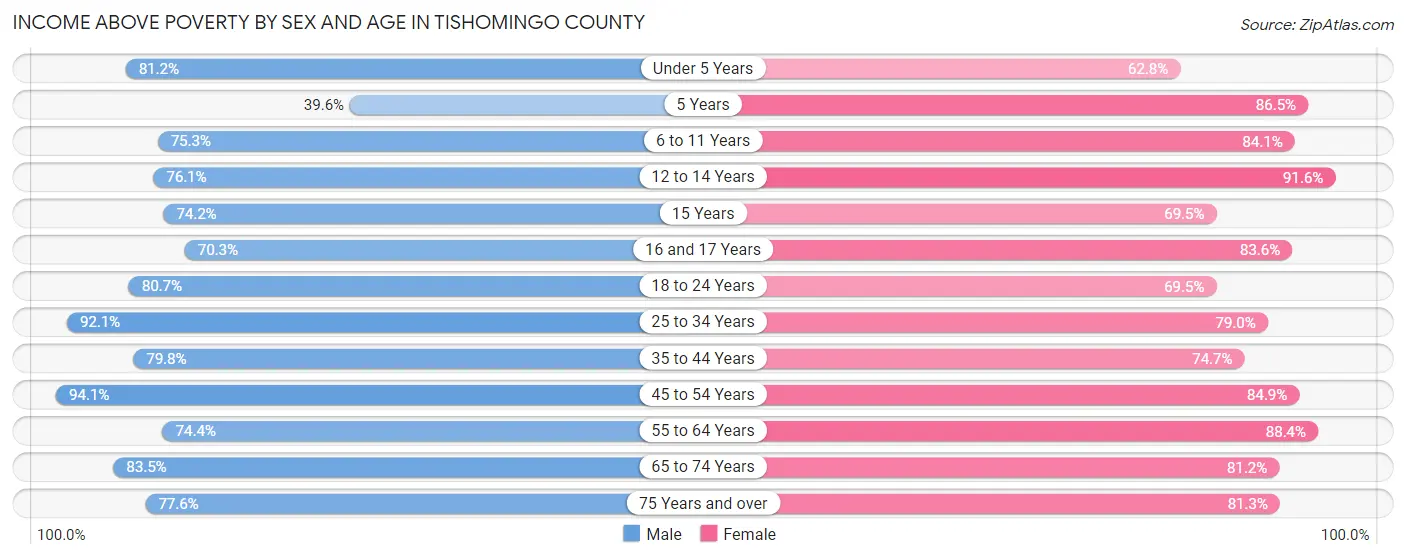
Income Above Poverty by Sex and Age in Tishomingo County
According to the poverty statistics in Tishomingo County, males aged 45 to 54 years and females aged 12 to 14 years are the age groups that are most secure financially, with 94.1% of males and 91.6% of females in these age groups living above the poverty line.
| Age Bracket | Male | Female |
| Under 5 Years | 398 (81.2%) | 312 (62.8%) |
| 5 Years | 63 (39.6%) | 109 (86.5%) |
| 6 to 11 Years | 585 (75.3%) | 469 (84.1%) |
| 12 to 14 Years | 226 (76.1%) | 326 (91.6%) |
| 15 Years | 95 (74.2%) | 114 (69.5%) |
| 16 and 17 Years | 189 (70.3%) | 183 (83.6%) |
| 18 to 24 Years | 550 (80.6%) | 474 (69.5%) |
| 25 to 34 Years | 1,019 (92.1%) | 814 (79.0%) |
| 35 to 44 Years | 783 (79.8%) | 803 (74.7%) |
| 45 to 54 Years | 1,060 (94.1%) | 1,218 (84.9%) |
| 55 to 64 Years | 981 (74.4%) | 1,123 (88.4%) |
| 65 to 74 Years | 891 (83.5%) | 940 (81.2%) |
| 75 Years and over | 470 (77.6%) | 773 (81.3%) |
| Total | 7,310 (81.2%) | 7,658 (80.4%) |
Income Below Poverty Among Married-Couple Families in Tishomingo County
The poverty statistics for married-couple families in Tishomingo County show that 5.5% or 228 of the total 4,115 families live below the poverty line. Families with 5 or more children have the highest poverty rate of 100.0%, comprising of 19 families. On the other hand, families with no children have the lowest poverty rate of 3.5%, which includes 88 families.

| Children | Above Poverty | Below Poverty |
| No Children | 2,441 (96.5%) | 88 (3.5%) |
| 1 or 2 Children | 1,161 (91.8%) | 104 (8.2%) |
| 3 or 4 Children | 285 (94.4%) | 17 (5.6%) |
| 5 or more Children | 0 (0.0%) | 19 (100.0%) |
| Total | 3,887 (94.5%) | 228 (5.5%) |
Income Below Poverty Among Single-Parent Households in Tishomingo County
According to the poverty data in Tishomingo County, 20.9% or 67 single-father households and 43.4% or 349 single-mother households are living below the poverty line. Among single-father households, those with 1 or 2 children have the highest poverty rate, with 67 households (29.9%) experiencing poverty. Likewise, among single-mother households, those with 3 or 4 children have the highest poverty rate, with 88 households (69.8%) falling below the poverty line.

| Children | Single Father | Single Mother |
| No Children | 0 (0.0%) | 83 (30.3%) |
| 1 or 2 Children | 67 (29.9%) | 178 (44.1%) |
| 3 or 4 Children | 0 (0.0%) | 88 (69.8%) |
| 5 or more Children | 0 (0.0%) | 0 (0.0%) |
| Total | 67 (20.9%) | 349 (43.4%) |
Income Below Poverty Among Married-Couple vs Single-Parent Households in Tishomingo County
The poverty data for Tishomingo County shows that 228 of the married-couple family households (5.5%) and 416 of the single-parent households (37.0%) are living below the poverty level. Within the married-couple family households, those with 5 or more children have the highest poverty rate, with 19 households (100.0%) falling below the poverty line. Among the single-parent households, those with 3 or 4 children have the highest poverty rate, with 88 household (54.0%) living below poverty.

| Children | Married-Couple Families | Single-Parent Households |
| No Children | 88 (3.5%) | 83 (24.8%) |
| 1 or 2 Children | 104 (8.2%) | 245 (39.0%) |
| 3 or 4 Children | 17 (5.6%) | 88 (54.0%) |
| 5 or more Children | 19 (100.0%) | 0 (0.0%) |
| Total | 228 (5.5%) | 416 (37.0%) |
Employment Characteristics in Tishomingo County
Employment by Class of Employer in Tishomingo County
Among the 7,399 employed individuals in Tishomingo County, private company employees (5,202 | 70.3%), local government employees (619 | 8.4%), and self-employed (incorporated) (448 | 6.0%) make up the most common classes of employment.

| Employer Class | # Employees | % Employees |
| Private Company Employees | 5,202 | 70.3% |
| Self-Employed (Incorporated) | 448 | 6.0% |
| Self-Employed (Not Incorporated) | 316 | 4.3% |
| Not-for-profit Organizations | 345 | 4.7% |
| Local Government Employees | 619 | 8.4% |
| State Government Employees | 317 | 4.3% |
| Federal Government Employees | 152 | 2.1% |
| Unpaid Family Workers | 0 | 0.0% |
| Total | 7,399 | 100.0% |
Employment Status by Age in Tishomingo County
According to the labor force statistics for Tishomingo County, out of the total population over 16 years of age (15,268), 51.0% or 7,787 individuals are in the labor force, with 3.5% or 273 of them unemployed. The age group with the highest labor force participation rate is 30 to 34 years, with 87.0% or 933 individuals in the labor force. Within the labor force, the 16 to 19 years age range has the highest percentage of unemployed individuals, with 27.5% or 84 of them being unemployed.

| Age Bracket | In Labor Force | Unemployed |
| 16 to 19 Years | 305 (36.1%) | 84 (27.5%) |
| 20 to 24 Years | 779 (77.4%) | 38 (4.9%) |
| 25 to 29 Years | 871 (78.7%) | 71 (8.2%) |
| 30 to 34 Years | 933 (87.0%) | 9 (1.0%) |
| 35 to 44 Years | 1,548 (74.2%) | 31 (2.0%) |
| 45 to 54 Years | 1,871 (72.1%) | 13 (0.7%) |
| 55 to 59 Years | 639 (54.7%) | 6 (0.9%) |
| 60 to 64 Years | 504 (34.5%) | 0 (0.0%) |
| 65 to 74 Years | 253 (11.1%) | 23 (9.1%) |
| 75 Years and over | 86 (5.2%) | 0 (0.0%) |
| Total | 7,787 (51.0%) | 273 (3.5%) |
Employment Status by Educational Attainment in Tishomingo County
According to labor force statistics for Tishomingo County, 67.1% of individuals (6,366) out of the total population between 25 and 64 years of age (9,488) are in the labor force, with 2.1% or 134 of them being unemployed. The group with the highest labor force participation rate are those with the educational attainment of bachelor's degree or higher, with 84.7% or 1,254 individuals in the labor force. Within the labor force, individuals with high school diploma education have the highest percentage of unemployment, with 4.2% or 77 of them being unemployed.

| Educational Attainment | In Labor Force | Unemployed |
| Less than High School | 778 (47.5%) | 13 (0.8%) |
| High School Diploma | 1,839 (64.4%) | 120 (4.2%) |
| College / Associate Degree | 2,499 (71.1%) | 60 (1.7%) |
| Bachelor's Degree or higher | 1,254 (84.7%) | 7 (0.5%) |
| Total | 6,366 (67.1%) | 199 (2.1%) |
Employment Occupations by Sex in Tishomingo County
Management, Business, Science and Arts Occupations
The most common Management, Business, Science and Arts occupations in Tishomingo County are Health Diagnosing & Treating (858 | 11.4%), Health Technologists (590 | 7.9%), Management (579 | 7.7%), Community & Social Service (498 | 6.6%), and Education Instruction & Library (350 | 4.7%).

Management, Business, Science and Arts Occupations by Sex
Within the Management, Business, Science and Arts occupations in Tishomingo County, the most male-oriented occupations are Legal Services & Support (100.0%), Architecture & Engineering (95.6%), and Computers, Engineering & Science (91.2%), while the most female-oriented occupations are Health Technologists (92.4%), Health Diagnosing & Treating (92.2%), and Arts, Media & Entertainment (90.5%).

| Occupation | Male | Female |
| Management | 391 (67.5%) | 188 (32.5%) |
| Business & Financial | 85 (53.1%) | 75 (46.9%) |
| Computers, Engineering & Science | 250 (91.2%) | 24 (8.8%) |
| Computers & Mathematics | 14 (51.8%) | 13 (48.1%) |
| Architecture & Engineering | 236 (95.6%) | 11 (4.4%) |
| Life, Physical & Social Science | 0 (0.0%) | 0 (0.0%) |
| Community & Social Service | 136 (27.3%) | 362 (72.7%) |
| Education, Arts & Media | 54 (60.7%) | 35 (39.3%) |
| Legal Services & Support | 17 (100.0%) | 0 (0.0%) |
| Education Instruction & Library | 61 (17.4%) | 289 (82.6%) |
| Arts, Media & Entertainment | 4 (9.5%) | 38 (90.5%) |
| Health Diagnosing & Treating | 67 (7.8%) | 791 (92.2%) |
| Health Technologists | 45 (7.6%) | 545 (92.4%) |
| Total (Category) | 929 (39.2%) | 1,440 (60.8%) |
| Total (Overall) | 4,082 (54.3%) | 3,432 (45.7%) |
Services Occupations
The most common Services occupations in Tishomingo County are Food Preparation & Serving (447 | 5.9%), Cleaning & Maintenance (189 | 2.5%), Security & Protection (148 | 2.0%), Law Enforcement (105 | 1.4%), and Personal Care & Service (66 | 0.9%).

Services Occupations by Sex
Within the Services occupations in Tishomingo County, the most male-oriented occupations are Security & Protection (100.0%), Firefighting & Prevention (100.0%), and Law Enforcement (100.0%), while the most female-oriented occupations are Healthcare Support (100.0%), Food Preparation & Serving (87.5%), and Personal Care & Service (86.4%).
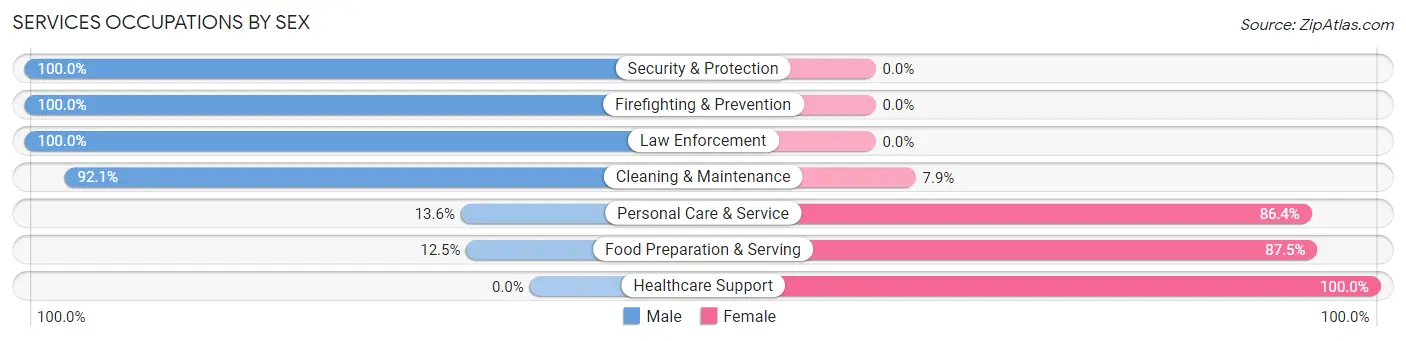
| Occupation | Male | Female |
| Healthcare Support | 0 (0.0%) | 59 (100.0%) |
| Security & Protection | 148 (100.0%) | 0 (0.0%) |
| Firefighting & Prevention | 43 (100.0%) | 0 (0.0%) |
| Law Enforcement | 105 (100.0%) | 0 (0.0%) |
| Food Preparation & Serving | 56 (12.5%) | 391 (87.5%) |
| Cleaning & Maintenance | 174 (92.1%) | 15 (7.9%) |
| Personal Care & Service | 9 (13.6%) | 57 (86.4%) |
| Total (Category) | 387 (42.6%) | 522 (57.4%) |
| Total (Overall) | 4,082 (54.3%) | 3,432 (45.7%) |
Sales and Office Occupations
The most common Sales and Office occupations in Tishomingo County are Office & Administration (769 | 10.2%), and Sales & Related (567 | 7.5%).

Sales and Office Occupations by Sex
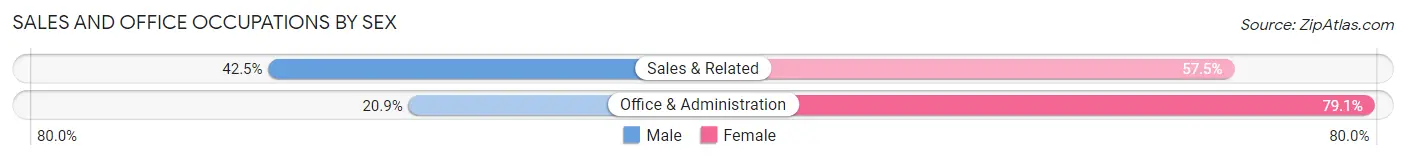
| Occupation | Male | Female |
| Sales & Related | 241 (42.5%) | 326 (57.5%) |
| Office & Administration | 161 (20.9%) | 608 (79.1%) |
| Total (Category) | 402 (30.1%) | 934 (69.9%) |
| Total (Overall) | 4,082 (54.3%) | 3,432 (45.7%) |
Natural Resources, Construction and Maintenance Occupations
The most common Natural Resources, Construction and Maintenance occupations in Tishomingo County are Construction & Extraction (523 | 7.0%), Installation, Maintenance & Repair (353 | 4.7%), and Farming, Fishing & Forestry (24 | 0.3%).
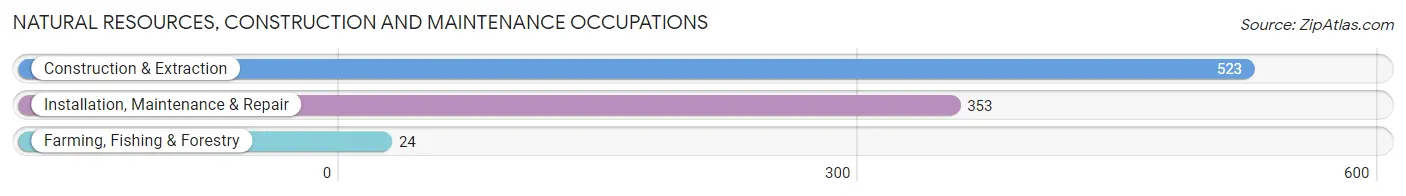
Natural Resources, Construction and Maintenance Occupations by Sex

| Occupation | Male | Female |
| Farming, Fishing & Forestry | 23 (95.8%) | 1 (4.2%) |
| Construction & Extraction | 503 (96.2%) | 20 (3.8%) |
| Installation, Maintenance & Repair | 353 (100.0%) | 0 (0.0%) |
| Total (Category) | 879 (97.7%) | 21 (2.3%) |
| Total (Overall) | 4,082 (54.3%) | 3,432 (45.7%) |
Production, Transportation and Moving Occupations
The most common Production, Transportation and Moving occupations in Tishomingo County are Production (1,104 | 14.7%), Material Moving (557 | 7.4%), and Transportation (339 | 4.5%).

Production, Transportation and Moving Occupations by Sex

| Occupation | Male | Female |
| Production | 878 (79.5%) | 226 (20.5%) |
| Transportation | 339 (100.0%) | 0 (0.0%) |
| Material Moving | 268 (48.1%) | 289 (51.9%) |
| Total (Category) | 1,485 (74.3%) | 515 (25.8%) |
| Total (Overall) | 4,082 (54.3%) | 3,432 (45.7%) |
Employment Industries by Sex in Tishomingo County
Employment Industries in Tishomingo County
The major employment industries in Tishomingo County include Manufacturing (2,499 | 33.3%), Health Care & Social Assistance (892 | 11.9%), Retail Trade (708 | 9.4%), Construction (507 | 6.8%), and Accommodation & Food Services (450 | 6.0%).

Employment Industries by Sex in Tishomingo County
The Tishomingo County industries that see more men than women are Utilities (100.0%), Administrative & Support (98.5%), and Agriculture, Fishing & Hunting (96.2%), whereas the industries that tend to have a higher number of women are Health Care & Social Assistance (90.0%), Accommodation & Food Services (80.2%), and Educational Services (77.3%).

| Industry | Male | Female |
| Agriculture, Fishing & Hunting | 25 (96.2%) | 1 (3.8%) |
| Mining, Quarrying, & Extraction | 0 (0.0%) | 0 (0.0%) |
| Construction | 428 (84.4%) | 79 (15.6%) |
| Manufacturing | 1,818 (72.8%) | 681 (27.3%) |
| Wholesale Trade | 59 (60.2%) | 39 (39.8%) |
| Retail Trade | 253 (35.7%) | 455 (64.3%) |
| Transportation & Warehousing | 256 (80.8%) | 61 (19.2%) |
| Utilities | 210 (100.0%) | 0 (0.0%) |
| Information | 16 (34.0%) | 31 (66.0%) |
| Finance & Insurance | 147 (45.8%) | 174 (54.2%) |
| Real Estate, Rental & Leasing | 51 (47.7%) | 56 (52.3%) |
| Professional & Scientific | 112 (40.7%) | 163 (59.3%) |
| Enterprise Management | 0 (0.0%) | 0 (0.0%) |
| Administrative & Support | 132 (98.5%) | 2 (1.5%) |
| Educational Services | 85 (22.7%) | 289 (77.3%) |
| Health Care & Social Assistance | 89 (10.0%) | 803 (90.0%) |
| Arts, Entertainment & Recreation | 21 (48.8%) | 22 (51.2%) |
| Accommodation & Food Services | 89 (19.8%) | 361 (80.2%) |
| Public Administration | 169 (56.1%) | 132 (43.9%) |
| Total | 4,082 (54.3%) | 3,432 (45.7%) |
Education in Tishomingo County
School Enrollment in Tishomingo County
The most common levels of schooling among the 3,614 students in Tishomingo County are elementary school (928 | 25.7%), high school (874 | 24.2%), and middle school (847 | 23.4%).
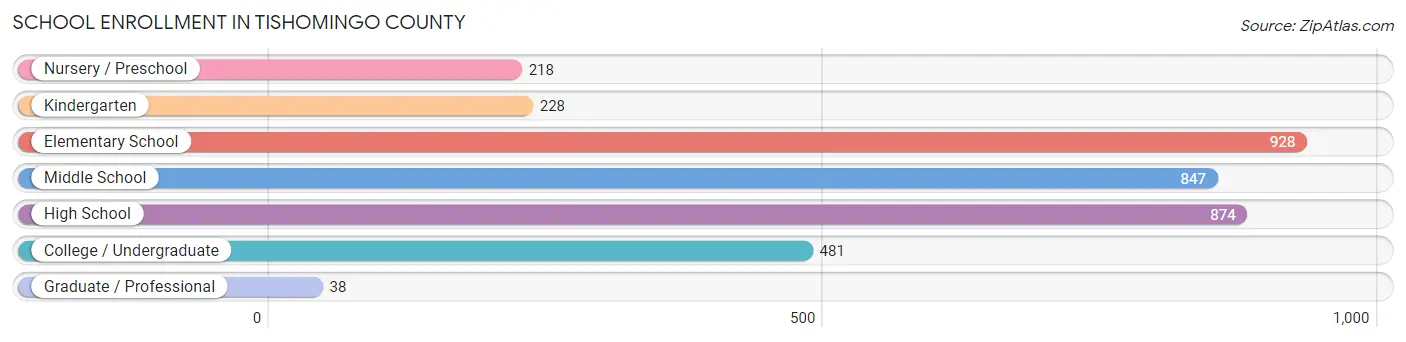
| School Level | # Students | % Students |
| Nursery / Preschool | 218 | 6.0% |
| Kindergarten | 228 | 6.3% |
| Elementary School | 928 | 25.7% |
| Middle School | 847 | 23.4% |
| High School | 874 | 24.2% |
| College / Undergraduate | 481 | 13.3% |
| Graduate / Professional | 38 | 1.1% |
| Total | 3,614 | 100.0% |
School Enrollment by Age by Funding Source in Tishomingo County
Out of a total of 3,614 students who are enrolled in schools in Tishomingo County, 405 (11.2%) attend a private institution, while the remaining 3,209 (88.8%) are enrolled in public schools. The age group of 3 to 4 year olds has the highest likelihood of being enrolled in private schools, with 77 (59.2% in the age bracket) enrolled. Conversely, the age group of 18 to 19 year olds has the lowest likelihood of being enrolled in a private school, with 202 (100.0% in the age bracket) attending a public institution.

| Age Bracket | Public School | Private School |
| 3 to 4 Year Olds | 53 (40.8%) | 77 (59.2%) |
| 5 to 9 Year Old | 825 (85.0%) | 146 (15.0%) |
| 10 to 14 Year Olds | 1,081 (93.1%) | 80 (6.9%) |
| 15 to 17 Year Olds | 630 (88.6%) | 81 (11.4%) |
| 18 to 19 Year Olds | 202 (100.0%) | 0 (0.0%) |
| 20 to 24 Year Olds | 294 (95.5%) | 14 (4.5%) |
| 25 to 34 Year Olds | 26 (100.0%) | 0 (0.0%) |
| 35 Years and over | 98 (93.3%) | 7 (6.7%) |
| Total | 3,209 (88.8%) | 405 (11.2%) |
Educational Attainment by Field of Study in Tishomingo County
Education (527 | 26.1%), business (434 | 21.4%), science & technology (340 | 16.8%), engineering (168 | 8.3%), and arts & humanities (144 | 7.1%) are the most common fields of study among 2,023 individuals in Tishomingo County who have obtained a bachelor's degree or higher.

| Field of Study | # Graduates | % Graduates |
| Computers & Mathematics | 54 | 2.7% |
| Bio, Nature & Agricultural | 110 | 5.4% |
| Physical & Health Sciences | 14 | 0.7% |
| Psychology | 65 | 3.2% |
| Social Sciences | 15 | 0.7% |
| Engineering | 168 | 8.3% |
| Multidisciplinary Studies | 0 | 0.0% |
| Science & Technology | 340 | 16.8% |
| Business | 434 | 21.4% |
| Education | 527 | 26.1% |
| Literature & Languages | 43 | 2.1% |
| Liberal Arts & History | 34 | 1.7% |
| Visual & Performing Arts | 40 | 2.0% |
| Communications | 35 | 1.7% |
| Arts & Humanities | 144 | 7.1% |
| Total | 2,023 | 100.0% |
Transportation & Commute in Tishomingo County
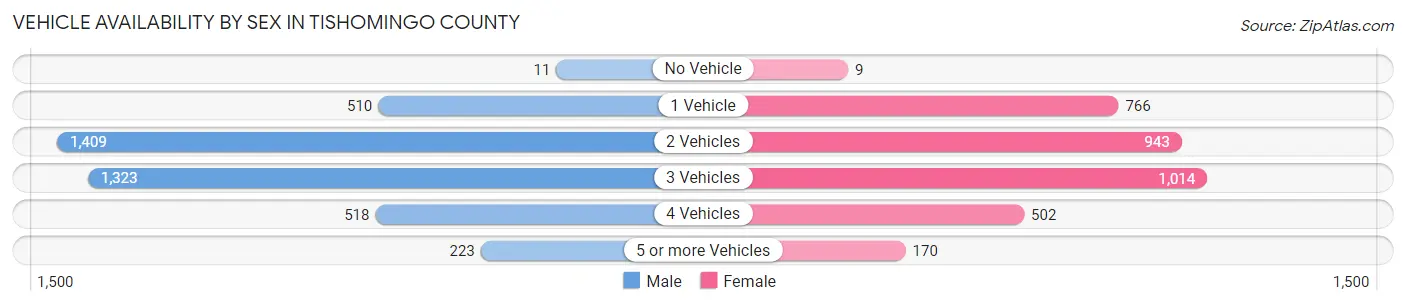
Vehicle Availability by Sex in Tishomingo County
The most prevalent vehicle ownership categories in Tishomingo County are males with 2 vehicles (1,409, accounting for 35.3%) and females with 2 vehicles (943, making up 41.4%).
| Vehicles Available | Male | Female |
| No Vehicle | 11 (0.3%) | 9 (0.3%) |
| 1 Vehicle | 510 (12.8%) | 766 (22.5%) |
| 2 Vehicles | 1,409 (35.3%) | 943 (27.7%) |
| 3 Vehicles | 1,323 (33.1%) | 1,014 (29.8%) |
| 4 Vehicles | 518 (13.0%) | 502 (14.7%) |
| 5 or more Vehicles | 223 (5.6%) | 170 (5.0%) |
| Total | 3,994 (100.0%) | 3,404 (100.0%) |
Commute Time in Tishomingo County
The most frequently occuring commute durations in Tishomingo County are 15 to 19 minutes (1,253 commuters, 17.3%), 30 to 34 minutes (1,127 commuters, 15.6%), and 5 to 9 minutes (1,083 commuters, 15.0%).

| Commute Time | # Commuters | % Commuters |
| Less than 5 Minutes | 380 | 5.2% |
| 5 to 9 Minutes | 1,083 | 15.0% |
| 10 to 14 Minutes | 938 | 13.0% |
| 15 to 19 Minutes | 1,253 | 17.3% |
| 20 to 24 Minutes | 762 | 10.5% |
| 25 to 29 Minutes | 368 | 5.1% |
| 30 to 34 Minutes | 1,127 | 15.6% |
| 35 to 39 Minutes | 281 | 3.9% |
| 40 to 44 Minutes | 162 | 2.2% |
| 45 to 59 Minutes | 468 | 6.5% |
| 60 to 89 Minutes | 330 | 4.6% |
| 90 or more Minutes | 88 | 1.2% |
Commute Time by Sex in Tishomingo County
The most common commute times in Tishomingo County are 15 to 19 minutes (833 commuters, 21.1%) for males and 5 to 9 minutes (600 commuters, 18.2%) for females.

| Commute Time | Male | Female |
| Less than 5 Minutes | 123 (3.1%) | 257 (7.8%) |
| 5 to 9 Minutes | 483 (12.3%) | 600 (18.2%) |
| 10 to 14 Minutes | 448 (11.4%) | 490 (14.8%) |
| 15 to 19 Minutes | 833 (21.1%) | 420 (12.7%) |
| 20 to 24 Minutes | 276 (7.0%) | 486 (14.7%) |
| 25 to 29 Minutes | 248 (6.3%) | 120 (3.6%) |
| 30 to 34 Minutes | 650 (16.5%) | 477 (14.4%) |
| 35 to 39 Minutes | 118 (3.0%) | 163 (4.9%) |
| 40 to 44 Minutes | 84 (2.1%) | 78 (2.4%) |
| 45 to 59 Minutes | 339 (8.6%) | 129 (3.9%) |
| 60 to 89 Minutes | 259 (6.6%) | 71 (2.1%) |
| 90 or more Minutes | 77 (2.0%) | 11 (0.3%) |
Time of Departure to Work by Sex in Tishomingo County
The most frequent times of departure to work in Tishomingo County are 6:00 AM to 6:29 AM (913, 23.2%) for males and 7:30 AM to 7:59 AM (604, 18.3%) for females.

| Time of Departure | Male | Female |
| 12:00 AM to 4:59 AM | 529 (13.4%) | 114 (3.5%) |
| 5:00 AM to 5:29 AM | 273 (6.9%) | 222 (6.7%) |
| 5:30 AM to 5:59 AM | 342 (8.7%) | 198 (6.0%) |
| 6:00 AM to 6:29 AM | 913 (23.2%) | 562 (17.0%) |
| 6:30 AM to 6:59 AM | 740 (18.8%) | 244 (7.4%) |
| 7:00 AM to 7:29 AM | 252 (6.4%) | 529 (16.0%) |
| 7:30 AM to 7:59 AM | 200 (5.1%) | 604 (18.3%) |
| 8:00 AM to 8:29 AM | 192 (4.9%) | 283 (8.6%) |
| 8:30 AM to 8:59 AM | 52 (1.3%) | 55 (1.7%) |
| 9:00 AM to 9:59 AM | 72 (1.8%) | 105 (3.2%) |
| 10:00 AM to 10:59 AM | 0 (0.0%) | 120 (3.6%) |
| 11:00 AM to 11:59 AM | 0 (0.0%) | 66 (2.0%) |
| 12:00 PM to 3:59 PM | 196 (5.0%) | 141 (4.3%) |
| 4:00 PM to 11:59 PM | 177 (4.5%) | 59 (1.8%) |
| Total | 3,938 (100.0%) | 3,302 (100.0%) |
Housing Occupancy in Tishomingo County
Occupancy by Ownership in Tishomingo County
Of the total 8,463 dwellings in Tishomingo County, owner-occupied units account for 6,230 (73.6%), while renter-occupied units make up 2,233 (26.4%).

| Occupancy | # Housing Units | % Housing Units |
| Owner Occupied Housing Units | 6,230 | 73.6% |
| Renter-Occupied Housing Units | 2,233 | 26.4% |
| Total Occupied Housing Units | 8,463 | 100.0% |
Occupancy by Household Size in Tishomingo County

| Household Size | # Housing Units | % Housing Units |
| 1-Person Household | 2,857 | 33.8% |
| 2-Person Household | 2,831 | 33.5% |
| 3-Person Household | 1,296 | 15.3% |
| 4+ Person Household | 1,479 | 17.5% |
| Total Housing Units | 8,463 | 100.0% |
Occupancy by Ownership by Household Size in Tishomingo County

| Household Size | Owner-occupied | Renter-occupied |
| 1-Person Household | 1,765 (61.8%) | 1,092 (38.2%) |
| 2-Person Household | 2,248 (79.4%) | 583 (20.6%) |
| 3-Person Household | 1,058 (81.6%) | 238 (18.4%) |
| 4+ Person Household | 1,159 (78.4%) | 320 (21.6%) |
| Total Housing Units | 6,230 (73.6%) | 2,233 (26.4%) |
Occupancy by Educational Attainment in Tishomingo County

| Household Size | Owner-occupied | Renter-occupied |
| Less than High School | 914 (57.8%) | 667 (42.2%) |
| High School Diploma | 1,917 (72.9%) | 713 (27.1%) |
| College/Associate Degree | 2,167 (74.4%) | 746 (25.6%) |
| Bachelor's Degree or higher | 1,232 (92.0%) | 107 (8.0%) |
Occupancy by Age of Householder in Tishomingo County

| Age Bracket | # Households | % Households |
| Under 35 Years | 1,543 | 18.2% |
| 35 to 44 Years | 1,233 | 14.6% |
| 45 to 54 Years | 1,516 | 17.9% |
| 55 to 64 Years | 1,484 | 17.5% |
| 65 to 74 Years | 1,517 | 17.9% |
| 75 to 84 Years | 960 | 11.3% |
| 85 Years and Over | 210 | 2.5% |
| Total | 8,463 | 100.0% |
Housing Finances in Tishomingo County
Median Income by Occupancy in Tishomingo County

| Occupancy Type | # Households | Median Income |
| Owner-Occupied | 6,230 (73.6%) | $55,409 |
| Renter-Occupied | 2,233 (26.4%) | $24,241 |
| Average | 8,463 (100.0%) | $45,545 |
Occupancy by Householder Income Bracket in Tishomingo County

| Income Bracket | Owner-occupied | Renter-occupied |
| Less than $5,000 | 337 (5.4%) | 64 (2.9%) |
| $5,000 to $9,999 | 218 (3.5%) | 167 (7.5%) |
| $10,000 to $14,999 | 256 (4.1%) | 364 (16.3%) |
| $15,000 to $19,999 | 566 (9.1%) | 462 (20.7%) |
| $20,000 to $24,999 | 228 (3.7%) | 68 (3.0%) |
| $25,000 to $34,999 | 485 (7.8%) | 154 (6.9%) |
| $35,000 to $49,999 | 836 (13.4%) | 212 (9.5%) |
| $50,000 to $74,999 | 1,091 (17.5%) | 473 (21.2%) |
| $75,000 to $99,999 | 941 (15.1%) | 134 (6.0%) |
| $100,000 to $149,999 | 736 (11.8%) | 53 (2.4%) |
| $150,000 or more | 536 (8.6%) | 82 (3.7%) |
| Total | 6,230 (100.0%) | 2,233 (100.0%) |
Monthly Housing Cost Tiers in Tishomingo County

| Monthly Cost | Owner-occupied | Renter-occupied |
| Less than $300 | 1,508 (24.2%) | 172 (7.7%) |
| $300 to $499 | 1,716 (27.5%) | 366 (16.4%) |
| $500 to $799 | 1,144 (18.4%) | 977 (43.8%) |
| $800 to $999 | 475 (7.6%) | 239 (10.7%) |
| $1,000 to $1,499 | 839 (13.5%) | 143 (6.4%) |
| $1,500 to $1,999 | 413 (6.6%) | 0 (0.0%) |
| $2,000 to $2,499 | 89 (1.4%) | 35 (1.6%) |
| $2,500 to $2,999 | 24 (0.4%) | 0 (0.0%) |
| $3,000 or more | 22 (0.4%) | 0 (0.0%) |
| Total | 6,230 (100.0%) | 2,233 (100.0%) |
Physical Housing Characteristics in Tishomingo County
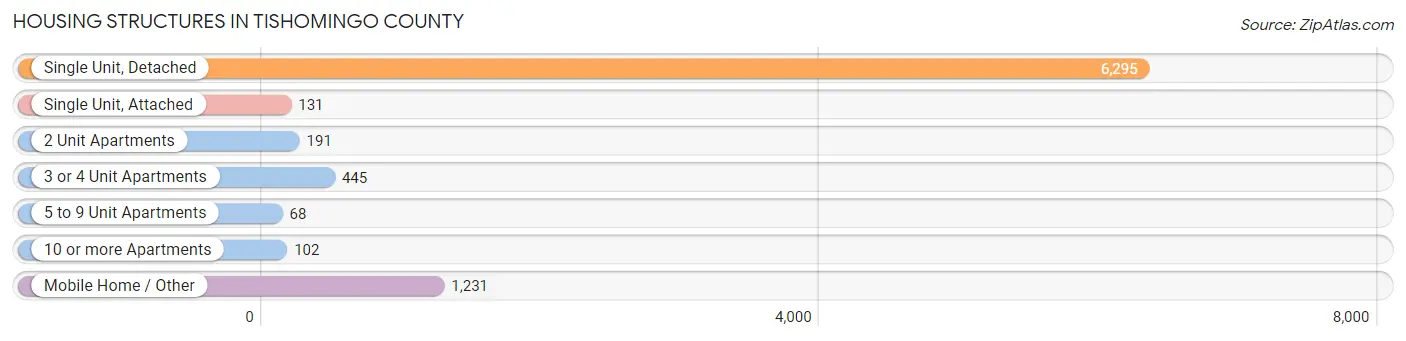
Housing Structures in Tishomingo County
| Structure Type | # Housing Units | % Housing Units |
| Single Unit, Detached | 6,295 | 74.4% |
| Single Unit, Attached | 131 | 1.5% |
| 2 Unit Apartments | 191 | 2.3% |
| 3 or 4 Unit Apartments | 445 | 5.3% |
| 5 to 9 Unit Apartments | 68 | 0.8% |
| 10 or more Apartments | 102 | 1.2% |
| Mobile Home / Other | 1,231 | 14.5% |
| Total | 8,463 | 100.0% |
Housing Structures by Occupancy in Tishomingo County

| Structure Type | Owner-occupied | Renter-occupied |
| Single Unit, Detached | 5,209 (82.8%) | 1,086 (17.2%) |
| Single Unit, Attached | 16 (12.2%) | 115 (87.8%) |
| 2 Unit Apartments | 13 (6.8%) | 178 (93.2%) |
| 3 or 4 Unit Apartments | 13 (2.9%) | 432 (97.1%) |
| 5 to 9 Unit Apartments | 0 (0.0%) | 68 (100.0%) |
| 10 or more Apartments | 52 (51.0%) | 50 (49.0%) |
| Mobile Home / Other | 927 (75.3%) | 304 (24.7%) |
| Total | 6,230 (73.6%) | 2,233 (26.4%) |
Housing Structures by Number of Rooms in Tishomingo County

| Number of Rooms | Owner-occupied | Renter-occupied |
| 1 Room | 6 (0.1%) | 46 (2.1%) |
| 2 or 3 Rooms | 260 (4.2%) | 313 (14.0%) |
| 4 or 5 Rooms | 1,955 (31.4%) | 1,025 (45.9%) |
| 6 or 7 Rooms | 2,330 (37.4%) | 659 (29.5%) |
| 8 or more Rooms | 1,679 (27.0%) | 190 (8.5%) |
| Total | 6,230 (100.0%) | 2,233 (100.0%) |
Housing Structure by Heating Type in Tishomingo County

| Heating Type | Owner-occupied | Renter-occupied |
| Utility Gas | 1,929 (31.0%) | 403 (18.0%) |
| Bottled, Tank, or LP Gas | 623 (10.0%) | 256 (11.5%) |
| Electricity | 3,390 (54.4%) | 1,413 (63.3%) |
| Fuel Oil or Kerosene | 35 (0.6%) | 3 (0.1%) |
| Coal or Coke | 0 (0.0%) | 0 (0.0%) |
| All other Fuels | 253 (4.1%) | 134 (6.0%) |
| No Fuel Used | 0 (0.0%) | 24 (1.1%) |
| Total | 6,230 (100.0%) | 2,233 (100.0%) |
Household Vehicle Usage in Tishomingo County

| Vehicles per Household | Owner-occupied | Renter-occupied |
| No Vehicle | 142 (2.3%) | 277 (12.4%) |
| 1 Vehicle | 1,533 (24.6%) | 1,079 (48.3%) |
| 2 Vehicles | 2,138 (34.3%) | 696 (31.2%) |
| 3 or more Vehicles | 2,417 (38.8%) | 181 (8.1%) |
| Total | 6,230 (100.0%) | 2,233 (100.0%) |
Real Estate & Mortgages in Tishomingo County
Real Estate and Mortgage Overview in Tishomingo County
| Characteristic | Without Mortgage | With Mortgage |
| Housing Units | 3,950 | 2,280 |
| Median Property Value | $113,100 | $146,800 |
| Median Household Income | $44,853 | $301 |
| Monthly Housing Costs | $357 | $15 |
| Real Estate Taxes | $582 | $586 |
Property Value by Mortgage Status in Tishomingo County

| Property Value | Without Mortgage | With Mortgage |
| Less than $50,000 | 447 (11.3%) | 329 (14.4%) |
| $50,000 to $99,999 | 1,232 (31.2%) | 421 (18.5%) |
| $100,000 to $299,999 | 1,955 (49.5%) | 1,310 (57.5%) |
| $300,000 to $499,999 | 208 (5.3%) | 143 (6.3%) |
| $500,000 to $749,999 | 60 (1.5%) | 18 (0.8%) |
| $750,000 to $999,999 | 9 (0.2%) | 41 (1.8%) |
| $1,000,000 or more | 39 (1.0%) | 18 (0.8%) |
| Total | 3,950 (100.0%) | 2,280 (100.0%) |
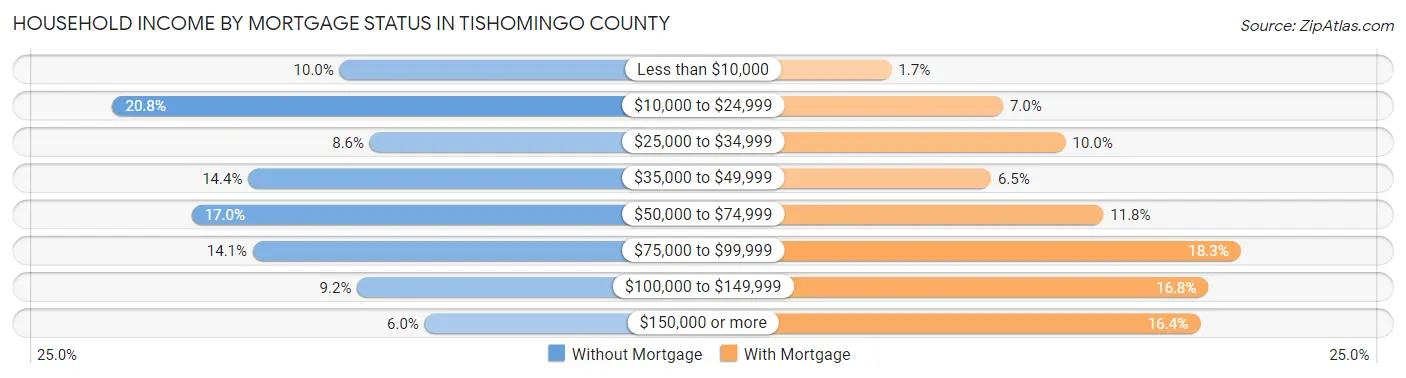
Household Income by Mortgage Status in Tishomingo County
| Household Income | Without Mortgage | With Mortgage |
| Less than $10,000 | 395 (10.0%) | 39 (1.7%) |
| $10,000 to $24,999 | 822 (20.8%) | 160 (7.0%) |
| $25,000 to $34,999 | 338 (8.6%) | 228 (10.0%) |
| $35,000 to $49,999 | 567 (14.3%) | 147 (6.5%) |
| $50,000 to $74,999 | 673 (17.0%) | 269 (11.8%) |
| $75,000 to $99,999 | 558 (14.1%) | 418 (18.3%) |
| $100,000 to $149,999 | 362 (9.2%) | 383 (16.8%) |
| $150,000 or more | 235 (5.9%) | 374 (16.4%) |
| Total | 3,950 (100.0%) | 2,280 (100.0%) |
Property Value to Household Income Ratio in Tishomingo County

| Value-to-Income Ratio | Without Mortgage | With Mortgage |
| Less than 2.0x | 1,637 (41.4%) | 73,119 (3,207.0%) |
| 2.0x to 2.9x | 721 (18.2%) | 1,286 (56.4%) |
| 3.0x to 3.9x | 368 (9.3%) | 454 (19.9%) |
| 4.0x or more | 1,153 (29.2%) | 180 (7.9%) |
| Total | 3,950 (100.0%) | 2,280 (100.0%) |
Real Estate Taxes by Mortgage Status in Tishomingo County

| Property Taxes | Without Mortgage | With Mortgage |
| Less than $800 | 1,590 (40.3%) | 77 (3.4%) |
| $800 to $1,499 | 569 (14.4%) | 758 (33.3%) |
| $800 to $1,499 | 327 (8.3%) | 473 (20.7%) |
| Total | 3,950 (100.0%) | 2,280 (100.0%) |
Health & Disability in Tishomingo County
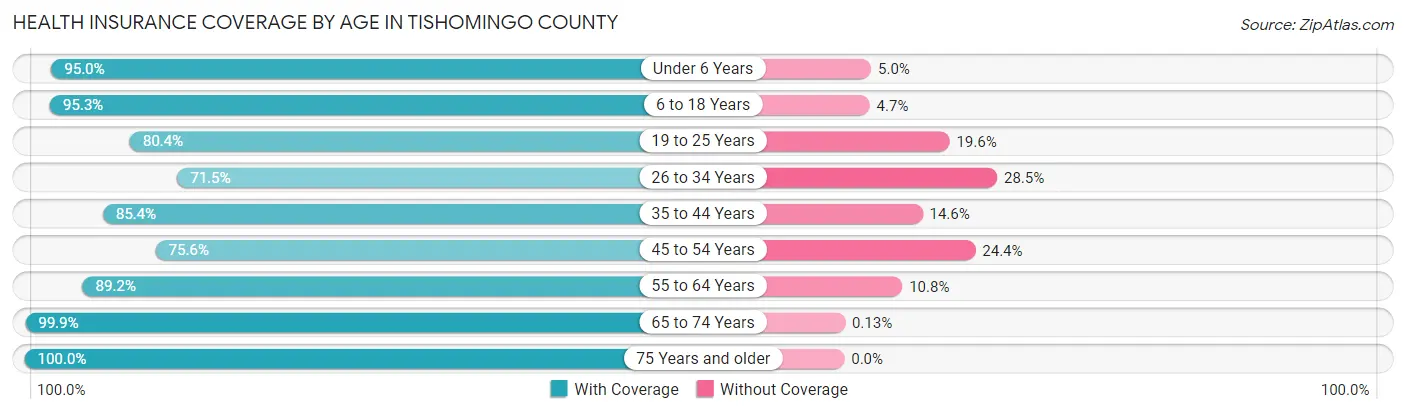
Health Insurance Coverage by Age in Tishomingo County
| Age Bracket | With Coverage | Without Coverage |
| Under 6 Years | 1,215 (95.0%) | 64 (5.0%) |
| 6 to 18 Years | 2,858 (95.3%) | 142 (4.7%) |
| 19 to 25 Years | 1,057 (80.4%) | 258 (19.6%) |
| 26 to 34 Years | 1,404 (71.5%) | 559 (28.5%) |
| 35 to 44 Years | 1,756 (85.4%) | 300 (14.6%) |
| 45 to 54 Years | 1,935 (75.6%) | 626 (24.4%) |
| 55 to 64 Years | 2,310 (89.2%) | 280 (10.8%) |
| 65 to 74 Years | 2,222 (99.9%) | 3 (0.1%) |
| 75 Years and older | 1,557 (100.0%) | 0 (0.0%) |
| Total | 16,314 (88.0%) | 2,232 (12.0%) |
Health Insurance Coverage by Citizenship Status in Tishomingo County
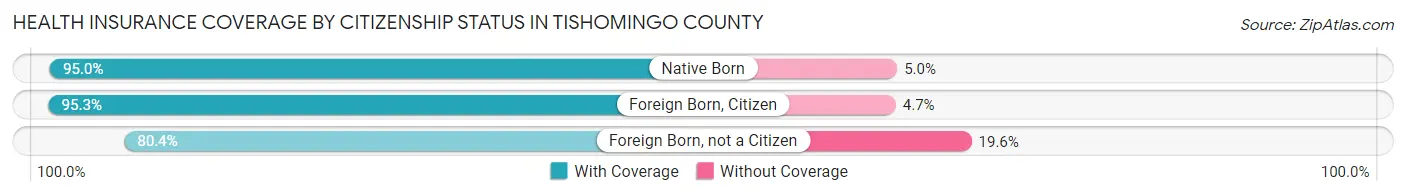
| Citizenship Status | With Coverage | Without Coverage |
| Native Born | 1,215 (95.0%) | 64 (5.0%) |
| Foreign Born, Citizen | 2,858 (95.3%) | 142 (4.7%) |
| Foreign Born, not a Citizen | 1,057 (80.4%) | 258 (19.6%) |
Health Insurance Coverage by Household Income in Tishomingo County

| Household Income | With Coverage | Without Coverage |
| Under $25,000 | 3,118 (77.2%) | 923 (22.8%) |
| $25,000 to $49,999 | 3,225 (87.3%) | 471 (12.7%) |
| $50,000 to $74,999 | 3,025 (85.5%) | 512 (14.5%) |
| $75,000 to $99,999 | 2,831 (96.4%) | 105 (3.6%) |
| $100,000 and over | 4,114 (95.0%) | 217 (5.0%) |
Public vs Private Health Insurance Coverage by Age in Tishomingo County

| Age Bracket | Public Insurance | Private Insurance |
| Under 6 | 746 (58.3%) | 552 (43.2%) |
| 6 to 18 Years | 1,438 (47.9%) | 1,476 (49.2%) |
| 19 to 25 Years | 60 (4.6%) | 1,005 (76.4%) |
| 25 to 34 Years | 54 (2.8%) | 1,354 (69.0%) |
| 35 to 44 Years | 253 (12.3%) | 1,546 (75.2%) |
| 45 to 54 Years | 451 (17.6%) | 1,557 (60.8%) |
| 55 to 64 Years | 979 (37.8%) | 1,447 (55.9%) |
| 65 to 74 Years | 2,208 (99.2%) | 1,141 (51.3%) |
| 75 Years and over | 1,536 (98.7%) | 936 (60.1%) |
| Total | 7,725 (41.6%) | 11,014 (59.4%) |
Disability Status by Sex by Age in Tishomingo County

| Age Bracket | Male | Female |
| Under 5 Years | 33 (6.6%) | 0 (0.0%) |
| 5 to 17 Years | 269 (16.4%) | 77 (5.4%) |
| 18 to 34 Years | 199 (11.1%) | 151 (8.8%) |
| 35 to 64 Years | 865 (25.3%) | 938 (24.8%) |
| 65 to 74 Years | 330 (30.9%) | 472 (40.8%) |
| 75 Years and over | 328 (54.1%) | 406 (42.7%) |
Disability Class by Sex by Age in Tishomingo County
Disability Class: Hearing Difficulty

| Age Bracket | Male | Female |
| Under 5 Years | 33 (6.6%) | 0 (0.0%) |
| 5 to 17 Years | 22 (1.3%) | 3 (0.2%) |
| 18 to 34 Years | 48 (2.7%) | 29 (1.7%) |
| 35 to 64 Years | 177 (5.2%) | 174 (4.6%) |
| 65 to 74 Years | 151 (14.1%) | 149 (12.9%) |
| 75 Years and over | 188 (31.0%) | 158 (16.6%) |
Disability Class: Vision Difficulty

| Age Bracket | Male | Female |
| Under 5 Years | 33 (6.6%) | 0 (0.0%) |
| 5 to 17 Years | 41 (2.5%) | 0 (0.0%) |
| 18 to 34 Years | 54 (3.0%) | 19 (1.1%) |
| 35 to 64 Years | 197 (5.8%) | 264 (7.0%) |
| 65 to 74 Years | 45 (4.2%) | 137 (11.8%) |
| 75 Years and over | 29 (4.8%) | 66 (6.9%) |
Disability Class: Cognitive Difficulty

| Age Bracket | Male | Female |
| 5 to 17 Years | 228 (13.9%) | 50 (3.5%) |
| 18 to 34 Years | 48 (2.7%) | 38 (2.2%) |
| 35 to 64 Years | 308 (9.0%) | 361 (9.6%) |
| 65 to 74 Years | 39 (3.7%) | 169 (14.6%) |
| 75 Years and over | 96 (15.8%) | 137 (14.4%) |
Disability Class: Ambulatory Difficulty
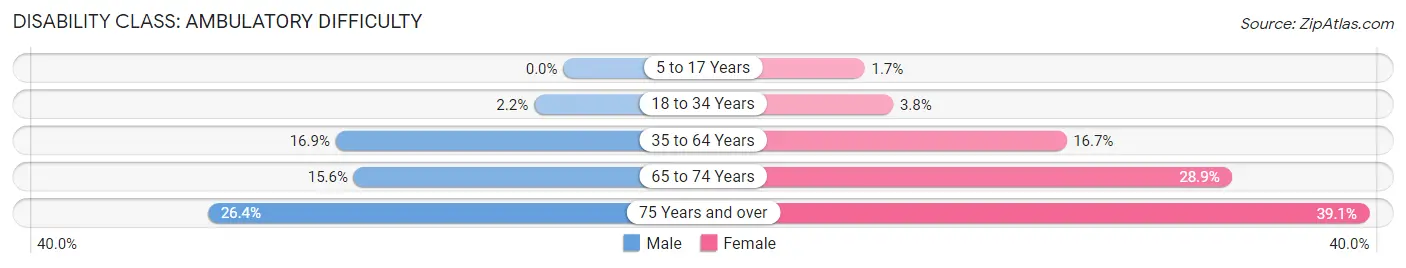
| Age Bracket | Male | Female |
| 5 to 17 Years | 0 (0.0%) | 24 (1.7%) |
| 18 to 34 Years | 39 (2.2%) | 65 (3.8%) |
| 35 to 64 Years | 579 (16.9%) | 630 (16.7%) |
| 65 to 74 Years | 166 (15.6%) | 335 (28.9%) |
| 75 Years and over | 160 (26.4%) | 372 (39.1%) |
Disability Class: Self-Care Difficulty

| Age Bracket | Male | Female |
| 5 to 17 Years | 0 (0.0%) | 24 (1.7%) |
| 18 to 34 Years | 38 (2.1%) | 0 (0.0%) |
| 35 to 64 Years | 355 (10.4%) | 239 (6.3%) |
| 65 to 74 Years | 26 (2.4%) | 5 (0.4%) |
| 75 Years and over | 78 (12.9%) | 174 (18.3%) |
Technology Access in Tishomingo County
Computing Device Access in Tishomingo County

| Device Type | # Households | % Households |
| Desktop or Laptop | 4,568 | 54.0% |
| Smartphone | 7,019 | 82.9% |
| Tablet | 3,584 | 42.3% |
| No Computing Device | 883 | 10.4% |
| Total | 8,463 | 100.0% |
Internet Access in Tishomingo County
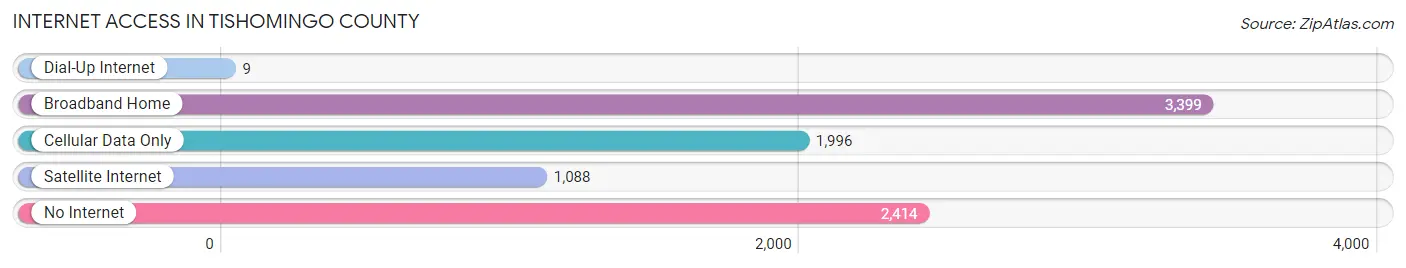
| Internet Type | # Households | % Households |
| Dial-Up Internet | 9 | 0.1% |
| Broadband Home | 3,399 | 40.2% |
| Cellular Data Only | 1,996 | 23.6% |
| Satellite Internet | 1,088 | 12.9% |
| No Internet | 2,414 | 28.5% |
| Total | 8,463 | 100.0% |
Tishomingo County Summary
Tishomingo County is located in the northeastern corner of Mississippi, and is bordered by Tennessee to the north, Alabama to the east, and the Tombigbee River to the south. The county seat is Iuka, and the county is named after Chief Tishomingo, a Chickasaw leader. The county has a total area of 576 square miles, and a population of 19,593 as of the 2010 census.
History
Tishomingo County was established in 1836, and was the first county in Mississippi to be formed after the Chickasaw ceded their lands to the United States. The county was named after Chief Tishomingo, a Chickasaw leader. The county was originally part of the Chickasaw Nation, and was home to many Native American tribes, including the Chickasaw, Choctaw, and Cherokee.
The county was home to several Civil War battles, including the Battle of Iuka and the Battle of Corinth. The Battle of Iuka was fought on September 19, 1862, and was a Confederate victory. The Battle of Corinth was fought on October 3-4, 1862, and was a Union victory.
Geography
Tishomingo County is located in the northeastern corner of Mississippi, and is bordered by Tennessee to the north, Alabama to the east, and the Tombigbee River to the south. The county has a total area of 576 square miles, and is mostly rural. The terrain is mostly hilly, with some flat areas in the northern part of the county. The highest point in the county is located in the northwest corner, at an elevation of 1,068 feet.
The county is home to several rivers and streams, including the Hatchie River, the Tuscumbia River, and the Tombigbee River. The county is also home to several lakes, including Pickwick Lake, Bear Creek Lake, and Lake Lamar Bruce.
Economy
Tishomingo County has a diverse economy, with a mix of agriculture, manufacturing, and tourism. The county is home to several large employers, including the Tishomingo County School District, the Tishomingo County Hospital, and the Tishomingo County Sheriff's Office.
Agriculture is an important part of the county's economy, and the county is home to several large farms. The county is also home to several manufacturing companies, including a furniture factory, a textile mill, and a paper mill.
Tourism is also an important part of the county's economy, and the county is home to several attractions, including the Natchez Trace Parkway, the Tishomingo State Park, and the Pickwick Lake State Park.
Demographics
As of the 2010 census, Tishomingo County had a population of 19,593. The racial makeup of the county was 95.3% White, 2.7% African American, 0.3% Native American, 0.2% Asian, 0.1% Pacific Islander, 0.5% from other races, and 0.9% from two or more races. Hispanic or Latino of any race were 1.3% of the population.
The median income for a household in the county was $30,945, and the median income for a family was $37,945. The per capita income for the county was $17,845. About 17.2% of the population was below the poverty line.
Common Questions
What is the Total Population of Tishomingo County?
Total Population of Tishomingo County is 18,837.
What is the Total Male Population of Tishomingo County?
Total Male Population of Tishomingo County is 9,169.
What is the Total Female Population of Tishomingo County?
Total Female Population of Tishomingo County is 9,668.
What is the Ratio of Males per 100 Females in Tishomingo County?
There are 94.84 Males per 100 Females in Tishomingo County.
What is the Ratio of Females per 100 Males in Tishomingo County?
There are 105.44 Females per 100 Males in Tishomingo County.
What is the Median Population Age in Tishomingo County?
Median Population Age in Tishomingo County is 43.6 Years.
What is the Average Family Size in Tishomingo County
Average Family Size in Tishomingo County is 2.8 People.
What is the Average Household Size in Tishomingo County
Average Household Size in Tishomingo County is 2.2 People.
What is Per Capita Income in Tishomingo County?
Per Capita income in Tishomingo County is $26,896.
What is the Median Family Income in Tishomingo County?
Median Family Income in Tishomingo County is $67,880.
What is the Median Household income in Tishomingo County?
Median Household Income in Tishomingo County is $45,545.
What is Income or Wage Gap in Tishomingo County?
Income or Wage Gap in Tishomingo County is 39.3%.
Women in Tishomingo County earn 60.7 cents for every dollar earned by a man.
What is Family Income Deficit in Tishomingo County?
Family Income Deficit in Tishomingo County is $10,214.
Families that are below poverty line in Tishomingo County earn $10,214 less on average than the poverty threshold level.
What is Inequality or Gini Index in Tishomingo County?
Inequality or Gini Index in Tishomingo County is 0.47.
How Large is the Labor Force in Tishomingo County?
There are 7,787 People in the Labor Forcein in Tishomingo County.
What is the Percentage of People in the Labor Force in Tishomingo County?
51.0% of People are in the Labor Force in Tishomingo County.
What is the Unemployment Rate in Tishomingo County?
Unemployment Rate in Tishomingo County is 3.5%.