Smith County, MS
Smith County Map

Smith County Overview
14,310
TOTAL POPULATION
6,747
MALE POPULATION
7,563
FEMALE POPULATION
89.21
MALES / 100 FEMALES
112.09
FEMALES / 100 MALES
42.8
MEDIAN AGE
3.4
AVG FAMILY SIZE
2.6
AVG HOUSEHOLD SIZE
$25,394
PER CAPITA INCOME
$70,054
AVG FAMILY INCOME
$51,983
AVG HOUSEHOLD INCOME
36.0%
WAGE / INCOME GAP [ % ]
64.0¢/ $1
WAGE / INCOME GAP [ $ ]
$10,482
FAMILY INCOME DEFICIT
0.45
INEQUALITY / GINI INDEX
5,543
LABOR FORCE [ PEOPLE ]
48.4%
PERCENT IN LABOR FORCE
3.5%
UNEMPLOYMENT RATE
Race in Smith County
The most populous races in Smith County are White / Caucasian (10,583 | 74.0%), Black / African American (3,479 | 24.3%), and Two or more Races (128 | 0.9%).

| Race | # Population | % Population |
| Asian | 54 | 0.4% |
| Black / African American | 3,479 | 24.3% |
| Hawaiian / Pacific | 53 | 0.4% |
| Hispanic or Latino | 66 | 0.5% |
| Native / Alaskan | 0 | 0.0% |
| White / Caucasian | 10,583 | 74.0% |
| Two or more Races | 128 | 0.9% |
| Some other Race | 13 | 0.1% |
| Total | 14,310 | 100.0% |
Ancestry in Smith County
The most populous ancestries reported in Smith County are American (7,727 | 54.0%), Irish (696 | 4.9%), English (614 | 4.3%), German (304 | 2.1%), and Scottish (132 | 0.9%), together accounting for 66.2% of all Smith County residents.

| Ancestry | # Population | % Population |
| African | 29 | 0.2% |
| American | 7,727 | 54.0% |
| British | 83 | 0.6% |
| Central American | 3 | 0.0% |
| Cherokee | 12 | 0.1% |
| Chilean | 12 | 0.1% |
| Costa Rican | 3 | 0.0% |
| Cuban | 8 | 0.1% |
| Dutch | 78 | 0.5% |
| English | 614 | 4.3% |
| European | 12 | 0.1% |
| Finnish | 4 | 0.0% |
| French | 32 | 0.2% |
| German | 304 | 2.1% |
| Hungarian | 2 | 0.0% |
| Indian (Asian) | 1 | 0.0% |
| Irish | 696 | 4.9% |
| Italian | 33 | 0.2% |
| Mexican | 43 | 0.3% |
| Native Hawaiian | 94 | 0.7% |
| Pennsylvania German | 15 | 0.1% |
| Scandinavian | 2 | 0.0% |
| Scotch-Irish | 100 | 0.7% |
| Scottish | 132 | 0.9% |
| South American | 12 | 0.1% |
| Sri Lankan | 54 | 0.4% |
| Subsaharan African | 38 | 0.3% |
| Swiss | 4 | 0.0% |
| Welsh | 70 | 0.5% | View All 29 Rows |
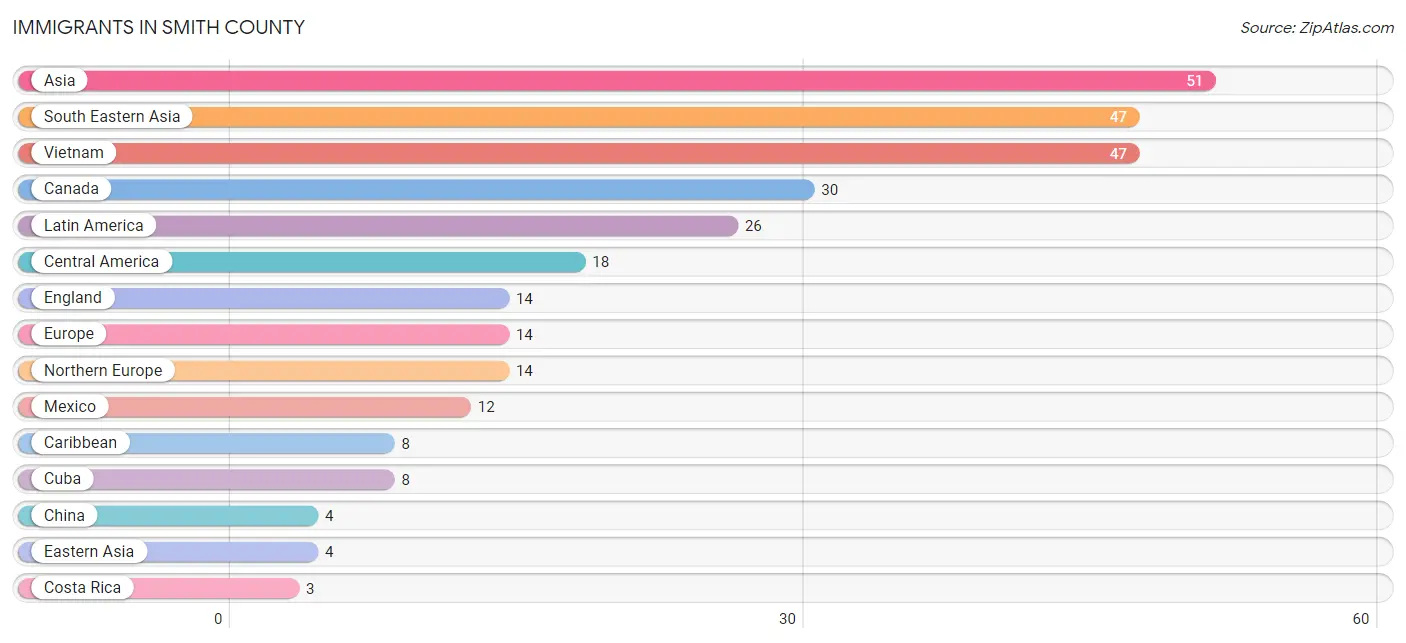
Immigrants in Smith County
The most numerous immigrant groups reported in Smith County came from Asia (51 | 0.4%), South Eastern Asia (47 | 0.3%), Vietnam (47 | 0.3%), Canada (30 | 0.2%), and Latin America (26 | 0.2%), together accounting for 1.4% of all Smith County residents.
| Immigration Origin | # Population | % Population |
| Asia | 51 | 0.4% |
| Canada | 30 | 0.2% |
| Caribbean | 8 | 0.1% |
| Central America | 18 | 0.1% |
| China | 4 | 0.0% |
| Costa Rica | 3 | 0.0% |
| Cuba | 8 | 0.1% |
| Eastern Asia | 4 | 0.0% |
| England | 14 | 0.1% |
| Europe | 14 | 0.1% |
| Latin America | 26 | 0.2% |
| Mexico | 12 | 0.1% |
| Northern Europe | 14 | 0.1% |
| Panama | 3 | 0.0% |
| South Eastern Asia | 47 | 0.3% |
| Vietnam | 47 | 0.3% | View All 16 Rows |
Sex and Age in Smith County
Sex and Age in Smith County
The most populous age groups in Smith County are 50 to 54 Years (532 | 7.9%) for men and 10 to 14 Years (614 | 8.1%) for women.

| Age Bracket | Male | Female |
| Under 5 Years | 337 (5.0%) | 529 (7.0%) |
| 5 to 9 Years | 468 (6.9%) | 396 (5.2%) |
| 10 to 14 Years | 343 (5.1%) | 614 (8.1%) |
| 15 to 19 Years | 392 (5.8%) | 566 (7.5%) |
| 20 to 24 Years | 507 (7.5%) | 358 (4.7%) |
| 25 to 29 Years | 332 (4.9%) | 432 (5.7%) |
| 30 to 34 Years | 447 (6.6%) | 350 (4.6%) |
| 35 to 39 Years | 362 (5.4%) | 400 (5.3%) |
| 40 to 44 Years | 438 (6.5%) | 385 (5.1%) |
| 45 to 49 Years | 336 (5.0%) | 500 (6.6%) |
| 50 to 54 Years | 532 (7.9%) | 430 (5.7%) |
| 55 to 59 Years | 427 (6.3%) | 583 (7.7%) |
| 60 to 64 Years | 523 (7.7%) | 415 (5.5%) |
| 65 to 69 Years | 494 (7.3%) | 511 (6.8%) |
| 70 to 74 Years | 354 (5.2%) | 301 (4.0%) |
| 75 to 79 Years | 209 (3.1%) | 307 (4.1%) |
| 80 to 84 Years | 165 (2.5%) | 265 (3.5%) |
| 85 Years and over | 81 (1.2%) | 221 (2.9%) |
| Total | 6,747 (100.0%) | 7,563 (100.0%) |
Families and Households in Smith County
Median Family Size in Smith County
The median family size in Smith County is 3.37 persons per family, with single male/father families (250 | 7.1%) accounting for the largest median family size of 3.8 persons per family. On the other hand, married-couple families (2,608 | 74.2%) represent the smallest median family size with 3.32 persons per family.

| Family Type | # Families | Family Size |
| Married-Couple | 2,608 (74.2%) | 3.32 |
| Single Male/Father | 250 (7.1%) | 3.80 |
| Single Female/Mother | 657 (18.7%) | 3.41 |
| Total Families | 3,515 (100.0%) | 3.37 |
Median Household Size in Smith County
The median household size in Smith County is 2.60 persons per household, with single male/father households (250 | 4.6%) accounting for the largest median household size of 3.93 persons per household. non-family households (1,935 | 35.5%) represent the smallest median household size with 1.07 persons per household.

| Household Type | # Households | Household Size |
| Married-Couple | 2,608 (47.8%) | 3.34 |
| Single Male/Father | 250 (4.6%) | 3.93 |
| Single Female/Mother | 657 (12.1%) | 3.66 |
| Non-family | 1,935 (35.5%) | 1.07 |
| Total Households | 5,450 (100.0%) | 2.60 |
Household Size by Marriage Status in Smith County
Out of a total of 5,450 households in Smith County, 3,515 (64.5%) are family households, while 1,935 (35.5%) are nonfamily households. The most numerous type of family households are 2-person households, comprising 1,778, and the most common type of nonfamily households are 1-person households, comprising 1,842.

| Household Size | Family Households | Nonfamily Households |
| 1-Person Households | - | 1,842 (33.8%) |
| 2-Person Households | 1,778 (32.6%) | 93 (1.7%) |
| 3-Person Households | 766 (14.1%) | 0 (0.0%) |
| 4-Person Households | 547 (10.0%) | 0 (0.0%) |
| 5-Person Households | 205 (3.8%) | 0 (0.0%) |
| 6-Person Households | 120 (2.2%) | 0 (0.0%) |
| 7+ Person Households | 99 (1.8%) | 0 (0.0%) |
| Total | 3,515 (64.5%) | 1,935 (35.5%) |
Female Fertility in Smith County
Fertility by Age in Smith County
Average fertility rate in Smith County is 30.0 births per 1,000 women. Women in the age bracket of 20 to 34 years have the highest fertility rate with 82.0 births per 1,000 women. Women in the age bracket of 20 to 34 years acount for 100.0% of all women with births.

| Age Bracket | Women with Births | Births / 1,000 Women |
| 15 to 19 years | 0 (0.0%) | 0.0 |
| 20 to 34 years | 94 (100.0%) | 82.0 |
| 35 to 50 years | 0 (0.0%) | 0.0 |
| Total | 94 (100.0%) | 30.0 |
Fertility by Age by Marriage Status in Smith County
52.1% of women with births (94) in Smith County are married. The highest percentage of unmarried women with births falls into 20 to 34 years age bracket with 47.9% of them unmarried at the time of birth, while the lowest percentage of unmarried women with births belong to 20 to 34 years age bracket with 47.9% of them unmarried.

| Age Bracket | Married | Unmarried |
| 15 to 19 years | 0 (0.0%) | 0 (0.0%) |
| 20 to 34 years | 49 (52.1%) | 45 (47.9%) |
| 35 to 50 years | 0 (0.0%) | 0 (0.0%) |
| Total | 49 (52.1%) | 45 (47.9%) |
Fertility by Education in Smith County

| Educational Attainment | Women with Births | Births / 1,000 Women |
| Less than High School | 4 (4.3%) | 8.0 |
| High School Diploma | 30 (31.9%) | 31.0 |
| College or Associate's Degree | 57 (60.6%) | 46.0 |
| Bachelor's Degree | 3 (3.2%) | 13.0 |
| Graduate Degree | 0 (0.0%) | 0.0 |
| Total | 94 (100.0%) | 30.0 |
Fertility by Education by Marriage Status in Smith County
47.9% of women with births in Smith County are unmarried. Women with the educational attainment of less than high school are most likely to be married with 100.0% of them married at childbirth, while women with the educational attainment of high school diploma are least likely to be married with 80.0% of them unmarried at childbirth.

| Educational Attainment | Married | Unmarried |
| Less than High School | 4 (100.0%) | 0 (0.0%) |
| High School Diploma | 6 (20.0%) | 24 (80.0%) |
| College or Associate's Degree | 36 (63.2%) | 21 (36.8%) |
| Bachelor's Degree | 3 (100.0%) | 0 (0.0%) |
| Graduate Degree | 0 (0.0%) | 0 (0.0%) |
| Total | 49 (52.1%) | 45 (47.9%) |
Income in Smith County
Income Overview in Smith County
Per Capita Income in Smith County is $25,394, while median incomes of families and households are $70,054 and $51,983 respectively.
| Characteristic | Number | Measure |
| Per Capita Income | 14,310 | $25,394 |
| Median Family Income | 3,515 | $70,054 |
| Mean Family Income | 3,515 | $79,869 |
| Median Household Income | 5,450 | $51,983 |
| Mean Household Income | 5,450 | $63,109 |
| Income Deficit | 3,515 | $10,482 |
| Wage / Income Gap (%) | 14,310 | 35.97% |
| Wage / Income Gap ($) | 14,310 | 64.03¢ per $1 |
| Gini / Inequality Index | 14,310 | 0.45 |
Earnings by Sex in Smith County
Average Earnings in Smith County are $40,885, $52,610 for men and $33,686 for women, a difference of 36.0%.

| Sex | Number | Average Earnings |
| Male | 3,262 (57.9%) | $52,610 |
| Female | 2,377 (42.1%) | $33,686 |
| Total | 5,639 (100.0%) | $40,885 |
Earnings by Sex by Income Bracket in Smith County
The most common earnings brackets in Smith County are $55,000 to $64,999 for men (595 | 18.2%) and $35,000 to $39,999 for women (271 | 11.4%).

| Income | Male | Female |
| $2,499 or less | 203 (6.2%) | 114 (4.8%) |
| $2,500 to $4,999 | 116 (3.6%) | 7 (0.3%) |
| $5,000 to $7,499 | 14 (0.4%) | 56 (2.4%) |
| $7,500 to $9,999 | 17 (0.5%) | 18 (0.8%) |
| $10,000 to $12,499 | 28 (0.9%) | 166 (7.0%) |
| $12,500 to $14,999 | 76 (2.3%) | 58 (2.4%) |
| $15,000 to $17,499 | 98 (3.0%) | 103 (4.3%) |
| $17,500 to $19,999 | 114 (3.5%) | 68 (2.9%) |
| $20,000 to $22,499 | 29 (0.9%) | 120 (5.1%) |
| $22,500 to $24,999 | 141 (4.3%) | 194 (8.2%) |
| $25,000 to $29,999 | 164 (5.0%) | 154 (6.5%) |
| $30,000 to $34,999 | 148 (4.5%) | 182 (7.7%) |
| $35,000 to $39,999 | 129 (4.0%) | 271 (11.4%) |
| $40,000 to $44,999 | 65 (2.0%) | 133 (5.6%) |
| $45,000 to $49,999 | 238 (7.3%) | 150 (6.3%) |
| $50,000 to $54,999 | 116 (3.6%) | 80 (3.4%) |
| $55,000 to $64,999 | 595 (18.2%) | 252 (10.6%) |
| $65,000 to $74,999 | 146 (4.5%) | 54 (2.3%) |
| $75,000 to $99,999 | 532 (16.3%) | 138 (5.8%) |
| $100,000+ | 293 (9.0%) | 59 (2.5%) |
| Total | 3,262 (100.0%) | 2,377 (100.0%) |
Earnings by Sex by Educational Attainment in Smith County
Average earnings in Smith County are $55,697 for men and $35,000 for women, a difference of 37.2%. Men with an educational attainment of graduate degree enjoy the highest average annual earnings of $95,768, while those with high school diploma education earn the least with $52,843. Women with an educational attainment of graduate degree earn the most with the average annual earnings of $54,500, while those with high school diploma education have the smallest earnings of $27,363.

| Educational Attainment | Male Income | Female Income |
| Less than High School | - | - |
| High School Diploma | $52,843 | $27,363 |
| College or Associate's Degree | $55,175 | $28,608 |
| Bachelor's Degree | $74,028 | $46,406 |
| Graduate Degree | $95,768 | $54,500 |
| Total | $55,697 | $35,000 |
Family Income in Smith County
Family Income Brackets in Smith County
According to the Smith County family income data, there are 752 families falling into the $50,000 to $74,999 income range, which is the most common income bracket and makes up 21.4% of all families. Conversely, the $200,000+ income bracket is the least frequent group with only 102 families (2.9%) belonging to this category.

| Income Bracket | # Families | % Families |
| Less than $10,000 | 169 | 4.8% |
| $10,000 to $14,999 | 127 | 3.6% |
| $15,000 to $24,999 | 309 | 8.8% |
| $25,000 to $34,999 | 253 | 7.2% |
| $35,000 to $49,999 | 288 | 8.2% |
| $50,000 to $74,999 | 752 | 21.4% |
| $75,000 to $99,999 | 573 | 16.3% |
| $100,000 to $149,999 | 735 | 20.9% |
| $150,000 to $199,999 | 207 | 5.9% |
| $200,000+ | 102 | 2.9% |
Family Income by Famaliy Size in Smith County
5-person families (181 | 5.1%) account for the highest median family income in Smith County with $97,847 per family, while 2-person families (1,806 | 51.4%) have the highest median income of $30,050 per family member.

| Income Bracket | # Families | Median Income |
| 2-Person Families | 1,806 (51.4%) | $60,100 |
| 3-Person Families | 751 (21.4%) | $88,210 |
| 4-Person Families | 573 (16.3%) | $77,179 |
| 5-Person Families | 181 (5.1%) | $97,847 |
| 6-Person Families | 116 (3.3%) | $93,556 |
| 7+ Person Families | 88 (2.5%) | $69,071 |
| Total | 3,515 (100.0%) | $70,054 |
Family Income by Number of Earners in Smith County
The median family income in Smith County is $70,054, with families comprising 3+ earners (179) having the highest median family income of $129,183, while families with no earners (858) have the lowest median family income of $33,362, accounting for 5.1% and 24.4% of families, respectively.

| Number of Earners | # Families | Median Income |
| No Earners | 858 (24.4%) | $33,362 |
| 1 Earner | 1,227 (34.9%) | $59,627 |
| 2 Earners | 1,251 (35.6%) | $103,415 |
| 3+ Earners | 179 (5.1%) | $129,183 |
| Total | 3,515 (100.0%) | $70,054 |
Household Income in Smith County
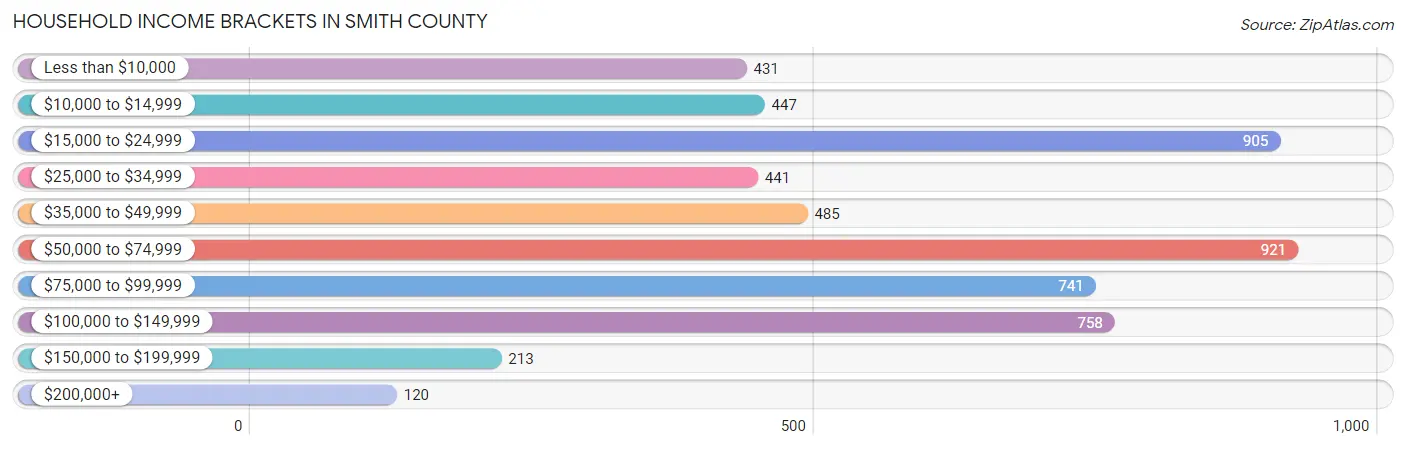
Household Income Brackets in Smith County
With 921 households falling in the category, the $50,000 to $74,999 income range is the most frequent in Smith County, accounting for 16.9% of all households. In contrast, only 120 households (2.2%) fall into the $200,000+ income bracket, making it the least populous group.
| Income Bracket | # Households | % Households |
| Less than $10,000 | 431 | 7.9% |
| $10,000 to $14,999 | 447 | 8.2% |
| $15,000 to $24,999 | 905 | 16.6% |
| $25,000 to $34,999 | 441 | 8.1% |
| $35,000 to $49,999 | 485 | 8.9% |
| $50,000 to $74,999 | 921 | 16.9% |
| $75,000 to $99,999 | 741 | 13.6% |
| $100,000 to $149,999 | 758 | 13.9% |
| $150,000 to $199,999 | 213 | 3.9% |
| $200,000+ | 120 | 2.2% |
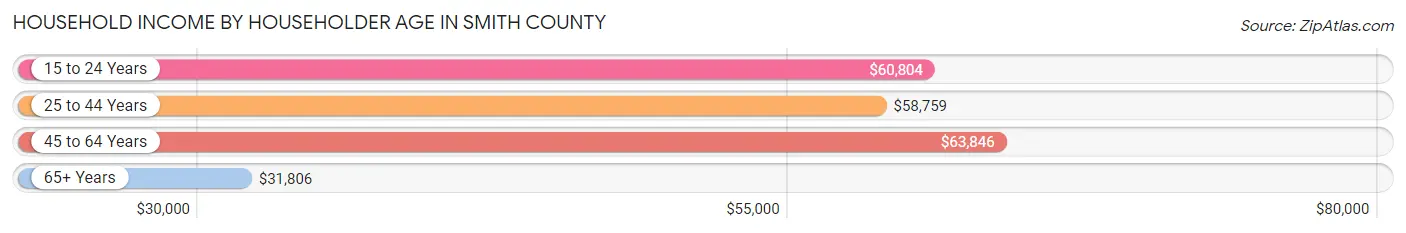
Household Income by Householder Age in Smith County
The median household income in Smith County is $51,983, with the highest median household income of $63,846 found in the 45 to 64 years age bracket for the primary householder. A total of 2,094 households (38.4%) fall into this category. Meanwhile, the 65+ years age bracket for the primary householder has the lowest median household income of $31,806, with 1,752 households (32.2%) in this group.
| Income Bracket | # Households | Median Income |
| 15 to 24 Years | 251 (4.6%) | $60,804 |
| 25 to 44 Years | 1,353 (24.8%) | $58,759 |
| 45 to 64 Years | 2,094 (38.4%) | $63,846 |
| 65+ Years | 1,752 (32.2%) | $31,806 |
| Total | 5,450 (100.0%) | $51,983 |
Poverty in Smith County
Income Below Poverty by Sex and Age in Smith County
With 15.7% poverty level for males and 20.5% for females among the residents of Smith County, 6 to 11 year old males and 5 year old females are the most vulnerable to poverty, with 184 males (35.4%) and 19 females (76.0%) in their respective age groups living below the poverty level.

| Age Bracket | Male | Female |
| Under 5 Years | 51 (15.5%) | 248 (46.9%) |
| 5 Years | 0 (0.0%) | 19 (76.0%) |
| 6 to 11 Years | 184 (35.4%) | 130 (20.4%) |
| 12 to 14 Years | 50 (19.5%) | 5 (1.5%) |
| 15 Years | 43 (32.8%) | 0 (0.0%) |
| 16 and 17 Years | 0 (0.0%) | 52 (20.2%) |
| 18 to 24 Years | 34 (5.7%) | 199 (31.7%) |
| 25 to 34 Years | 89 (11.4%) | 274 (35.0%) |
| 35 to 44 Years | 82 (10.3%) | 135 (17.2%) |
| 45 to 54 Years | 155 (18.0%) | 91 (9.9%) |
| 55 to 64 Years | 188 (20.1%) | 182 (18.2%) |
| 65 to 74 Years | 120 (14.5%) | 102 (12.6%) |
| 75 Years and over | 51 (11.4%) | 94 (13.0%) |
| Total | 1,047 (15.7%) | 1,531 (20.5%) |
Income Above Poverty by Sex and Age in Smith County
According to the poverty statistics in Smith County, males aged 5 years and females aged 15 years are the age groups that are most secure financially, with 100.0% of males and 100.0% of females in these age groups living above the poverty line.

| Age Bracket | Male | Female |
| Under 5 Years | 277 (84.5%) | 281 (53.1%) |
| 5 Years | 24 (100.0%) | 6 (24.0%) |
| 6 to 11 Years | 335 (64.5%) | 508 (79.6%) |
| 12 to 14 Years | 207 (80.5%) | 334 (98.5%) |
| 15 Years | 88 (67.2%) | 39 (100.0%) |
| 16 and 17 Years | 172 (100.0%) | 206 (79.8%) |
| 18 to 24 Years | 560 (94.3%) | 428 (68.3%) |
| 25 to 34 Years | 690 (88.6%) | 508 (65.0%) |
| 35 to 44 Years | 717 (89.7%) | 650 (82.8%) |
| 45 to 54 Years | 706 (82.0%) | 832 (90.1%) |
| 55 to 64 Years | 748 (79.9%) | 816 (81.8%) |
| 65 to 74 Years | 708 (85.5%) | 710 (87.4%) |
| 75 Years and over | 396 (88.6%) | 630 (87.0%) |
| Total | 5,628 (84.3%) | 5,948 (79.5%) |
Income Below Poverty Among Married-Couple Families in Smith County
The poverty statistics for married-couple families in Smith County show that 7.3% or 191 of the total 2,608 families live below the poverty line. Families with 3 or 4 children have the highest poverty rate of 8.3%, comprising of 19 families. On the other hand, families with no children have the lowest poverty rate of 7.1%, which includes 115 families.

| Children | Above Poverty | Below Poverty |
| No Children | 1,510 (92.9%) | 115 (7.1%) |
| 1 or 2 Children | 697 (92.4%) | 57 (7.6%) |
| 3 or 4 Children | 210 (91.7%) | 19 (8.3%) |
| 5 or more Children | 0 (0.0%) | 0 (0.0%) |
| Total | 2,417 (92.7%) | 191 (7.3%) |
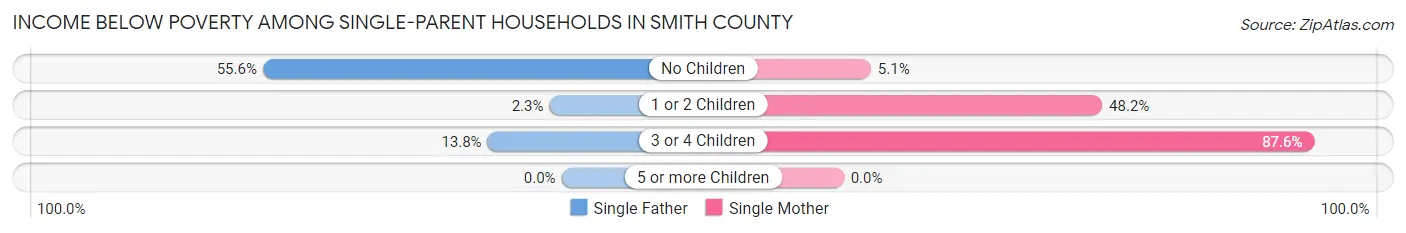
Income Below Poverty Among Single-Parent Households in Smith County
According to the poverty data in Smith County, 32.0% or 80 single-father households and 39.3% or 258 single-mother households are living below the poverty line. Among single-father households, those with no children have the highest poverty rate, with 74 households (55.6%) experiencing poverty. Likewise, among single-mother households, those with 3 or 4 children have the highest poverty rate, with 78 households (87.6%) falling below the poverty line.
| Children | Single Father | Single Mother |
| No Children | 74 (55.6%) | 11 (5.1%) |
| 1 or 2 Children | 2 (2.3%) | 169 (48.1%) |
| 3 or 4 Children | 4 (13.8%) | 78 (87.6%) |
| 5 or more Children | 0 (0.0%) | 0 (0.0%) |
| Total | 80 (32.0%) | 258 (39.3%) |
Income Below Poverty Among Married-Couple vs Single-Parent Households in Smith County
The poverty data for Smith County shows that 191 of the married-couple family households (7.3%) and 338 of the single-parent households (37.3%) are living below the poverty level. Within the married-couple family households, those with 3 or 4 children have the highest poverty rate, with 19 households (8.3%) falling below the poverty line. Among the single-parent households, those with 3 or 4 children have the highest poverty rate, with 82 household (69.5%) living below poverty.

| Children | Married-Couple Families | Single-Parent Households |
| No Children | 115 (7.1%) | 85 (24.3%) |
| 1 or 2 Children | 57 (7.6%) | 171 (39.0%) |
| 3 or 4 Children | 19 (8.3%) | 82 (69.5%) |
| 5 or more Children | 0 (0.0%) | 0 (0.0%) |
| Total | 191 (7.3%) | 338 (37.3%) |
Employment Characteristics in Smith County
Employment by Class of Employer in Smith County
Among the 5,298 employed individuals in Smith County, private company employees (3,302 | 62.3%), state government employees (509 | 9.6%), and not-for-profit organizations (460 | 8.7%) make up the most common classes of employment.

| Employer Class | # Employees | % Employees |
| Private Company Employees | 3,302 | 62.3% |
| Self-Employed (Incorporated) | 239 | 4.5% |
| Self-Employed (Not Incorporated) | 350 | 6.6% |
| Not-for-profit Organizations | 460 | 8.7% |
| Local Government Employees | 347 | 6.6% |
| State Government Employees | 509 | 9.6% |
| Federal Government Employees | 91 | 1.7% |
| Unpaid Family Workers | 0 | 0.0% |
| Total | 5,298 | 100.0% |
Employment Status by Age in Smith County
According to the labor force statistics for Smith County, out of the total population over 16 years of age (11,453), 48.4% or 5,543 individuals are in the labor force, with 3.5% or 194 of them unemployed. The age group with the highest labor force participation rate is 25 to 29 years, with 80.2% or 613 individuals in the labor force. Within the labor force, the 20 to 24 years age range has the highest percentage of unemployed individuals, with 11.8% or 56 of them being unemployed.

| Age Bracket | In Labor Force | Unemployed |
| 16 to 19 Years | 91 (11.5%) | 5 (5.5%) |
| 20 to 24 Years | 475 (54.9%) | 56 (11.8%) |
| 25 to 29 Years | 613 (80.2%) | 5 (0.8%) |
| 30 to 34 Years | 540 (67.8%) | 33 (6.1%) |
| 35 to 44 Years | 1,247 (78.7%) | 30 (2.4%) |
| 45 to 54 Years | 1,144 (63.6%) | 35 (3.1%) |
| 55 to 59 Years | 531 (52.6%) | 0 (0.0%) |
| 60 to 64 Years | 473 (50.4%) | 29 (6.1%) |
| 65 to 74 Years | 387 (23.3%) | 0 (0.0%) |
| 75 Years and over | 37 (3.0%) | 0 (0.0%) |
| Total | 5,543 (48.4%) | 194 (3.5%) |
Employment Status by Educational Attainment in Smith County
According to labor force statistics for Smith County, 66.0% of individuals (4,549) out of the total population between 25 and 64 years of age (6,892) are in the labor force, with 2.9% or 132 of them being unemployed. The group with the highest labor force participation rate are those with the educational attainment of bachelor's degree or higher, with 77.8% or 846 individuals in the labor force. Within the labor force, individuals with less than high school education have the highest percentage of unemployment, with 5.6% or 23 of them being unemployed.

| Educational Attainment | In Labor Force | Unemployed |
| Less than High School | 414 (38.4%) | 60 (5.6%) |
| High School Diploma | 1,641 (65.5%) | 40 (1.6%) |
| College / Associate Degree | 1,645 (74.1%) | 104 (4.7%) |
| Bachelor's Degree or higher | 846 (77.8%) | 5 (0.5%) |
| Total | 4,549 (66.0%) | 200 (2.9%) |
Employment Occupations by Sex in Smith County
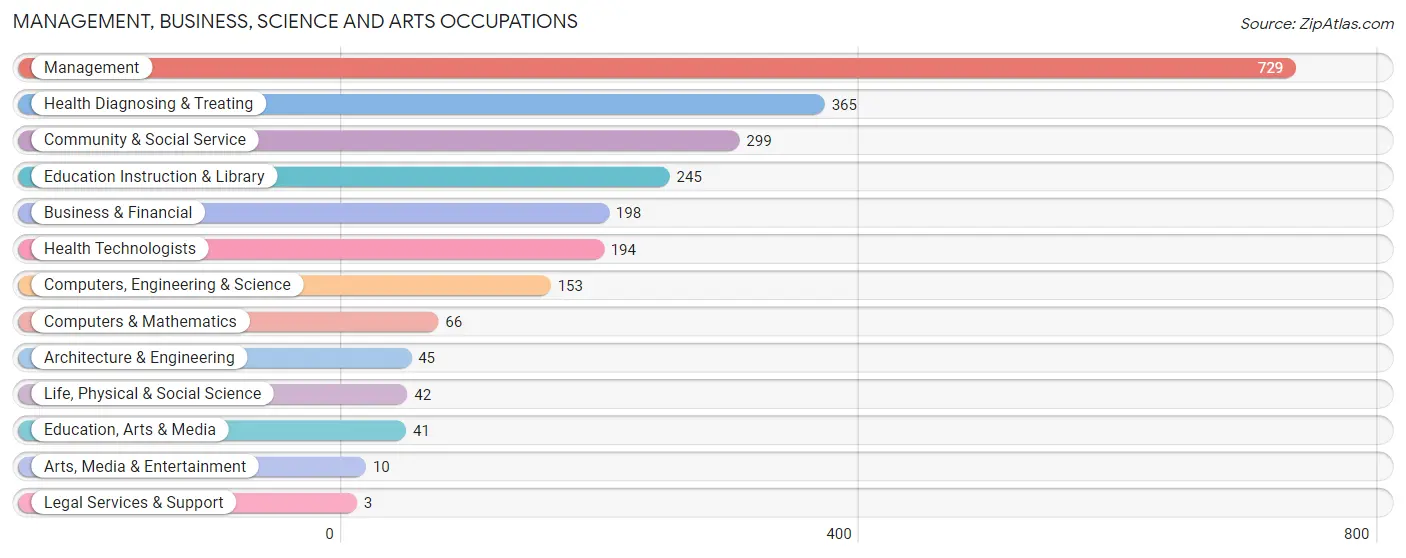
Management, Business, Science and Arts Occupations
The most common Management, Business, Science and Arts occupations in Smith County are Management (729 | 13.7%), Health Diagnosing & Treating (365 | 6.8%), Community & Social Service (299 | 5.6%), Education Instruction & Library (245 | 4.6%), and Business & Financial (198 | 3.7%).
Management, Business, Science and Arts Occupations by Sex
Within the Management, Business, Science and Arts occupations in Smith County, the most male-oriented occupations are Architecture & Engineering (100.0%), Life, Physical & Social Science (100.0%), and Legal Services & Support (100.0%), while the most female-oriented occupations are Education Instruction & Library (95.5%), Community & Social Service (91.6%), and Health Diagnosing & Treating (88.2%).

| Occupation | Male | Female |
| Management | 461 (63.2%) | 268 (36.8%) |
| Business & Financial | 31 (15.7%) | 167 (84.3%) |
| Computers, Engineering & Science | 133 (86.9%) | 20 (13.1%) |
| Computers & Mathematics | 46 (69.7%) | 20 (30.3%) |
| Architecture & Engineering | 45 (100.0%) | 0 (0.0%) |
| Life, Physical & Social Science | 42 (100.0%) | 0 (0.0%) |
| Community & Social Service | 25 (8.4%) | 274 (91.6%) |
| Education, Arts & Media | 5 (12.2%) | 36 (87.8%) |
| Legal Services & Support | 3 (100.0%) | 0 (0.0%) |
| Education Instruction & Library | 11 (4.5%) | 234 (95.5%) |
| Arts, Media & Entertainment | 6 (60.0%) | 4 (40.0%) |
| Health Diagnosing & Treating | 43 (11.8%) | 322 (88.2%) |
| Health Technologists | 23 (11.9%) | 171 (88.1%) |
| Total (Category) | 693 (39.7%) | 1,051 (60.3%) |
| Total (Overall) | 3,136 (58.7%) | 2,206 (41.3%) |
Services Occupations
The most common Services occupations in Smith County are Healthcare Support (254 | 4.8%), Security & Protection (170 | 3.2%), Cleaning & Maintenance (170 | 3.2%), Firefighting & Prevention (122 | 2.3%), and Food Preparation & Serving (71 | 1.3%).

Services Occupations by Sex
Within the Services occupations in Smith County, the most male-oriented occupations are Law Enforcement (100.0%), Security & Protection (92.9%), and Firefighting & Prevention (90.2%), while the most female-oriented occupations are Personal Care & Service (100.0%), Healthcare Support (91.7%), and Food Preparation & Serving (78.9%).

| Occupation | Male | Female |
| Healthcare Support | 21 (8.3%) | 233 (91.7%) |
| Security & Protection | 158 (92.9%) | 12 (7.1%) |
| Firefighting & Prevention | 110 (90.2%) | 12 (9.8%) |
| Law Enforcement | 48 (100.0%) | 0 (0.0%) |
| Food Preparation & Serving | 15 (21.1%) | 56 (78.9%) |
| Cleaning & Maintenance | 150 (88.2%) | 20 (11.8%) |
| Personal Care & Service | 0 (0.0%) | 53 (100.0%) |
| Total (Category) | 344 (47.9%) | 374 (52.1%) |
| Total (Overall) | 3,136 (58.7%) | 2,206 (41.3%) |
Sales and Office Occupations
The most common Sales and Office occupations in Smith County are Office & Administration (600 | 11.2%), and Sales & Related (342 | 6.4%).

Sales and Office Occupations by Sex

| Occupation | Male | Female |
| Sales & Related | 201 (58.8%) | 141 (41.2%) |
| Office & Administration | 142 (23.7%) | 458 (76.3%) |
| Total (Category) | 343 (36.4%) | 599 (63.6%) |
| Total (Overall) | 3,136 (58.7%) | 2,206 (41.3%) |
Natural Resources, Construction and Maintenance Occupations
The most common Natural Resources, Construction and Maintenance occupations in Smith County are Installation, Maintenance & Repair (265 | 5.0%), Construction & Extraction (215 | 4.0%), and Farming, Fishing & Forestry (51 | 0.9%).

Natural Resources, Construction and Maintenance Occupations by Sex

| Occupation | Male | Female |
| Farming, Fishing & Forestry | 51 (100.0%) | 0 (0.0%) |
| Construction & Extraction | 215 (100.0%) | 0 (0.0%) |
| Installation, Maintenance & Repair | 265 (100.0%) | 0 (0.0%) |
| Total (Category) | 531 (100.0%) | 0 (0.0%) |
| Total (Overall) | 3,136 (58.7%) | 2,206 (41.3%) |
Production, Transportation and Moving Occupations
The most common Production, Transportation and Moving occupations in Smith County are Production (686 | 12.8%), Transportation (494 | 9.2%), and Material Moving (227 | 4.3%).

Production, Transportation and Moving Occupations by Sex

| Occupation | Male | Female |
| Production | 543 (79.1%) | 143 (20.8%) |
| Transportation | 459 (92.9%) | 35 (7.1%) |
| Material Moving | 223 (98.2%) | 4 (1.8%) |
| Total (Category) | 1,225 (87.1%) | 182 (12.9%) |
| Total (Overall) | 3,136 (58.7%) | 2,206 (41.3%) |
Employment Industries by Sex in Smith County
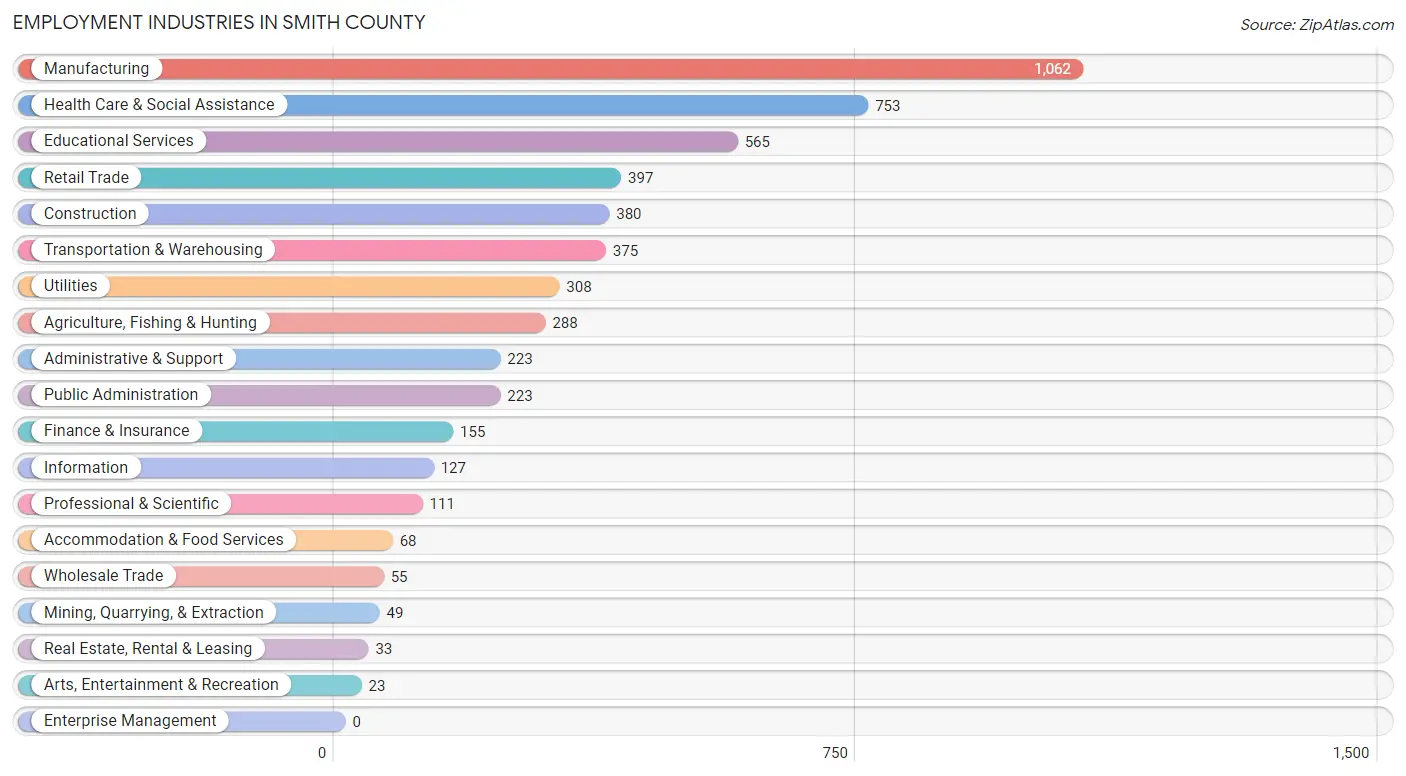
Employment Industries in Smith County
The major employment industries in Smith County include Manufacturing (1,062 | 19.9%), Health Care & Social Assistance (753 | 14.1%), Educational Services (565 | 10.6%), Retail Trade (397 | 7.4%), and Construction (380 | 7.1%).
Employment Industries by Sex in Smith County
The Smith County industries that see more men than women are Mining, Quarrying, & Extraction (100.0%), Construction (97.4%), and Wholesale Trade (92.7%), whereas the industries that tend to have a higher number of women are Information (98.4%), Finance & Insurance (91.6%), and Health Care & Social Assistance (89.6%).

| Industry | Male | Female |
| Agriculture, Fishing & Hunting | 248 (86.1%) | 40 (13.9%) |
| Mining, Quarrying, & Extraction | 49 (100.0%) | 0 (0.0%) |
| Construction | 370 (97.4%) | 10 (2.6%) |
| Manufacturing | 840 (79.1%) | 222 (20.9%) |
| Wholesale Trade | 51 (92.7%) | 4 (7.3%) |
| Retail Trade | 191 (48.1%) | 206 (51.9%) |
| Transportation & Warehousing | 278 (74.1%) | 97 (25.9%) |
| Utilities | 274 (89.0%) | 34 (11.0%) |
| Information | 2 (1.6%) | 125 (98.4%) |
| Finance & Insurance | 13 (8.4%) | 142 (91.6%) |
| Real Estate, Rental & Leasing | 22 (66.7%) | 11 (33.3%) |
| Professional & Scientific | 63 (56.8%) | 48 (43.2%) |
| Enterprise Management | 0 (0.0%) | 0 (0.0%) |
| Administrative & Support | 203 (91.0%) | 20 (9.0%) |
| Educational Services | 211 (37.3%) | 354 (62.6%) |
| Health Care & Social Assistance | 78 (10.4%) | 675 (89.6%) |
| Arts, Entertainment & Recreation | 20 (87.0%) | 3 (13.0%) |
| Accommodation & Food Services | 15 (22.1%) | 53 (77.9%) |
| Public Administration | 128 (57.4%) | 95 (42.6%) |
| Total | 3,136 (58.7%) | 2,206 (41.3%) |
Education in Smith County
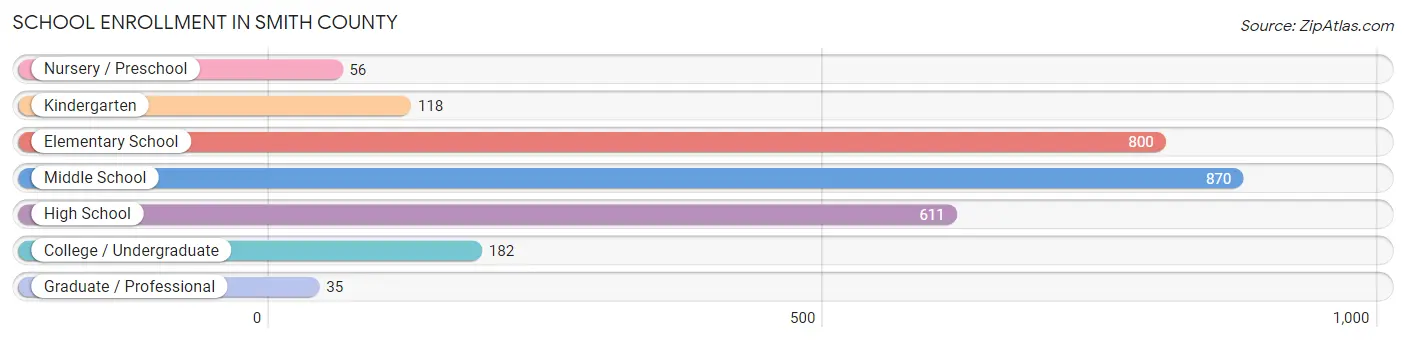
School Enrollment in Smith County
The most common levels of schooling among the 2,672 students in Smith County are middle school (870 | 32.6%), elementary school (800 | 29.9%), and high school (611 | 22.9%).
| School Level | # Students | % Students |
| Nursery / Preschool | 56 | 2.1% |
| Kindergarten | 118 | 4.4% |
| Elementary School | 800 | 29.9% |
| Middle School | 870 | 32.6% |
| High School | 611 | 22.9% |
| College / Undergraduate | 182 | 6.8% |
| Graduate / Professional | 35 | 1.3% |
| Total | 2,672 | 100.0% |
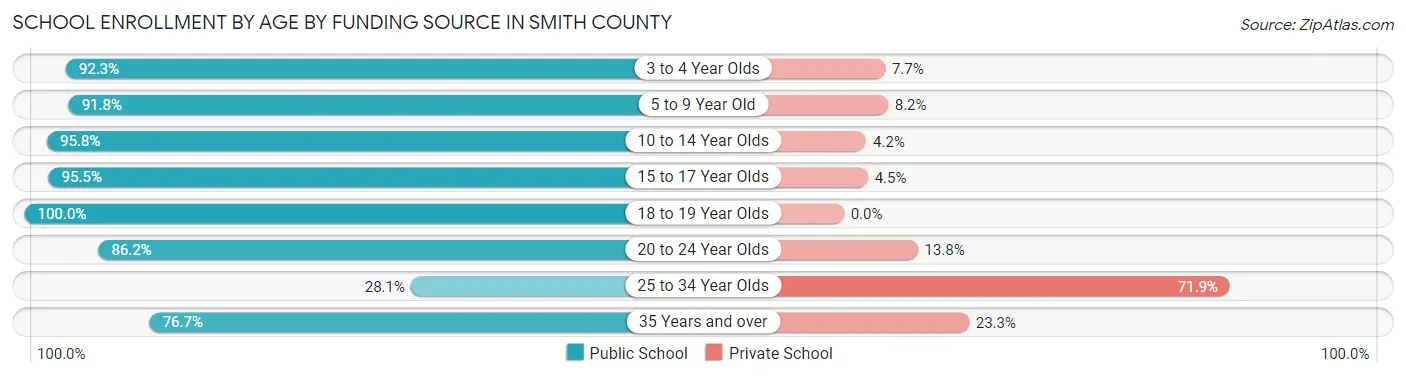
School Enrollment by Age by Funding Source in Smith County
Out of a total of 2,672 students who are enrolled in schools in Smith County, 219 (8.2%) attend a private institution, while the remaining 2,453 (91.8%) are enrolled in public schools. The age group of 25 to 34 year olds has the highest likelihood of being enrolled in private schools, with 41 (71.9% in the age bracket) enrolled. Conversely, the age group of 18 to 19 year olds has the lowest likelihood of being enrolled in a private school, with 72 (100.0% in the age bracket) attending a public institution.
| Age Bracket | Public School | Private School |
| 3 to 4 Year Olds | 72 (92.3%) | 6 (7.7%) |
| 5 to 9 Year Old | 715 (91.8%) | 64 (8.2%) |
| 10 to 14 Year Olds | 892 (95.8%) | 39 (4.2%) |
| 15 to 17 Year Olds | 490 (95.5%) | 23 (4.5%) |
| 18 to 19 Year Olds | 72 (100.0%) | 0 (0.0%) |
| 20 to 24 Year Olds | 94 (86.2%) | 15 (13.8%) |
| 25 to 34 Year Olds | 16 (28.1%) | 41 (71.9%) |
| 35 Years and over | 102 (76.7%) | 31 (23.3%) |
| Total | 2,453 (91.8%) | 219 (8.2%) |
Educational Attainment by Field of Study in Smith County
Education (361 | 25.2%), bio, nature & agricultural (276 | 19.2%), business (173 | 12.1%), arts & humanities (120 | 8.4%), and science & technology (117 | 8.2%) are the most common fields of study among 1,435 individuals in Smith County who have obtained a bachelor's degree or higher.

| Field of Study | # Graduates | % Graduates |
| Computers & Mathematics | 61 | 4.3% |
| Bio, Nature & Agricultural | 276 | 19.2% |
| Physical & Health Sciences | 111 | 7.7% |
| Psychology | 18 | 1.3% |
| Social Sciences | 22 | 1.5% |
| Engineering | 22 | 1.5% |
| Multidisciplinary Studies | 30 | 2.1% |
| Science & Technology | 117 | 8.2% |
| Business | 173 | 12.1% |
| Education | 361 | 25.2% |
| Literature & Languages | 14 | 1.0% |
| Liberal Arts & History | 89 | 6.2% |
| Visual & Performing Arts | 0 | 0.0% |
| Communications | 21 | 1.5% |
| Arts & Humanities | 120 | 8.4% |
| Total | 1,435 | 100.0% |
Transportation & Commute in Smith County
Vehicle Availability by Sex in Smith County
The most prevalent vehicle ownership categories in Smith County are males with 2 vehicles (1,429, accounting for 45.7%) and females with 2 vehicles (953, making up 65.9%).

| Vehicles Available | Male | Female |
| No Vehicle | 47 (1.5%) | 42 (1.9%) |
| 1 Vehicle | 552 (17.6%) | 485 (22.4%) |
| 2 Vehicles | 1,429 (45.7%) | 953 (43.9%) |
| 3 Vehicles | 805 (25.7%) | 469 (21.6%) |
| 4 Vehicles | 266 (8.5%) | 179 (8.3%) |
| 5 or more Vehicles | 30 (1.0%) | 41 (1.9%) |
| Total | 3,129 (100.0%) | 2,169 (100.0%) |
Commute Time in Smith County
The most frequently occuring commute durations in Smith County are 20 to 24 minutes (796 commuters, 15.9%), 30 to 34 minutes (779 commuters, 15.6%), and 10 to 14 minutes (609 commuters, 12.2%).

| Commute Time | # Commuters | % Commuters |
| Less than 5 Minutes | 169 | 3.4% |
| 5 to 9 Minutes | 510 | 10.2% |
| 10 to 14 Minutes | 609 | 12.2% |
| 15 to 19 Minutes | 539 | 10.8% |
| 20 to 24 Minutes | 796 | 15.9% |
| 25 to 29 Minutes | 197 | 3.9% |
| 30 to 34 Minutes | 779 | 15.6% |
| 35 to 39 Minutes | 183 | 3.7% |
| 40 to 44 Minutes | 214 | 4.3% |
| 45 to 59 Minutes | 259 | 5.2% |
| 60 to 89 Minutes | 574 | 11.5% |
| 90 or more Minutes | 167 | 3.3% |
Commute Time by Sex in Smith County
The most common commute times in Smith County are 30 to 34 minutes (578 commuters, 19.9%) for males and 20 to 24 minutes (583 commuters, 27.9%) for females.

| Commute Time | Male | Female |
| Less than 5 Minutes | 64 (2.2%) | 105 (5.0%) |
| 5 to 9 Minutes | 399 (13.7%) | 111 (5.3%) |
| 10 to 14 Minutes | 262 (9.0%) | 347 (16.6%) |
| 15 to 19 Minutes | 323 (11.1%) | 216 (10.3%) |
| 20 to 24 Minutes | 213 (7.3%) | 583 (27.9%) |
| 25 to 29 Minutes | 80 (2.8%) | 117 (5.6%) |
| 30 to 34 Minutes | 578 (19.9%) | 201 (9.6%) |
| 35 to 39 Minutes | 116 (4.0%) | 67 (3.2%) |
| 40 to 44 Minutes | 142 (4.9%) | 72 (3.5%) |
| 45 to 59 Minutes | 100 (3.4%) | 159 (7.6%) |
| 60 to 89 Minutes | 519 (17.8%) | 55 (2.6%) |
| 90 or more Minutes | 113 (3.9%) | 54 (2.6%) |
Time of Departure to Work by Sex in Smith County
The most frequent times of departure to work in Smith County are 7:00 AM to 7:29 AM (618, 21.2%) for males and 7:00 AM to 7:29 AM (694, 33.3%) for females.

| Time of Departure | Male | Female |
| 12:00 AM to 4:59 AM | 127 (4.4%) | 93 (4.5%) |
| 5:00 AM to 5:29 AM | 158 (5.4%) | 26 (1.3%) |
| 5:30 AM to 5:59 AM | 250 (8.6%) | 67 (3.2%) |
| 6:00 AM to 6:29 AM | 494 (17.0%) | 147 (7.0%) |
| 6:30 AM to 6:59 AM | 415 (14.3%) | 202 (9.7%) |
| 7:00 AM to 7:29 AM | 618 (21.2%) | 694 (33.3%) |
| 7:30 AM to 7:59 AM | 163 (5.6%) | 330 (15.8%) |
| 8:00 AM to 8:29 AM | 269 (9.2%) | 93 (4.5%) |
| 8:30 AM to 8:59 AM | 0 (0.0%) | 66 (3.2%) |
| 9:00 AM to 9:59 AM | 10 (0.3%) | 65 (3.1%) |
| 10:00 AM to 10:59 AM | 0 (0.0%) | 85 (4.1%) |
| 11:00 AM to 11:59 AM | 0 (0.0%) | 0 (0.0%) |
| 12:00 PM to 3:59 PM | 275 (9.5%) | 168 (8.1%) |
| 4:00 PM to 11:59 PM | 130 (4.5%) | 51 (2.4%) |
| Total | 2,909 (100.0%) | 2,087 (100.0%) |
Housing Occupancy in Smith County
Occupancy by Ownership in Smith County
Of the total 5,450 dwellings in Smith County, owner-occupied units account for 4,746 (87.1%), while renter-occupied units make up 704 (12.9%).

| Occupancy | # Housing Units | % Housing Units |
| Owner Occupied Housing Units | 4,746 | 87.1% |
| Renter-Occupied Housing Units | 704 | 12.9% |
| Total Occupied Housing Units | 5,450 | 100.0% |
Occupancy by Household Size in Smith County

| Household Size | # Housing Units | % Housing Units |
| 1-Person Household | 1,842 | 33.8% |
| 2-Person Household | 1,871 | 34.3% |
| 3-Person Household | 766 | 14.1% |
| 4+ Person Household | 971 | 17.8% |
| Total Housing Units | 5,450 | 100.0% |
Occupancy by Ownership by Household Size in Smith County

| Household Size | Owner-occupied | Renter-occupied |
| 1-Person Household | 1,622 (88.1%) | 220 (11.9%) |
| 2-Person Household | 1,652 (88.3%) | 219 (11.7%) |
| 3-Person Household | 646 (84.3%) | 120 (15.7%) |
| 4+ Person Household | 826 (85.1%) | 145 (14.9%) |
| Total Housing Units | 4,746 (87.1%) | 704 (12.9%) |
Occupancy by Educational Attainment in Smith County

| Household Size | Owner-occupied | Renter-occupied |
| Less than High School | 605 (83.8%) | 117 (16.2%) |
| High School Diploma | 1,750 (85.0%) | 309 (15.0%) |
| College/Associate Degree | 1,567 (90.0%) | 174 (10.0%) |
| Bachelor's Degree or higher | 824 (88.8%) | 104 (11.2%) |
Occupancy by Age of Householder in Smith County

| Age Bracket | # Households | % Households |
| Under 35 Years | 833 | 15.3% |
| 35 to 44 Years | 771 | 14.1% |
| 45 to 54 Years | 786 | 14.4% |
| 55 to 64 Years | 1,308 | 24.0% |
| 65 to 74 Years | 956 | 17.5% |
| 75 to 84 Years | 562 | 10.3% |
| 85 Years and Over | 234 | 4.3% |
| Total | 5,450 | 100.0% |
Housing Finances in Smith County
Median Income by Occupancy in Smith County
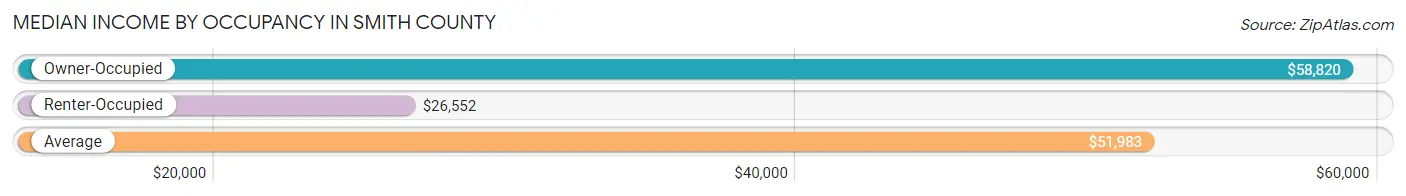
| Occupancy Type | # Households | Median Income |
| Owner-Occupied | 4,746 (87.1%) | $58,820 |
| Renter-Occupied | 704 (12.9%) | $26,552 |
| Average | 5,450 (100.0%) | $51,983 |
Occupancy by Householder Income Bracket in Smith County

| Income Bracket | Owner-occupied | Renter-occupied |
| Less than $5,000 | 177 (3.7%) | 63 (8.9%) |
| $5,000 to $9,999 | 119 (2.5%) | 69 (9.8%) |
| $10,000 to $14,999 | 350 (7.4%) | 95 (13.5%) |
| $15,000 to $19,999 | 284 (6.0%) | 54 (7.7%) |
| $20,000 to $24,999 | 511 (10.8%) | 53 (7.5%) |
| $25,000 to $34,999 | 358 (7.5%) | 86 (12.2%) |
| $35,000 to $49,999 | 374 (7.9%) | 109 (15.5%) |
| $50,000 to $74,999 | 825 (17.4%) | 97 (13.8%) |
| $75,000 to $99,999 | 693 (14.6%) | 47 (6.7%) |
| $100,000 to $149,999 | 725 (15.3%) | 31 (4.4%) |
| $150,000 or more | 330 (7.0%) | 0 (0.0%) |
| Total | 4,746 (100.0%) | 704 (100.0%) |
Monthly Housing Cost Tiers in Smith County

| Monthly Cost | Owner-occupied | Renter-occupied |
| Less than $300 | 1,291 (27.2%) | 34 (4.8%) |
| $300 to $499 | 1,121 (23.6%) | 97 (13.8%) |
| $500 to $799 | 865 (18.2%) | 228 (32.4%) |
| $800 to $999 | 494 (10.4%) | 69 (9.8%) |
| $1,000 to $1,499 | 536 (11.3%) | 35 (5.0%) |
| $1,500 to $1,999 | 252 (5.3%) | 0 (0.0%) |
| $2,000 to $2,499 | 110 (2.3%) | 0 (0.0%) |
| $2,500 to $2,999 | 56 (1.2%) | 0 (0.0%) |
| $3,000 or more | 21 (0.4%) | 0 (0.0%) |
| Total | 4,746 (100.0%) | 704 (100.0%) |
Physical Housing Characteristics in Smith County
Housing Structures in Smith County

| Structure Type | # Housing Units | % Housing Units |
| Single Unit, Detached | 3,634 | 66.7% |
| Single Unit, Attached | 27 | 0.5% |
| 2 Unit Apartments | 51 | 0.9% |
| 3 or 4 Unit Apartments | 40 | 0.7% |
| 5 to 9 Unit Apartments | 46 | 0.8% |
| 10 or more Apartments | 57 | 1.1% |
| Mobile Home / Other | 1,595 | 29.3% |
| Total | 5,450 | 100.0% |
Housing Structures by Occupancy in Smith County

| Structure Type | Owner-occupied | Renter-occupied |
| Single Unit, Detached | 3,343 (92.0%) | 291 (8.0%) |
| Single Unit, Attached | 19 (70.4%) | 8 (29.6%) |
| 2 Unit Apartments | 14 (27.5%) | 37 (72.6%) |
| 3 or 4 Unit Apartments | 0 (0.0%) | 40 (100.0%) |
| 5 to 9 Unit Apartments | 4 (8.7%) | 42 (91.3%) |
| 10 or more Apartments | 0 (0.0%) | 57 (100.0%) |
| Mobile Home / Other | 1,366 (85.6%) | 229 (14.4%) |
| Total | 4,746 (87.1%) | 704 (12.9%) |
Housing Structures by Number of Rooms in Smith County

| Number of Rooms | Owner-occupied | Renter-occupied |
| 1 Room | 40 (0.8%) | 17 (2.4%) |
| 2 or 3 Rooms | 40 (0.8%) | 48 (6.8%) |
| 4 or 5 Rooms | 850 (17.9%) | 195 (27.7%) |
| 6 or 7 Rooms | 1,706 (35.9%) | 337 (47.9%) |
| 8 or more Rooms | 2,110 (44.5%) | 107 (15.2%) |
| Total | 4,746 (100.0%) | 704 (100.0%) |
Housing Structure by Heating Type in Smith County
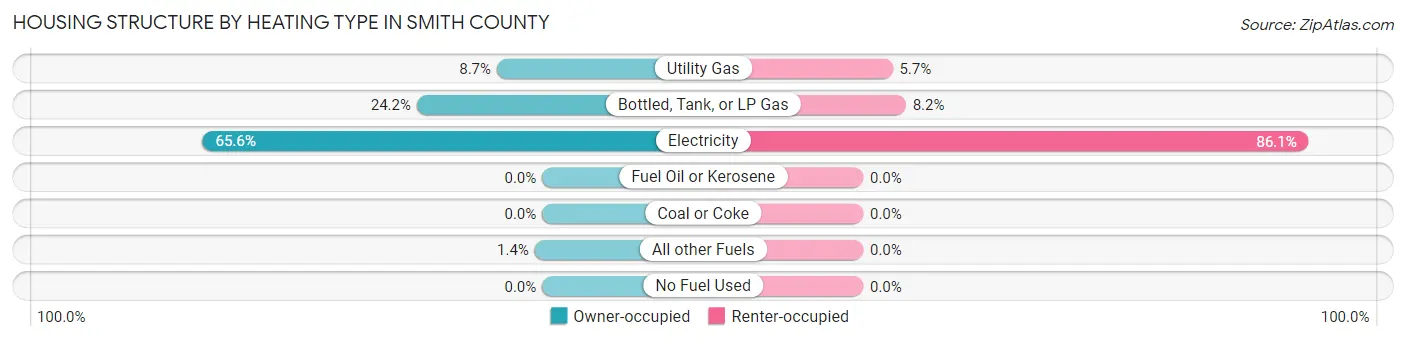
| Heating Type | Owner-occupied | Renter-occupied |
| Utility Gas | 415 (8.7%) | 40 (5.7%) |
| Bottled, Tank, or LP Gas | 1,149 (24.2%) | 58 (8.2%) |
| Electricity | 3,114 (65.6%) | 606 (86.1%) |
| Fuel Oil or Kerosene | 0 (0.0%) | 0 (0.0%) |
| Coal or Coke | 0 (0.0%) | 0 (0.0%) |
| All other Fuels | 68 (1.4%) | 0 (0.0%) |
| No Fuel Used | 0 (0.0%) | 0 (0.0%) |
| Total | 4,746 (100.0%) | 704 (100.0%) |
Household Vehicle Usage in Smith County

| Vehicles per Household | Owner-occupied | Renter-occupied |
| No Vehicle | 300 (6.3%) | 69 (9.8%) |
| 1 Vehicle | 1,593 (33.6%) | 474 (67.3%) |
| 2 Vehicles | 1,716 (36.2%) | 96 (13.6%) |
| 3 or more Vehicles | 1,137 (24.0%) | 65 (9.2%) |
| Total | 4,746 (100.0%) | 704 (100.0%) |
Real Estate & Mortgages in Smith County
Real Estate and Mortgage Overview in Smith County
| Characteristic | Without Mortgage | With Mortgage |
| Housing Units | 3,081 | 1,665 |
| Median Property Value | $109,900 | $134,700 |
| Median Household Income | $36,750 | $237 |
| Monthly Housing Costs | $357 | $21 |
| Real Estate Taxes | $466 | $615 |
Property Value by Mortgage Status in Smith County

| Property Value | Without Mortgage | With Mortgage |
| Less than $50,000 | 878 (28.5%) | 129 (7.7%) |
| $50,000 to $99,999 | 530 (17.2%) | 423 (25.4%) |
| $100,000 to $299,999 | 1,315 (42.7%) | 924 (55.5%) |
| $300,000 to $499,999 | 108 (3.5%) | 189 (11.4%) |
| $500,000 to $749,999 | 228 (7.4%) | 0 (0.0%) |
| $750,000 to $999,999 | 0 (0.0%) | 0 (0.0%) |
| $1,000,000 or more | 22 (0.7%) | 0 (0.0%) |
| Total | 3,081 (100.0%) | 1,665 (100.0%) |
Household Income by Mortgage Status in Smith County

| Household Income | Without Mortgage | With Mortgage |
| Less than $10,000 | 261 (8.5%) | 28 (1.7%) |
| $10,000 to $24,999 | 960 (31.2%) | 35 (2.1%) |
| $25,000 to $34,999 | 281 (9.1%) | 185 (11.1%) |
| $35,000 to $49,999 | 269 (8.7%) | 77 (4.6%) |
| $50,000 to $74,999 | 576 (18.7%) | 105 (6.3%) |
| $75,000 to $99,999 | 236 (7.7%) | 249 (14.9%) |
| $100,000 to $149,999 | 405 (13.2%) | 457 (27.5%) |
| $150,000 or more | 93 (3.0%) | 320 (19.2%) |
| Total | 3,081 (100.0%) | 1,665 (100.0%) |
Property Value to Household Income Ratio in Smith County

| Value-to-Income Ratio | Without Mortgage | With Mortgage |
| Less than 2.0x | 1,493 (48.5%) | 88,390 (5,308.7%) |
| 2.0x to 2.9x | 372 (12.1%) | 951 (57.1%) |
| 3.0x to 3.9x | 128 (4.2%) | 295 (17.7%) |
| 4.0x or more | 973 (31.6%) | 117 (7.0%) |
| Total | 3,081 (100.0%) | 1,665 (100.0%) |
Real Estate Taxes by Mortgage Status in Smith County

| Property Taxes | Without Mortgage | With Mortgage |
| Less than $800 | 1,168 (37.9%) | 31 (1.9%) |
| $800 to $1,499 | 258 (8.4%) | 492 (29.5%) |
| $800 to $1,499 | 212 (6.9%) | 301 (18.1%) |
| Total | 3,081 (100.0%) | 1,665 (100.0%) |
Health & Disability in Smith County
Health Insurance Coverage by Age in Smith County
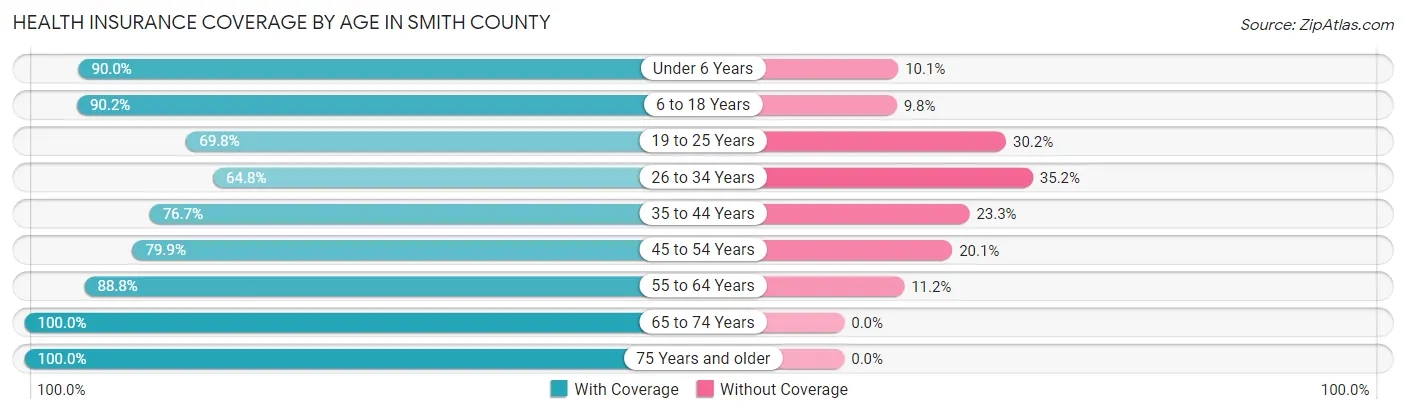
| Age Bracket | With Coverage | Without Coverage |
| Under 6 Years | 823 (89.9%) | 92 (10.1%) |
| 6 to 18 Years | 2,364 (90.2%) | 256 (9.8%) |
| 19 to 25 Years | 854 (69.8%) | 369 (30.2%) |
| 26 to 34 Years | 850 (64.8%) | 461 (35.2%) |
| 35 to 44 Years | 1,212 (76.7%) | 369 (23.3%) |
| 45 to 54 Years | 1,425 (79.9%) | 359 (20.1%) |
| 55 to 64 Years | 1,718 (88.8%) | 216 (11.2%) |
| 65 to 74 Years | 1,640 (100.0%) | 0 (0.0%) |
| 75 Years and older | 1,171 (100.0%) | 0 (0.0%) |
| Total | 12,057 (85.0%) | 2,122 (15.0%) |
Health Insurance Coverage by Citizenship Status in Smith County

| Citizenship Status | With Coverage | Without Coverage |
| Native Born | 823 (89.9%) | 92 (10.1%) |
| Foreign Born, Citizen | 2,364 (90.2%) | 256 (9.8%) |
| Foreign Born, not a Citizen | 854 (69.8%) | 369 (30.2%) |
Health Insurance Coverage by Household Income in Smith County

| Household Income | With Coverage | Without Coverage |
| Under $25,000 | 2,391 (75.7%) | 769 (24.3%) |
| $25,000 to $49,999 | 1,747 (88.0%) | 238 (12.0%) |
| $50,000 to $74,999 | 2,275 (81.7%) | 510 (18.3%) |
| $75,000 to $99,999 | 2,026 (90.0%) | 226 (10.0%) |
| $100,000 and over | 3,598 (90.5%) | 379 (9.5%) |
Public vs Private Health Insurance Coverage by Age in Smith County

| Age Bracket | Public Insurance | Private Insurance |
| Under 6 | 338 (36.9%) | 511 (55.8%) |
| 6 to 18 Years | 1,103 (42.1%) | 1,366 (52.1%) |
| 19 to 25 Years | 386 (31.6%) | 539 (44.1%) |
| 25 to 34 Years | 156 (11.9%) | 729 (55.6%) |
| 35 to 44 Years | 160 (10.1%) | 1,085 (68.6%) |
| 45 to 54 Years | 299 (16.8%) | 1,147 (64.3%) |
| 55 to 64 Years | 584 (30.2%) | 1,173 (60.7%) |
| 65 to 74 Years | 1,589 (96.9%) | 594 (36.2%) |
| 75 Years and over | 1,171 (100.0%) | 481 (41.1%) |
| Total | 5,786 (40.8%) | 7,625 (53.8%) |
Disability Status by Sex by Age in Smith County

| Age Bracket | Male | Female |
| Under 5 Years | 0 (0.0%) | 0 (0.0%) |
| 5 to 17 Years | 98 (8.8%) | 124 (9.5%) |
| 18 to 34 Years | 226 (16.5%) | 79 (5.6%) |
| 35 to 64 Years | 468 (18.0%) | 712 (26.3%) |
| 65 to 74 Years | 253 (30.6%) | 150 (18.5%) |
| 75 Years and over | 327 (73.2%) | 464 (64.1%) |
Disability Class by Sex by Age in Smith County
Disability Class: Hearing Difficulty

| Age Bracket | Male | Female |
| Under 5 Years | 0 (0.0%) | 0 (0.0%) |
| 5 to 17 Years | 0 (0.0%) | 0 (0.0%) |
| 18 to 34 Years | 39 (2.8%) | 0 (0.0%) |
| 35 to 64 Years | 268 (10.3%) | 65 (2.4%) |
| 65 to 74 Years | 103 (12.4%) | 20 (2.5%) |
| 75 Years and over | 237 (53.0%) | 203 (28.0%) |
Disability Class: Vision Difficulty

| Age Bracket | Male | Female |
| Under 5 Years | 0 (0.0%) | 0 (0.0%) |
| 5 to 17 Years | 77 (6.9%) | 0 (0.0%) |
| 18 to 34 Years | 41 (3.0%) | 5 (0.4%) |
| 35 to 64 Years | 42 (1.6%) | 106 (3.9%) |
| 65 to 74 Years | 78 (9.4%) | 51 (6.3%) |
| 75 Years and over | 85 (19.0%) | 128 (17.7%) |
Disability Class: Cognitive Difficulty
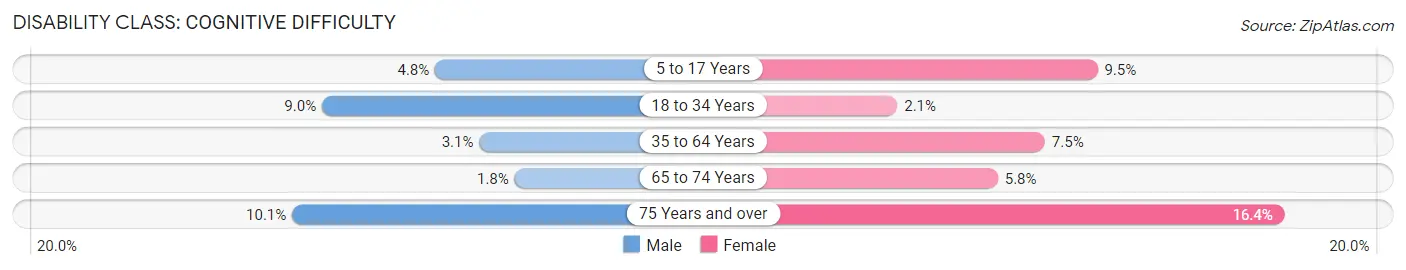
| Age Bracket | Male | Female |
| 5 to 17 Years | 53 (4.8%) | 124 (9.5%) |
| 18 to 34 Years | 123 (9.0%) | 29 (2.1%) |
| 35 to 64 Years | 81 (3.1%) | 204 (7.5%) |
| 65 to 74 Years | 15 (1.8%) | 47 (5.8%) |
| 75 Years and over | 45 (10.1%) | 119 (16.4%) |
Disability Class: Ambulatory Difficulty
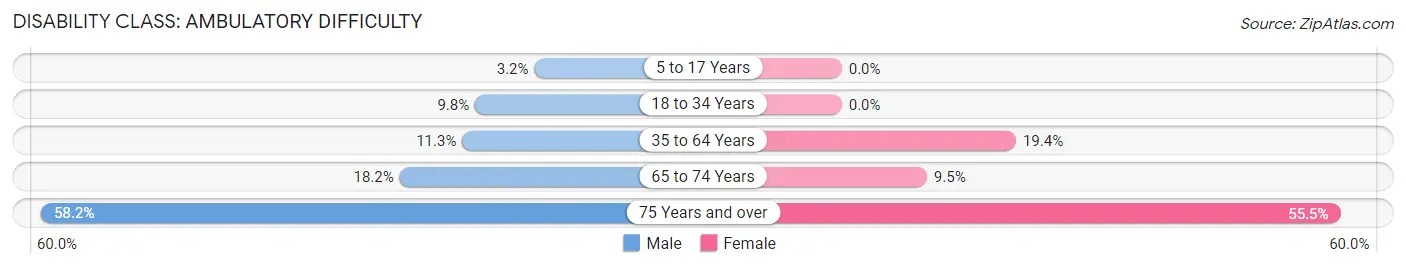
| Age Bracket | Male | Female |
| 5 to 17 Years | 36 (3.2%) | 0 (0.0%) |
| 18 to 34 Years | 135 (9.8%) | 0 (0.0%) |
| 35 to 64 Years | 292 (11.3%) | 525 (19.4%) |
| 65 to 74 Years | 151 (18.2%) | 77 (9.5%) |
| 75 Years and over | 260 (58.2%) | 402 (55.5%) |
Disability Class: Self-Care Difficulty

| Age Bracket | Male | Female |
| 5 to 17 Years | 40 (3.6%) | 18 (1.4%) |
| 18 to 34 Years | 135 (9.8%) | 0 (0.0%) |
| 35 to 64 Years | 59 (2.3%) | 150 (5.5%) |
| 65 to 74 Years | 10 (1.2%) | 11 (1.3%) |
| 75 Years and over | 72 (16.1%) | 82 (11.3%) |
Technology Access in Smith County
Computing Device Access in Smith County
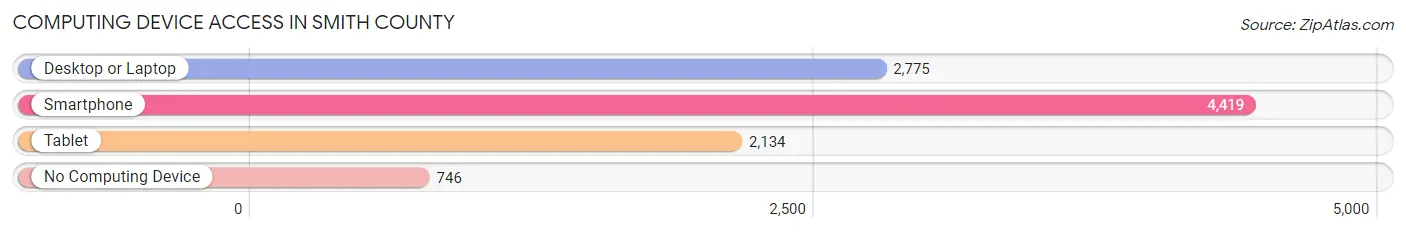
| Device Type | # Households | % Households |
| Desktop or Laptop | 2,775 | 50.9% |
| Smartphone | 4,419 | 81.1% |
| Tablet | 2,134 | 39.2% |
| No Computing Device | 746 | 13.7% |
| Total | 5,450 | 100.0% |
Internet Access in Smith County

| Internet Type | # Households | % Households |
| Dial-Up Internet | 13 | 0.2% |
| Broadband Home | 1,829 | 33.6% |
| Cellular Data Only | 869 | 15.9% |
| Satellite Internet | 585 | 10.7% |
| No Internet | 2,468 | 45.3% |
| Total | 5,450 | 100.0% |
Smith County Summary
Smith County is located in the southeastern corner of Mississippi, and is bordered by Jasper, Simpson, and Rankin Counties. The county seat is Raleigh, and the county is named for Major David Smith, a hero of the War of 1812. Smith County is part of the Jackson Metropolitan Statistical Area.
Geography
Smith County is located in the southeastern corner of Mississippi, and is bordered by Jasper, Simpson, and Rankin Counties. The county has a total area of 545 square miles, of which 544 square miles is land and 1 square mile is water. The terrain is mostly flat, with some rolling hills in the northern part of the county. The county is drained by the Pearl River, which forms the western boundary of the county.
The climate of Smith County is humid subtropical, with hot, humid summers and mild winters. The average annual temperature is 64°F, and the average annual precipitation is 56 inches.
Demographics
As of the 2010 census, there were 16,491 people, 6,541 households, and 4,619 families residing in the county. The population density was 30 people per square mile. The racial makeup of the county was 68.3% White, 29.3% African American, 0.3% Native American, 0.2% Asian, 0.1% Pacific Islander, 0.7% from other races, and 1.2% from two or more races. Hispanic or Latino of any race were 1.7% of the population.
The median income for a household in the county was $30,945, and the median income for a family was $37,945. The per capita income for the county was $15,945. About 22.3% of families and 27.2% of the population were below the poverty line, including 37.2% of those under age 18 and 22.2% of those age 65 or over.
Economy
Smith County is primarily a rural county, and the economy is largely based on agriculture. The major agricultural products are cotton, soybeans, corn, and hay. The county also has a large timber industry, and there are several sawmills and wood-processing plants in the area.
The county also has a growing manufacturing sector, with several factories producing furniture, textiles, and other products. The county is also home to several small businesses, including restaurants, retail stores, and service providers.
The unemployment rate in Smith County was 5.2% in 2019, slightly lower than the national average of 3.7%.
History
Smith County was formed in 1833 from portions of Jasper and Simpson Counties. The county was named for Major David Smith, a hero of the War of 1812.
The county was largely rural until the late 19th century, when the timber industry began to develop. The timber industry was the main source of employment in the county until the mid-20th century, when the manufacturing sector began to grow.
In the late 20th century, Smith County experienced a population boom, as people moved to the area from other parts of the state and the country. The population of the county has continued to grow in the 21st century, and the county is now home to a diverse population.
Common Questions
What is the Total Population of Smith County?
Total Population of Smith County is 14,310.
What is the Total Male Population of Smith County?
Total Male Population of Smith County is 6,747.
What is the Total Female Population of Smith County?
Total Female Population of Smith County is 7,563.
What is the Ratio of Males per 100 Females in Smith County?
There are 89.21 Males per 100 Females in Smith County.
What is the Ratio of Females per 100 Males in Smith County?
There are 112.09 Females per 100 Males in Smith County.
What is the Median Population Age in Smith County?
Median Population Age in Smith County is 42.8 Years.
What is the Average Family Size in Smith County
Average Family Size in Smith County is 3.4 People.
What is the Average Household Size in Smith County
Average Household Size in Smith County is 2.6 People.
What is Per Capita Income in Smith County?
Per Capita income in Smith County is $25,394.
What is the Median Family Income in Smith County?
Median Family Income in Smith County is $70,054.
What is the Median Household income in Smith County?
Median Household Income in Smith County is $51,983.
What is Income or Wage Gap in Smith County?
Income or Wage Gap in Smith County is 36.0%.
Women in Smith County earn 64.0 cents for every dollar earned by a man.
What is Family Income Deficit in Smith County?
Family Income Deficit in Smith County is $10,482.
Families that are below poverty line in Smith County earn $10,482 less on average than the poverty threshold level.
What is Inequality or Gini Index in Smith County?
Inequality or Gini Index in Smith County is 0.45.
How Large is the Labor Force in Smith County?
There are 5,543 People in the Labor Forcein in Smith County.
What is the Percentage of People in the Labor Force in Smith County?
48.4% of People are in the Labor Force in Smith County.
What is the Unemployment Rate in Smith County?
Unemployment Rate in Smith County is 3.5%.