Scott County, MS
Scott County Map

Scott County Overview
27,943
TOTAL POPULATION
13,871
MALE POPULATION
14,072
FEMALE POPULATION
98.57
MALES / 100 FEMALES
101.45
FEMALES / 100 MALES
36.7
MEDIAN AGE
3.3
AVG FAMILY SIZE
2.9
AVG HOUSEHOLD SIZE
$23,043
PER CAPITA INCOME
$55,340
AVG FAMILY INCOME
$44,968
AVG HOUSEHOLD INCOME
28.0%
WAGE / INCOME GAP [ % ]
72.0¢/ $1
WAGE / INCOME GAP [ $ ]
$11,803
FAMILY INCOME DEFICIT
0.47
INEQUALITY / GINI INDEX
12,076
LABOR FORCE [ PEOPLE ]
56.5%
PERCENT IN LABOR FORCE
6.0%
UNEMPLOYMENT RATE
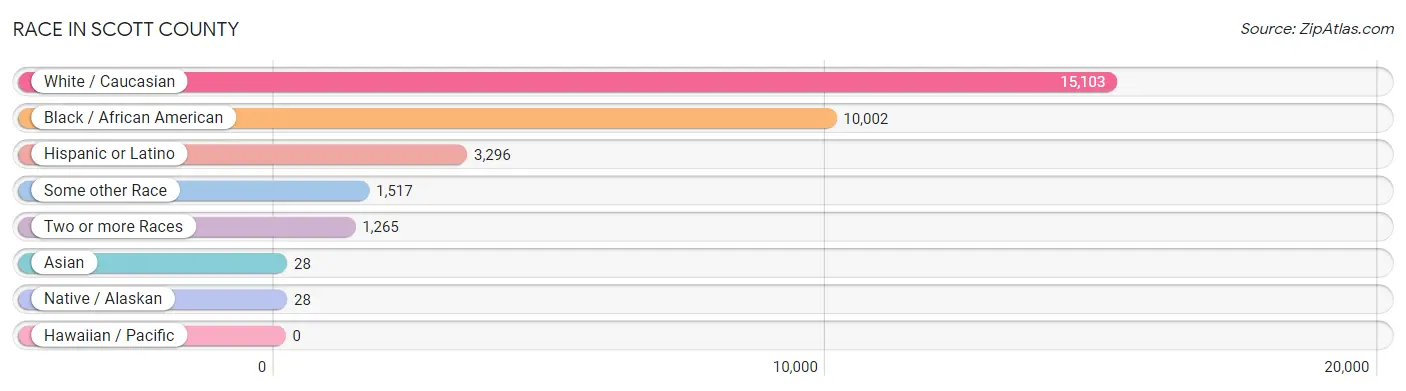
Race in Scott County
The most populous races in Scott County are White / Caucasian (15,103 | 54.0%), Black / African American (10,002 | 35.8%), and Hispanic or Latino (3,296 | 11.8%).
| Race | # Population | % Population |
| Asian | 28 | 0.1% |
| Black / African American | 10,002 | 35.8% |
| Hawaiian / Pacific | 0 | 0.0% |
| Hispanic or Latino | 3,296 | 11.8% |
| Native / Alaskan | 28 | 0.1% |
| White / Caucasian | 15,103 | 54.0% |
| Two or more Races | 1,265 | 4.5% |
| Some other Race | 1,517 | 5.4% |
| Total | 27,943 | 100.0% |
Ancestry in Scott County
The most populous ancestries reported in Scott County are American (7,267 | 26.0%), English (1,816 | 6.5%), Central American (1,473 | 5.3%), Mexican (1,162 | 4.2%), and Guatemalan (1,070 | 3.8%), together accounting for 45.8% of all Scott County residents.

| Ancestry | # Population | % Population |
| African | 49 | 0.2% |
| American | 7,267 | 26.0% |
| Apache | 27 | 0.1% |
| Arab | 7 | 0.0% |
| Bolivian | 14 | 0.1% |
| British | 21 | 0.1% |
| Burmese | 38 | 0.1% |
| Canadian | 14 | 0.1% |
| Central American | 1,473 | 5.3% |
| Cherokee | 91 | 0.3% |
| Colombian | 18 | 0.1% |
| Cuban | 108 | 0.4% |
| Dominican | 47 | 0.2% |
| Dutch | 12 | 0.0% |
| Eastern European | 30 | 0.1% |
| English | 1,816 | 6.5% |
| European | 142 | 0.5% |
| French | 132 | 0.5% |
| French Canadian | 21 | 0.1% |
| German | 587 | 2.1% |
| Guatemalan | 1,070 | 3.8% |
| Honduran | 28 | 0.1% |
| Houma | 28 | 0.1% |
| Indian (Asian) | 81 | 0.3% |
| Irish | 1,038 | 3.7% |
| Italian | 10 | 0.0% |
| Korean | 28 | 0.1% |
| Mexican | 1,162 | 4.2% |
| Nicaraguan | 375 | 1.3% |
| Norwegian | 20 | 0.1% |
| Pennsylvania German | 29 | 0.1% |
| Peruvian | 7 | 0.0% |
| Portuguese | 10 | 0.0% |
| Puerto Rican | 5 | 0.0% |
| Scandinavian | 8 | 0.0% |
| Scotch-Irish | 81 | 0.3% |
| Scottish | 169 | 0.6% |
| South American | 39 | 0.1% |
| Spaniard | 16 | 0.1% |
| Spanish | 342 | 1.2% |
| Subsaharan African | 49 | 0.2% |
| Swedish | 156 | 0.6% |
| Welsh | 42 | 0.2% | View All 43 Rows |
Immigrants in Scott County
The most numerous immigrant groups reported in Scott County came from Latin America (1,436 | 5.1%), Central America (1,313 | 4.7%), Guatemala (903 | 3.2%), Mexico (281 | 1.0%), and Caribbean (98 | 0.4%), together accounting for 14.4% of all Scott County residents.

| Immigration Origin | # Population | % Population |
| Asia | 28 | 0.1% |
| Bolivia | 14 | 0.1% |
| Canada | 14 | 0.1% |
| Caribbean | 98 | 0.4% |
| Central America | 1,313 | 4.7% |
| Colombia | 11 | 0.0% |
| Cuba | 51 | 0.2% |
| Dominican Republic | 47 | 0.2% |
| England | 2 | 0.0% |
| Europe | 7 | 0.0% |
| Germany | 5 | 0.0% |
| Guatemala | 903 | 3.2% |
| Honduras | 73 | 0.3% |
| Latin America | 1,436 | 5.1% |
| Mexico | 281 | 1.0% |
| Nicaragua | 56 | 0.2% |
| Northern Europe | 2 | 0.0% |
| Philippines | 28 | 0.1% |
| South America | 25 | 0.1% |
| South Eastern Asia | 28 | 0.1% |
| Western Europe | 5 | 0.0% | View All 21 Rows |
Sex and Age in Scott County
Sex and Age in Scott County
The most populous age groups in Scott County are 10 to 14 Years (1,280 | 9.2%) for men and 10 to 14 Years (1,257 | 8.9%) for women.

| Age Bracket | Male | Female |
| Under 5 Years | 1,205 (8.7%) | 1,094 (7.8%) |
| 5 to 9 Years | 885 (6.4%) | 529 (3.8%) |
| 10 to 14 Years | 1,280 (9.2%) | 1,257 (8.9%) |
| 15 to 19 Years | 1,274 (9.2%) | 1,088 (7.7%) |
| 20 to 24 Years | 746 (5.4%) | 767 (5.4%) |
| 25 to 29 Years | 638 (4.6%) | 885 (6.3%) |
| 30 to 34 Years | 918 (6.6%) | 812 (5.8%) |
| 35 to 39 Years | 682 (4.9%) | 830 (5.9%) |
| 40 to 44 Years | 1,002 (7.2%) | 822 (5.8%) |
| 45 to 49 Years | 842 (6.1%) | 904 (6.4%) |
| 50 to 54 Years | 711 (5.1%) | 779 (5.5%) |
| 55 to 59 Years | 645 (4.6%) | 1,040 (7.4%) |
| 60 to 64 Years | 1,043 (7.5%) | 761 (5.4%) |
| 65 to 69 Years | 558 (4.0%) | 925 (6.6%) |
| 70 to 74 Years | 503 (3.6%) | 512 (3.6%) |
| 75 to 79 Years | 585 (4.2%) | 521 (3.7%) |
| 80 to 84 Years | 264 (1.9%) | 324 (2.3%) |
| 85 Years and over | 90 (0.6%) | 222 (1.6%) |
| Total | 13,871 (100.0%) | 14,072 (100.0%) |
Families and Households in Scott County
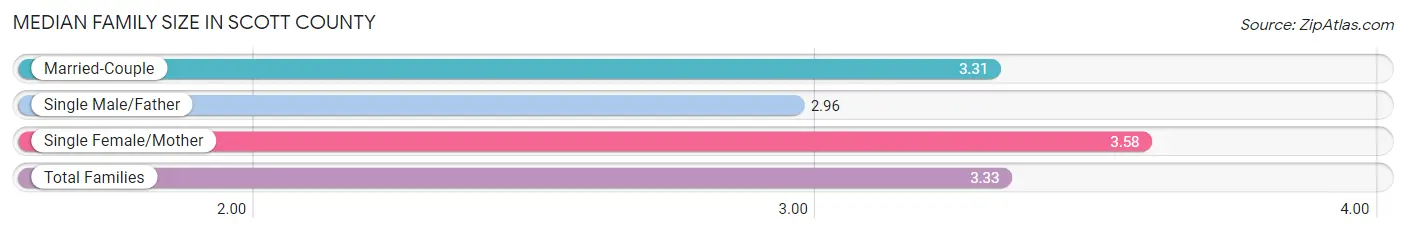
Median Family Size in Scott County
The median family size in Scott County is 3.33 persons per family, with single female/mother families (1,659 | 23.5%) accounting for the largest median family size of 3.58 persons per family. On the other hand, single male/father families (852 | 12.0%) represent the smallest median family size with 2.96 persons per family.
| Family Type | # Families | Family Size |
| Married-Couple | 4,558 (64.5%) | 3.31 |
| Single Male/Father | 852 (12.0%) | 2.96 |
| Single Female/Mother | 1,659 (23.5%) | 3.58 |
| Total Families | 7,069 (100.0%) | 3.33 |
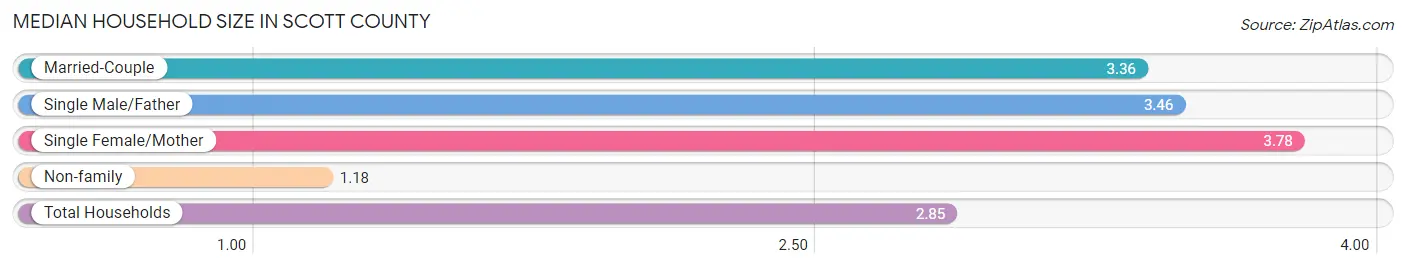
Median Household Size in Scott County
The median household size in Scott County is 2.85 persons per household, with single female/mother households (1,659 | 17.1%) accounting for the largest median household size of 3.78 persons per household. non-family households (2,627 | 27.1%) represent the smallest median household size with 1.18 persons per household.
| Household Type | # Households | Household Size |
| Married-Couple | 4,558 (47.0%) | 3.36 |
| Single Male/Father | 852 (8.8%) | 3.46 |
| Single Female/Mother | 1,659 (17.1%) | 3.78 |
| Non-family | 2,627 (27.1%) | 1.18 |
| Total Households | 9,696 (100.0%) | 2.85 |
Household Size by Marriage Status in Scott County
Out of a total of 9,696 households in Scott County, 7,069 (72.9%) are family households, while 2,627 (27.1%) are nonfamily households. The most numerous type of family households are 2-person households, comprising 3,205, and the most common type of nonfamily households are 1-person households, comprising 2,330.

| Household Size | Family Households | Nonfamily Households |
| 1-Person Households | - | 2,330 (24.0%) |
| 2-Person Households | 3,205 (33.1%) | 255 (2.6%) |
| 3-Person Households | 1,359 (14.0%) | 35 (0.4%) |
| 4-Person Households | 1,655 (17.1%) | 0 (0.0%) |
| 5-Person Households | 676 (7.0%) | 7 (0.1%) |
| 6-Person Households | 115 (1.2%) | 0 (0.0%) |
| 7+ Person Households | 59 (0.6%) | 0 (0.0%) |
| Total | 7,069 (72.9%) | 2,627 (27.1%) |
Female Fertility in Scott County
Fertility by Age in Scott County
Average fertility rate in Scott County is 67.0 births per 1,000 women. Women in the age bracket of 20 to 34 years have the highest fertility rate with 140.0 births per 1,000 women. Women in the age bracket of 20 to 34 years acount for 83.1% of all women with births.

| Age Bracket | Women with Births | Births / 1,000 Women |
| 15 to 19 years | 0 (0.0%) | 0.0 |
| 20 to 34 years | 344 (83.1%) | 140.0 |
| 35 to 50 years | 70 (16.9%) | 27.0 |
| Total | 414 (100.0%) | 67.0 |
Fertility by Age by Marriage Status in Scott County
52.4% of women with births (414) in Scott County are married. The highest percentage of unmarried women with births falls into 20 to 34 years age bracket with 57.3% of them unmarried at the time of birth, while the lowest percentage of unmarried women with births belong to 35 to 50 years age bracket with 0.0% of them unmarried.

| Age Bracket | Married | Unmarried |
| 15 to 19 years | 0 (0.0%) | 0 (0.0%) |
| 20 to 34 years | 147 (42.7%) | 197 (57.3%) |
| 35 to 50 years | 70 (100.0%) | 0 (0.0%) |
| Total | 217 (52.4%) | 197 (47.6%) |
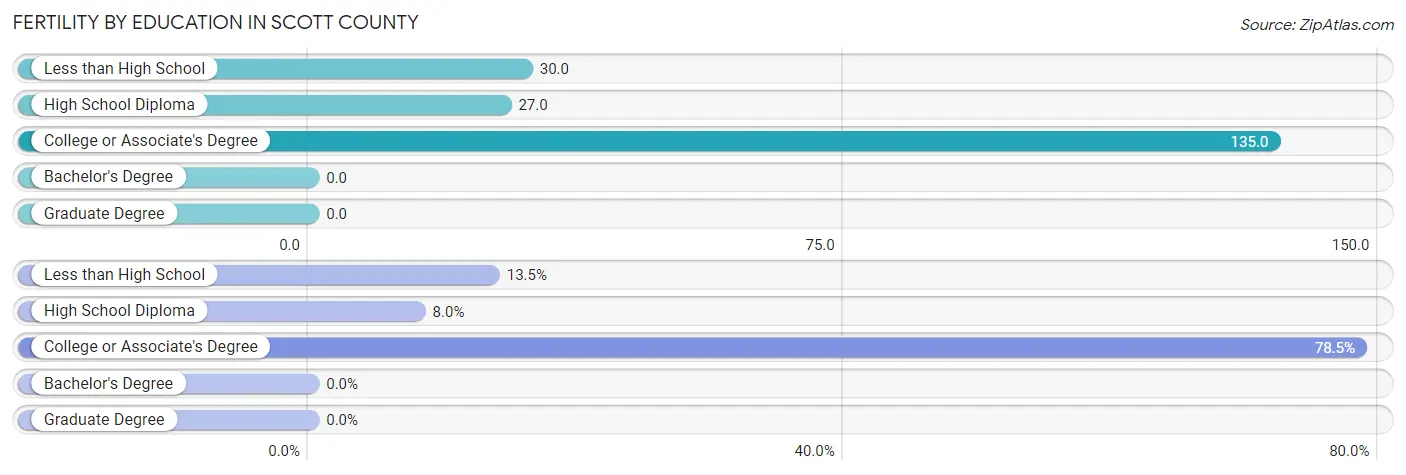
Fertility by Education in Scott County
| Educational Attainment | Women with Births | Births / 1,000 Women |
| Less than High School | 56 (13.5%) | 30.0 |
| High School Diploma | 33 (8.0%) | 27.0 |
| College or Associate's Degree | 325 (78.5%) | 135.0 |
| Bachelor's Degree | 0 (0.0%) | 0.0 |
| Graduate Degree | 0 (0.0%) | 0.0 |
| Total | 414 (100.0%) | 67.0 |
Fertility by Education by Marriage Status in Scott County
47.6% of women with births in Scott County are unmarried. Women with the educational attainment of less than high school are most likely to be married with 100.0% of them married at childbirth, while women with the educational attainment of high school diploma are least likely to be married with 100.0% of them unmarried at childbirth.

| Educational Attainment | Married | Unmarried |
| Less than High School | 56 (100.0%) | 0 (0.0%) |
| High School Diploma | 0 (0.0%) | 33 (100.0%) |
| College or Associate's Degree | 161 (49.5%) | 164 (50.5%) |
| Bachelor's Degree | 0 (0.0%) | 0 (0.0%) |
| Graduate Degree | 0 (0.0%) | 0 (0.0%) |
| Total | 217 (52.4%) | 197 (47.6%) |
Income in Scott County
Income Overview in Scott County
Per Capita Income in Scott County is $23,043, while median incomes of families and households are $55,340 and $44,968 respectively.
| Characteristic | Number | Measure |
| Per Capita Income | 27,943 | $23,043 |
| Median Family Income | 7,069 | $55,340 |
| Mean Family Income | 7,069 | $72,009 |
| Median Household Income | 9,696 | $44,968 |
| Mean Household Income | 9,696 | $62,217 |
| Income Deficit | 7,069 | $11,803 |
| Wage / Income Gap (%) | 27,943 | 28.00% |
| Wage / Income Gap ($) | 27,943 | 72.00¢ per $1 |
| Gini / Inequality Index | 27,943 | 0.47 |
Earnings by Sex in Scott County
Average Earnings in Scott County are $30,175, $35,869 for men and $25,827 for women, a difference of 28.0%.

| Sex | Number | Average Earnings |
| Male | 6,933 (55.0%) | $35,869 |
| Female | 5,669 (45.0%) | $25,827 |
| Total | 12,602 (100.0%) | $30,175 |
Earnings by Sex by Income Bracket in Scott County
The most common earnings brackets in Scott County are $65,000 to $74,999 for men (611 | 8.8%) and $2,499 or less for women (600 | 10.6%).

| Income | Male | Female |
| $2,499 or less | 226 (3.3%) | 600 (10.6%) |
| $2,500 to $4,999 | 208 (3.0%) | 259 (4.6%) |
| $5,000 to $7,499 | 351 (5.1%) | 215 (3.8%) |
| $7,500 to $9,999 | 157 (2.3%) | 403 (7.1%) |
| $10,000 to $12,499 | 218 (3.1%) | 72 (1.3%) |
| $12,500 to $14,999 | 447 (6.5%) | 82 (1.5%) |
| $15,000 to $17,499 | 190 (2.7%) | 167 (2.9%) |
| $17,500 to $19,999 | 138 (2.0%) | 346 (6.1%) |
| $20,000 to $22,499 | 397 (5.7%) | 465 (8.2%) |
| $22,500 to $24,999 | 434 (6.3%) | 164 (2.9%) |
| $25,000 to $29,999 | 457 (6.6%) | 285 (5.0%) |
| $30,000 to $34,999 | 143 (2.1%) | 579 (10.2%) |
| $35,000 to $39,999 | 539 (7.8%) | 185 (3.3%) |
| $40,000 to $44,999 | 384 (5.5%) | 398 (7.0%) |
| $45,000 to $49,999 | 454 (6.6%) | 217 (3.8%) |
| $50,000 to $54,999 | 200 (2.9%) | 265 (4.7%) |
| $55,000 to $64,999 | 500 (7.2%) | 517 (9.1%) |
| $65,000 to $74,999 | 611 (8.8%) | 114 (2.0%) |
| $75,000 to $99,999 | 501 (7.2%) | 217 (3.8%) |
| $100,000+ | 378 (5.4%) | 119 (2.1%) |
| Total | 6,933 (100.0%) | 5,669 (100.0%) |
Earnings by Sex by Educational Attainment in Scott County
Average earnings in Scott County are $40,282 for men and $31,468 for women, a difference of 21.9%. Men with an educational attainment of bachelor's degree enjoy the highest average annual earnings of $58,974, while those with less than high school education earn the least with $21,672. Women with an educational attainment of graduate degree earn the most with the average annual earnings of $48,597, while those with less than high school education have the smallest earnings of $19,875.

| Educational Attainment | Male Income | Female Income |
| Less than High School | $21,672 | $19,875 |
| High School Diploma | $38,183 | $23,594 |
| College or Associate's Degree | $44,120 | $34,791 |
| Bachelor's Degree | $58,974 | $40,913 |
| Graduate Degree | $21,991 | $48,597 |
| Total | $40,282 | $31,468 |
Family Income in Scott County
Family Income Brackets in Scott County
According to the Scott County family income data, there are 1,209 families falling into the $50,000 to $74,999 income range, which is the most common income bracket and makes up 17.1% of all families. Conversely, the $200,000+ income bracket is the least frequent group with only 191 families (2.7%) belonging to this category.

| Income Bracket | # Families | % Families |
| Less than $10,000 | 551 | 7.8% |
| $10,000 to $14,999 | 226 | 3.2% |
| $15,000 to $24,999 | 1,152 | 16.3% |
| $25,000 to $34,999 | 650 | 9.2% |
| $35,000 to $49,999 | 721 | 10.2% |
| $50,000 to $74,999 | 1,209 | 17.1% |
| $75,000 to $99,999 | 877 | 12.4% |
| $100,000 to $149,999 | 1,138 | 16.1% |
| $150,000 to $199,999 | 346 | 4.9% |
| $200,000+ | 191 | 2.7% |
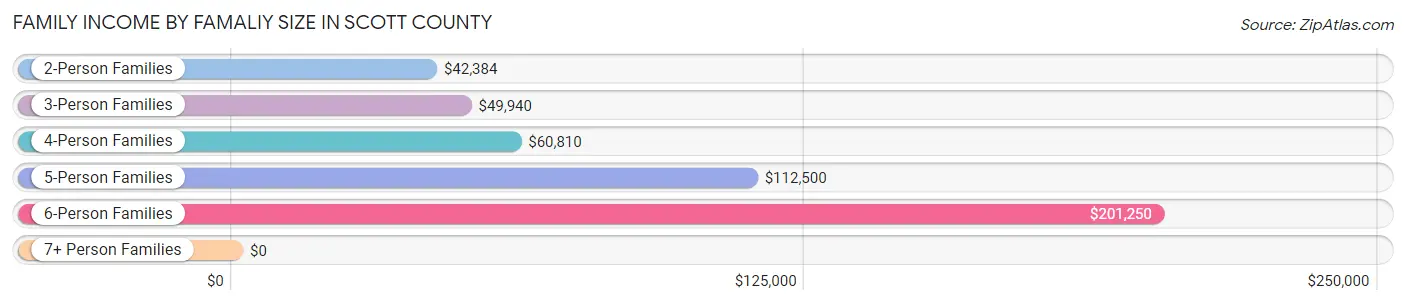
Family Income by Famaliy Size in Scott County
6-person families (71 | 1.0%) account for the highest median family income in Scott County with $201,250 per family, while 6-person families (71 | 1.0%) have the highest median income of $33,542 per family member.
| Income Bracket | # Families | Median Income |
| 2-Person Families | 3,380 (47.8%) | $42,384 |
| 3-Person Families | 1,397 (19.8%) | $49,940 |
| 4-Person Families | 1,563 (22.1%) | $60,810 |
| 5-Person Families | 604 (8.5%) | $112,500 |
| 6-Person Families | 71 (1.0%) | $201,250 |
| 7+ Person Families | 54 (0.8%) | $0 |
| Total | 7,069 (100.0%) | $55,340 |
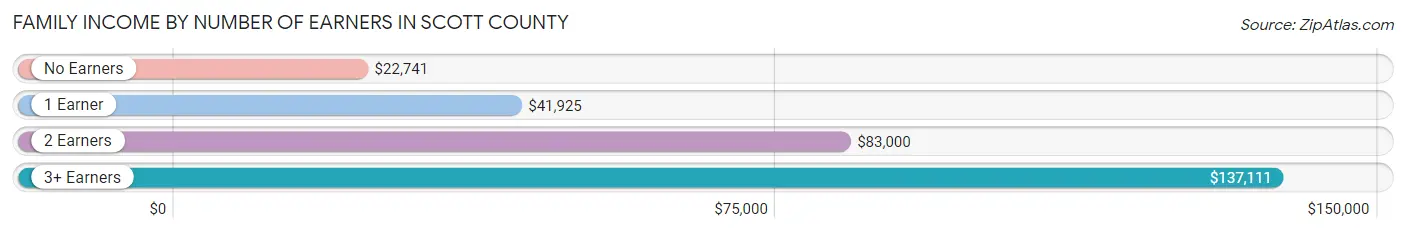
Family Income by Number of Earners in Scott County
The median family income in Scott County is $55,340, with families comprising 3+ earners (534) having the highest median family income of $137,111, while families with no earners (1,359) have the lowest median family income of $22,741, accounting for 7.5% and 19.2% of families, respectively.
| Number of Earners | # Families | Median Income |
| No Earners | 1,359 (19.2%) | $22,741 |
| 1 Earner | 2,510 (35.5%) | $41,925 |
| 2 Earners | 2,666 (37.7%) | $83,000 |
| 3+ Earners | 534 (7.5%) | $137,111 |
| Total | 7,069 (100.0%) | $55,340 |
Household Income in Scott County
Household Income Brackets in Scott County
With 1,629 households falling in the category, the $15,000 to $24,999 income range is the most frequent in Scott County, accounting for 16.8% of all households. In contrast, only 194 households (2.0%) fall into the $200,000+ income bracket, making it the least populous group.

| Income Bracket | # Households | % Households |
| Less than $10,000 | 698 | 7.2% |
| $10,000 to $14,999 | 747 | 7.7% |
| $15,000 to $24,999 | 1,629 | 16.8% |
| $25,000 to $34,999 | 1,115 | 11.5% |
| $35,000 to $49,999 | 1,028 | 10.6% |
| $50,000 to $74,999 | 1,629 | 16.8% |
| $75,000 to $99,999 | 1,115 | 11.5% |
| $100,000 to $149,999 | 1,202 | 12.4% |
| $150,000 to $199,999 | 349 | 3.6% |
| $200,000+ | 194 | 2.0% |
Household Income by Householder Age in Scott County
The median household income in Scott County is $44,968, with the highest median household income of $55,451 found in the 25 to 44 years age bracket for the primary householder. A total of 3,015 households (31.1%) fall into this category. Meanwhile, the 15 to 24 years age bracket for the primary householder has the lowest median household income of $0, with 250 households (2.6%) in this group.

| Income Bracket | # Households | Median Income |
| 15 to 24 Years | 250 (2.6%) | $0 |
| 25 to 44 Years | 3,015 (31.1%) | $55,451 |
| 45 to 64 Years | 4,006 (41.3%) | $50,668 |
| 65+ Years | 2,425 (25.0%) | $34,909 |
| Total | 9,696 (100.0%) | $44,968 |
Poverty in Scott County
Income Below Poverty by Sex and Age in Scott County
With 18.4% poverty level for males and 25.3% for females among the residents of Scott County, 12 to 14 year old males and 18 to 24 year old females are the most vulnerable to poverty, with 327 males (40.5%) and 550 females (47.0%) in their respective age groups living below the poverty level.

| Age Bracket | Male | Female |
| Under 5 Years | 351 (29.1%) | 302 (27.6%) |
| 5 Years | 82 (32.0%) | 0 (0.0%) |
| 6 to 11 Years | 255 (23.7%) | 289 (33.5%) |
| 12 to 14 Years | 327 (40.5%) | 293 (35.7%) |
| 15 Years | 5 (5.3%) | 11 (4.9%) |
| 16 and 17 Years | 188 (32.6%) | 115 (25.2%) |
| 18 to 24 Years | 340 (25.5%) | 550 (47.0%) |
| 25 to 34 Years | 158 (10.3%) | 486 (28.7%) |
| 35 to 44 Years | 276 (16.5%) | 513 (31.0%) |
| 45 to 54 Years | 130 (8.5%) | 242 (14.4%) |
| 55 to 64 Years | 175 (10.5%) | 418 (23.3%) |
| 65 to 74 Years | 184 (17.3%) | 173 (12.4%) |
| 75 Years and over | 55 (6.0%) | 112 (11.7%) |
| Total | 2,526 (18.4%) | 3,504 (25.3%) |
Income Above Poverty by Sex and Age in Scott County
According to the poverty statistics in Scott County, males aged 15 years and females aged 5 years are the age groups that are most secure financially, with 94.7% of males and 100.0% of females in these age groups living above the poverty line.

| Age Bracket | Male | Female |
| Under 5 Years | 854 (70.9%) | 792 (72.4%) |
| 5 Years | 174 (68.0%) | 37 (100.0%) |
| 6 to 11 Years | 822 (76.3%) | 573 (66.5%) |
| 12 to 14 Years | 481 (59.5%) | 528 (64.3%) |
| 15 Years | 90 (94.7%) | 212 (95.1%) |
| 16 and 17 Years | 389 (67.4%) | 341 (74.8%) |
| 18 to 24 Years | 994 (74.5%) | 620 (53.0%) |
| 25 to 34 Years | 1,378 (89.7%) | 1,207 (71.3%) |
| 35 to 44 Years | 1,397 (83.5%) | 1,139 (69.0%) |
| 45 to 54 Years | 1,395 (91.5%) | 1,441 (85.6%) |
| 55 to 64 Years | 1,496 (89.5%) | 1,379 (76.7%) |
| 65 to 74 Years | 877 (82.7%) | 1,220 (87.6%) |
| 75 Years and over | 868 (94.0%) | 846 (88.3%) |
| Total | 11,215 (81.6%) | 10,335 (74.7%) |
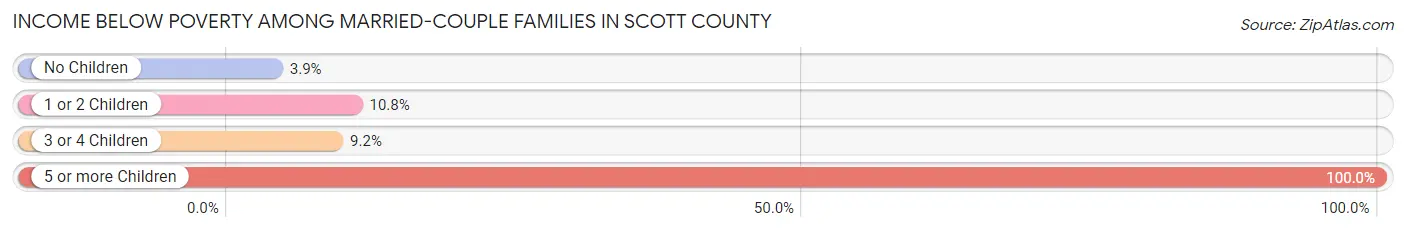
Income Below Poverty Among Married-Couple Families in Scott County
The poverty statistics for married-couple families in Scott County show that 6.8% or 309 of the total 4,558 families live below the poverty line. Families with 5 or more children have the highest poverty rate of 100.0%, comprising of 5 families. On the other hand, families with no children have the lowest poverty rate of 3.9%, which includes 104 families.
| Children | Above Poverty | Below Poverty |
| No Children | 2,560 (96.1%) | 104 (3.9%) |
| 1 or 2 Children | 1,431 (89.2%) | 174 (10.8%) |
| 3 or 4 Children | 258 (90.8%) | 26 (9.1%) |
| 5 or more Children | 0 (0.0%) | 5 (100.0%) |
| Total | 4,249 (93.2%) | 309 (6.8%) |
Income Below Poverty Among Single-Parent Households in Scott County
According to the poverty data in Scott County, 18.8% or 160 single-father households and 47.9% or 794 single-mother households are living below the poverty line. Among single-father households, those with 5 or more children have the highest poverty rate, with 4 households (100.0%) experiencing poverty. Likewise, among single-mother households, those with 3 or 4 children have the highest poverty rate, with 202 households (87.8%) falling below the poverty line.

| Children | Single Father | Single Mother |
| No Children | 31 (20.1%) | 69 (15.0%) |
| 1 or 2 Children | 104 (16.6%) | 523 (53.9%) |
| 3 or 4 Children | 21 (31.3%) | 202 (87.8%) |
| 5 or more Children | 4 (100.0%) | 0 (0.0%) |
| Total | 160 (18.8%) | 794 (47.9%) |
Income Below Poverty Among Married-Couple vs Single-Parent Households in Scott County
The poverty data for Scott County shows that 309 of the married-couple family households (6.8%) and 954 of the single-parent households (38.0%) are living below the poverty level. Within the married-couple family households, those with 5 or more children have the highest poverty rate, with 5 households (100.0%) falling below the poverty line. Among the single-parent households, those with 5 or more children have the highest poverty rate, with 4 household (100.0%) living below poverty.

| Children | Married-Couple Families | Single-Parent Households |
| No Children | 104 (3.9%) | 100 (16.3%) |
| 1 or 2 Children | 174 (10.8%) | 627 (39.3%) |
| 3 or 4 Children | 26 (9.1%) | 223 (75.1%) |
| 5 or more Children | 5 (100.0%) | 4 (100.0%) |
| Total | 309 (6.8%) | 954 (38.0%) |
Employment Characteristics in Scott County
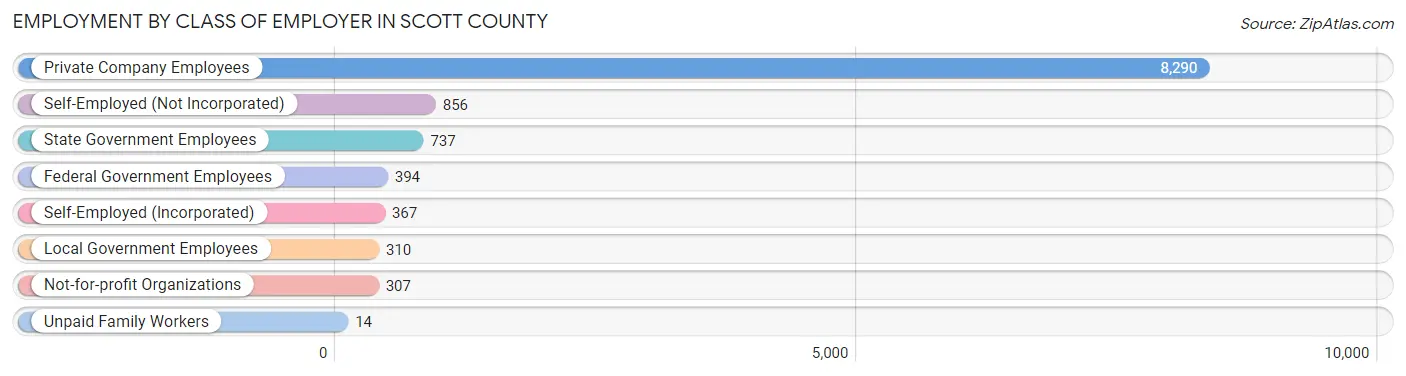
Employment by Class of Employer in Scott County
Among the 11,275 employed individuals in Scott County, private company employees (8,290 | 73.5%), self-employed (not incorporated) (856 | 7.6%), and state government employees (737 | 6.5%) make up the most common classes of employment.
| Employer Class | # Employees | % Employees |
| Private Company Employees | 8,290 | 73.5% |
| Self-Employed (Incorporated) | 367 | 3.3% |
| Self-Employed (Not Incorporated) | 856 | 7.6% |
| Not-for-profit Organizations | 307 | 2.7% |
| Local Government Employees | 310 | 2.8% |
| State Government Employees | 737 | 6.5% |
| Federal Government Employees | 394 | 3.5% |
| Unpaid Family Workers | 14 | 0.1% |
| Total | 11,275 | 100.0% |
Employment Status by Age in Scott County
According to the labor force statistics for Scott County, out of the total population over 16 years of age (21,373), 56.5% or 12,076 individuals are in the labor force, with 6.0% or 725 of them unemployed. The age group with the highest labor force participation rate is 30 to 34 years, with 87.5% or 1,514 individuals in the labor force. Within the labor force, the 25 to 29 years age range has the highest percentage of unemployed individuals, with 28.6% or 381 of them being unemployed.

| Age Bracket | In Labor Force | Unemployed |
| 16 to 19 Years | 852 (41.7%) | 94 (11.0%) |
| 20 to 24 Years | 937 (61.9%) | 57 (6.1%) |
| 25 to 29 Years | 1,331 (87.4%) | 381 (28.6%) |
| 30 to 34 Years | 1,514 (87.5%) | 62 (4.1%) |
| 35 to 44 Years | 2,319 (69.5%) | 44 (1.9%) |
| 45 to 54 Years | 2,459 (76.0%) | 49 (2.0%) |
| 55 to 59 Years | 1,003 (59.5%) | 0 (0.0%) |
| 60 to 64 Years | 916 (50.8%) | 11 (1.2%) |
| 65 to 74 Years | 627 (25.1%) | 28 (4.5%) |
| 75 Years and over | 122 (6.1%) | 0 (0.0%) |
| Total | 12,076 (56.5%) | 725 (6.0%) |
Employment Status by Educational Attainment in Scott County
According to labor force statistics for Scott County, 71.6% of individuals (9,533) out of the total population between 25 and 64 years of age (13,314) are in the labor force, with 5.8% or 553 of them being unemployed. The group with the highest labor force participation rate are those with the educational attainment of bachelor's degree or higher, with 84.7% or 1,248 individuals in the labor force. Within the labor force, individuals with less than high school education have the highest percentage of unemployment, with 12.3% or 167 of them being unemployed.
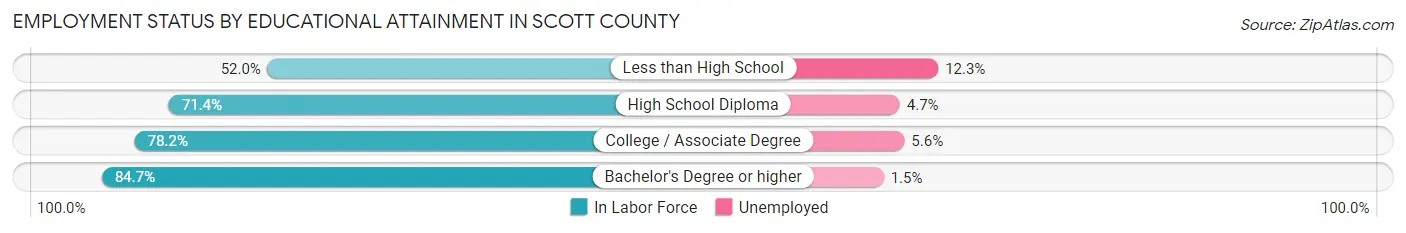
| Educational Attainment | In Labor Force | Unemployed |
| Less than High School | 1,355 (52.0%) | 321 (12.3%) |
| High School Diploma | 2,987 (71.4%) | 197 (4.7%) |
| College / Associate Degree | 3,949 (78.2%) | 283 (5.6%) |
| Bachelor's Degree or higher | 1,248 (84.7%) | 22 (1.5%) |
| Total | 9,533 (71.6%) | 772 (5.8%) |
Employment Occupations by Sex in Scott County
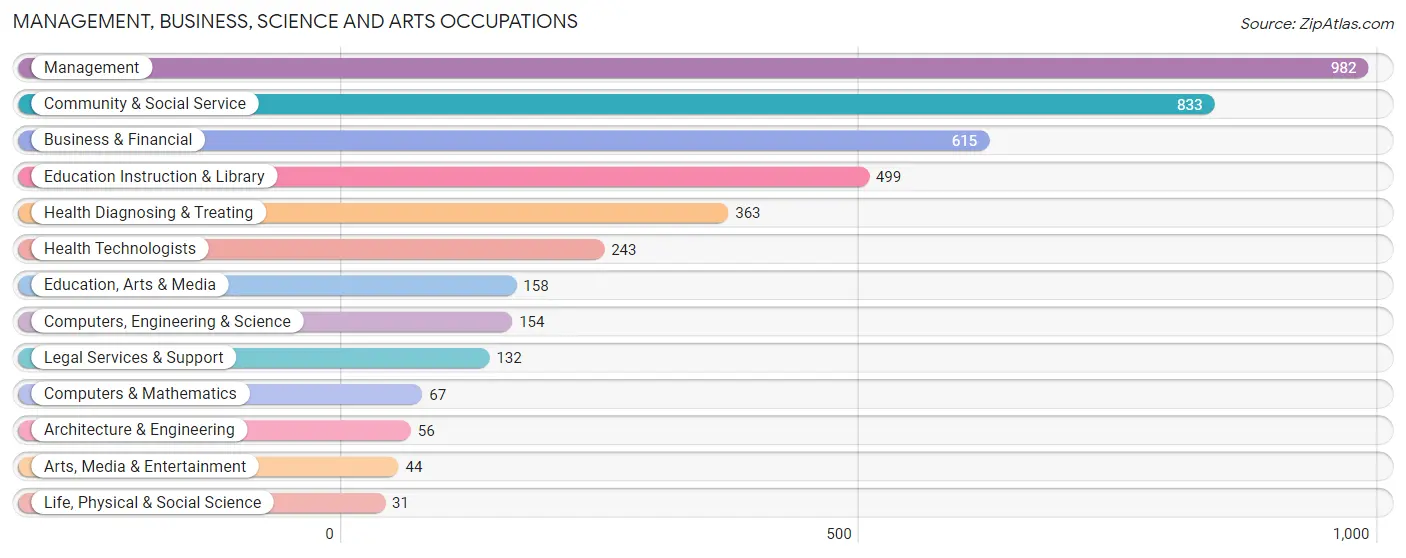
Management, Business, Science and Arts Occupations
The most common Management, Business, Science and Arts occupations in Scott County are Management (982 | 8.7%), Community & Social Service (833 | 7.3%), Business & Financial (615 | 5.4%), Education Instruction & Library (499 | 4.4%), and Health Diagnosing & Treating (363 | 3.2%).
Management, Business, Science and Arts Occupations by Sex
Within the Management, Business, Science and Arts occupations in Scott County, the most male-oriented occupations are Life, Physical & Social Science (100.0%), Architecture & Engineering (85.7%), and Arts, Media & Entertainment (75.0%), while the most female-oriented occupations are Health Diagnosing & Treating (95.0%), Health Technologists (92.6%), and Education, Arts & Media (89.2%).

| Occupation | Male | Female |
| Management | 687 (70.0%) | 295 (30.0%) |
| Business & Financial | 189 (30.7%) | 426 (69.3%) |
| Computers, Engineering & Science | 111 (72.1%) | 43 (27.9%) |
| Computers & Mathematics | 32 (47.8%) | 35 (52.2%) |
| Architecture & Engineering | 48 (85.7%) | 8 (14.3%) |
| Life, Physical & Social Science | 31 (100.0%) | 0 (0.0%) |
| Community & Social Service | 206 (24.7%) | 627 (75.3%) |
| Education, Arts & Media | 17 (10.8%) | 141 (89.2%) |
| Legal Services & Support | 89 (67.4%) | 43 (32.6%) |
| Education Instruction & Library | 67 (13.4%) | 432 (86.6%) |
| Arts, Media & Entertainment | 33 (75.0%) | 11 (25.0%) |
| Health Diagnosing & Treating | 18 (5.0%) | 345 (95.0%) |
| Health Technologists | 18 (7.4%) | 225 (92.6%) |
| Total (Category) | 1,211 (41.1%) | 1,736 (58.9%) |
| Total (Overall) | 6,231 (54.9%) | 5,110 (45.1%) |
Services Occupations
The most common Services occupations in Scott County are Cleaning & Maintenance (530 | 4.7%), Food Preparation & Serving (424 | 3.7%), Personal Care & Service (400 | 3.5%), Healthcare Support (217 | 1.9%), and Security & Protection (75 | 0.7%).

Services Occupations by Sex
Within the Services occupations in Scott County, the most male-oriented occupations are Law Enforcement (100.0%), Security & Protection (92.0%), and Firefighting & Prevention (68.4%), while the most female-oriented occupations are Healthcare Support (100.0%), Personal Care & Service (91.5%), and Food Preparation & Serving (43.2%).

| Occupation | Male | Female |
| Healthcare Support | 0 (0.0%) | 217 (100.0%) |
| Security & Protection | 69 (92.0%) | 6 (8.0%) |
| Firefighting & Prevention | 13 (68.4%) | 6 (31.6%) |
| Law Enforcement | 56 (100.0%) | 0 (0.0%) |
| Food Preparation & Serving | 241 (56.8%) | 183 (43.2%) |
| Cleaning & Maintenance | 318 (60.0%) | 212 (40.0%) |
| Personal Care & Service | 34 (8.5%) | 366 (91.5%) |
| Total (Category) | 662 (40.2%) | 984 (59.8%) |
| Total (Overall) | 6,231 (54.9%) | 5,110 (45.1%) |
Sales and Office Occupations
The most common Sales and Office occupations in Scott County are Sales & Related (1,161 | 10.2%), and Office & Administration (1,082 | 9.5%).

Sales and Office Occupations by Sex

| Occupation | Male | Female |
| Sales & Related | 298 (25.7%) | 863 (74.3%) |
| Office & Administration | 228 (21.1%) | 854 (78.9%) |
| Total (Category) | 526 (23.4%) | 1,717 (76.5%) |
| Total (Overall) | 6,231 (54.9%) | 5,110 (45.1%) |
Natural Resources, Construction and Maintenance Occupations
The most common Natural Resources, Construction and Maintenance occupations in Scott County are Construction & Extraction (762 | 6.7%), Installation, Maintenance & Repair (726 | 6.4%), and Farming, Fishing & Forestry (106 | 0.9%).

Natural Resources, Construction and Maintenance Occupations by Sex
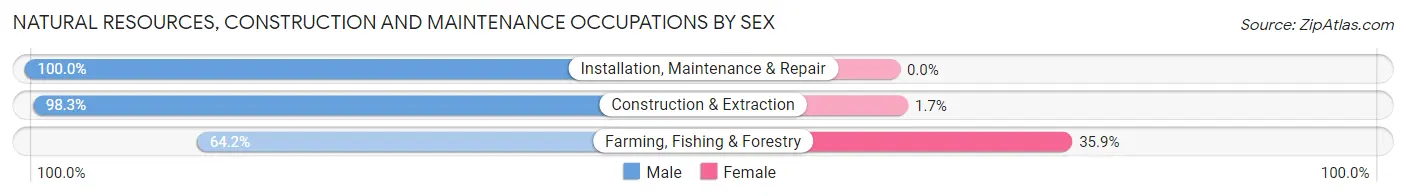
| Occupation | Male | Female |
| Farming, Fishing & Forestry | 68 (64.1%) | 38 (35.8%) |
| Construction & Extraction | 749 (98.3%) | 13 (1.7%) |
| Installation, Maintenance & Repair | 726 (100.0%) | 0 (0.0%) |
| Total (Category) | 1,543 (96.8%) | 51 (3.2%) |
| Total (Overall) | 6,231 (54.9%) | 5,110 (45.1%) |
Production, Transportation and Moving Occupations
The most common Production, Transportation and Moving occupations in Scott County are Production (1,648 | 14.5%), Material Moving (848 | 7.5%), and Transportation (415 | 3.7%).

Production, Transportation and Moving Occupations by Sex
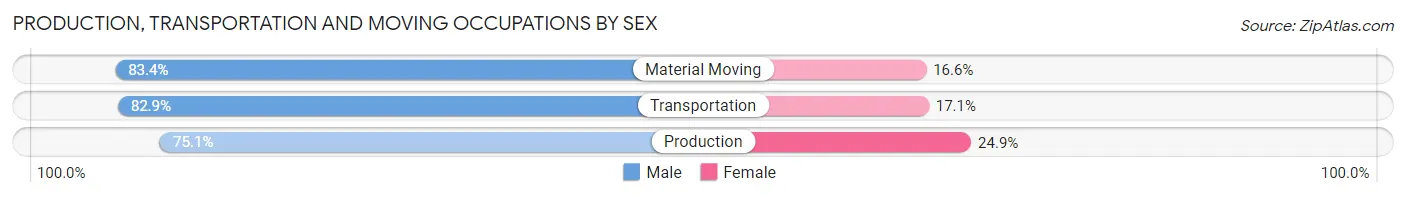
| Occupation | Male | Female |
| Production | 1,238 (75.1%) | 410 (24.9%) |
| Transportation | 344 (82.9%) | 71 (17.1%) |
| Material Moving | 707 (83.4%) | 141 (16.6%) |
| Total (Category) | 2,289 (78.6%) | 622 (21.4%) |
| Total (Overall) | 6,231 (54.9%) | 5,110 (45.1%) |
Employment Industries by Sex in Scott County
Employment Industries in Scott County
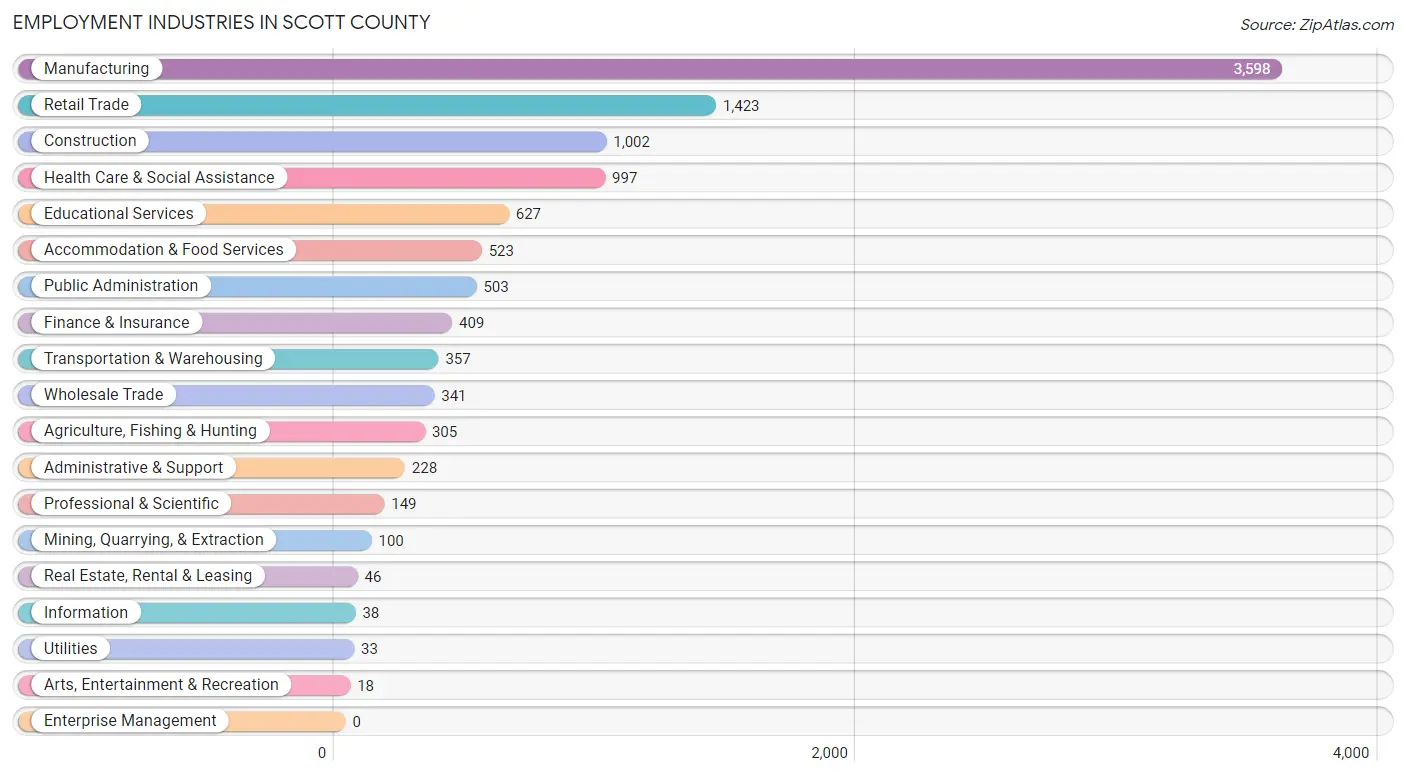
The major employment industries in Scott County include Manufacturing (3,598 | 31.7%), Retail Trade (1,423 | 12.6%), Construction (1,002 | 8.8%), Health Care & Social Assistance (997 | 8.8%), and Educational Services (627 | 5.5%).
Employment Industries by Sex in Scott County
The Scott County industries that see more men than women are Mining, Quarrying, & Extraction (100.0%), Utilities (100.0%), and Agriculture, Fishing & Hunting (97.4%), whereas the industries that tend to have a higher number of women are Arts, Entertainment & Recreation (100.0%), Finance & Insurance (97.1%), and Health Care & Social Assistance (93.6%).

| Industry | Male | Female |
| Agriculture, Fishing & Hunting | 297 (97.4%) | 8 (2.6%) |
| Mining, Quarrying, & Extraction | 100 (100.0%) | 0 (0.0%) |
| Construction | 930 (92.8%) | 72 (7.2%) |
| Manufacturing | 2,541 (70.6%) | 1,057 (29.4%) |
| Wholesale Trade | 247 (72.4%) | 94 (27.6%) |
| Retail Trade | 615 (43.2%) | 808 (56.8%) |
| Transportation & Warehousing | 231 (64.7%) | 126 (35.3%) |
| Utilities | 33 (100.0%) | 0 (0.0%) |
| Information | 7 (18.4%) | 31 (81.6%) |
| Finance & Insurance | 12 (2.9%) | 397 (97.1%) |
| Real Estate, Rental & Leasing | 28 (60.9%) | 18 (39.1%) |
| Professional & Scientific | 70 (47.0%) | 79 (53.0%) |
| Enterprise Management | 0 (0.0%) | 0 (0.0%) |
| Administrative & Support | 116 (50.9%) | 112 (49.1%) |
| Educational Services | 139 (22.2%) | 488 (77.8%) |
| Health Care & Social Assistance | 64 (6.4%) | 933 (93.6%) |
| Arts, Entertainment & Recreation | 0 (0.0%) | 18 (100.0%) |
| Accommodation & Food Services | 223 (42.6%) | 300 (57.4%) |
| Public Administration | 296 (58.9%) | 207 (41.1%) |
| Total | 6,231 (54.9%) | 5,110 (45.1%) |
Education in Scott County
School Enrollment in Scott County
The most common levels of schooling among the 6,288 students in Scott County are middle school (1,657 | 26.4%), high school (1,632 | 26.0%), and elementary school (1,148 | 18.3%).

| School Level | # Students | % Students |
| Nursery / Preschool | 347 | 5.5% |
| Kindergarten | 362 | 5.8% |
| Elementary School | 1,148 | 18.3% |
| Middle School | 1,657 | 26.4% |
| High School | 1,632 | 26.0% |
| College / Undergraduate | 1,083 | 17.2% |
| Graduate / Professional | 59 | 0.9% |
| Total | 6,288 | 100.0% |
School Enrollment by Age by Funding Source in Scott County
Out of a total of 6,288 students who are enrolled in schools in Scott County, 924 (14.7%) attend a private institution, while the remaining 5,364 (85.3%) are enrolled in public schools. The age group of 35 years and over has the highest likelihood of being enrolled in private schools, with 145 (52.3% in the age bracket) enrolled. Conversely, the age group of 18 to 19 year olds has the lowest likelihood of being enrolled in a private school, with 431 (93.1% in the age bracket) attending a public institution.

| Age Bracket | Public School | Private School |
| 3 to 4 Year Olds | 260 (74.5%) | 89 (25.5%) |
| 5 to 9 Year Old | 1,047 (88.8%) | 132 (11.2%) |
| 10 to 14 Year Olds | 2,101 (87.8%) | 292 (12.2%) |
| 15 to 17 Year Olds | 917 (87.0%) | 137 (13.0%) |
| 18 to 19 Year Olds | 431 (93.1%) | 32 (6.9%) |
| 20 to 24 Year Olds | 280 (77.6%) | 81 (22.4%) |
| 25 to 34 Year Olds | 196 (92.4%) | 16 (7.5%) |
| 35 Years and over | 132 (47.6%) | 145 (52.3%) |
| Total | 5,364 (85.3%) | 924 (14.7%) |
Educational Attainment by Field of Study in Scott County
Education (603 | 28.7%), business (462 | 22.0%), science & technology (250 | 11.9%), arts & humanities (176 | 8.4%), and engineering (91 | 4.3%) are the most common fields of study among 2,100 individuals in Scott County who have obtained a bachelor's degree or higher.
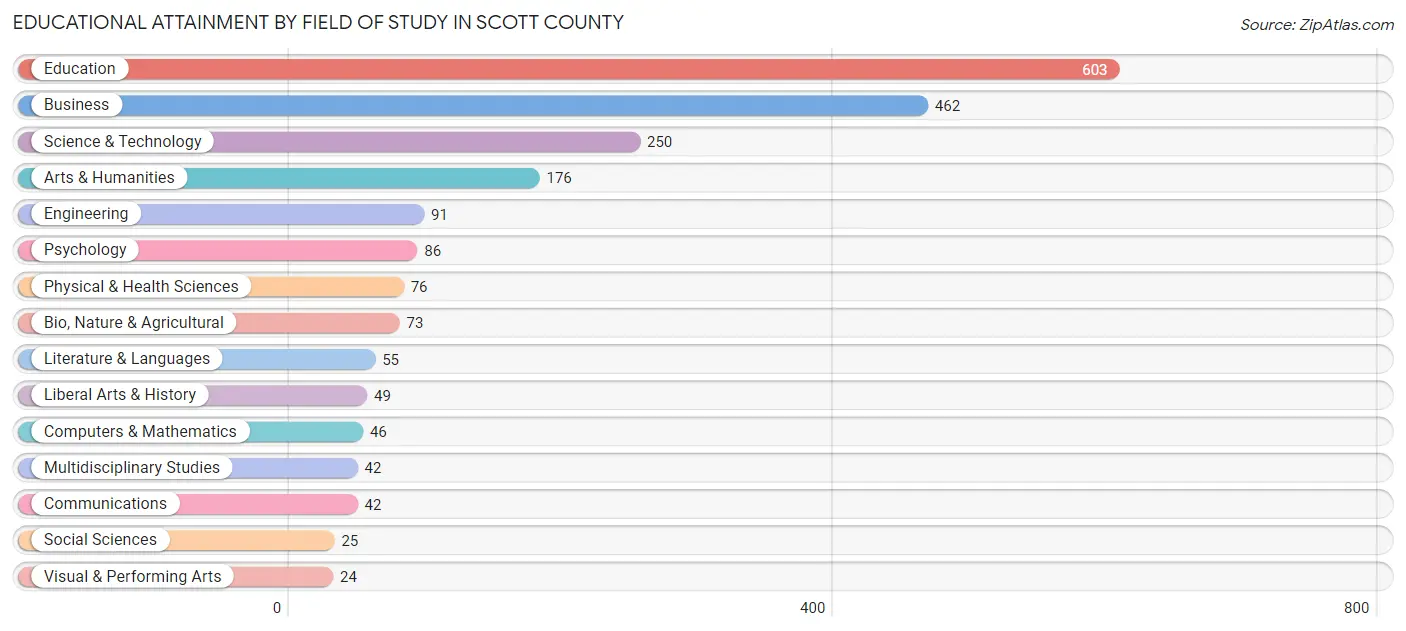
| Field of Study | # Graduates | % Graduates |
| Computers & Mathematics | 46 | 2.2% |
| Bio, Nature & Agricultural | 73 | 3.5% |
| Physical & Health Sciences | 76 | 3.6% |
| Psychology | 86 | 4.1% |
| Social Sciences | 25 | 1.2% |
| Engineering | 91 | 4.3% |
| Multidisciplinary Studies | 42 | 2.0% |
| Science & Technology | 250 | 11.9% |
| Business | 462 | 22.0% |
| Education | 603 | 28.7% |
| Literature & Languages | 55 | 2.6% |
| Liberal Arts & History | 49 | 2.3% |
| Visual & Performing Arts | 24 | 1.1% |
| Communications | 42 | 2.0% |
| Arts & Humanities | 176 | 8.4% |
| Total | 2,100 | 100.0% |
Transportation & Commute in Scott County
Vehicle Availability by Sex in Scott County
The most prevalent vehicle ownership categories in Scott County are males with 2 vehicles (2,502, accounting for 40.3%) and females with 2 vehicles (1,915, making up 49.3%).

| Vehicles Available | Male | Female |
| No Vehicle | 338 (5.4%) | 43 (0.9%) |
| 1 Vehicle | 787 (12.7%) | 1,087 (21.4%) |
| 2 Vehicles | 2,502 (40.3%) | 1,915 (37.8%) |
| 3 Vehicles | 1,662 (26.8%) | 1,284 (25.3%) |
| 4 Vehicles | 614 (9.9%) | 558 (11.0%) |
| 5 or more Vehicles | 302 (4.9%) | 183 (3.6%) |
| Total | 6,205 (100.0%) | 5,070 (100.0%) |
Commute Time in Scott County
The most frequently occuring commute durations in Scott County are 20 to 24 minutes (1,529 commuters, 14.0%), 30 to 34 minutes (1,493 commuters, 13.7%), and 10 to 14 minutes (1,395 commuters, 12.8%).

| Commute Time | # Commuters | % Commuters |
| Less than 5 Minutes | 623 | 5.7% |
| 5 to 9 Minutes | 994 | 9.1% |
| 10 to 14 Minutes | 1,395 | 12.8% |
| 15 to 19 Minutes | 1,387 | 12.7% |
| 20 to 24 Minutes | 1,529 | 14.0% |
| 25 to 29 Minutes | 816 | 7.5% |
| 30 to 34 Minutes | 1,493 | 13.7% |
| 35 to 39 Minutes | 424 | 3.9% |
| 40 to 44 Minutes | 401 | 3.7% |
| 45 to 59 Minutes | 1,093 | 10.0% |
| 60 to 89 Minutes | 633 | 5.8% |
| 90 or more Minutes | 105 | 1.0% |
Commute Time by Sex in Scott County
The most common commute times in Scott County are 10 to 14 minutes (985 commuters, 16.3%) for males and 20 to 24 minutes (1,066 commuters, 22.0%) for females.

| Commute Time | Male | Female |
| Less than 5 Minutes | 463 (7.7%) | 160 (3.3%) |
| 5 to 9 Minutes | 623 (10.3%) | 371 (7.6%) |
| 10 to 14 Minutes | 985 (16.3%) | 410 (8.5%) |
| 15 to 19 Minutes | 630 (10.4%) | 757 (15.6%) |
| 20 to 24 Minutes | 463 (7.7%) | 1,066 (22.0%) |
| 25 to 29 Minutes | 516 (8.5%) | 300 (6.2%) |
| 30 to 34 Minutes | 780 (12.9%) | 713 (14.7%) |
| 35 to 39 Minutes | 189 (3.1%) | 235 (4.9%) |
| 40 to 44 Minutes | 203 (3.4%) | 198 (4.1%) |
| 45 to 59 Minutes | 735 (12.2%) | 358 (7.4%) |
| 60 to 89 Minutes | 351 (5.8%) | 282 (5.8%) |
| 90 or more Minutes | 105 (1.7%) | 0 (0.0%) |
Time of Departure to Work by Sex in Scott County
The most frequent times of departure to work in Scott County are 6:00 AM to 6:29 AM (1,475, 24.4%) for males and 7:00 AM to 7:29 AM (944, 19.5%) for females.

| Time of Departure | Male | Female |
| 12:00 AM to 4:59 AM | 662 (11.0%) | 94 (1.9%) |
| 5:00 AM to 5:29 AM | 204 (3.4%) | 133 (2.7%) |
| 5:30 AM to 5:59 AM | 240 (4.0%) | 178 (3.7%) |
| 6:00 AM to 6:29 AM | 1,475 (24.4%) | 501 (10.3%) |
| 6:30 AM to 6:59 AM | 581 (9.6%) | 566 (11.7%) |
| 7:00 AM to 7:29 AM | 803 (13.3%) | 944 (19.5%) |
| 7:30 AM to 7:59 AM | 489 (8.1%) | 495 (10.2%) |
| 8:00 AM to 8:29 AM | 136 (2.2%) | 374 (7.7%) |
| 8:30 AM to 8:59 AM | 66 (1.1%) | 107 (2.2%) |
| 9:00 AM to 9:59 AM | 109 (1.8%) | 276 (5.7%) |
| 10:00 AM to 10:59 AM | 69 (1.1%) | 117 (2.4%) |
| 11:00 AM to 11:59 AM | 13 (0.2%) | 0 (0.0%) |
| 12:00 PM to 3:59 PM | 456 (7.5%) | 602 (12.4%) |
| 4:00 PM to 11:59 PM | 740 (12.2%) | 463 (9.6%) |
| Total | 6,043 (100.0%) | 4,850 (100.0%) |
Housing Occupancy in Scott County
Occupancy by Ownership in Scott County
Of the total 9,696 dwellings in Scott County, owner-occupied units account for 7,114 (73.4%), while renter-occupied units make up 2,582 (26.6%).

| Occupancy | # Housing Units | % Housing Units |
| Owner Occupied Housing Units | 7,114 | 73.4% |
| Renter-Occupied Housing Units | 2,582 | 26.6% |
| Total Occupied Housing Units | 9,696 | 100.0% |
Occupancy by Household Size in Scott County

| Household Size | # Housing Units | % Housing Units |
| 1-Person Household | 2,330 | 24.0% |
| 2-Person Household | 3,460 | 35.7% |
| 3-Person Household | 1,394 | 14.4% |
| 4+ Person Household | 2,512 | 25.9% |
| Total Housing Units | 9,696 | 100.0% |
Occupancy by Ownership by Household Size in Scott County

| Household Size | Owner-occupied | Renter-occupied |
| 1-Person Household | 1,477 (63.4%) | 853 (36.6%) |
| 2-Person Household | 2,854 (82.5%) | 606 (17.5%) |
| 3-Person Household | 1,024 (73.5%) | 370 (26.5%) |
| 4+ Person Household | 1,759 (70.0%) | 753 (30.0%) |
| Total Housing Units | 7,114 (73.4%) | 2,582 (26.6%) |
Occupancy by Educational Attainment in Scott County
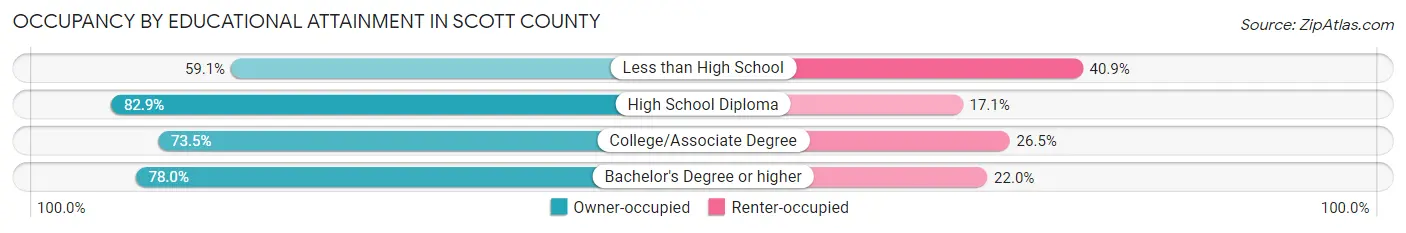
| Household Size | Owner-occupied | Renter-occupied |
| Less than High School | 1,385 (59.1%) | 959 (40.9%) |
| High School Diploma | 2,376 (82.9%) | 491 (17.1%) |
| College/Associate Degree | 2,389 (73.5%) | 860 (26.5%) |
| Bachelor's Degree or higher | 964 (78.0%) | 272 (22.0%) |
Occupancy by Age of Householder in Scott County

| Age Bracket | # Households | % Households |
| Under 35 Years | 1,545 | 15.9% |
| 35 to 44 Years | 1,720 | 17.7% |
| 45 to 54 Years | 2,020 | 20.8% |
| 55 to 64 Years | 1,986 | 20.5% |
| 65 to 74 Years | 1,414 | 14.6% |
| 75 to 84 Years | 857 | 8.8% |
| 85 Years and Over | 154 | 1.6% |
| Total | 9,696 | 100.0% |
Housing Finances in Scott County
Median Income by Occupancy in Scott County

| Occupancy Type | # Households | Median Income |
| Owner-Occupied | 7,114 (73.4%) | $54,065 |
| Renter-Occupied | 2,582 (26.6%) | $28,984 |
| Average | 9,696 (100.0%) | $44,968 |
Occupancy by Householder Income Bracket in Scott County

| Income Bracket | Owner-occupied | Renter-occupied |
| Less than $5,000 | 221 (3.1%) | 287 (11.1%) |
| $5,000 to $9,999 | 152 (2.1%) | 37 (1.4%) |
| $10,000 to $14,999 | 380 (5.3%) | 363 (14.1%) |
| $15,000 to $19,999 | 304 (4.3%) | 164 (6.4%) |
| $20,000 to $24,999 | 865 (12.2%) | 295 (11.4%) |
| $25,000 to $34,999 | 840 (11.8%) | 272 (10.5%) |
| $35,000 to $49,999 | 615 (8.6%) | 415 (16.1%) |
| $50,000 to $74,999 | 1,197 (16.8%) | 430 (16.7%) |
| $75,000 to $99,999 | 1,041 (14.6%) | 73 (2.8%) |
| $100,000 to $149,999 | 1,031 (14.5%) | 173 (6.7%) |
| $150,000 or more | 468 (6.6%) | 73 (2.8%) |
| Total | 7,114 (100.0%) | 2,582 (100.0%) |
Monthly Housing Cost Tiers in Scott County

| Monthly Cost | Owner-occupied | Renter-occupied |
| Less than $300 | 1,568 (22.0%) | 208 (8.1%) |
| $300 to $499 | 1,870 (26.3%) | 282 (10.9%) |
| $500 to $799 | 1,281 (18.0%) | 618 (23.9%) |
| $800 to $999 | 700 (9.8%) | 344 (13.3%) |
| $1,000 to $1,499 | 1,151 (16.2%) | 483 (18.7%) |
| $1,500 to $1,999 | 306 (4.3%) | 88 (3.4%) |
| $2,000 to $2,499 | 101 (1.4%) | 0 (0.0%) |
| $2,500 to $2,999 | 57 (0.8%) | 0 (0.0%) |
| $3,000 or more | 80 (1.1%) | 5 (0.2%) |
| Total | 7,114 (100.0%) | 2,582 (100.0%) |
Physical Housing Characteristics in Scott County
Housing Structures in Scott County

| Structure Type | # Housing Units | % Housing Units |
| Single Unit, Detached | 6,146 | 63.4% |
| Single Unit, Attached | 7 | 0.1% |
| 2 Unit Apartments | 72 | 0.7% |
| 3 or 4 Unit Apartments | 274 | 2.8% |
| 5 to 9 Unit Apartments | 228 | 2.4% |
| 10 or more Apartments | 73 | 0.7% |
| Mobile Home / Other | 2,896 | 29.9% |
| Total | 9,696 | 100.0% |
Housing Structures by Occupancy in Scott County

| Structure Type | Owner-occupied | Renter-occupied |
| Single Unit, Detached | 4,874 (79.3%) | 1,272 (20.7%) |
| Single Unit, Attached | 7 (100.0%) | 0 (0.0%) |
| 2 Unit Apartments | 0 (0.0%) | 72 (100.0%) |
| 3 or 4 Unit Apartments | 5 (1.8%) | 269 (98.2%) |
| 5 to 9 Unit Apartments | 0 (0.0%) | 228 (100.0%) |
| 10 or more Apartments | 0 (0.0%) | 73 (100.0%) |
| Mobile Home / Other | 2,228 (76.9%) | 668 (23.1%) |
| Total | 7,114 (73.4%) | 2,582 (26.6%) |
Housing Structures by Number of Rooms in Scott County

| Number of Rooms | Owner-occupied | Renter-occupied |
| 1 Room | 9 (0.1%) | 15 (0.6%) |
| 2 or 3 Rooms | 149 (2.1%) | 129 (5.0%) |
| 4 or 5 Rooms | 2,402 (33.8%) | 1,480 (57.3%) |
| 6 or 7 Rooms | 2,978 (41.9%) | 714 (27.7%) |
| 8 or more Rooms | 1,576 (22.2%) | 244 (9.5%) |
| Total | 7,114 (100.0%) | 2,582 (100.0%) |
Housing Structure by Heating Type in Scott County
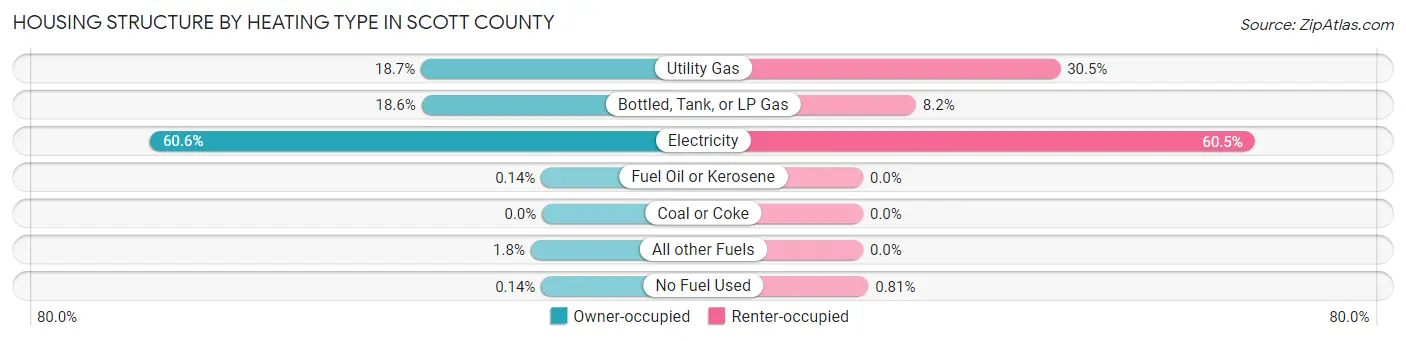
| Heating Type | Owner-occupied | Renter-occupied |
| Utility Gas | 1,331 (18.7%) | 787 (30.5%) |
| Bottled, Tank, or LP Gas | 1,326 (18.6%) | 211 (8.2%) |
| Electricity | 4,312 (60.6%) | 1,563 (60.5%) |
| Fuel Oil or Kerosene | 10 (0.1%) | 0 (0.0%) |
| Coal or Coke | 0 (0.0%) | 0 (0.0%) |
| All other Fuels | 125 (1.8%) | 0 (0.0%) |
| No Fuel Used | 10 (0.1%) | 21 (0.8%) |
| Total | 7,114 (100.0%) | 2,582 (100.0%) |
Household Vehicle Usage in Scott County

| Vehicles per Household | Owner-occupied | Renter-occupied |
| No Vehicle | 347 (4.9%) | 438 (17.0%) |
| 1 Vehicle | 1,732 (24.3%) | 1,321 (51.2%) |
| 2 Vehicles | 2,736 (38.5%) | 516 (20.0%) |
| 3 or more Vehicles | 2,299 (32.3%) | 307 (11.9%) |
| Total | 7,114 (100.0%) | 2,582 (100.0%) |
Real Estate & Mortgages in Scott County
Real Estate and Mortgage Overview in Scott County
| Characteristic | Without Mortgage | With Mortgage |
| Housing Units | 4,230 | 2,884 |
| Median Property Value | $68,000 | $109,700 |
| Median Household Income | $45,156 | $289 |
| Monthly Housing Costs | $363 | $80 |
| Real Estate Taxes | $618 | $788 |
Property Value by Mortgage Status in Scott County

| Property Value | Without Mortgage | With Mortgage |
| Less than $50,000 | 1,604 (37.9%) | 630 (21.8%) |
| $50,000 to $99,999 | 1,117 (26.4%) | 739 (25.6%) |
| $100,000 to $299,999 | 1,329 (31.4%) | 1,162 (40.3%) |
| $300,000 to $499,999 | 41 (1.0%) | 256 (8.9%) |
| $500,000 to $749,999 | 30 (0.7%) | 97 (3.4%) |
| $750,000 to $999,999 | 80 (1.9%) | 0 (0.0%) |
| $1,000,000 or more | 29 (0.7%) | 0 (0.0%) |
| Total | 4,230 (100.0%) | 2,884 (100.0%) |
Household Income by Mortgage Status in Scott County
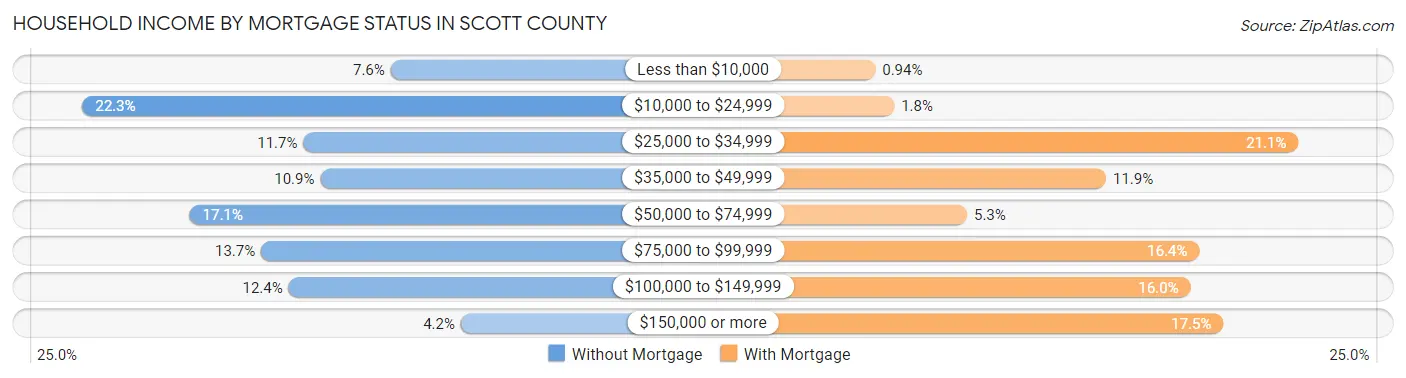
| Household Income | Without Mortgage | With Mortgage |
| Less than $10,000 | 320 (7.6%) | 27 (0.9%) |
| $10,000 to $24,999 | 941 (22.3%) | 53 (1.8%) |
| $25,000 to $34,999 | 496 (11.7%) | 608 (21.1%) |
| $35,000 to $49,999 | 462 (10.9%) | 344 (11.9%) |
| $50,000 to $74,999 | 725 (17.1%) | 153 (5.3%) |
| $75,000 to $99,999 | 581 (13.7%) | 472 (16.4%) |
| $100,000 to $149,999 | 526 (12.4%) | 460 (16.0%) |
| $150,000 or more | 179 (4.2%) | 505 (17.5%) |
| Total | 4,230 (100.0%) | 2,884 (100.0%) |
Property Value to Household Income Ratio in Scott County

| Value-to-Income Ratio | Without Mortgage | With Mortgage |
| Less than 2.0x | 2,509 (59.3%) | 68,627 (2,379.6%) |
| 2.0x to 2.9x | 524 (12.4%) | 1,571 (54.5%) |
| 3.0x to 3.9x | 325 (7.7%) | 526 (18.2%) |
| 4.0x or more | 739 (17.5%) | 284 (9.9%) |
| Total | 4,230 (100.0%) | 2,884 (100.0%) |
Real Estate Taxes by Mortgage Status in Scott County

| Property Taxes | Without Mortgage | With Mortgage |
| Less than $800 | 1,665 (39.4%) | 0 (0.0%) |
| $800 to $1,499 | 337 (8.0%) | 1,061 (36.8%) |
| $800 to $1,499 | 478 (11.3%) | 516 (17.9%) |
| Total | 4,230 (100.0%) | 2,884 (100.0%) |
Health & Disability in Scott County
Health Insurance Coverage by Age in Scott County
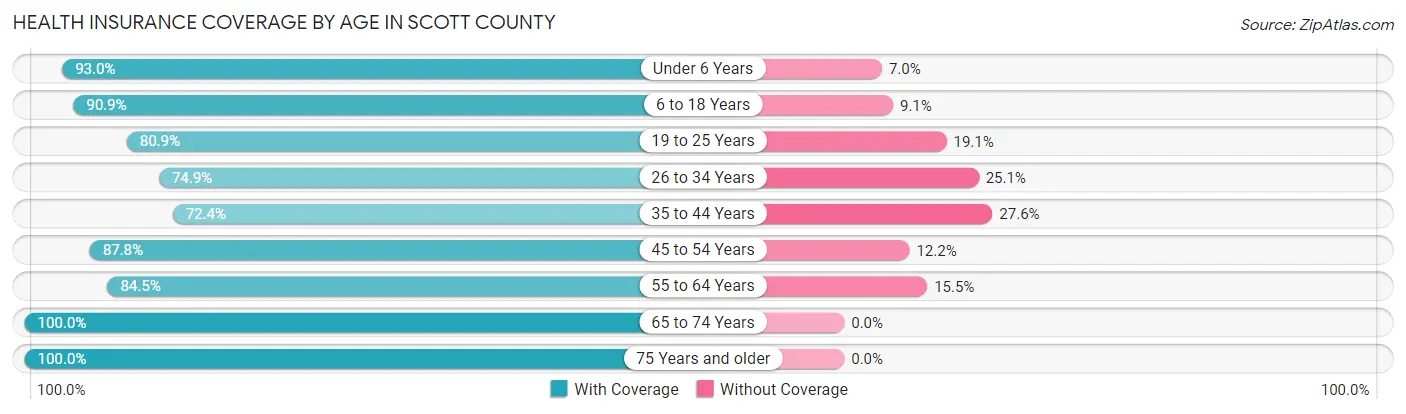
| Age Bracket | With Coverage | Without Coverage |
| Under 6 Years | 2,410 (93.0%) | 182 (7.0%) |
| 6 to 18 Years | 5,071 (90.9%) | 507 (9.1%) |
| 19 to 25 Years | 1,792 (80.9%) | 422 (19.1%) |
| 26 to 34 Years | 2,210 (74.9%) | 739 (25.1%) |
| 35 to 44 Years | 2,401 (72.4%) | 916 (27.6%) |
| 45 to 54 Years | 2,818 (87.8%) | 390 (12.2%) |
| 55 to 64 Years | 2,932 (84.5%) | 536 (15.5%) |
| 65 to 74 Years | 2,454 (100.0%) | 0 (0.0%) |
| 75 Years and older | 1,881 (100.0%) | 0 (0.0%) |
| Total | 23,969 (86.7%) | 3,692 (13.4%) |
Health Insurance Coverage by Citizenship Status in Scott County

| Citizenship Status | With Coverage | Without Coverage |
| Native Born | 2,410 (93.0%) | 182 (7.0%) |
| Foreign Born, Citizen | 5,071 (90.9%) | 507 (9.1%) |
| Foreign Born, not a Citizen | 1,792 (80.9%) | 422 (19.1%) |
Health Insurance Coverage by Household Income in Scott County

| Household Income | With Coverage | Without Coverage |
| Under $25,000 | 5,419 (82.1%) | 1,184 (17.9%) |
| $25,000 to $49,999 | 5,322 (83.7%) | 1,035 (16.3%) |
| $50,000 to $74,999 | 3,917 (85.6%) | 658 (14.4%) |
| $75,000 to $99,999 | 3,111 (94.2%) | 192 (5.8%) |
| $100,000 and over | 6,175 (90.8%) | 623 (9.2%) |
Public vs Private Health Insurance Coverage by Age in Scott County

| Age Bracket | Public Insurance | Private Insurance |
| Under 6 | 1,264 (48.8%) | 1,195 (46.1%) |
| 6 to 18 Years | 2,678 (48.0%) | 2,556 (45.8%) |
| 19 to 25 Years | 401 (18.1%) | 1,391 (62.8%) |
| 25 to 34 Years | 451 (15.3%) | 1,766 (59.9%) |
| 35 to 44 Years | 336 (10.1%) | 2,108 (63.5%) |
| 45 to 54 Years | 643 (20.0%) | 2,363 (73.7%) |
| 55 to 64 Years | 959 (27.7%) | 2,295 (66.2%) |
| 65 to 74 Years | 2,447 (99.7%) | 897 (36.5%) |
| 75 Years and over | 1,881 (100.0%) | 652 (34.7%) |
| Total | 11,060 (40.0%) | 15,223 (55.0%) |
Disability Status by Sex by Age in Scott County

| Age Bracket | Male | Female |
| Under 5 Years | 0 (0.0%) | 0 (0.0%) |
| 5 to 17 Years | 314 (11.1%) | 120 (4.9%) |
| 18 to 34 Years | 359 (12.5%) | 293 (10.2%) |
| 35 to 64 Years | 807 (16.6%) | 1,276 (24.9%) |
| 65 to 74 Years | 421 (39.7%) | 566 (40.6%) |
| 75 Years and over | 559 (60.6%) | 700 (73.1%) |
Disability Class by Sex by Age in Scott County
Disability Class: Hearing Difficulty

| Age Bracket | Male | Female |
| Under 5 Years | 0 (0.0%) | 0 (0.0%) |
| 5 to 17 Years | 0 (0.0%) | 4 (0.2%) |
| 18 to 34 Years | 0 (0.0%) | 131 (4.6%) |
| 35 to 64 Years | 176 (3.6%) | 157 (3.1%) |
| 65 to 74 Years | 187 (17.6%) | 199 (14.3%) |
| 75 Years and over | 150 (16.3%) | 303 (31.6%) |
Disability Class: Vision Difficulty

| Age Bracket | Male | Female |
| Under 5 Years | 0 (0.0%) | 0 (0.0%) |
| 5 to 17 Years | 62 (2.2%) | 28 (1.1%) |
| 18 to 34 Years | 108 (3.8%) | 92 (3.2%) |
| 35 to 64 Years | 370 (7.6%) | 287 (5.6%) |
| 65 to 74 Years | 7 (0.7%) | 50 (3.6%) |
| 75 Years and over | 49 (5.3%) | 308 (32.2%) |
Disability Class: Cognitive Difficulty

| Age Bracket | Male | Female |
| 5 to 17 Years | 302 (10.6%) | 90 (3.6%) |
| 18 to 34 Years | 206 (7.2%) | 223 (7.8%) |
| 35 to 64 Years | 262 (5.4%) | 258 (5.0%) |
| 65 to 74 Years | 129 (12.2%) | 187 (13.4%) |
| 75 Years and over | 366 (39.7%) | 242 (25.3%) |
Disability Class: Ambulatory Difficulty

| Age Bracket | Male | Female |
| 5 to 17 Years | 37 (1.3%) | 4 (0.2%) |
| 18 to 34 Years | 84 (2.9%) | 18 (0.6%) |
| 35 to 64 Years | 453 (9.3%) | 976 (19.0%) |
| 65 to 74 Years | 250 (23.6%) | 291 (20.9%) |
| 75 Years and over | 416 (45.1%) | 484 (50.5%) |
Disability Class: Self-Care Difficulty

| Age Bracket | Male | Female |
| 5 to 17 Years | 37 (1.3%) | 4 (0.2%) |
| 18 to 34 Years | 0 (0.0%) | 67 (2.3%) |
| 35 to 64 Years | 10 (0.2%) | 228 (4.4%) |
| 65 to 74 Years | 76 (7.2%) | 94 (6.8%) |
| 75 Years and over | 65 (7.0%) | 246 (25.7%) |
Technology Access in Scott County
Computing Device Access in Scott County
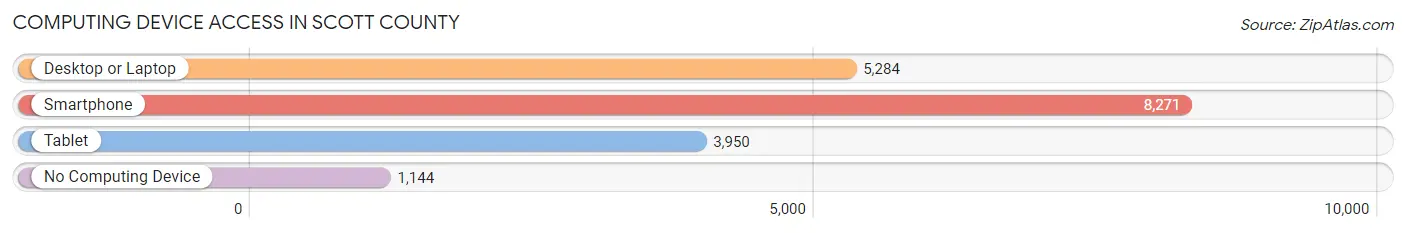
| Device Type | # Households | % Households |
| Desktop or Laptop | 5,284 | 54.5% |
| Smartphone | 8,271 | 85.3% |
| Tablet | 3,950 | 40.7% |
| No Computing Device | 1,144 | 11.8% |
| Total | 9,696 | 100.0% |
Internet Access in Scott County

| Internet Type | # Households | % Households |
| Dial-Up Internet | 40 | 0.4% |
| Broadband Home | 3,975 | 41.0% |
| Cellular Data Only | 2,178 | 22.5% |
| Satellite Internet | 1,676 | 17.3% |
| No Internet | 2,448 | 25.3% |
| Total | 9,696 | 100.0% |
Scott County Summary
Scott County is located in the southeastern corner of Mississippi, and is bordered by the states of Alabama and Louisiana. It is part of the Mississippi Delta region, and is known for its rich agricultural heritage. The county was established in 1833, and is named after General Winfield Scott, a hero of the War of 1812.
Geography
Scott County is located in the southeastern corner of Mississippi, and is bordered by the states of Alabama and Louisiana. It is part of the Mississippi Delta region, and is known for its rich agricultural heritage. The county is situated in the Yazoo-Mississippi Delta, and is characterized by flat, low-lying terrain. The county is drained by the Big Black River, which flows through the county from north to south. The county is also home to several small lakes, including Lake Scott, Lake Bolivar, and Lake Washington.
The county has a total area of 590 square miles, of which 586 square miles is land and 4 square miles is water. The county seat is Forest, and the largest city is Morton. Other towns and cities in the county include Lake, Lake Washington, Lake Bolivar, and Lakeland.
Demographics
As of the 2010 census, Scott County had a population of 28,264. The racial makeup of the county was 68.3% White, 29.2% African American, 0.4% Native American, 0.2% Asian, 0.1% Pacific Islander, 0.7% from other races, and 1.2% from two or more races. Hispanic or Latino of any race were 1.7% of the population.
The median income for a household in the county was $30,945, and the median income for a family was $37,945. Males had a median income of $30,945 versus $21,945 for females. The per capita income for the county was $15,945. About 17.2% of families and 21.2% of the population were below the poverty line, including 28.2% of those under age 18 and 18.2% of those age 65 or over.
Economy
Scott County is primarily an agricultural county, and is known for its production of cotton, soybeans, corn, and other crops. The county is also home to several manufacturing companies, including a paper mill, a furniture factory, and a plastics plant. The county is also home to several timber companies, and is a major producer of timber products.
The county is served by the Scott County School District, which operates several elementary, middle, and high schools. The county is also home to East Mississippi Community College, which offers a variety of academic and technical programs.
Conclusion
Scott County is a rural county located in the southeastern corner of Mississippi. It is part of the Mississippi Delta region, and is known for its rich agricultural heritage. The county has a population of 28,264, and is primarily an agricultural county, with a strong manufacturing sector. The county is served by the Scott County School District, and is home to East Mississippi Community College.
Common Questions
What is the Total Population of Scott County?
Total Population of Scott County is 27,943.
What is the Total Male Population of Scott County?
Total Male Population of Scott County is 13,871.
What is the Total Female Population of Scott County?
Total Female Population of Scott County is 14,072.
What is the Ratio of Males per 100 Females in Scott County?
There are 98.57 Males per 100 Females in Scott County.
What is the Ratio of Females per 100 Males in Scott County?
There are 101.45 Females per 100 Males in Scott County.
What is the Median Population Age in Scott County?
Median Population Age in Scott County is 36.7 Years.
What is the Average Family Size in Scott County
Average Family Size in Scott County is 3.3 People.
What is the Average Household Size in Scott County
Average Household Size in Scott County is 2.9 People.
What is Per Capita Income in Scott County?
Per Capita income in Scott County is $23,043.
What is the Median Family Income in Scott County?
Median Family Income in Scott County is $55,340.
What is the Median Household income in Scott County?
Median Household Income in Scott County is $44,968.
What is Income or Wage Gap in Scott County?
Income or Wage Gap in Scott County is 28.0%.
Women in Scott County earn 72.0 cents for every dollar earned by a man.
What is Family Income Deficit in Scott County?
Family Income Deficit in Scott County is $11,803.
Families that are below poverty line in Scott County earn $11,803 less on average than the poverty threshold level.
What is Inequality or Gini Index in Scott County?
Inequality or Gini Index in Scott County is 0.47.
How Large is the Labor Force in Scott County?
There are 12,076 People in the Labor Forcein in Scott County.
What is the Percentage of People in the Labor Force in Scott County?
56.5% of People are in the Labor Force in Scott County.
What is the Unemployment Rate in Scott County?
Unemployment Rate in Scott County is 6.0%.