Rankin County, MS
Rankin County Map
Rankin County Overview
157,185
TOTAL POPULATION
76,152
MALE POPULATION
81,033
FEMALE POPULATION
93.98
MALES / 100 FEMALES
106.41
FEMALES / 100 MALES
38.9
MEDIAN AGE
3.1
AVG FAMILY SIZE
2.6
AVG HOUSEHOLD SIZE
$36,605
PER CAPITA INCOME
$92,709
AVG FAMILY INCOME
$76,460
AVG HOUSEHOLD INCOME
28.0%
WAGE / INCOME GAP [ % ]
72.0¢/ $1
WAGE / INCOME GAP [ $ ]
$11,162
FAMILY INCOME DEFICIT
0.41
INEQUALITY / GINI INDEX
81,214
LABOR FORCE [ PEOPLE ]
64.2%
PERCENT IN LABOR FORCE
4.4%
UNEMPLOYMENT RATE
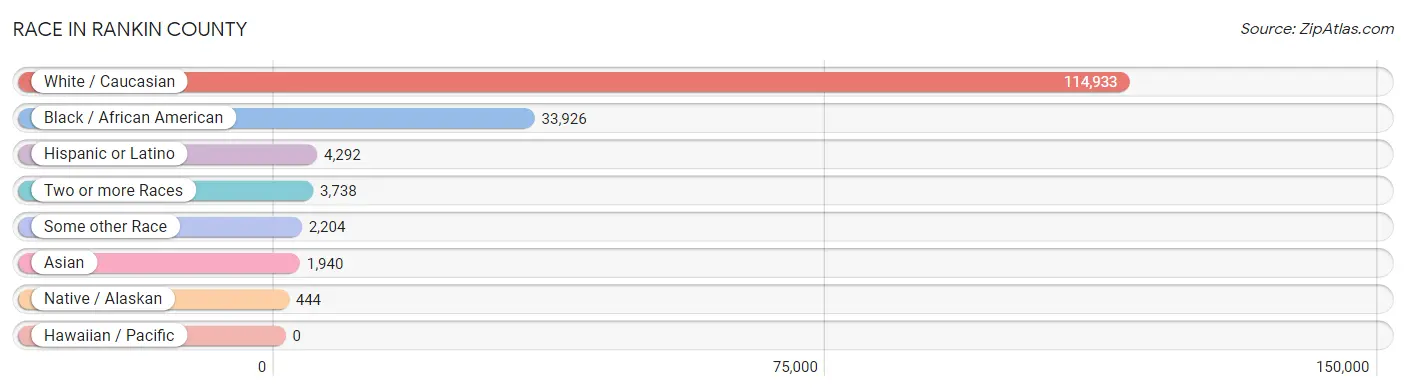
Race in Rankin County
The most populous races in Rankin County are White / Caucasian (114,933 | 73.1%), Black / African American (33,926 | 21.6%), and Hispanic or Latino (4,292 | 2.7%).
| Race | # Population | % Population |
| Asian | 1,940 | 1.2% |
| Black / African American | 33,926 | 21.6% |
| Hawaiian / Pacific | 0 | 0.0% |
| Hispanic or Latino | 4,292 | 2.7% |
| Native / Alaskan | 444 | 0.3% |
| White / Caucasian | 114,933 | 73.1% |
| Two or more Races | 3,738 | 2.4% |
| Some other Race | 2,204 | 1.4% |
| Total | 157,185 | 100.0% |
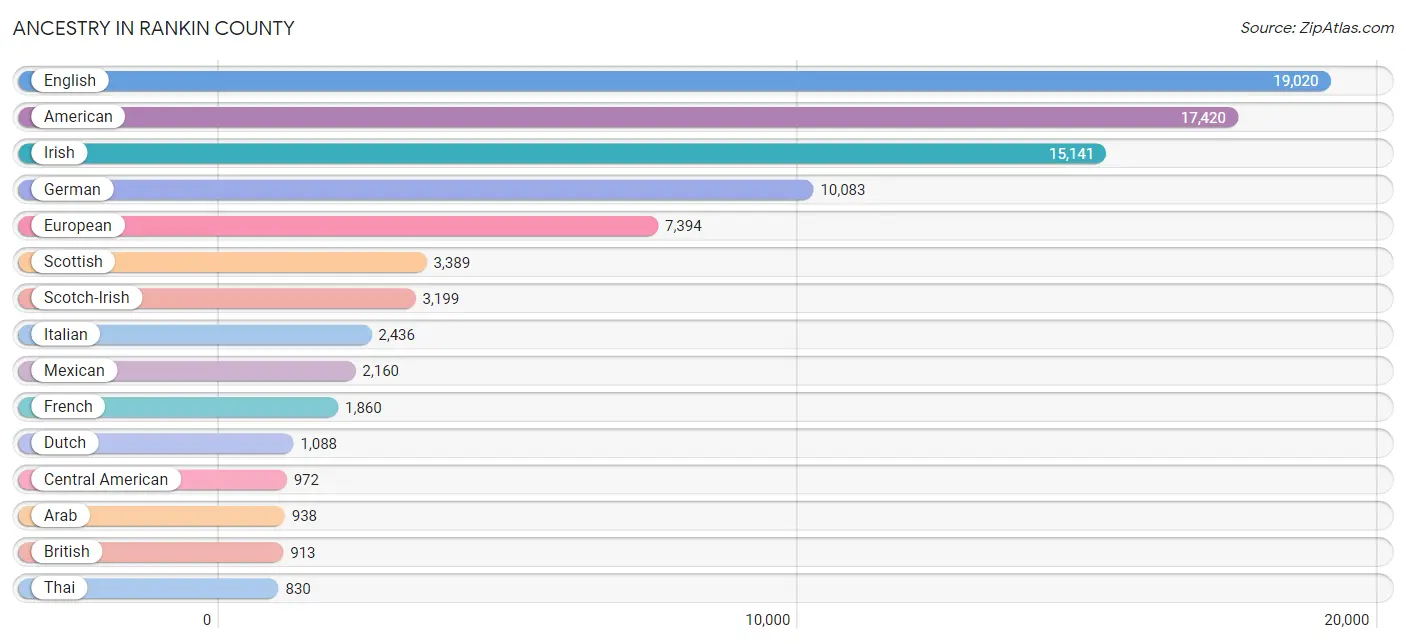
Ancestry in Rankin County
The most populous ancestries reported in Rankin County are English (19,020 | 12.1%), American (17,420 | 11.1%), Irish (15,141 | 9.6%), German (10,083 | 6.4%), and European (7,394 | 4.7%), together accounting for 43.9% of all Rankin County residents.
| Ancestry | # Population | % Population |
| Afghan | 50 | 0.0% |
| African | 277 | 0.2% |
| American | 17,420 | 11.1% |
| Apache | 5 | 0.0% |
| Arab | 938 | 0.6% |
| Argentinean | 9 | 0.0% |
| Armenian | 60 | 0.0% |
| Belgian | 78 | 0.1% |
| Bhutanese | 144 | 0.1% |
| Blackfeet | 11 | 0.0% |
| Brazilian | 18 | 0.0% |
| British | 913 | 0.6% |
| Burmese | 149 | 0.1% |
| Cajun | 70 | 0.0% |
| Canadian | 88 | 0.1% |
| Central American | 972 | 0.6% |
| Central American Indian | 10 | 0.0% |
| Cherokee | 219 | 0.1% |
| Chickasaw | 4 | 0.0% |
| Choctaw | 133 | 0.1% |
| Colombian | 95 | 0.1% |
| Creek | 19 | 0.0% |
| Croatian | 5 | 0.0% |
| Cuban | 360 | 0.2% |
| Czech | 40 | 0.0% |
| Danish | 79 | 0.1% |
| Dominican | 46 | 0.0% |
| Dutch | 1,088 | 0.7% |
| Dutch West Indian | 4 | 0.0% |
| Eastern European | 116 | 0.1% |
| Ecuadorian | 38 | 0.0% |
| Egyptian | 17 | 0.0% |
| English | 19,020 | 12.1% |
| European | 7,394 | 4.7% |
| Finnish | 13 | 0.0% |
| French | 1,860 | 1.2% |
| French American Indian | 4 | 0.0% |
| French Canadian | 153 | 0.1% |
| German | 10,083 | 6.4% |
| Greek | 301 | 0.2% |
| Guatemalan | 209 | 0.1% |
| Honduran | 599 | 0.4% |
| Hungarian | 300 | 0.2% |
| Indian (Asian) | 233 | 0.2% |
| Iranian | 13 | 0.0% |
| Irish | 15,141 | 9.6% |
| Israeli | 12 | 0.0% |
| Italian | 2,436 | 1.5% |
| Jamaican | 67 | 0.0% |
| Kiowa | 1 | 0.0% |
| Korean | 356 | 0.2% |
| Laotian | 126 | 0.1% |
| Lebanese | 390 | 0.3% |
| Lithuanian | 65 | 0.0% |
| Mexican | 2,160 | 1.4% |
| Mexican American Indian | 235 | 0.2% |
| Mongolian | 42 | 0.0% |
| Moroccan | 4 | 0.0% |
| New Zealander | 6 | 0.0% |
| Nicaraguan | 67 | 0.0% |
| Nigerian | 84 | 0.1% |
| Northern European | 234 | 0.2% |
| Norwegian | 650 | 0.4% |
| Osage | 9 | 0.0% |
| Palestinian | 65 | 0.0% |
| Peruvian | 166 | 0.1% |
| Polish | 744 | 0.5% |
| Portuguese | 12 | 0.0% |
| Puerto Rican | 200 | 0.1% |
| Puget Sound Salish | 4 | 0.0% |
| Russian | 64 | 0.0% |
| Scandinavian | 230 | 0.2% |
| Scotch-Irish | 3,199 | 2.0% |
| Scottish | 3,389 | 2.2% |
| Senegalese | 23 | 0.0% |
| Sioux | 60 | 0.0% |
| Slovak | 46 | 0.0% |
| Somali | 1 | 0.0% |
| South African | 7 | 0.0% |
| South American | 351 | 0.2% |
| South American Indian | 10 | 0.0% |
| Spaniard | 48 | 0.0% |
| Spanish | 69 | 0.0% |
| Sri Lankan | 275 | 0.2% |
| Subsaharan African | 392 | 0.3% |
| Swedish | 762 | 0.5% |
| Swiss | 100 | 0.1% |
| Thai | 830 | 0.5% |
| Trinidadian and Tobagonian | 27 | 0.0% |
| Turkish | 28 | 0.0% |
| Ukrainian | 66 | 0.0% |
| Venezuelan | 43 | 0.0% |
| Vietnamese | 12 | 0.0% |
| Welsh | 736 | 0.5% |
| Yugoslavian | 13 | 0.0% | View All 95 Rows |
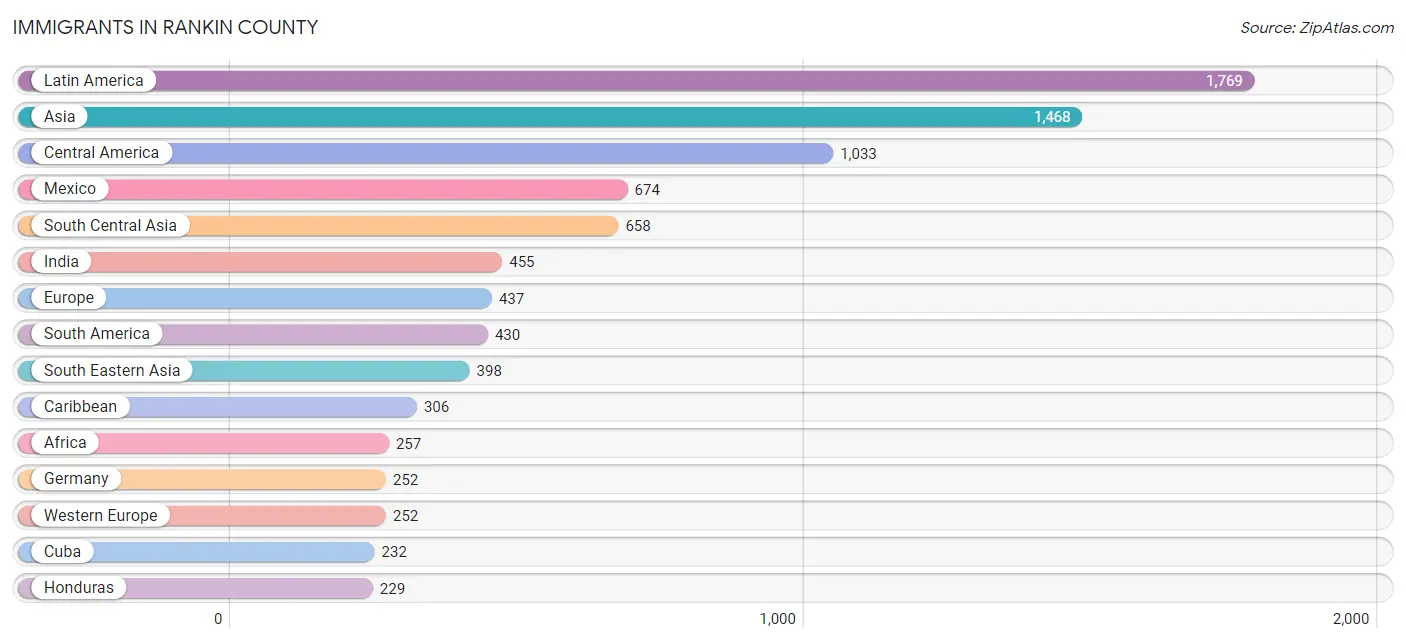
Immigrants in Rankin County
The most numerous immigrant groups reported in Rankin County came from Latin America (1,769 | 1.1%), Asia (1,468 | 0.9%), Central America (1,033 | 0.7%), Mexico (674 | 0.4%), and South Central Asia (658 | 0.4%), together accounting for 3.6% of all Rankin County residents.
| Immigration Origin | # Population | % Population |
| Afghanistan | 50 | 0.0% |
| Africa | 257 | 0.2% |
| Argentina | 9 | 0.0% |
| Asia | 1,468 | 0.9% |
| Belarus | 10 | 0.0% |
| Brazil | 58 | 0.0% |
| Canada | 107 | 0.1% |
| Caribbean | 306 | 0.2% |
| Central America | 1,033 | 0.7% |
| China | 121 | 0.1% |
| Colombia | 101 | 0.1% |
| Cuba | 232 | 0.2% |
| Dominican Republic | 46 | 0.0% |
| Eastern Africa | 80 | 0.1% |
| Eastern Asia | 205 | 0.1% |
| Eastern Europe | 54 | 0.0% |
| Egypt | 98 | 0.1% |
| England | 89 | 0.1% |
| Europe | 437 | 0.3% |
| Germany | 252 | 0.2% |
| Guatemala | 104 | 0.1% |
| Guyana | 67 | 0.0% |
| Honduras | 229 | 0.2% |
| India | 455 | 0.3% |
| Indonesia | 71 | 0.1% |
| Iran | 6 | 0.0% |
| Israel | 12 | 0.0% |
| Jamaica | 1 | 0.0% |
| Japan | 34 | 0.0% |
| Korea | 50 | 0.0% |
| Kuwait | 7 | 0.0% |
| Latin America | 1,769 | 1.1% |
| Malaysia | 2 | 0.0% |
| Mexico | 674 | 0.4% |
| Nepal | 61 | 0.0% |
| Nicaragua | 26 | 0.0% |
| Nigeria | 49 | 0.0% |
| Northern Africa | 98 | 0.1% |
| Northern Europe | 119 | 0.1% |
| Oceania | 17 | 0.0% |
| Pakistan | 86 | 0.1% |
| Peru | 158 | 0.1% |
| Philippines | 138 | 0.1% |
| Russia | 20 | 0.0% |
| Scotland | 30 | 0.0% |
| Senegal | 23 | 0.0% |
| South Africa | 7 | 0.0% |
| South America | 430 | 0.3% |
| South Central Asia | 658 | 0.4% |
| South Eastern Asia | 398 | 0.3% |
| Southern Europe | 12 | 0.0% |
| Spain | 12 | 0.0% |
| Syria | 178 | 0.1% |
| Trinidad and Tobago | 27 | 0.0% |
| Uganda | 80 | 0.1% |
| Ukraine | 24 | 0.0% |
| Venezuela | 37 | 0.0% |
| Vietnam | 187 | 0.1% |
| Western Africa | 72 | 0.1% |
| Western Asia | 207 | 0.1% |
| Western Europe | 252 | 0.2% |
| Yemen | 5 | 0.0% | View All 62 Rows |
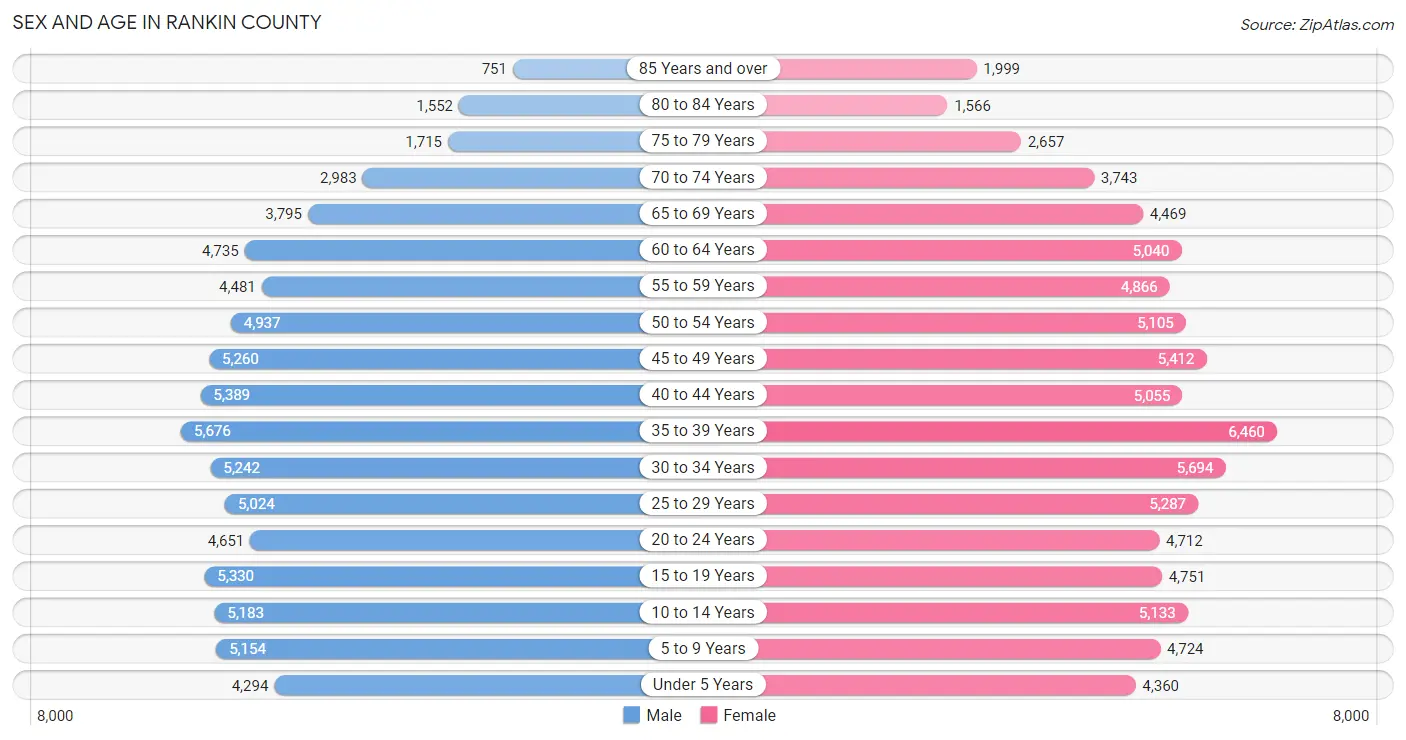
Sex and Age in Rankin County
Sex and Age in Rankin County
The most populous age groups in Rankin County are 35 to 39 Years (5,676 | 7.4%) for men and 35 to 39 Years (6,460 | 8.0%) for women.
| Age Bracket | Male | Female |
| Under 5 Years | 4,294 (5.6%) | 4,360 (5.4%) |
| 5 to 9 Years | 5,154 (6.8%) | 4,724 (5.8%) |
| 10 to 14 Years | 5,183 (6.8%) | 5,133 (6.3%) |
| 15 to 19 Years | 5,330 (7.0%) | 4,751 (5.9%) |
| 20 to 24 Years | 4,651 (6.1%) | 4,712 (5.8%) |
| 25 to 29 Years | 5,024 (6.6%) | 5,287 (6.5%) |
| 30 to 34 Years | 5,242 (6.9%) | 5,694 (7.0%) |
| 35 to 39 Years | 5,676 (7.4%) | 6,460 (8.0%) |
| 40 to 44 Years | 5,389 (7.1%) | 5,055 (6.2%) |
| 45 to 49 Years | 5,260 (6.9%) | 5,412 (6.7%) |
| 50 to 54 Years | 4,937 (6.5%) | 5,105 (6.3%) |
| 55 to 59 Years | 4,481 (5.9%) | 4,866 (6.0%) |
| 60 to 64 Years | 4,735 (6.2%) | 5,040 (6.2%) |
| 65 to 69 Years | 3,795 (5.0%) | 4,469 (5.5%) |
| 70 to 74 Years | 2,983 (3.9%) | 3,743 (4.6%) |
| 75 to 79 Years | 1,715 (2.2%) | 2,657 (3.3%) |
| 80 to 84 Years | 1,552 (2.0%) | 1,566 (1.9%) |
| 85 Years and over | 751 (1.0%) | 1,999 (2.5%) |
| Total | 76,152 (100.0%) | 81,033 (100.0%) |
Families and Households in Rankin County
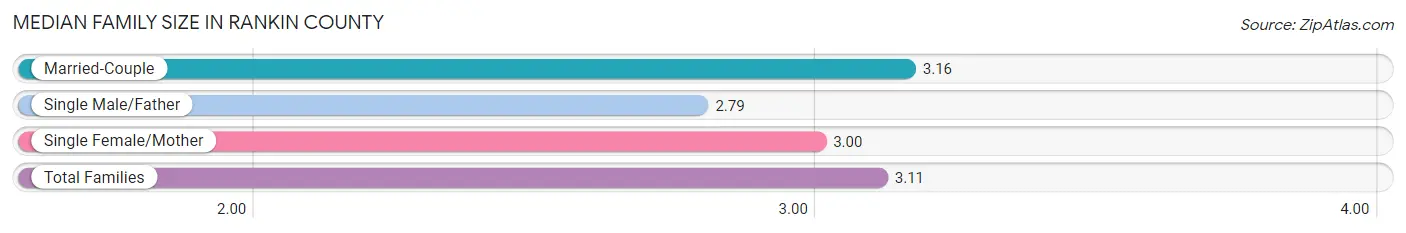
Median Family Size in Rankin County
The median family size in Rankin County is 3.11 persons per family, with married-couple families (31,695 | 77.1%) accounting for the largest median family size of 3.16 persons per family. On the other hand, single male/father families (2,246 | 5.5%) represent the smallest median family size with 2.79 persons per family.
| Family Type | # Families | Family Size |
| Married-Couple | 31,695 (77.1%) | 3.16 |
| Single Male/Father | 2,246 (5.5%) | 2.79 |
| Single Female/Mother | 7,191 (17.5%) | 3.00 |
| Total Families | 41,132 (100.0%) | 3.11 |
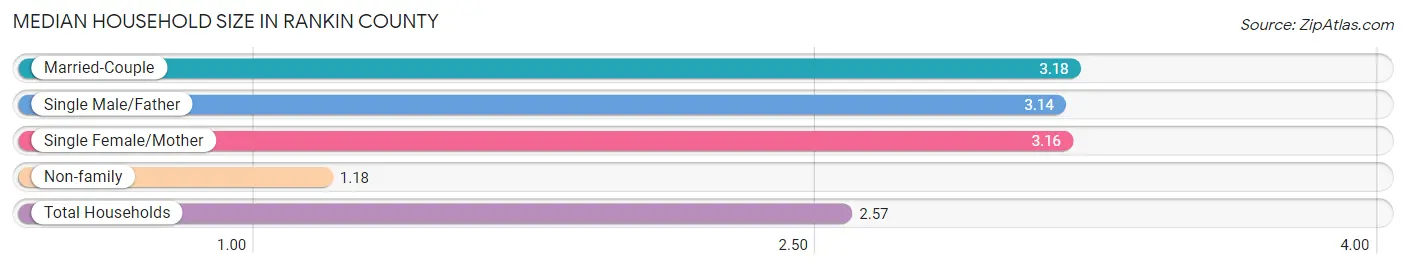
Median Household Size in Rankin County
The median household size in Rankin County is 2.57 persons per household, with married-couple households (31,695 | 53.7%) accounting for the largest median household size of 3.18 persons per household. non-family households (17,850 | 30.3%) represent the smallest median household size with 1.18 persons per household.
| Household Type | # Households | Household Size |
| Married-Couple | 31,695 (53.7%) | 3.18 |
| Single Male/Father | 2,246 (3.8%) | 3.14 |
| Single Female/Mother | 7,191 (12.2%) | 3.16 |
| Non-family | 17,850 (30.3%) | 1.18 |
| Total Households | 58,982 (100.0%) | 2.57 |
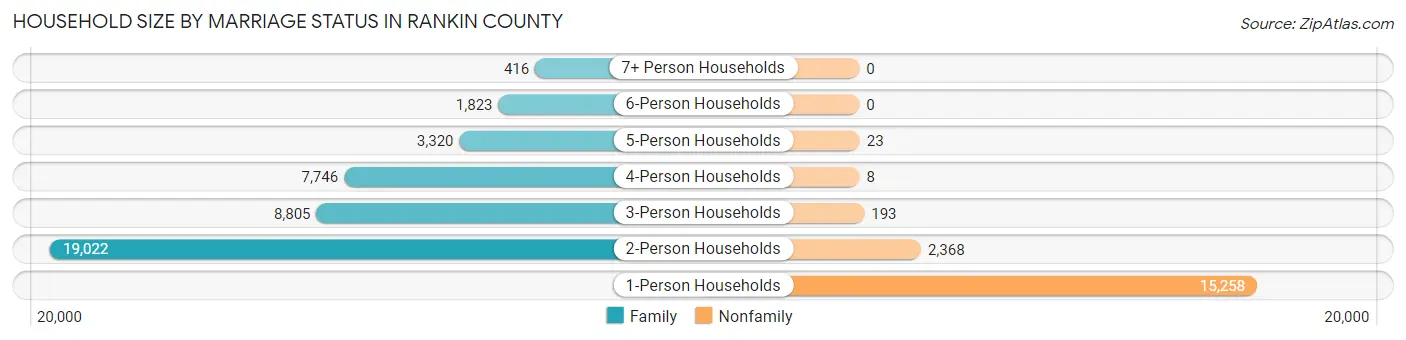
Household Size by Marriage Status in Rankin County
Out of a total of 58,982 households in Rankin County, 41,132 (69.7%) are family households, while 17,850 (30.3%) are nonfamily households. The most numerous type of family households are 2-person households, comprising 19,022, and the most common type of nonfamily households are 1-person households, comprising 15,258.
| Household Size | Family Households | Nonfamily Households |
| 1-Person Households | - | 15,258 (25.9%) |
| 2-Person Households | 19,022 (32.3%) | 2,368 (4.0%) |
| 3-Person Households | 8,805 (14.9%) | 193 (0.3%) |
| 4-Person Households | 7,746 (13.1%) | 8 (0.0%) |
| 5-Person Households | 3,320 (5.6%) | 23 (0.0%) |
| 6-Person Households | 1,823 (3.1%) | 0 (0.0%) |
| 7+ Person Households | 416 (0.7%) | 0 (0.0%) |
| Total | 41,132 (69.7%) | 17,850 (30.3%) |
Female Fertility in Rankin County
Fertility by Age in Rankin County
Average fertility rate in Rankin County is 48.0 births per 1,000 women. Women in the age bracket of 20 to 34 years have the highest fertility rate with 80.0 births per 1,000 women. Women in the age bracket of 20 to 34 years acount for 67.3% of all women with births.
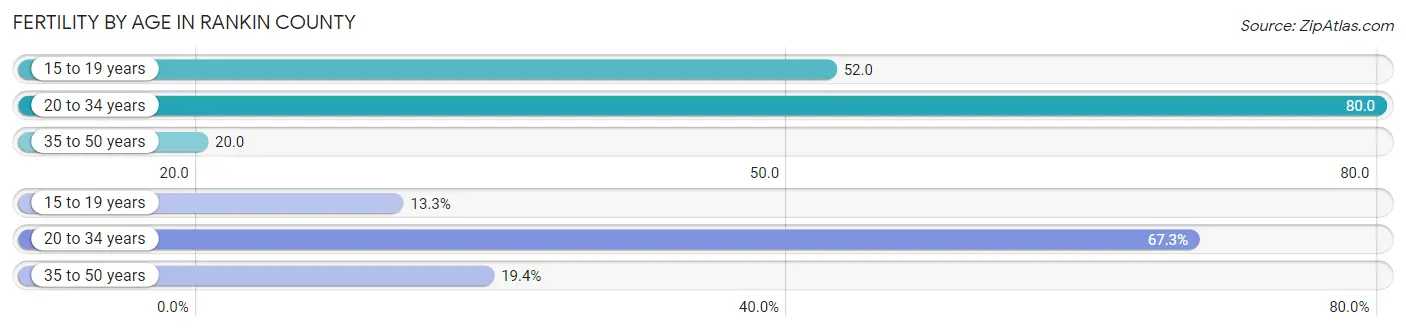
| Age Bracket | Women with Births | Births / 1,000 Women |
| 15 to 19 years | 246 (13.3%) | 52.0 |
| 20 to 34 years | 1,248 (67.3%) | 80.0 |
| 35 to 50 years | 360 (19.4%) | 20.0 |
| Total | 1,854 (100.0%) | 48.0 |
Fertility by Age by Marriage Status in Rankin County
75.4% of women with births (1,854) in Rankin County are married. The highest percentage of unmarried women with births falls into 15 to 19 years age bracket with 95.9% of them unmarried at the time of birth, while the lowest percentage of unmarried women with births belong to 35 to 50 years age bracket with 3.9% of them unmarried.
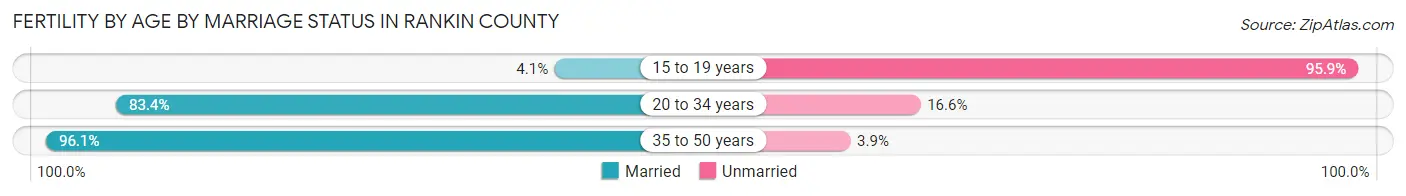
| Age Bracket | Married | Unmarried |
| 15 to 19 years | 10 (4.1%) | 236 (95.9%) |
| 20 to 34 years | 1,041 (83.4%) | 207 (16.6%) |
| 35 to 50 years | 346 (96.1%) | 14 (3.9%) |
| Total | 1,398 (75.4%) | 456 (24.6%) |
Fertility by Education in Rankin County
Average fertility rate in Rankin County is 48.0 births per 1,000 women. Women with the education attainment of graduate degree have the highest fertility rate of 80.0 births per 1,000 women, while women with the education attainment of less than high school have the lowest fertility at 28.0 births per 1,000 women. Women with the education attainment of bachelor's degree represent 30.5% of all women with births.
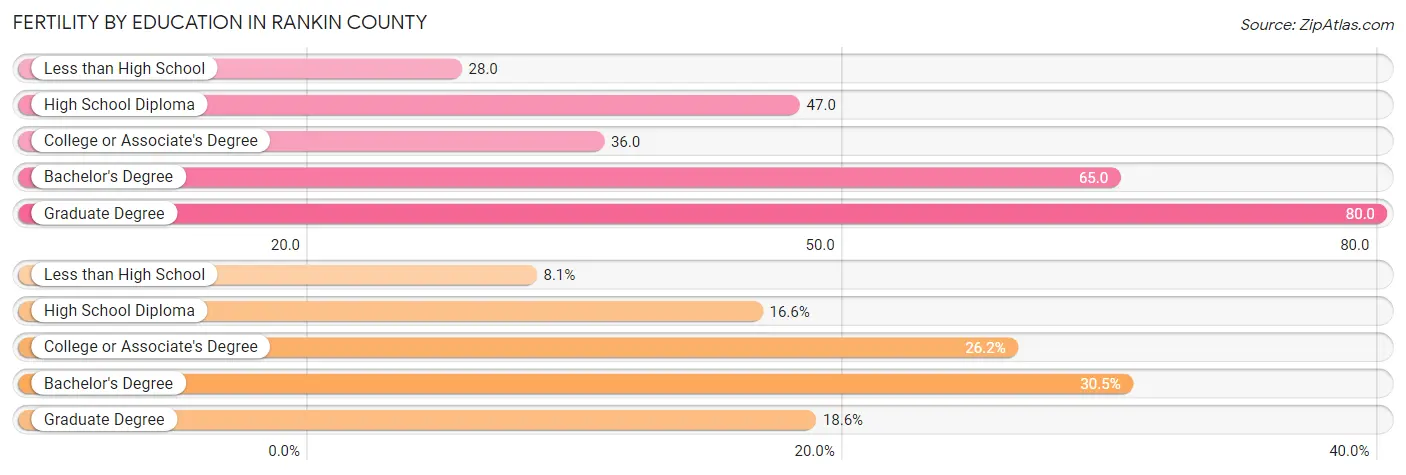
| Educational Attainment | Women with Births | Births / 1,000 Women |
| Less than High School | 151 (8.1%) | 28.0 |
| High School Diploma | 308 (16.6%) | 47.0 |
| College or Associate's Degree | 485 (26.2%) | 36.0 |
| Bachelor's Degree | 565 (30.5%) | 65.0 |
| Graduate Degree | 345 (18.6%) | 80.0 |
| Total | 1,854 (100.0%) | 48.0 |
Fertility by Education by Marriage Status in Rankin County
24.6% of women with births in Rankin County are unmarried. Women with the educational attainment of bachelor's degree are most likely to be married with 90.3% of them married at childbirth, while women with the educational attainment of high school diploma are least likely to be married with 72.4% of them unmarried at childbirth.
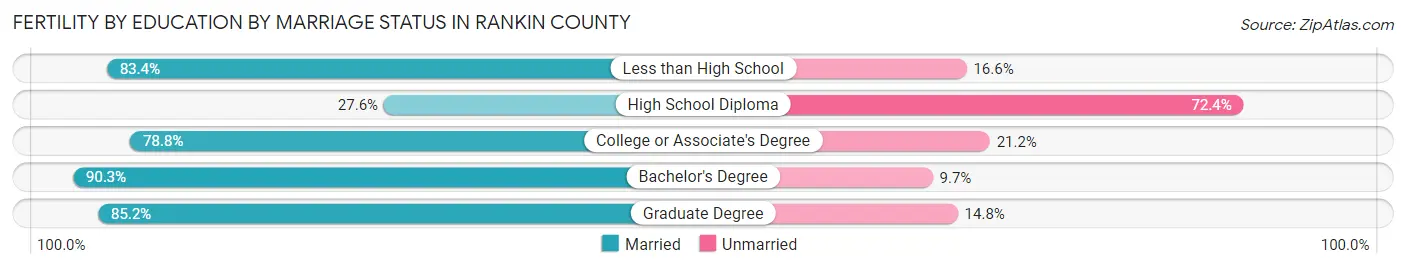
| Educational Attainment | Married | Unmarried |
| Less than High School | 126 (83.4%) | 25 (16.6%) |
| High School Diploma | 85 (27.6%) | 223 (72.4%) |
| College or Associate's Degree | 382 (78.8%) | 103 (21.2%) |
| Bachelor's Degree | 510 (90.3%) | 55 (9.7%) |
| Graduate Degree | 294 (85.2%) | 51 (14.8%) |
| Total | 1,398 (75.4%) | 456 (24.6%) |
Income in Rankin County
Income Overview in Rankin County
Per Capita Income in Rankin County is $36,605, while median incomes of families and households are $92,709 and $76,460 respectively.
| Characteristic | Number | Measure |
| Per Capita Income | 157,185 | $36,605 |
| Median Family Income | 41,132 | $92,709 |
| Mean Family Income | 41,132 | $109,208 |
| Median Household Income | 58,982 | $76,460 |
| Mean Household Income | 58,982 | $95,038 |
| Income Deficit | 41,132 | $11,162 |
| Wage / Income Gap (%) | 157,185 | 28.02% |
| Wage / Income Gap ($) | 157,185 | 71.98¢ per $1 |
| Gini / Inequality Index | 157,185 | 0.41 |
Earnings by Sex in Rankin County
Average Earnings in Rankin County are $44,240, $51,575 for men and $37,123 for women, a difference of 28.0%.
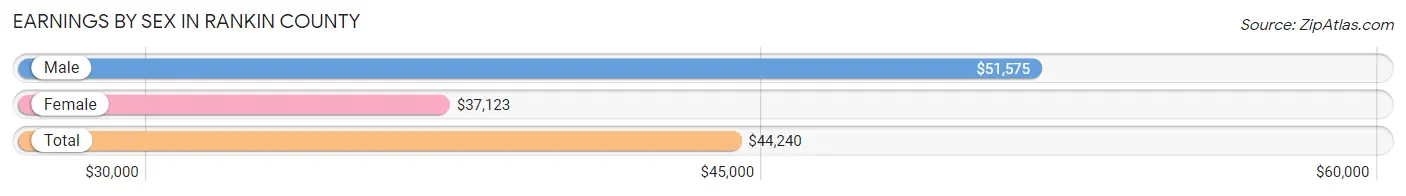
| Sex | Number | Average Earnings |
| Male | 42,620 (50.7%) | $51,575 |
| Female | 41,400 (49.3%) | $37,123 |
| Total | 84,020 (100.0%) | $44,240 |
Earnings by Sex by Income Bracket in Rankin County
The most common earnings brackets in Rankin County are $100,000+ for men (7,037 | 16.5%) and $55,000 to $64,999 for women (3,627 | 8.8%).
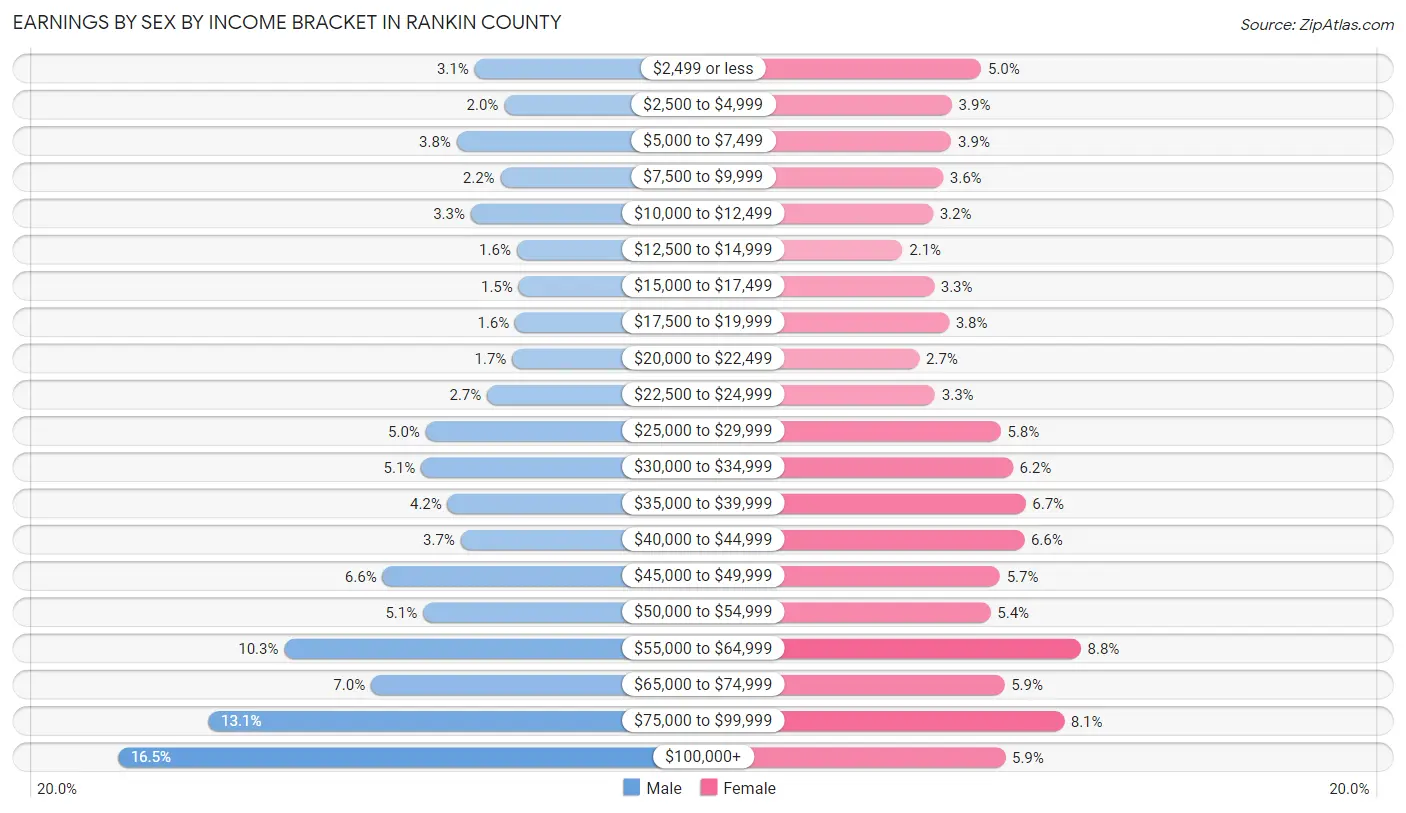
| Income | Male | Female |
| $2,499 or less | 1,340 (3.1%) | 2,083 (5.0%) |
| $2,500 to $4,999 | 865 (2.0%) | 1,626 (3.9%) |
| $5,000 to $7,499 | 1,624 (3.8%) | 1,620 (3.9%) |
| $7,500 to $9,999 | 925 (2.2%) | 1,489 (3.6%) |
| $10,000 to $12,499 | 1,397 (3.3%) | 1,335 (3.2%) |
| $12,500 to $14,999 | 665 (1.6%) | 863 (2.1%) |
| $15,000 to $17,499 | 635 (1.5%) | 1,350 (3.3%) |
| $17,500 to $19,999 | 689 (1.6%) | 1,580 (3.8%) |
| $20,000 to $22,499 | 737 (1.7%) | 1,123 (2.7%) |
| $22,500 to $24,999 | 1,139 (2.7%) | 1,367 (3.3%) |
| $25,000 to $29,999 | 2,117 (5.0%) | 2,384 (5.8%) |
| $30,000 to $34,999 | 2,189 (5.1%) | 2,569 (6.2%) |
| $35,000 to $39,999 | 1,769 (4.2%) | 2,768 (6.7%) |
| $40,000 to $44,999 | 1,560 (3.7%) | 2,750 (6.6%) |
| $45,000 to $49,999 | 2,809 (6.6%) | 2,374 (5.7%) |
| $50,000 to $54,999 | 2,162 (5.1%) | 2,229 (5.4%) |
| $55,000 to $64,999 | 4,379 (10.3%) | 3,627 (8.8%) |
| $65,000 to $74,999 | 2,991 (7.0%) | 2,443 (5.9%) |
| $75,000 to $99,999 | 5,591 (13.1%) | 3,367 (8.1%) |
| $100,000+ | 7,037 (16.5%) | 2,453 (5.9%) |
| Total | 42,620 (100.0%) | 41,400 (100.0%) |
Earnings by Sex by Educational Attainment in Rankin County
Average earnings in Rankin County are $56,804 for men and $41,784 for women, a difference of 26.4%. Men with an educational attainment of graduate degree enjoy the highest average annual earnings of $80,645, while those with less than high school education earn the least with $39,097. Women with an educational attainment of graduate degree earn the most with the average annual earnings of $59,429, while those with less than high school education have the smallest earnings of $20,538.
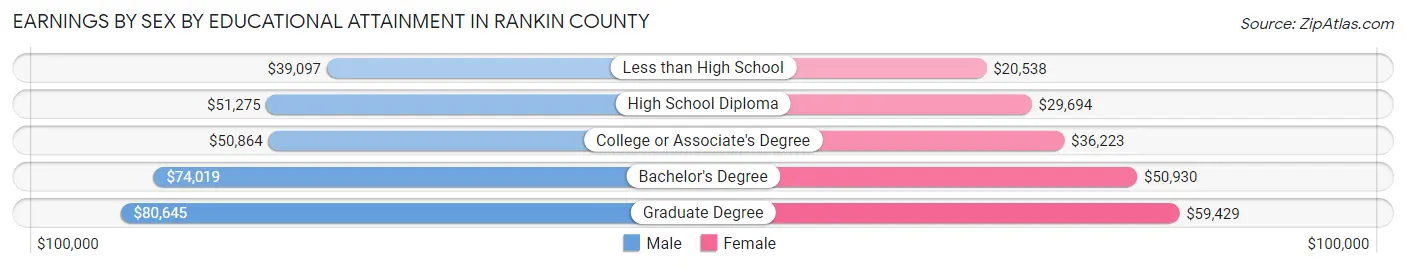
| Educational Attainment | Male Income | Female Income |
| Less than High School | $39,097 | $20,538 |
| High School Diploma | $51,275 | $29,694 |
| College or Associate's Degree | $50,864 | $36,223 |
| Bachelor's Degree | $74,019 | $50,930 |
| Graduate Degree | $80,645 | $59,429 |
| Total | $56,804 | $41,784 |
Family Income in Rankin County
Family Income Brackets in Rankin County
According to the Rankin County family income data, there are 9,831 families falling into the $100,000 to $149,999 income range, which is the most common income bracket and makes up 23.9% of all families. Conversely, the less than $10,000 income bracket is the least frequent group with only 658 families (1.6%) belonging to this category.
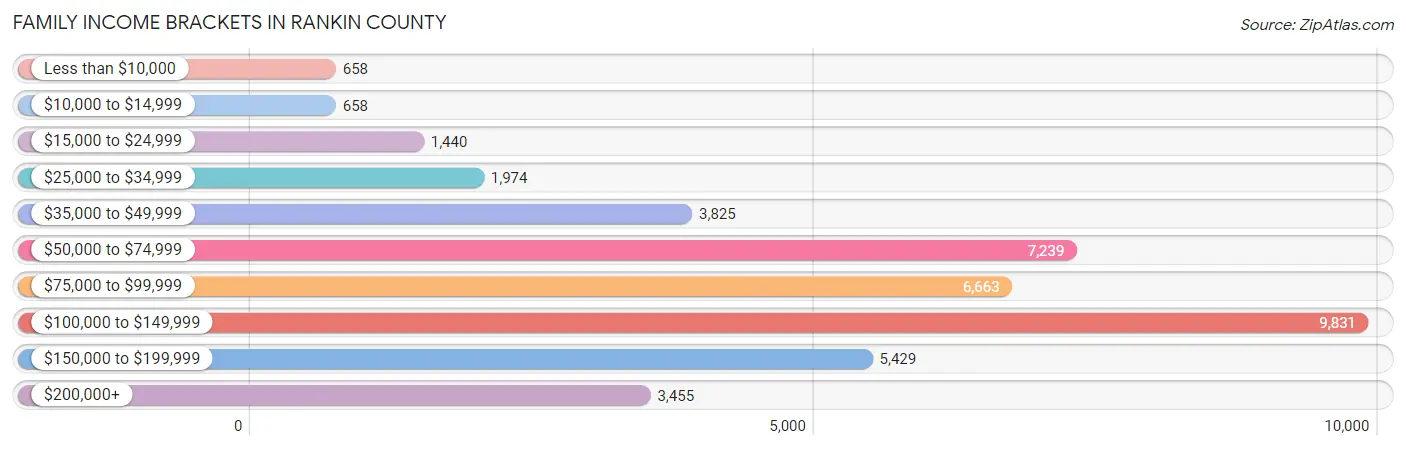
| Income Bracket | # Families | % Families |
| Less than $10,000 | 658 | 1.6% |
| $10,000 to $14,999 | 658 | 1.6% |
| $15,000 to $24,999 | 1,440 | 3.5% |
| $25,000 to $34,999 | 1,974 | 4.8% |
| $35,000 to $49,999 | 3,825 | 9.3% |
| $50,000 to $74,999 | 7,239 | 17.6% |
| $75,000 to $99,999 | 6,663 | 16.2% |
| $100,000 to $149,999 | 9,831 | 23.9% |
| $150,000 to $199,999 | 5,429 | 13.2% |
| $200,000+ | 3,455 | 8.4% |
Family Income by Famaliy Size in Rankin County
7+ person families (334 | 0.8%) account for the highest median family income in Rankin County with $153,778 per family, while 2-person families (19,818 | 48.2%) have the highest median income of $42,582 per family member.

| Income Bracket | # Families | Median Income |
| 2-Person Families | 19,818 (48.2%) | $85,165 |
| 3-Person Families | 8,453 (20.5%) | $89,260 |
| 4-Person Families | 7,760 (18.9%) | $108,404 |
| 5-Person Families | 3,056 (7.4%) | $108,135 |
| 6-Person Families | 1,711 (4.2%) | $110,865 |
| 7+ Person Families | 334 (0.8%) | $153,778 |
| Total | 41,132 (100.0%) | $92,709 |
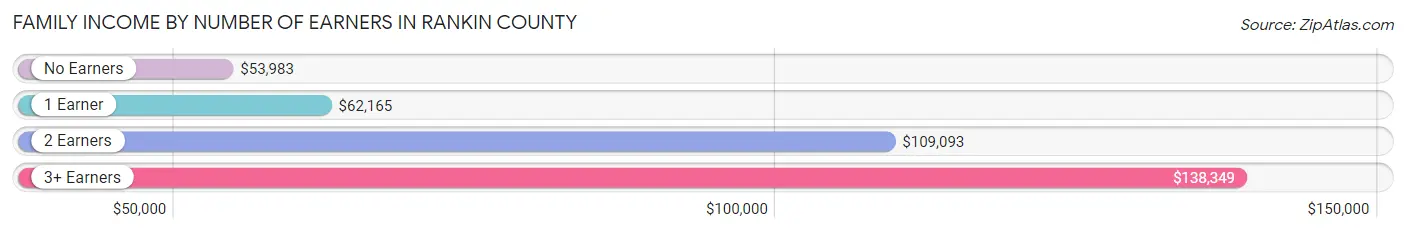
Family Income by Number of Earners in Rankin County
The median family income in Rankin County is $92,709, with families comprising 3+ earners (4,793) having the highest median family income of $138,349, while families with no earners (5,139) have the lowest median family income of $53,983, accounting for 11.7% and 12.5% of families, respectively.
| Number of Earners | # Families | Median Income |
| No Earners | 5,139 (12.5%) | $53,983 |
| 1 Earner | 12,358 (30.0%) | $62,165 |
| 2 Earners | 18,842 (45.8%) | $109,093 |
| 3+ Earners | 4,793 (11.7%) | $138,349 |
| Total | 41,132 (100.0%) | $92,709 |
Household Income in Rankin County
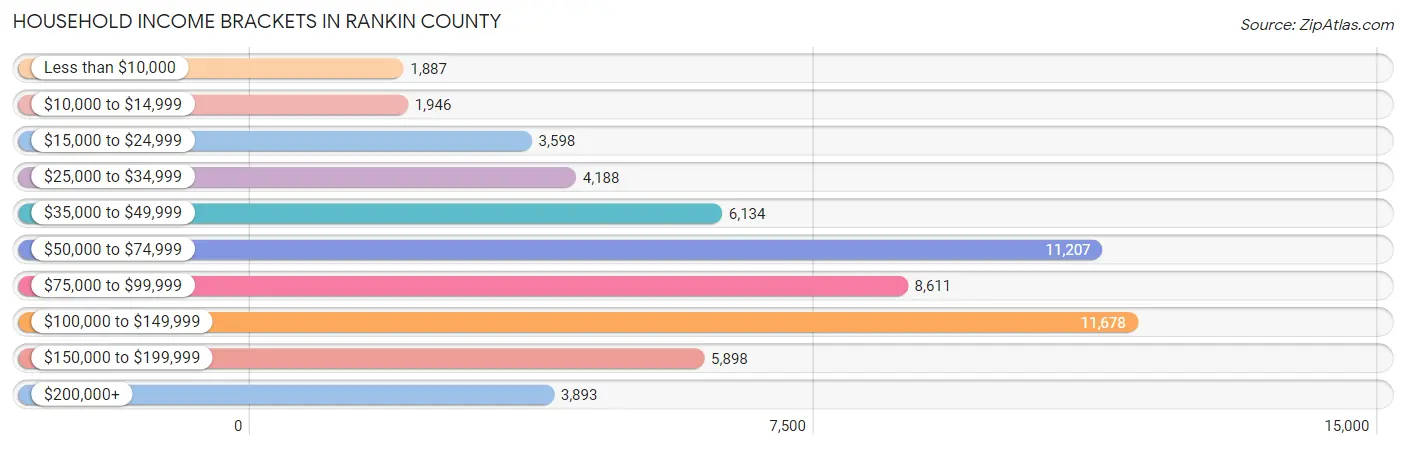
Household Income Brackets in Rankin County
With 11,678 households falling in the category, the $100,000 to $149,999 income range is the most frequent in Rankin County, accounting for 19.8% of all households. In contrast, only 1,887 households (3.2%) fall into the less than $10,000 income bracket, making it the least populous group.
| Income Bracket | # Households | % Households |
| Less than $10,000 | 1,887 | 3.2% |
| $10,000 to $14,999 | 1,946 | 3.3% |
| $15,000 to $24,999 | 3,598 | 6.1% |
| $25,000 to $34,999 | 4,188 | 7.1% |
| $35,000 to $49,999 | 6,134 | 10.4% |
| $50,000 to $74,999 | 11,207 | 19.0% |
| $75,000 to $99,999 | 8,611 | 14.6% |
| $100,000 to $149,999 | 11,678 | 19.8% |
| $150,000 to $199,999 | 5,898 | 10.0% |
| $200,000+ | 3,893 | 6.6% |
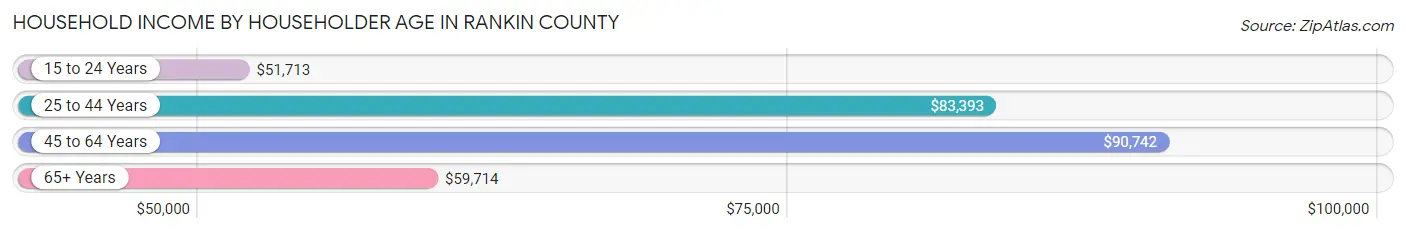
Household Income by Householder Age in Rankin County
The median household income in Rankin County is $76,460, with the highest median household income of $90,742 found in the 45 to 64 years age bracket for the primary householder. A total of 21,288 households (36.1%) fall into this category. Meanwhile, the 15 to 24 years age bracket for the primary householder has the lowest median household income of $51,713, with 1,884 households (3.2%) in this group.
| Income Bracket | # Households | Median Income |
| 15 to 24 Years | 1,884 (3.2%) | $51,713 |
| 25 to 44 Years | 20,005 (33.9%) | $83,393 |
| 45 to 64 Years | 21,288 (36.1%) | $90,742 |
| 65+ Years | 15,805 (26.8%) | $59,714 |
| Total | 58,982 (100.0%) | $76,460 |
Poverty in Rankin County
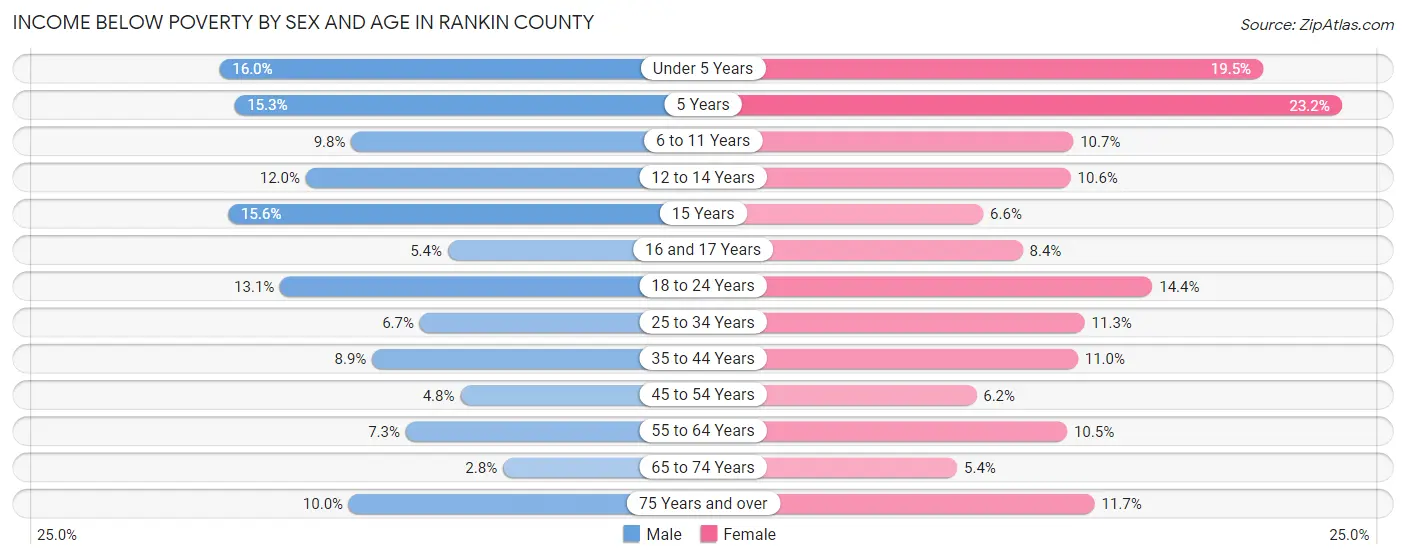
Income Below Poverty by Sex and Age in Rankin County
With 8.4% poverty level for males and 10.5% for females among the residents of Rankin County, under 5 year old males and 5 year old females are the most vulnerable to poverty, with 682 males (16.0%) and 157 females (23.2%) in their respective age groups living below the poverty level.
| Age Bracket | Male | Female |
| Under 5 Years | 682 (16.0%) | 843 (19.5%) |
| 5 Years | 100 (15.3%) | 157 (23.2%) |
| 6 to 11 Years | 634 (9.8%) | 682 (10.7%) |
| 12 to 14 Years | 378 (11.9%) | 290 (10.6%) |
| 15 Years | 148 (15.6%) | 58 (6.6%) |
| 16 and 17 Years | 134 (5.4%) | 192 (8.4%) |
| 18 to 24 Years | 818 (13.1%) | 897 (14.4%) |
| 25 to 34 Years | 631 (6.7%) | 1,195 (11.3%) |
| 35 to 44 Years | 903 (8.9%) | 1,213 (11.0%) |
| 45 to 54 Years | 464 (4.8%) | 638 (6.2%) |
| 55 to 64 Years | 634 (7.3%) | 1,023 (10.4%) |
| 65 to 74 Years | 184 (2.8%) | 435 (5.3%) |
| 75 Years and over | 389 (10.0%) | 695 (11.7%) |
| Total | 6,099 (8.4%) | 8,318 (10.5%) |
Income Above Poverty by Sex and Age in Rankin County
According to the poverty statistics in Rankin County, males aged 65 to 74 years and females aged 65 to 74 years are the age groups that are most secure financially, with 97.2% of males and 94.7% of females in these age groups living above the poverty line.
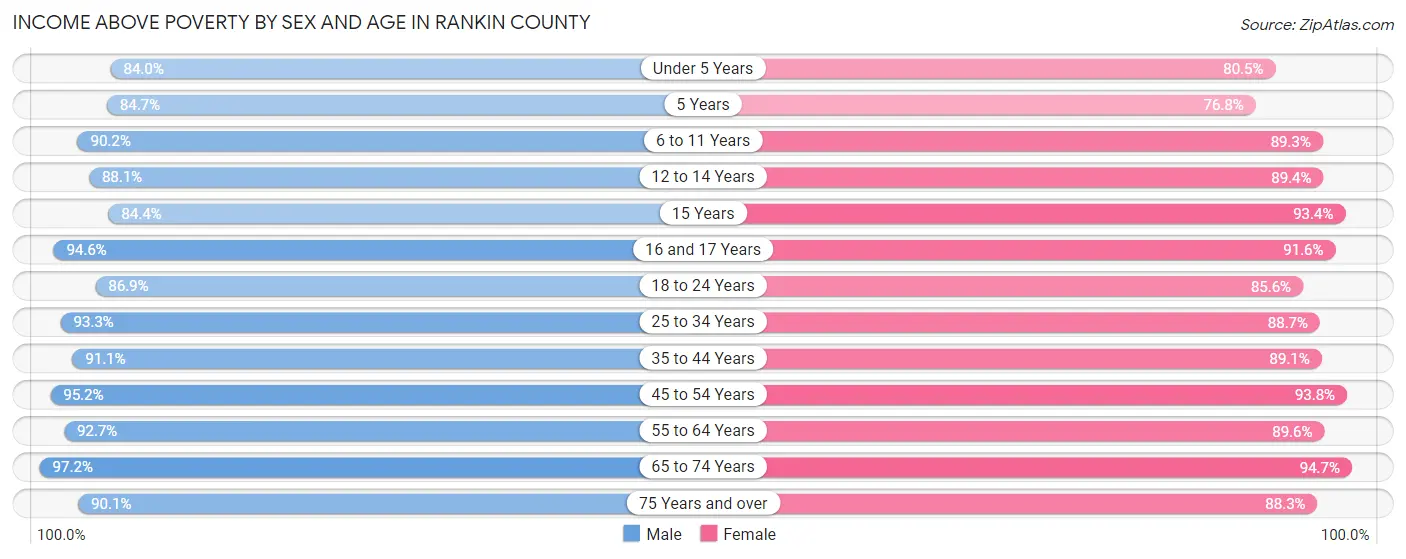
| Age Bracket | Male | Female |
| Under 5 Years | 3,591 (84.0%) | 3,471 (80.5%) |
| 5 Years | 555 (84.7%) | 520 (76.8%) |
| 6 to 11 Years | 5,808 (90.2%) | 5,668 (89.3%) |
| 12 to 14 Years | 2,784 (88.0%) | 2,441 (89.4%) |
| 15 Years | 803 (84.4%) | 826 (93.4%) |
| 16 and 17 Years | 2,367 (94.6%) | 2,096 (91.6%) |
| 18 to 24 Years | 5,406 (86.9%) | 5,327 (85.6%) |
| 25 to 34 Years | 8,842 (93.3%) | 9,410 (88.7%) |
| 35 to 44 Years | 9,273 (91.1%) | 9,861 (89.0%) |
| 45 to 54 Years | 9,252 (95.2%) | 9,593 (93.8%) |
| 55 to 64 Years | 8,037 (92.7%) | 8,770 (89.5%) |
| 65 to 74 Years | 6,382 (97.2%) | 7,699 (94.7%) |
| 75 Years and over | 3,519 (90.0%) | 5,231 (88.3%) |
| Total | 66,619 (91.6%) | 70,913 (89.5%) |
Income Below Poverty Among Married-Couple Families in Rankin County
The poverty statistics for married-couple families in Rankin County show that 3.2% or 1,019 of the total 31,695 families live below the poverty line. Families with 5 or more children have the highest poverty rate of 18.7%, comprising of 20 families. On the other hand, families with no children have the lowest poverty rate of 2.1%, which includes 374 families.
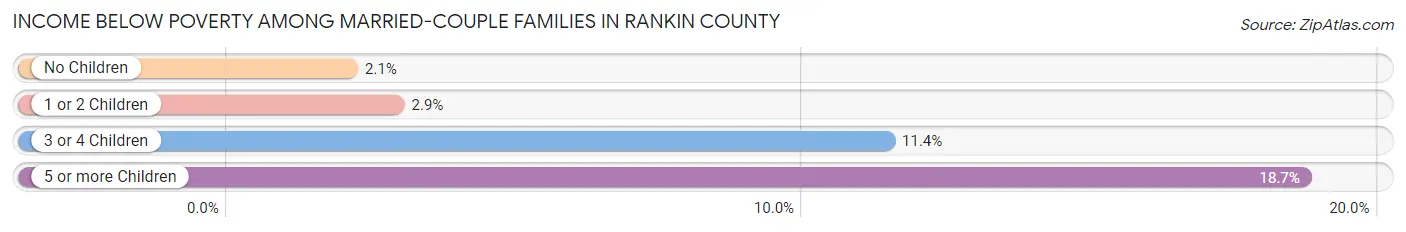
| Children | Above Poverty | Below Poverty |
| No Children | 17,514 (97.9%) | 374 (2.1%) |
| 1 or 2 Children | 10,713 (97.1%) | 320 (2.9%) |
| 3 or 4 Children | 2,362 (88.6%) | 305 (11.4%) |
| 5 or more Children | 87 (81.3%) | 20 (18.7%) |
| Total | 30,676 (96.8%) | 1,019 (3.2%) |
Income Below Poverty Among Single-Parent Households in Rankin County
According to the poverty data in Rankin County, 11.8% or 266 single-father households and 17.3% or 1,243 single-mother households are living below the poverty line. Among single-father households, those with 3 or 4 children have the highest poverty rate, with 41 households (42.3%) experiencing poverty. Likewise, among single-mother households, those with 5 or more children have the highest poverty rate, with 126 households (100.0%) falling below the poverty line.
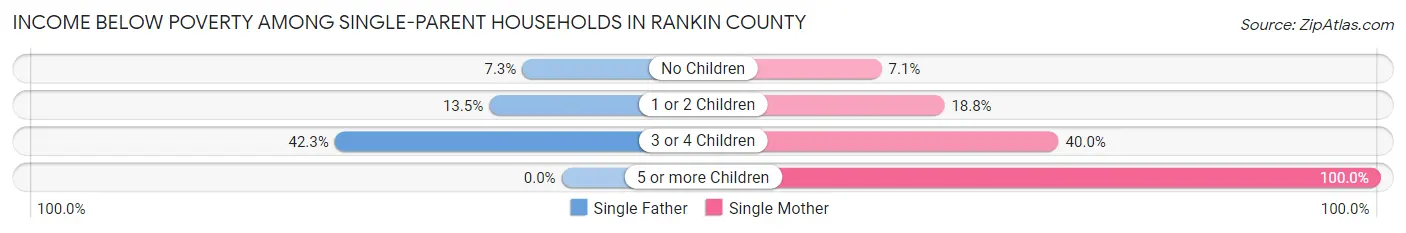
| Children | Single Father | Single Mother |
| No Children | 73 (7.3%) | 193 (7.1%) |
| 1 or 2 Children | 152 (13.5%) | 717 (18.8%) |
| 3 or 4 Children | 41 (42.3%) | 207 (40.0%) |
| 5 or more Children | 0 (0.0%) | 126 (100.0%) |
| Total | 266 (11.8%) | 1,243 (17.3%) |
Income Below Poverty Among Married-Couple vs Single-Parent Households in Rankin County
The poverty data for Rankin County shows that 1,019 of the married-couple family households (3.2%) and 1,509 of the single-parent households (16.0%) are living below the poverty level. Within the married-couple family households, those with 5 or more children have the highest poverty rate, with 20 households (18.7%) falling below the poverty line. Among the single-parent households, those with 5 or more children have the highest poverty rate, with 126 household (82.4%) living below poverty.
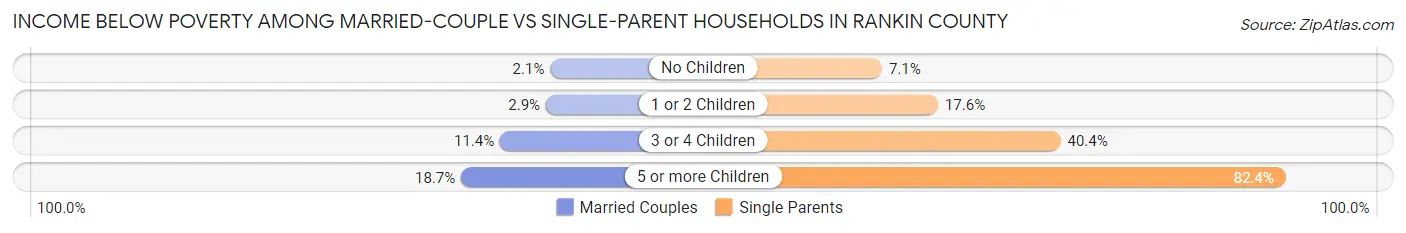
| Children | Married-Couple Families | Single-Parent Households |
| No Children | 374 (2.1%) | 266 (7.1%) |
| 1 or 2 Children | 320 (2.9%) | 869 (17.6%) |
| 3 or 4 Children | 305 (11.4%) | 248 (40.4%) |
| 5 or more Children | 20 (18.7%) | 126 (82.4%) |
| Total | 1,019 (3.2%) | 1,509 (16.0%) |
Employment Characteristics in Rankin County
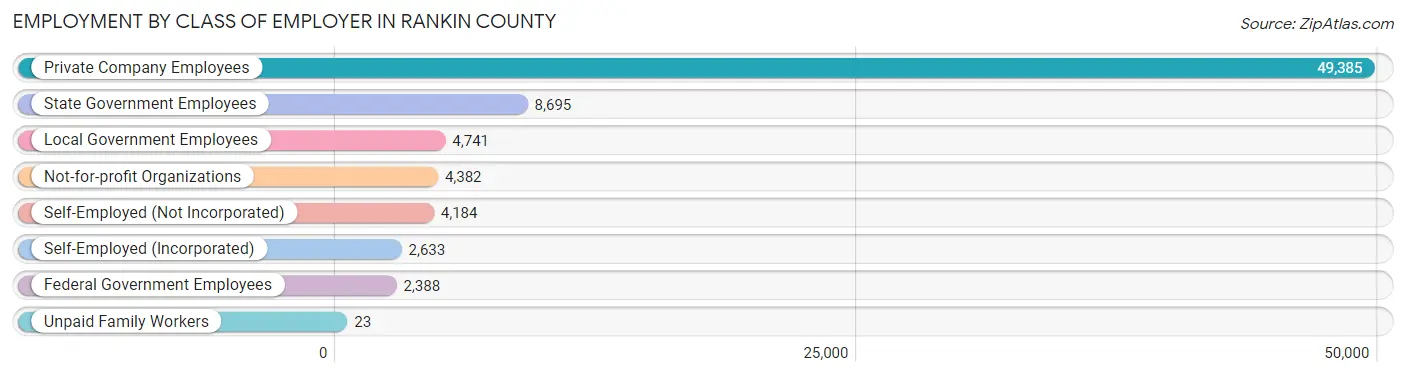
Employment by Class of Employer in Rankin County
Among the 76,431 employed individuals in Rankin County, private company employees (49,385 | 64.6%), state government employees (8,695 | 11.4%), and local government employees (4,741 | 6.2%) make up the most common classes of employment.
| Employer Class | # Employees | % Employees |
| Private Company Employees | 49,385 | 64.6% |
| Self-Employed (Incorporated) | 2,633 | 3.4% |
| Self-Employed (Not Incorporated) | 4,184 | 5.5% |
| Not-for-profit Organizations | 4,382 | 5.7% |
| Local Government Employees | 4,741 | 6.2% |
| State Government Employees | 8,695 | 11.4% |
| Federal Government Employees | 2,388 | 3.1% |
| Unpaid Family Workers | 23 | 0.0% |
| Total | 76,431 | 100.0% |
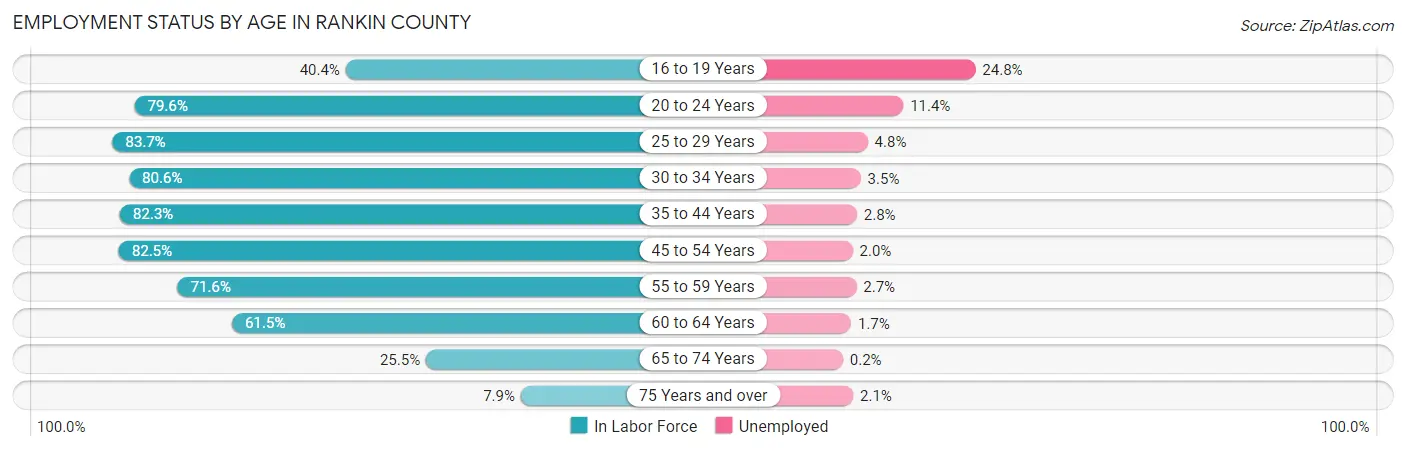
Employment Status by Age in Rankin County
According to the labor force statistics for Rankin County, out of the total population over 16 years of age (126,502), 64.2% or 81,214 individuals are in the labor force, with 4.4% or 3,573 of them unemployed. The age group with the highest labor force participation rate is 25 to 29 years, with 83.7% or 8,630 individuals in the labor force. Within the labor force, the 16 to 19 years age range has the highest percentage of unemployed individuals, with 24.8% or 826 of them being unemployed.
| Age Bracket | In Labor Force | Unemployed |
| 16 to 19 Years | 3,331 (40.4%) | 826 (24.8%) |
| 20 to 24 Years | 7,453 (79.6%) | 850 (11.4%) |
| 25 to 29 Years | 8,630 (83.7%) | 414 (4.8%) |
| 30 to 34 Years | 8,814 (80.6%) | 308 (3.5%) |
| 35 to 44 Years | 18,583 (82.3%) | 520 (2.8%) |
| 45 to 54 Years | 17,089 (82.5%) | 342 (2.0%) |
| 55 to 59 Years | 6,692 (71.6%) | 181 (2.7%) |
| 60 to 64 Years | 6,012 (61.5%) | 102 (1.7%) |
| 65 to 74 Years | 3,822 (25.5%) | 8 (0.2%) |
| 75 Years and over | 809 (7.9%) | 17 (2.1%) |
| Total | 81,214 (64.2%) | 3,573 (4.4%) |
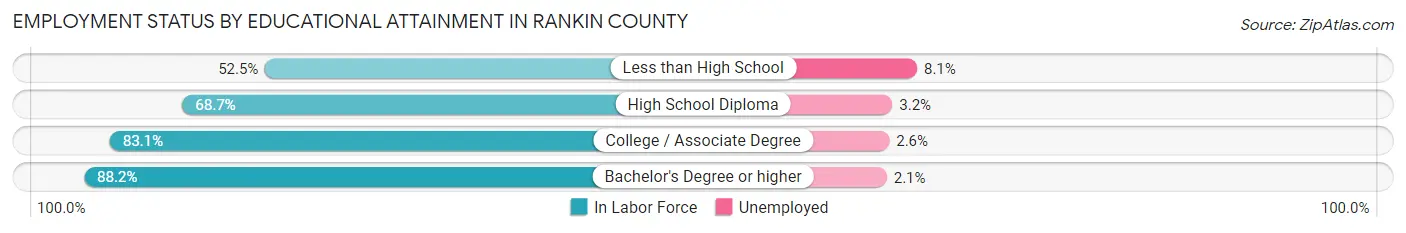
Employment Status by Educational Attainment in Rankin County
According to labor force statistics for Rankin County, 78.7% of individuals (65,843) out of the total population between 25 and 64 years of age (83,663) are in the labor force, with 2.9% or 1,909 of them being unemployed. The group with the highest labor force participation rate are those with the educational attainment of bachelor's degree or higher, with 88.2% or 24,711 individuals in the labor force. Within the labor force, individuals with less than high school education have the highest percentage of unemployment, with 8.1% or 346 of them being unemployed.
| Educational Attainment | In Labor Force | Unemployed |
| Less than High School | 4,271 (52.5%) | 659 (8.1%) |
| High School Diploma | 12,683 (68.7%) | 591 (3.2%) |
| College / Associate Degree | 24,139 (83.1%) | 755 (2.6%) |
| Bachelor's Degree or higher | 24,711 (88.2%) | 588 (2.1%) |
| Total | 65,843 (78.7%) | 2,426 (2.9%) |
Employment Occupations by Sex in Rankin County
Management, Business, Science and Arts Occupations
The most common Management, Business, Science and Arts occupations in Rankin County are Community & Social Service (9,398 | 12.2%), Management (7,747 | 10.0%), Health Diagnosing & Treating (7,690 | 10.0%), Education Instruction & Library (5,683 | 7.3%), and Health Technologists (4,954 | 6.4%).
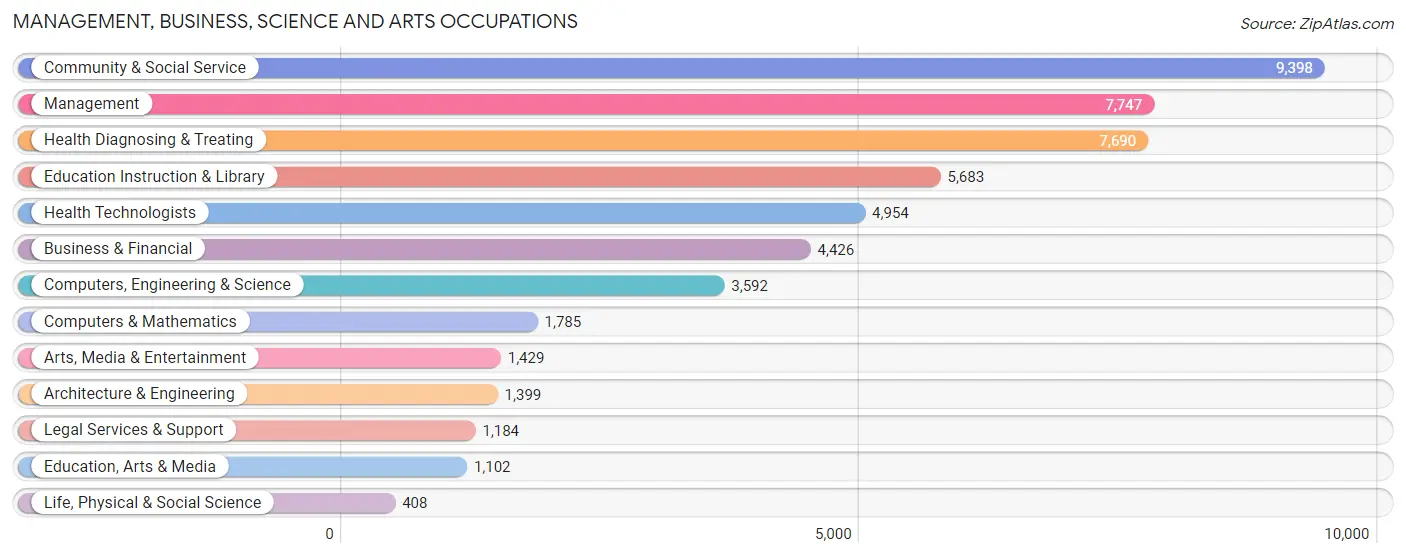
Management, Business, Science and Arts Occupations by Sex
Within the Management, Business, Science and Arts occupations in Rankin County, the most male-oriented occupations are Architecture & Engineering (91.1%), Computers, Engineering & Science (78.6%), and Computers & Mathematics (71.1%), while the most female-oriented occupations are Education Instruction & Library (84.0%), Health Technologists (77.9%), and Health Diagnosing & Treating (76.1%).
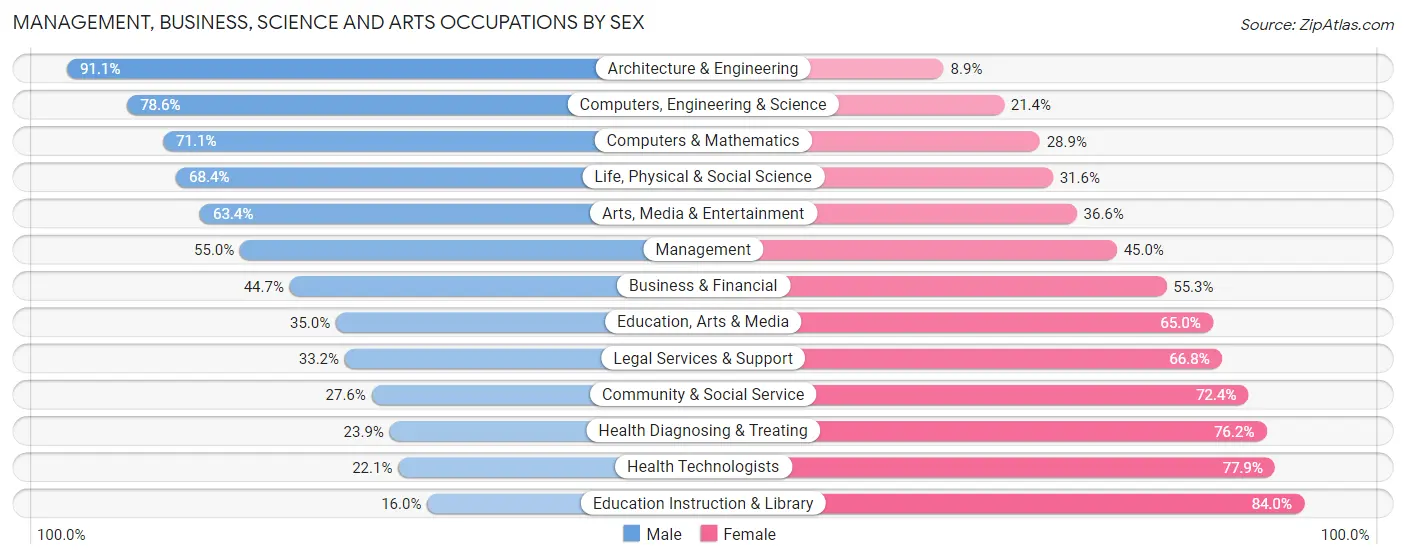
| Occupation | Male | Female |
| Management | 4,264 (55.0%) | 3,483 (45.0%) |
| Business & Financial | 1,978 (44.7%) | 2,448 (55.3%) |
| Computers, Engineering & Science | 2,823 (78.6%) | 769 (21.4%) |
| Computers & Mathematics | 1,269 (71.1%) | 516 (28.9%) |
| Architecture & Engineering | 1,275 (91.1%) | 124 (8.9%) |
| Life, Physical & Social Science | 279 (68.4%) | 129 (31.6%) |
| Community & Social Service | 2,595 (27.6%) | 6,803 (72.4%) |
| Education, Arts & Media | 386 (35.0%) | 716 (65.0%) |
| Legal Services & Support | 393 (33.2%) | 791 (66.8%) |
| Education Instruction & Library | 910 (16.0%) | 4,773 (84.0%) |
| Arts, Media & Entertainment | 906 (63.4%) | 523 (36.6%) |
| Health Diagnosing & Treating | 1,834 (23.8%) | 5,856 (76.1%) |
| Health Technologists | 1,093 (22.1%) | 3,861 (77.9%) |
| Total (Category) | 13,494 (41.1%) | 19,359 (58.9%) |
| Total (Overall) | 39,027 (50.5%) | 38,243 (49.5%) |
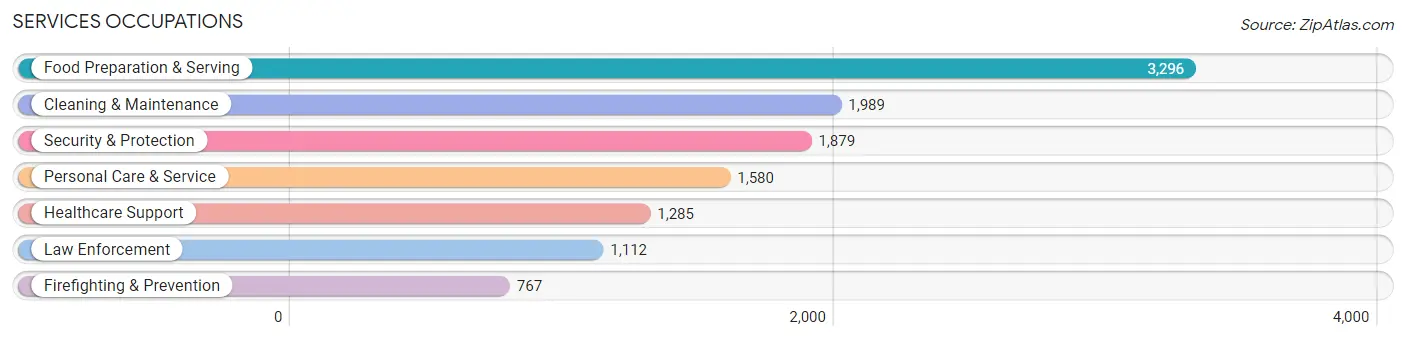
Services Occupations
The most common Services occupations in Rankin County are Food Preparation & Serving (3,296 | 4.3%), Cleaning & Maintenance (1,989 | 2.6%), Security & Protection (1,879 | 2.4%), Personal Care & Service (1,580 | 2.0%), and Healthcare Support (1,285 | 1.7%).
Services Occupations by Sex
Within the Services occupations in Rankin County, the most male-oriented occupations are Firefighting & Prevention (84.9%), Security & Protection (83.2%), and Law Enforcement (82.1%), while the most female-oriented occupations are Healthcare Support (94.6%), Personal Care & Service (85.1%), and Food Preparation & Serving (72.9%).
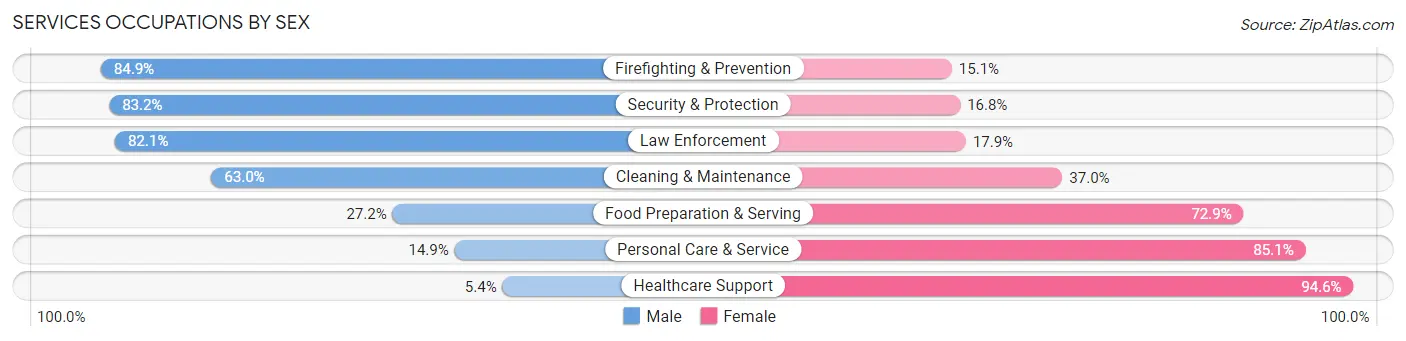
| Occupation | Male | Female |
| Healthcare Support | 69 (5.4%) | 1,216 (94.6%) |
| Security & Protection | 1,564 (83.2%) | 315 (16.8%) |
| Firefighting & Prevention | 651 (84.9%) | 116 (15.1%) |
| Law Enforcement | 913 (82.1%) | 199 (17.9%) |
| Food Preparation & Serving | 895 (27.2%) | 2,401 (72.9%) |
| Cleaning & Maintenance | 1,253 (63.0%) | 736 (37.0%) |
| Personal Care & Service | 235 (14.9%) | 1,345 (85.1%) |
| Total (Category) | 4,016 (40.0%) | 6,013 (60.0%) |
| Total (Overall) | 39,027 (50.5%) | 38,243 (49.5%) |
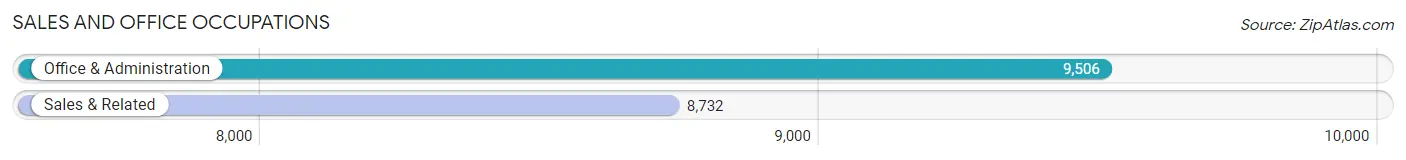
Sales and Office Occupations
The most common Sales and Office occupations in Rankin County are Office & Administration (9,506 | 12.3%), and Sales & Related (8,732 | 11.3%).
Sales and Office Occupations by Sex
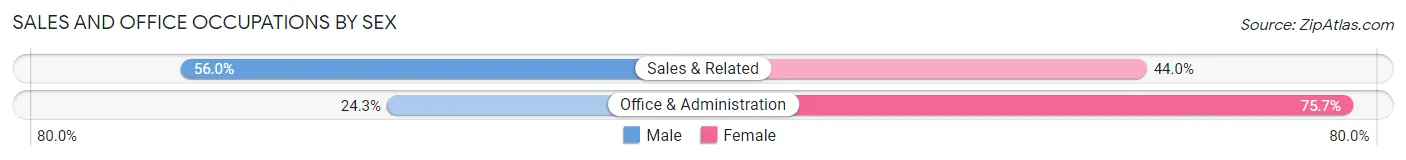
| Occupation | Male | Female |
| Sales & Related | 4,887 (56.0%) | 3,845 (44.0%) |
| Office & Administration | 2,307 (24.3%) | 7,199 (75.7%) |
| Total (Category) | 7,194 (39.5%) | 11,044 (60.6%) |
| Total (Overall) | 39,027 (50.5%) | 38,243 (49.5%) |
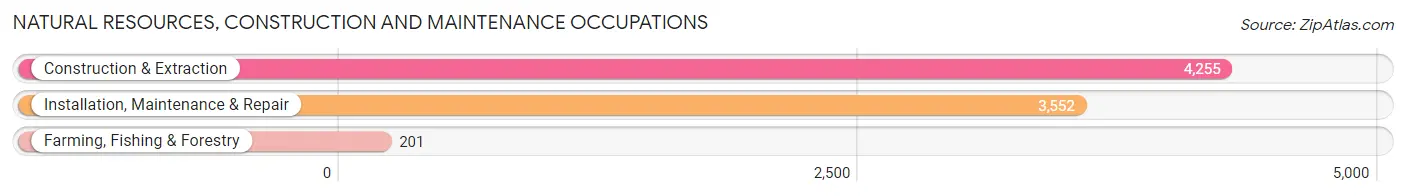
Natural Resources, Construction and Maintenance Occupations
The most common Natural Resources, Construction and Maintenance occupations in Rankin County are Construction & Extraction (4,255 | 5.5%), Installation, Maintenance & Repair (3,552 | 4.6%), and Farming, Fishing & Forestry (201 | 0.3%).
Natural Resources, Construction and Maintenance Occupations by Sex
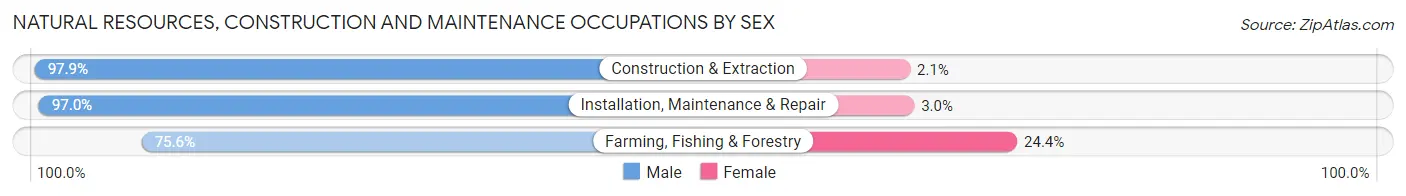
| Occupation | Male | Female |
| Farming, Fishing & Forestry | 152 (75.6%) | 49 (24.4%) |
| Construction & Extraction | 4,165 (97.9%) | 90 (2.1%) |
| Installation, Maintenance & Repair | 3,446 (97.0%) | 106 (3.0%) |
| Total (Category) | 7,763 (96.9%) | 245 (3.1%) |
| Total (Overall) | 39,027 (50.5%) | 38,243 (49.5%) |
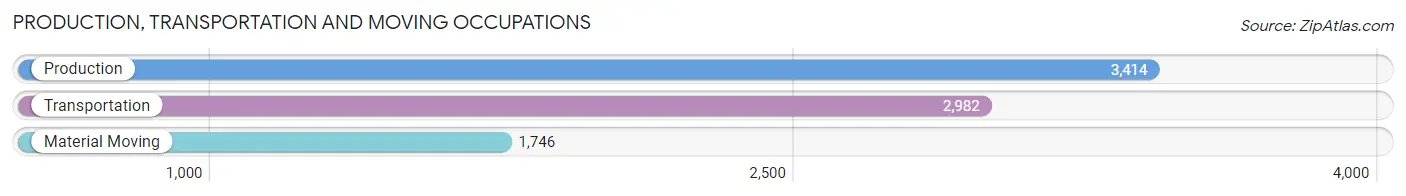
Production, Transportation and Moving Occupations
The most common Production, Transportation and Moving occupations in Rankin County are Production (3,414 | 4.4%), Transportation (2,982 | 3.9%), and Material Moving (1,746 | 2.3%).
Production, Transportation and Moving Occupations by Sex
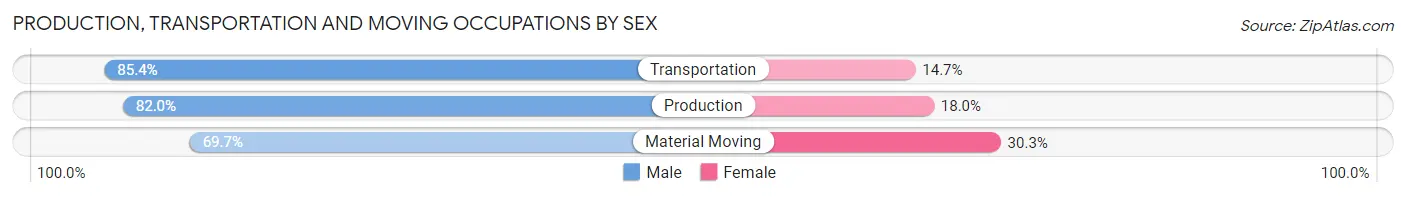
| Occupation | Male | Female |
| Production | 2,798 (82.0%) | 616 (18.0%) |
| Transportation | 2,545 (85.4%) | 437 (14.6%) |
| Material Moving | 1,217 (69.7%) | 529 (30.3%) |
| Total (Category) | 6,560 (80.6%) | 1,582 (19.4%) |
| Total (Overall) | 39,027 (50.5%) | 38,243 (49.5%) |
Employment Industries by Sex in Rankin County
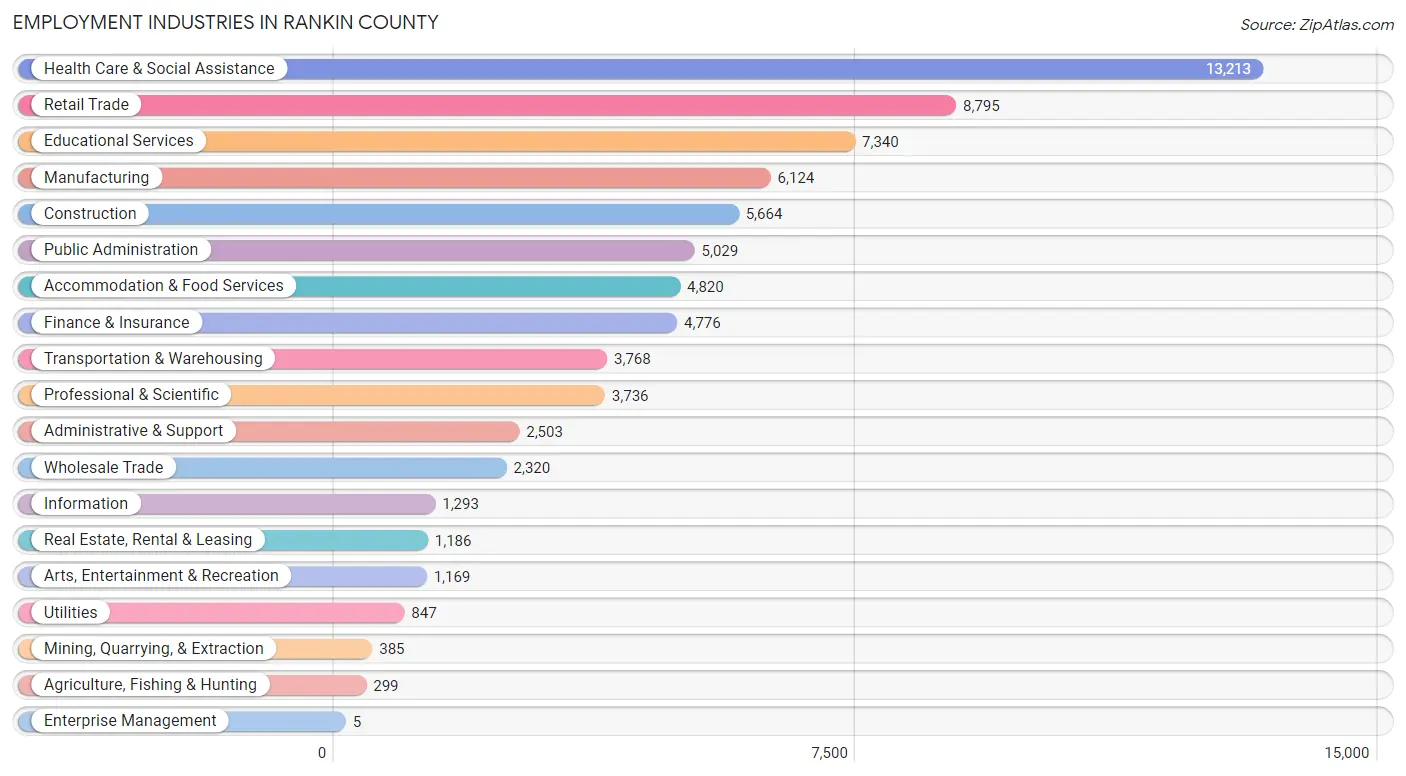
Employment Industries in Rankin County
The major employment industries in Rankin County include Health Care & Social Assistance (13,213 | 17.1%), Retail Trade (8,795 | 11.4%), Educational Services (7,340 | 9.5%), Manufacturing (6,124 | 7.9%), and Construction (5,664 | 7.3%).
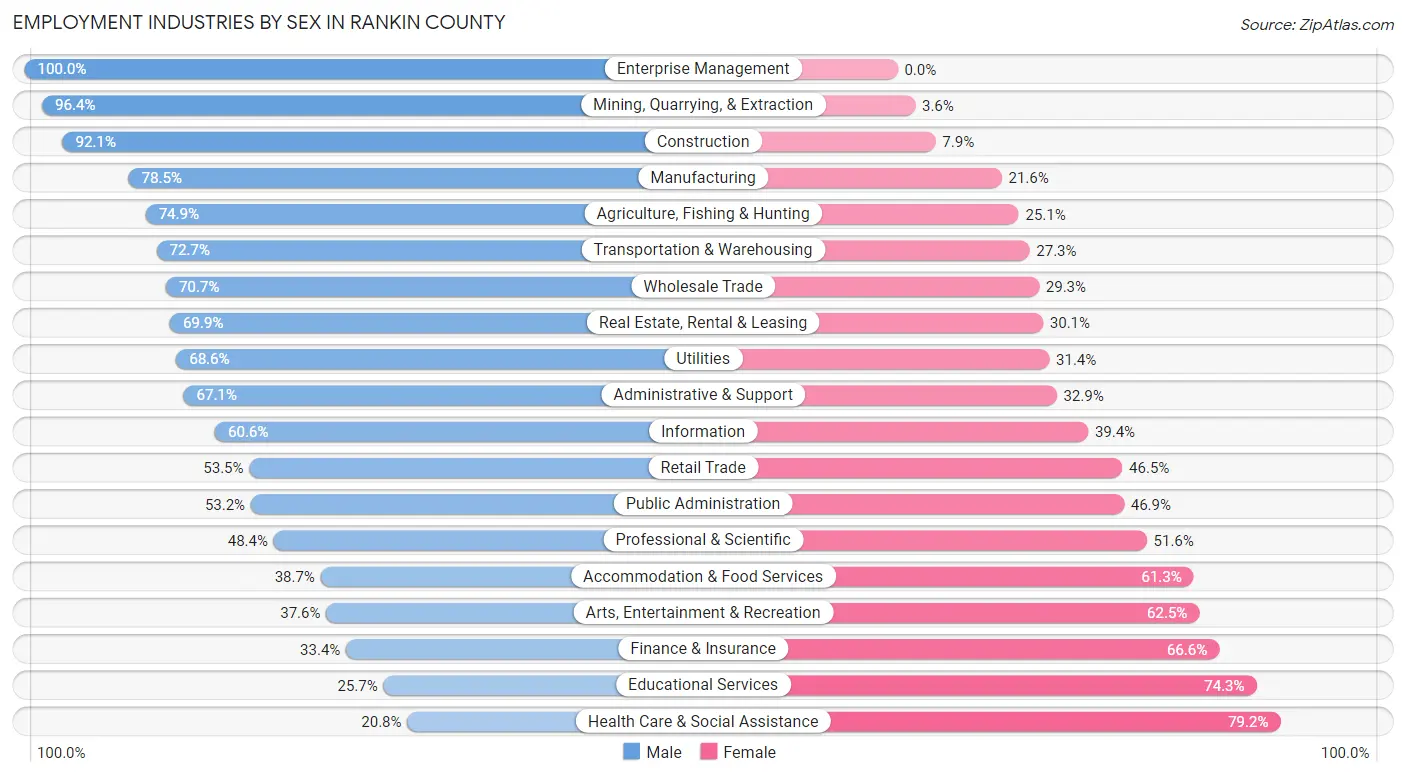
Employment Industries by Sex in Rankin County
The Rankin County industries that see more men than women are Enterprise Management (100.0%), Mining, Quarrying, & Extraction (96.4%), and Construction (92.1%), whereas the industries that tend to have a higher number of women are Health Care & Social Assistance (79.2%), Educational Services (74.3%), and Finance & Insurance (66.6%).
| Industry | Male | Female |
| Agriculture, Fishing & Hunting | 224 (74.9%) | 75 (25.1%) |
| Mining, Quarrying, & Extraction | 371 (96.4%) | 14 (3.6%) |
| Construction | 5,219 (92.1%) | 445 (7.9%) |
| Manufacturing | 4,804 (78.4%) | 1,320 (21.5%) |
| Wholesale Trade | 1,641 (70.7%) | 679 (29.3%) |
| Retail Trade | 4,704 (53.5%) | 4,091 (46.5%) |
| Transportation & Warehousing | 2,739 (72.7%) | 1,029 (27.3%) |
| Utilities | 581 (68.6%) | 266 (31.4%) |
| Information | 783 (60.6%) | 510 (39.4%) |
| Finance & Insurance | 1,597 (33.4%) | 3,179 (66.6%) |
| Real Estate, Rental & Leasing | 829 (69.9%) | 357 (30.1%) |
| Professional & Scientific | 1,809 (48.4%) | 1,927 (51.6%) |
| Enterprise Management | 5 (100.0%) | 0 (0.0%) |
| Administrative & Support | 1,679 (67.1%) | 824 (32.9%) |
| Educational Services | 1,887 (25.7%) | 5,453 (74.3%) |
| Health Care & Social Assistance | 2,745 (20.8%) | 10,468 (79.2%) |
| Arts, Entertainment & Recreation | 439 (37.6%) | 730 (62.5%) |
| Accommodation & Food Services | 1,866 (38.7%) | 2,954 (61.3%) |
| Public Administration | 2,673 (53.1%) | 2,356 (46.9%) |
| Total | 39,027 (50.5%) | 38,243 (49.5%) |
Education in Rankin County
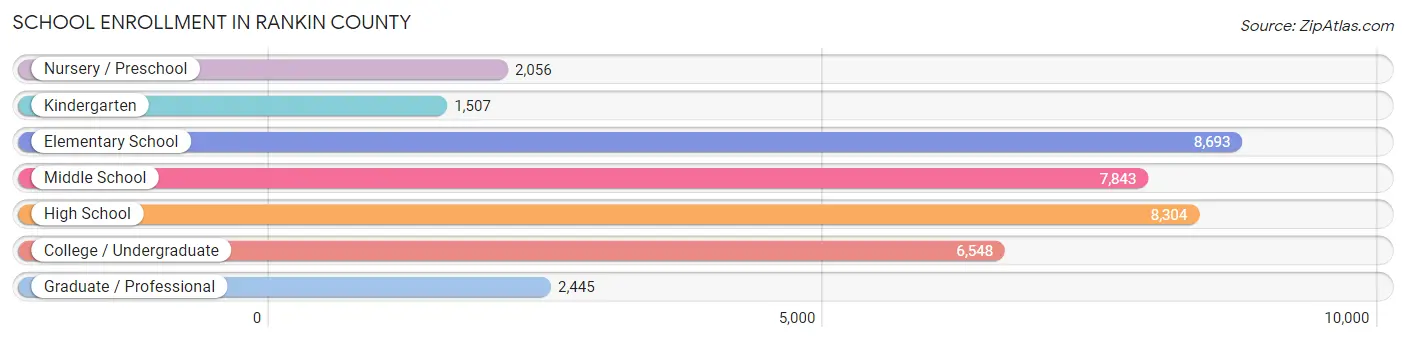
School Enrollment in Rankin County
The most common levels of schooling among the 37,396 students in Rankin County are elementary school (8,693 | 23.3%), high school (8,304 | 22.2%), and middle school (7,843 | 21.0%).
| School Level | # Students | % Students |
| Nursery / Preschool | 2,056 | 5.5% |
| Kindergarten | 1,507 | 4.0% |
| Elementary School | 8,693 | 23.3% |
| Middle School | 7,843 | 21.0% |
| High School | 8,304 | 22.2% |
| College / Undergraduate | 6,548 | 17.5% |
| Graduate / Professional | 2,445 | 6.5% |
| Total | 37,396 | 100.0% |
School Enrollment by Age by Funding Source in Rankin County
Out of a total of 37,396 students who are enrolled in schools in Rankin County, 6,656 (17.8%) attend a private institution, while the remaining 30,740 (82.2%) are enrolled in public schools. The age group of 3 to 4 year olds has the highest likelihood of being enrolled in private schools, with 957 (54.9% in the age bracket) enrolled. Conversely, the age group of 15 to 17 year olds has the lowest likelihood of being enrolled in a private school, with 5,661 (88.9% in the age bracket) attending a public institution.
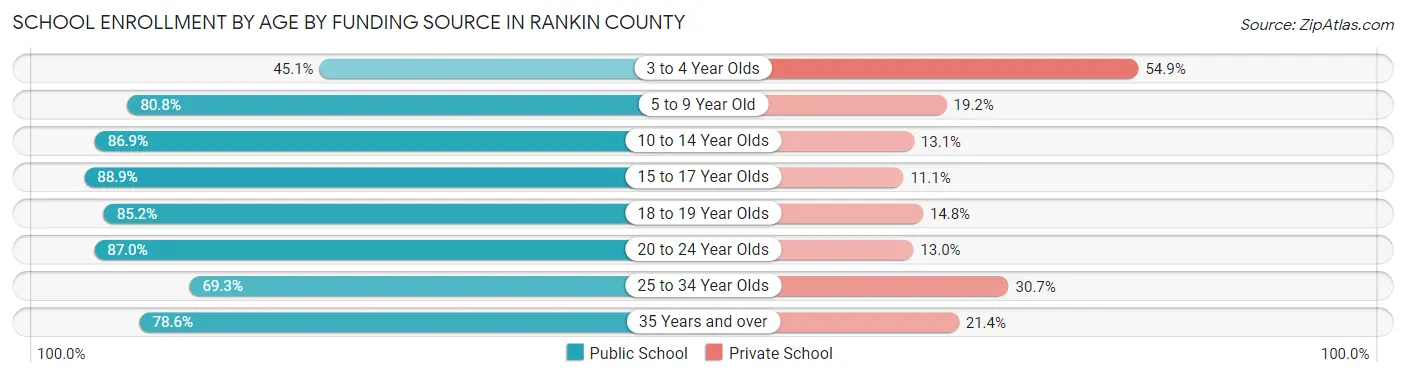
| Age Bracket | Public School | Private School |
| 3 to 4 Year Olds | 786 (45.1%) | 957 (54.9%) |
| 5 to 9 Year Old | 7,213 (80.8%) | 1,711 (19.2%) |
| 10 to 14 Year Olds | 8,881 (86.9%) | 1,336 (13.1%) |
| 15 to 17 Year Olds | 5,661 (88.9%) | 710 (11.1%) |
| 18 to 19 Year Olds | 2,117 (85.2%) | 367 (14.8%) |
| 20 to 24 Year Olds | 2,920 (87.0%) | 436 (13.0%) |
| 25 to 34 Year Olds | 1,522 (69.3%) | 675 (30.7%) |
| 35 Years and over | 1,653 (78.6%) | 451 (21.4%) |
| Total | 30,740 (82.2%) | 6,656 (17.8%) |
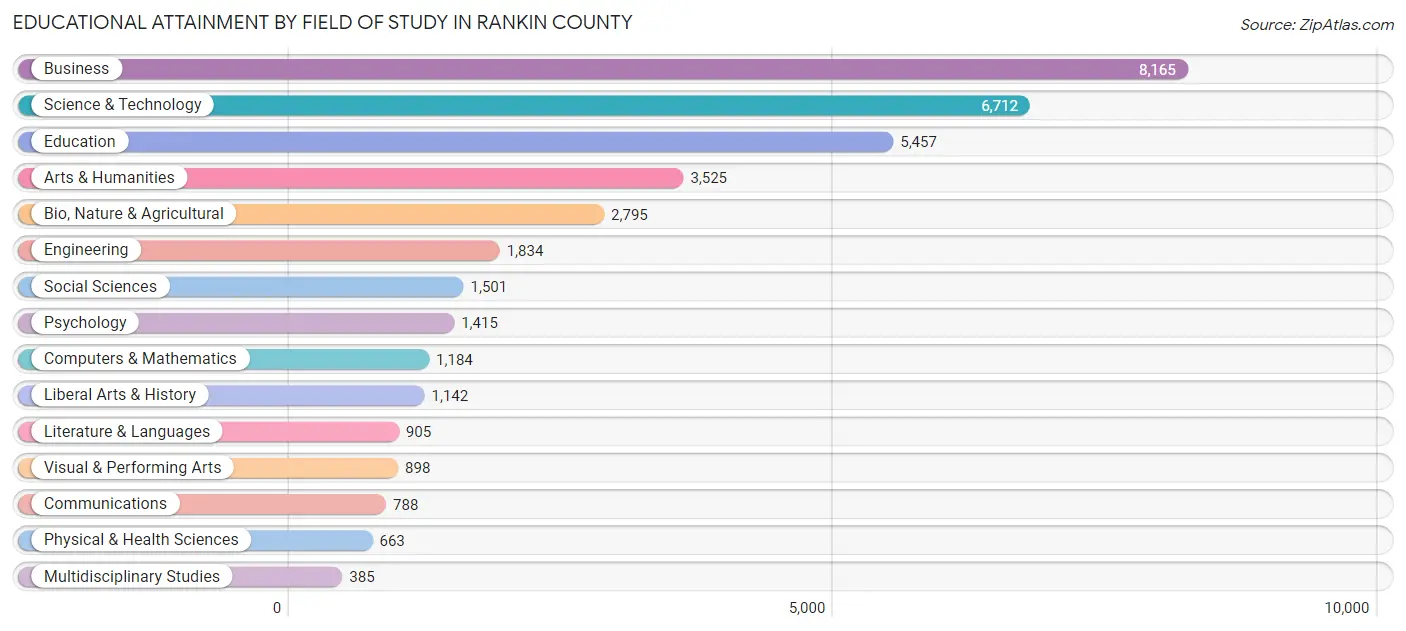
Educational Attainment by Field of Study in Rankin County
Business (8,165 | 21.8%), science & technology (6,712 | 18.0%), education (5,457 | 14.6%), arts & humanities (3,525 | 9.4%), and bio, nature & agricultural (2,795 | 7.5%) are the most common fields of study among 37,369 individuals in Rankin County who have obtained a bachelor's degree or higher.
| Field of Study | # Graduates | % Graduates |
| Computers & Mathematics | 1,184 | 3.2% |
| Bio, Nature & Agricultural | 2,795 | 7.5% |
| Physical & Health Sciences | 663 | 1.8% |
| Psychology | 1,415 | 3.8% |
| Social Sciences | 1,501 | 4.0% |
| Engineering | 1,834 | 4.9% |
| Multidisciplinary Studies | 385 | 1.0% |
| Science & Technology | 6,712 | 18.0% |
| Business | 8,165 | 21.8% |
| Education | 5,457 | 14.6% |
| Literature & Languages | 905 | 2.4% |
| Liberal Arts & History | 1,142 | 3.1% |
| Visual & Performing Arts | 898 | 2.4% |
| Communications | 788 | 2.1% |
| Arts & Humanities | 3,525 | 9.4% |
| Total | 37,369 | 100.0% |
Transportation & Commute in Rankin County
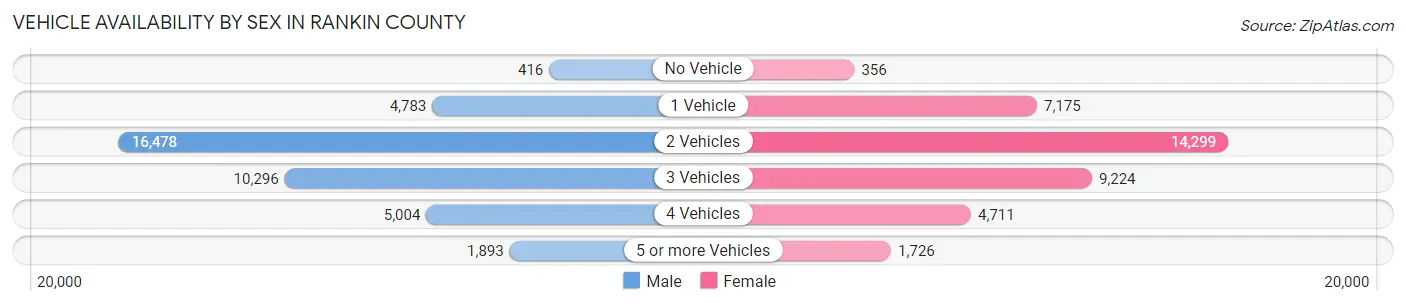
Vehicle Availability by Sex in Rankin County
The most prevalent vehicle ownership categories in Rankin County are males with 2 vehicles (16,478, accounting for 42.4%) and females with 2 vehicles (14,299, making up 44.0%).
| Vehicles Available | Male | Female |
| No Vehicle | 416 (1.1%) | 356 (0.9%) |
| 1 Vehicle | 4,783 (12.3%) | 7,175 (19.1%) |
| 2 Vehicles | 16,478 (42.4%) | 14,299 (38.1%) |
| 3 Vehicles | 10,296 (26.5%) | 9,224 (24.6%) |
| 4 Vehicles | 5,004 (12.9%) | 4,711 (12.6%) |
| 5 or more Vehicles | 1,893 (4.9%) | 1,726 (4.6%) |
| Total | 38,870 (100.0%) | 37,491 (100.0%) |
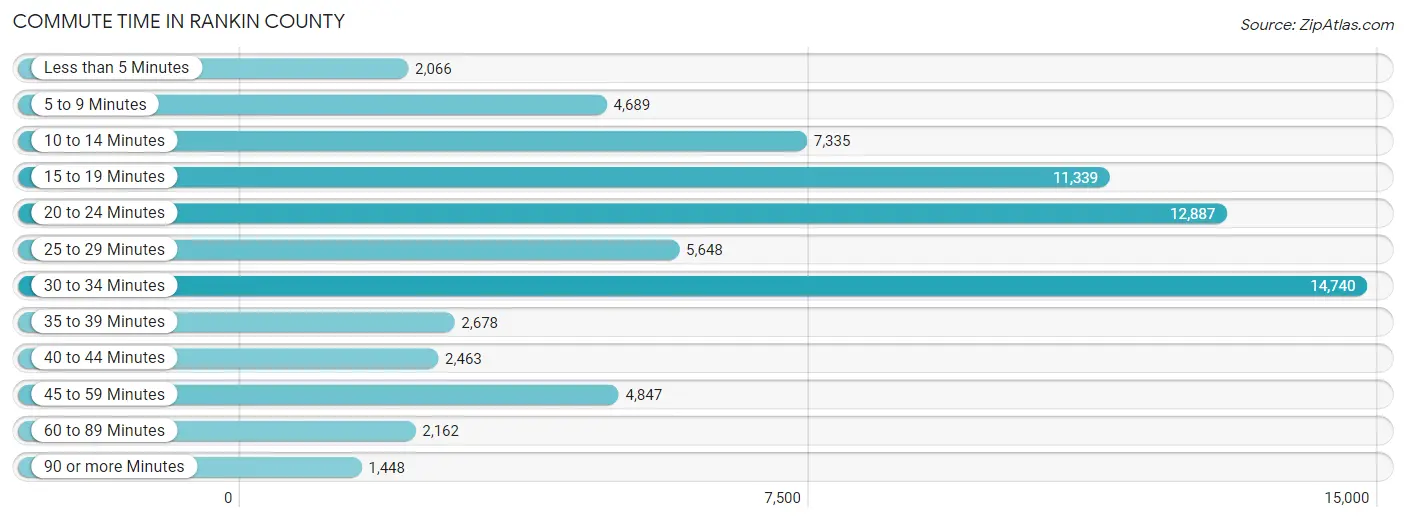
Commute Time in Rankin County
The most frequently occuring commute durations in Rankin County are 30 to 34 minutes (14,740 commuters, 20.4%), 20 to 24 minutes (12,887 commuters, 17.8%), and 15 to 19 minutes (11,339 commuters, 15.7%).
| Commute Time | # Commuters | % Commuters |
| Less than 5 Minutes | 2,066 | 2.9% |
| 5 to 9 Minutes | 4,689 | 6.5% |
| 10 to 14 Minutes | 7,335 | 10.1% |
| 15 to 19 Minutes | 11,339 | 15.7% |
| 20 to 24 Minutes | 12,887 | 17.8% |
| 25 to 29 Minutes | 5,648 | 7.8% |
| 30 to 34 Minutes | 14,740 | 20.4% |
| 35 to 39 Minutes | 2,678 | 3.7% |
| 40 to 44 Minutes | 2,463 | 3.4% |
| 45 to 59 Minutes | 4,847 | 6.7% |
| 60 to 89 Minutes | 2,162 | 3.0% |
| 90 or more Minutes | 1,448 | 2.0% |
Commute Time by Sex in Rankin County
The most common commute times in Rankin County are 30 to 34 minutes (7,125 commuters, 19.3%) for males and 30 to 34 minutes (7,615 commuters, 21.5%) for females.
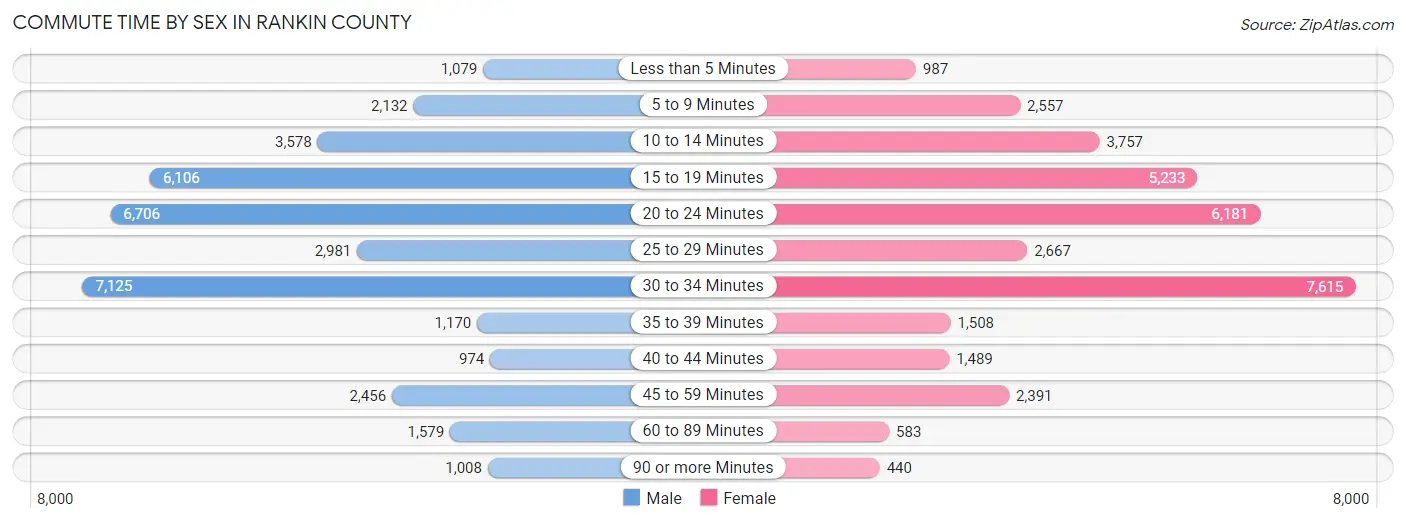
| Commute Time | Male | Female |
| Less than 5 Minutes | 1,079 (2.9%) | 987 (2.8%) |
| 5 to 9 Minutes | 2,132 (5.8%) | 2,557 (7.2%) |
| 10 to 14 Minutes | 3,578 (9.7%) | 3,757 (10.6%) |
| 15 to 19 Minutes | 6,106 (16.6%) | 5,233 (14.8%) |
| 20 to 24 Minutes | 6,706 (18.2%) | 6,181 (17.5%) |
| 25 to 29 Minutes | 2,981 (8.1%) | 2,667 (7.5%) |
| 30 to 34 Minutes | 7,125 (19.3%) | 7,615 (21.5%) |
| 35 to 39 Minutes | 1,170 (3.2%) | 1,508 (4.3%) |
| 40 to 44 Minutes | 974 (2.6%) | 1,489 (4.2%) |
| 45 to 59 Minutes | 2,456 (6.7%) | 2,391 (6.8%) |
| 60 to 89 Minutes | 1,579 (4.3%) | 583 (1.7%) |
| 90 or more Minutes | 1,008 (2.7%) | 440 (1.2%) |
Time of Departure to Work by Sex in Rankin County
The most frequent times of departure to work in Rankin County are 7:00 AM to 7:29 AM (7,996, 21.7%) for males and 7:00 AM to 7:29 AM (9,270, 26.2%) for females.
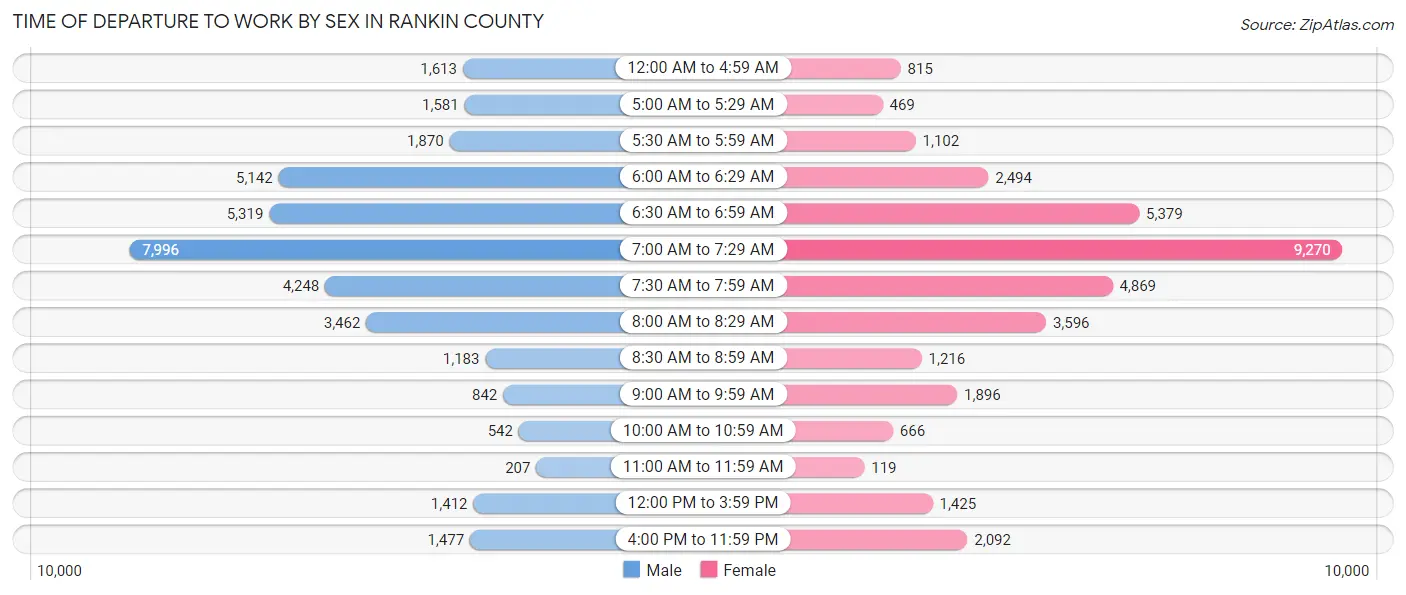
| Time of Departure | Male | Female |
| 12:00 AM to 4:59 AM | 1,613 (4.4%) | 815 (2.3%) |
| 5:00 AM to 5:29 AM | 1,581 (4.3%) | 469 (1.3%) |
| 5:30 AM to 5:59 AM | 1,870 (5.1%) | 1,102 (3.1%) |
| 6:00 AM to 6:29 AM | 5,142 (13.9%) | 2,494 (7.0%) |
| 6:30 AM to 6:59 AM | 5,319 (14.4%) | 5,379 (15.2%) |
| 7:00 AM to 7:29 AM | 7,996 (21.7%) | 9,270 (26.2%) |
| 7:30 AM to 7:59 AM | 4,248 (11.5%) | 4,869 (13.8%) |
| 8:00 AM to 8:29 AM | 3,462 (9.4%) | 3,596 (10.2%) |
| 8:30 AM to 8:59 AM | 1,183 (3.2%) | 1,216 (3.4%) |
| 9:00 AM to 9:59 AM | 842 (2.3%) | 1,896 (5.3%) |
| 10:00 AM to 10:59 AM | 542 (1.5%) | 666 (1.9%) |
| 11:00 AM to 11:59 AM | 207 (0.6%) | 119 (0.3%) |
| 12:00 PM to 3:59 PM | 1,412 (3.8%) | 1,425 (4.0%) |
| 4:00 PM to 11:59 PM | 1,477 (4.0%) | 2,092 (5.9%) |
| Total | 36,894 (100.0%) | 35,408 (100.0%) |
Housing Occupancy in Rankin County
Occupancy by Ownership in Rankin County
Of the total 58,982 dwellings in Rankin County, owner-occupied units account for 45,381 (76.9%), while renter-occupied units make up 13,601 (23.1%).
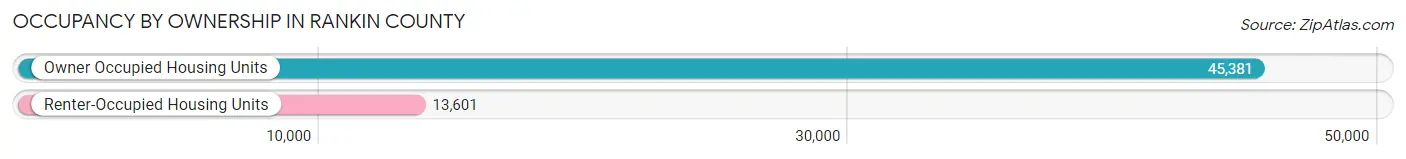
| Occupancy | # Housing Units | % Housing Units |
| Owner Occupied Housing Units | 45,381 | 76.9% |
| Renter-Occupied Housing Units | 13,601 | 23.1% |
| Total Occupied Housing Units | 58,982 | 100.0% |
Occupancy by Household Size in Rankin County
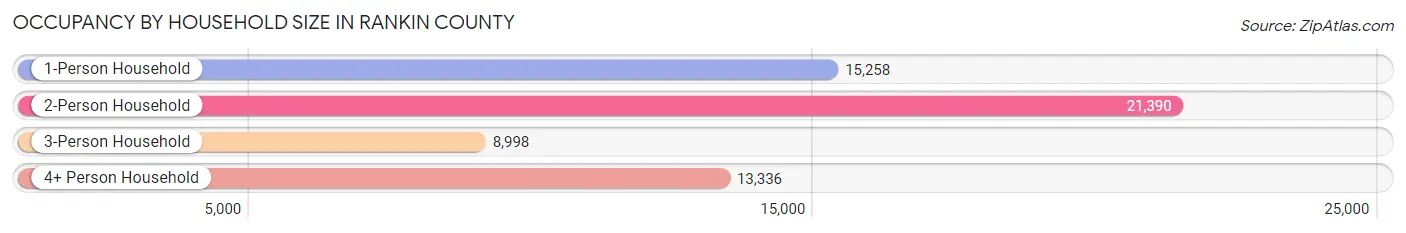
| Household Size | # Housing Units | % Housing Units |
| 1-Person Household | 15,258 | 25.9% |
| 2-Person Household | 21,390 | 36.3% |
| 3-Person Household | 8,998 | 15.3% |
| 4+ Person Household | 13,336 | 22.6% |
| Total Housing Units | 58,982 | 100.0% |
Occupancy by Ownership by Household Size in Rankin County
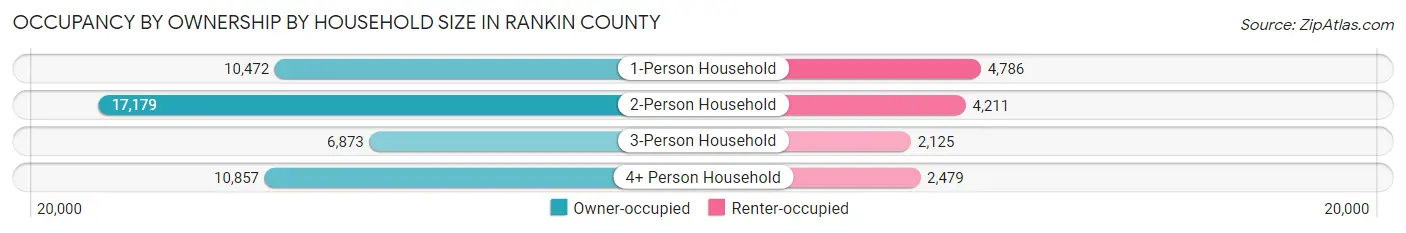
| Household Size | Owner-occupied | Renter-occupied |
| 1-Person Household | 10,472 (68.6%) | 4,786 (31.4%) |
| 2-Person Household | 17,179 (80.3%) | 4,211 (19.7%) |
| 3-Person Household | 6,873 (76.4%) | 2,125 (23.6%) |
| 4+ Person Household | 10,857 (81.4%) | 2,479 (18.6%) |
| Total Housing Units | 45,381 (76.9%) | 13,601 (23.1%) |
Occupancy by Educational Attainment in Rankin County
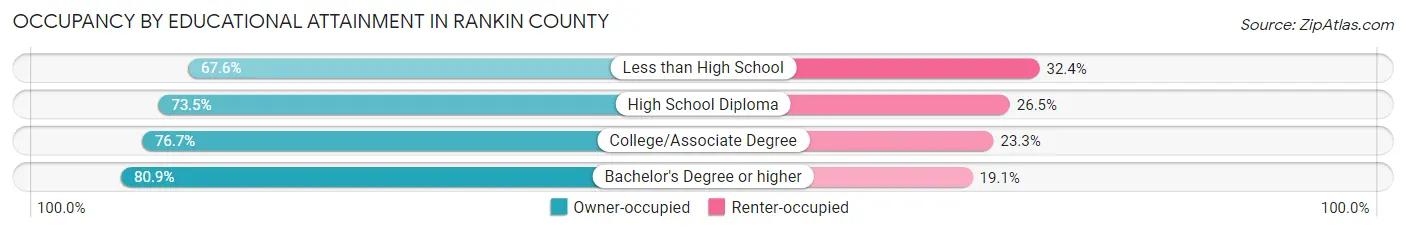
| Household Size | Owner-occupied | Renter-occupied |
| Less than High School | 2,788 (67.6%) | 1,336 (32.4%) |
| High School Diploma | 9,440 (73.5%) | 3,406 (26.5%) |
| College/Associate Degree | 15,237 (76.7%) | 4,620 (23.3%) |
| Bachelor's Degree or higher | 17,916 (80.9%) | 4,239 (19.1%) |
Occupancy by Age of Householder in Rankin County
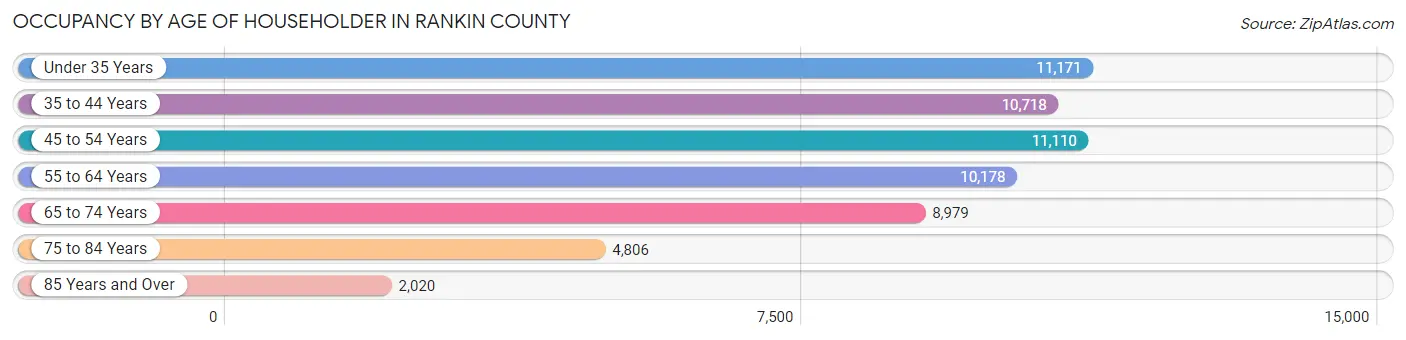
| Age Bracket | # Households | % Households |
| Under 35 Years | 11,171 | 18.9% |
| 35 to 44 Years | 10,718 | 18.2% |
| 45 to 54 Years | 11,110 | 18.8% |
| 55 to 64 Years | 10,178 | 17.3% |
| 65 to 74 Years | 8,979 | 15.2% |
| 75 to 84 Years | 4,806 | 8.2% |
| 85 Years and Over | 2,020 | 3.4% |
| Total | 58,982 | 100.0% |
Housing Finances in Rankin County
Median Income by Occupancy in Rankin County
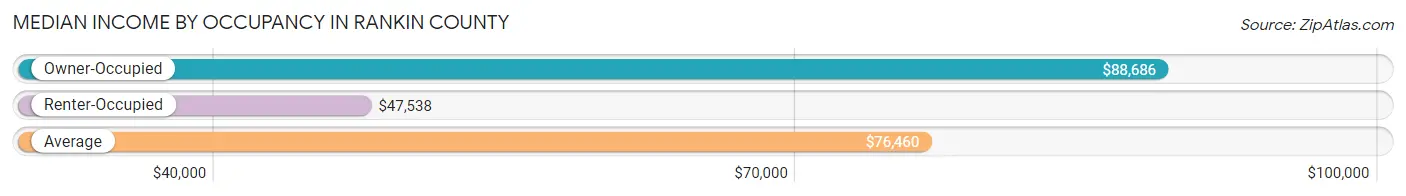
| Occupancy Type | # Households | Median Income |
| Owner-Occupied | 45,381 (76.9%) | $88,686 |
| Renter-Occupied | 13,601 (23.1%) | $47,538 |
| Average | 58,982 (100.0%) | $76,460 |
Occupancy by Householder Income Bracket in Rankin County
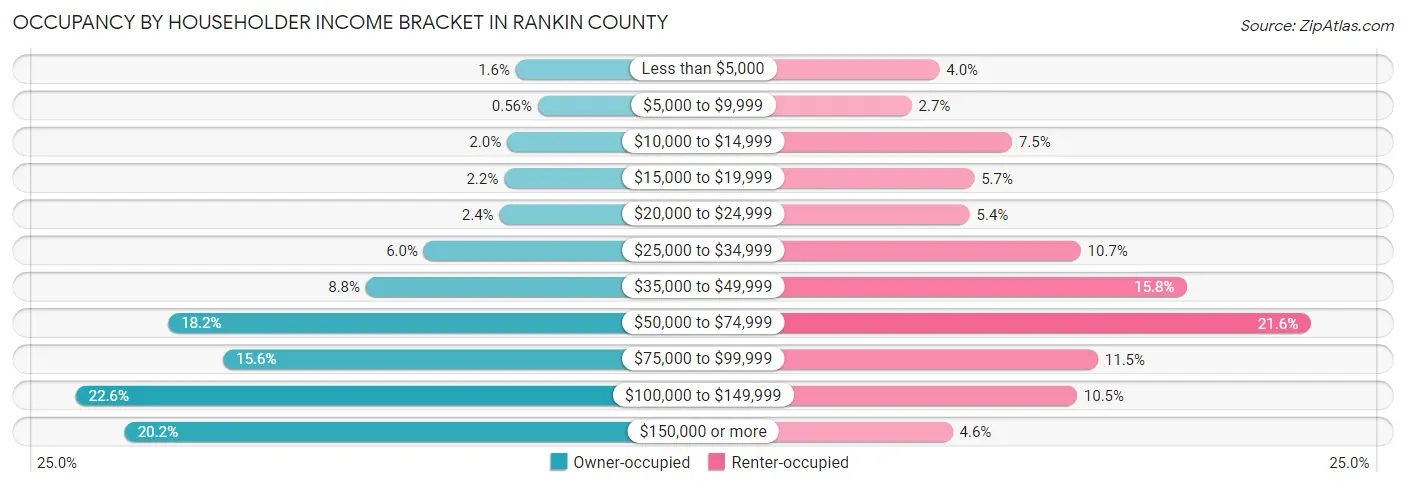
| Income Bracket | Owner-occupied | Renter-occupied |
| Less than $5,000 | 730 (1.6%) | 543 (4.0%) |
| $5,000 to $9,999 | 252 (0.6%) | 363 (2.7%) |
| $10,000 to $14,999 | 923 (2.0%) | 1,013 (7.4%) |
| $15,000 to $19,999 | 984 (2.2%) | 769 (5.7%) |
| $20,000 to $24,999 | 1,084 (2.4%) | 738 (5.4%) |
| $25,000 to $34,999 | 2,717 (6.0%) | 1,458 (10.7%) |
| $35,000 to $49,999 | 3,970 (8.7%) | 2,142 (15.8%) |
| $50,000 to $74,999 | 8,241 (18.2%) | 2,943 (21.6%) |
| $75,000 to $99,999 | 7,057 (15.5%) | 1,570 (11.5%) |
| $100,000 to $149,999 | 10,241 (22.6%) | 1,434 (10.5%) |
| $150,000 or more | 9,182 (20.2%) | 628 (4.6%) |
| Total | 45,381 (100.0%) | 13,601 (100.0%) |
Monthly Housing Cost Tiers in Rankin County
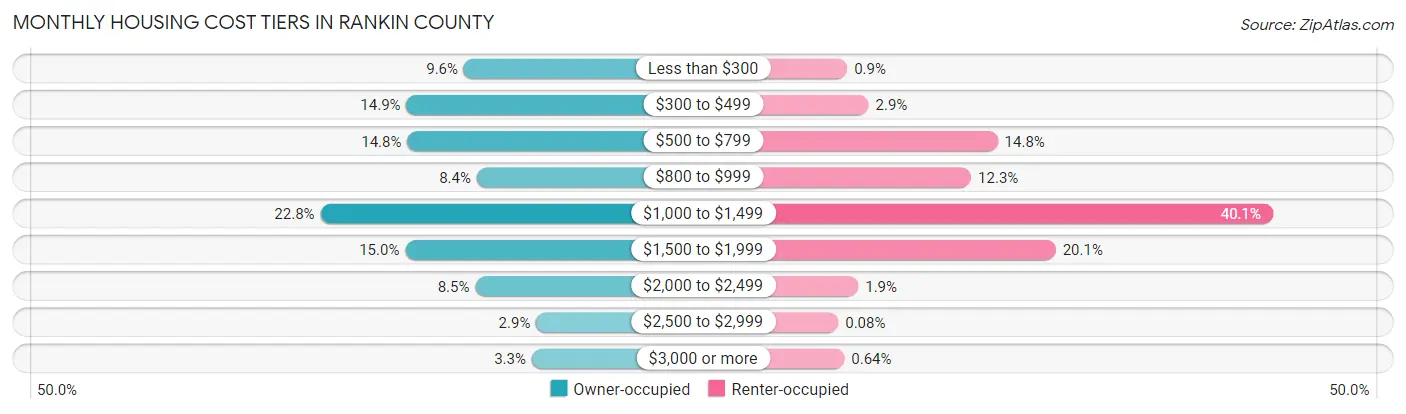
| Monthly Cost | Owner-occupied | Renter-occupied |
| Less than $300 | 4,339 (9.6%) | 122 (0.9%) |
| $300 to $499 | 6,739 (14.8%) | 390 (2.9%) |
| $500 to $799 | 6,704 (14.8%) | 2,006 (14.7%) |
| $800 to $999 | 3,799 (8.4%) | 1,674 (12.3%) |
| $1,000 to $1,499 | 10,333 (22.8%) | 5,451 (40.1%) |
| $1,500 to $1,999 | 6,789 (15.0%) | 2,734 (20.1%) |
| $2,000 to $2,499 | 3,863 (8.5%) | 261 (1.9%) |
| $2,500 to $2,999 | 1,315 (2.9%) | 11 (0.1%) |
| $3,000 or more | 1,500 (3.3%) | 87 (0.6%) |
| Total | 45,381 (100.0%) | 13,601 (100.0%) |
Physical Housing Characteristics in Rankin County
Housing Structures in Rankin County
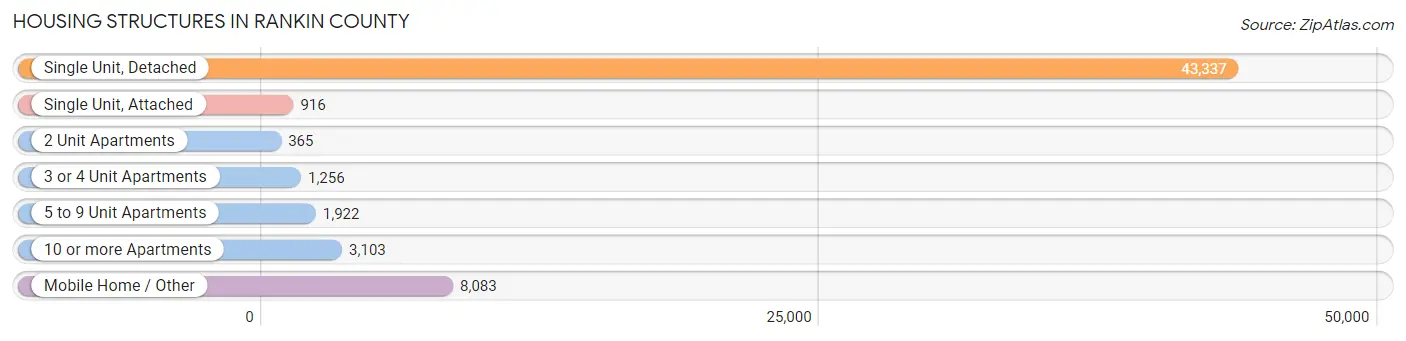
| Structure Type | # Housing Units | % Housing Units |
| Single Unit, Detached | 43,337 | 73.5% |
| Single Unit, Attached | 916 | 1.5% |
| 2 Unit Apartments | 365 | 0.6% |
| 3 or 4 Unit Apartments | 1,256 | 2.1% |
| 5 to 9 Unit Apartments | 1,922 | 3.3% |
| 10 or more Apartments | 3,103 | 5.3% |
| Mobile Home / Other | 8,083 | 13.7% |
| Total | 58,982 | 100.0% |
Housing Structures by Occupancy in Rankin County
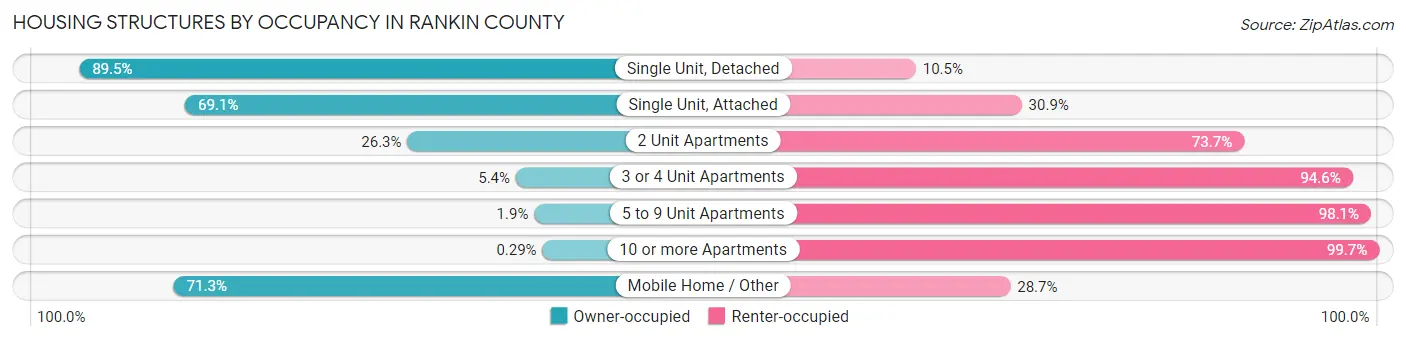
| Structure Type | Owner-occupied | Renter-occupied |
| Single Unit, Detached | 38,777 (89.5%) | 4,560 (10.5%) |
| Single Unit, Attached | 633 (69.1%) | 283 (30.9%) |
| 2 Unit Apartments | 96 (26.3%) | 269 (73.7%) |
| 3 or 4 Unit Apartments | 68 (5.4%) | 1,188 (94.6%) |
| 5 to 9 Unit Apartments | 36 (1.9%) | 1,886 (98.1%) |
| 10 or more Apartments | 9 (0.3%) | 3,094 (99.7%) |
| Mobile Home / Other | 5,762 (71.3%) | 2,321 (28.7%) |
| Total | 45,381 (76.9%) | 13,601 (23.1%) |
Housing Structures by Number of Rooms in Rankin County
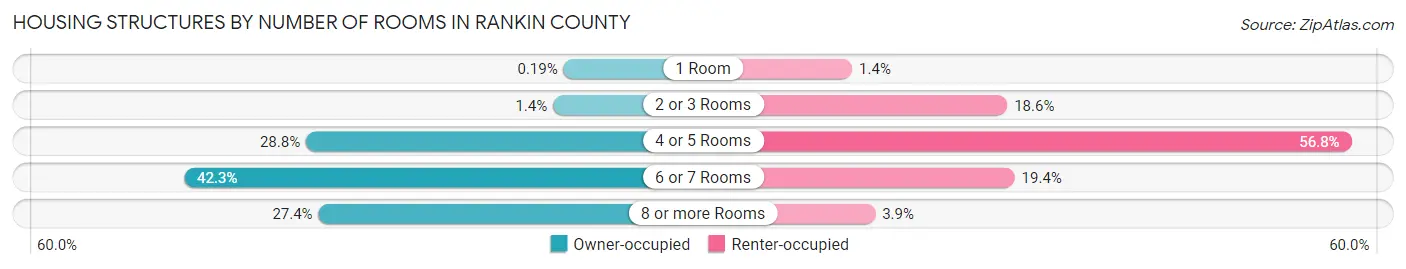
| Number of Rooms | Owner-occupied | Renter-occupied |
| 1 Room | 86 (0.2%) | 185 (1.4%) |
| 2 or 3 Rooms | 612 (1.3%) | 2,526 (18.6%) |
| 4 or 5 Rooms | 13,058 (28.8%) | 7,720 (56.8%) |
| 6 or 7 Rooms | 19,196 (42.3%) | 2,637 (19.4%) |
| 8 or more Rooms | 12,429 (27.4%) | 533 (3.9%) |
| Total | 45,381 (100.0%) | 13,601 (100.0%) |
Housing Structure by Heating Type in Rankin County
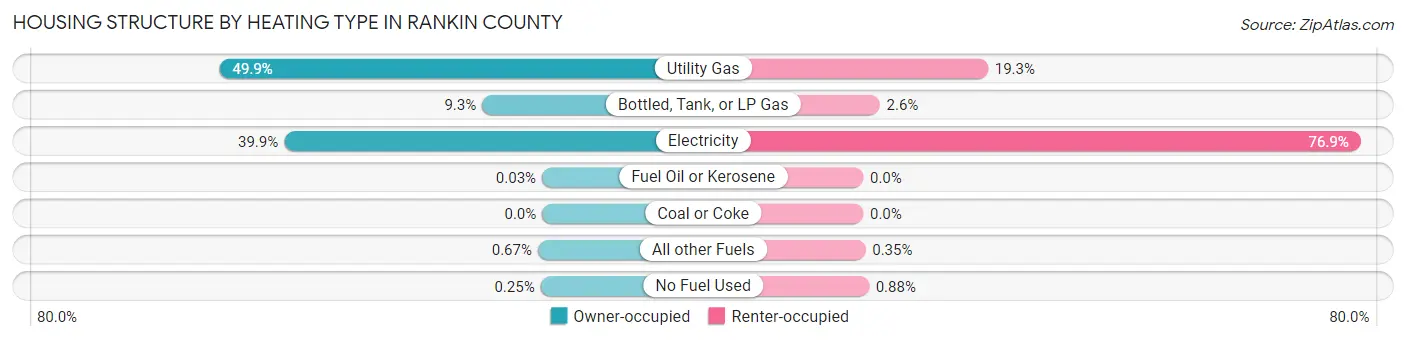
| Heating Type | Owner-occupied | Renter-occupied |
| Utility Gas | 22,638 (49.9%) | 2,623 (19.3%) |
| Bottled, Tank, or LP Gas | 4,210 (9.3%) | 348 (2.6%) |
| Electricity | 18,103 (39.9%) | 10,462 (76.9%) |
| Fuel Oil or Kerosene | 12 (0.0%) | 0 (0.0%) |
| Coal or Coke | 0 (0.0%) | 0 (0.0%) |
| All other Fuels | 304 (0.7%) | 48 (0.4%) |
| No Fuel Used | 114 (0.3%) | 120 (0.9%) |
| Total | 45,381 (100.0%) | 13,601 (100.0%) |
Household Vehicle Usage in Rankin County
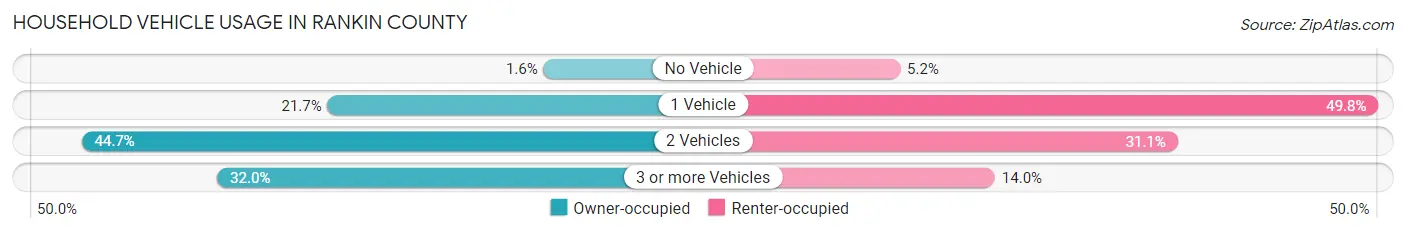
| Vehicles per Household | Owner-occupied | Renter-occupied |
| No Vehicle | 710 (1.6%) | 701 (5.1%) |
| 1 Vehicle | 9,859 (21.7%) | 6,772 (49.8%) |
| 2 Vehicles | 20,283 (44.7%) | 4,224 (31.1%) |
| 3 or more Vehicles | 14,529 (32.0%) | 1,904 (14.0%) |
| Total | 45,381 (100.0%) | 13,601 (100.0%) |
Real Estate & Mortgages in Rankin County
Real Estate and Mortgage Overview in Rankin County
| Characteristic | Without Mortgage | With Mortgage |
| Housing Units | 17,407 | 27,974 |
| Median Property Value | $176,900 | $218,100 |
| Median Household Income | $63,964 | $6,855 |
| Monthly Housing Costs | $436 | $1,482 |
| Real Estate Taxes | $980 | $1,579 |
Property Value by Mortgage Status in Rankin County
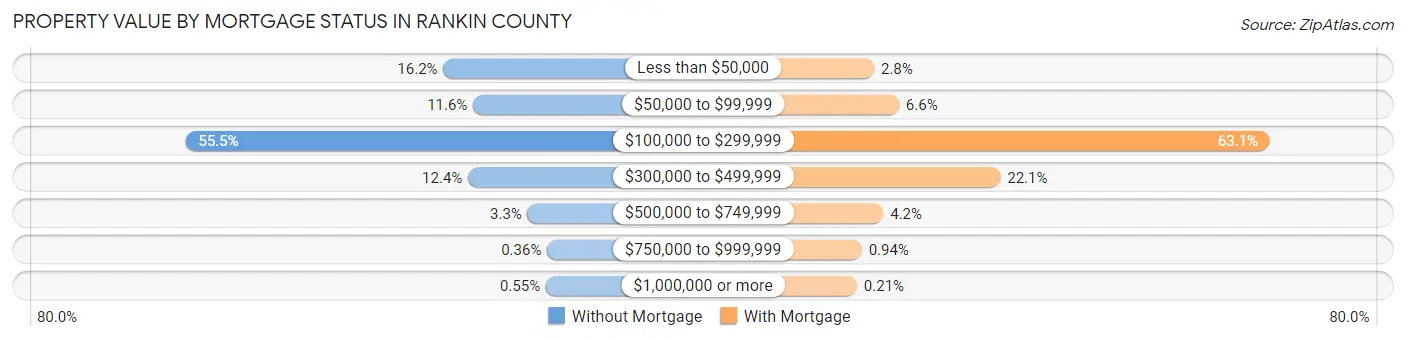
| Property Value | Without Mortgage | With Mortgage |
| Less than $50,000 | 2,817 (16.2%) | 785 (2.8%) |
| $50,000 to $99,999 | 2,026 (11.6%) | 1,850 (6.6%) |
| $100,000 to $299,999 | 9,662 (55.5%) | 17,664 (63.1%) |
| $300,000 to $499,999 | 2,161 (12.4%) | 6,171 (22.1%) |
| $500,000 to $749,999 | 582 (3.3%) | 1,182 (4.2%) |
| $750,000 to $999,999 | 63 (0.4%) | 264 (0.9%) |
| $1,000,000 or more | 96 (0.5%) | 58 (0.2%) |
| Total | 17,407 (100.0%) | 27,974 (100.0%) |
Household Income by Mortgage Status in Rankin County
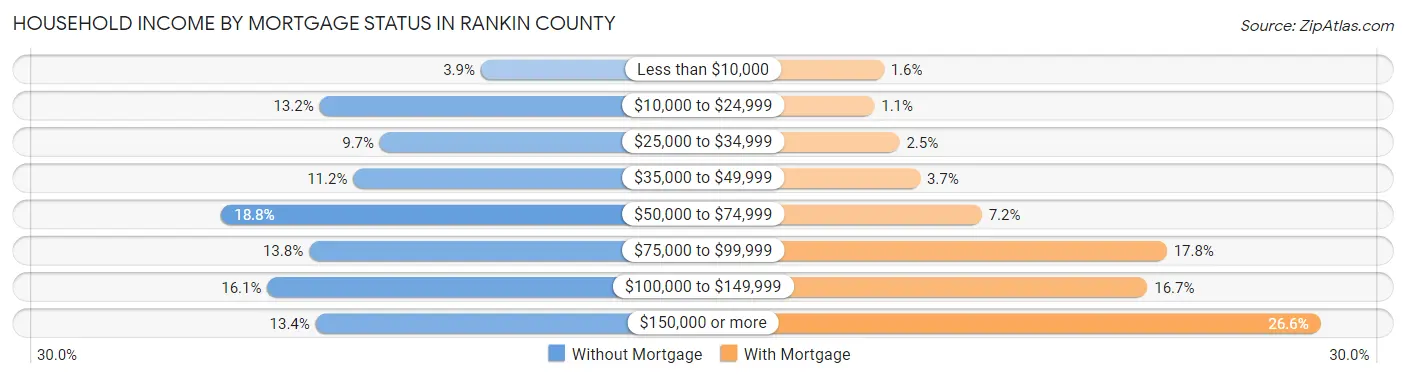
| Household Income | Without Mortgage | With Mortgage |
| Less than $10,000 | 684 (3.9%) | 451 (1.6%) |
| $10,000 to $24,999 | 2,289 (13.2%) | 298 (1.1%) |
| $25,000 to $34,999 | 1,688 (9.7%) | 702 (2.5%) |
| $35,000 to $49,999 | 1,953 (11.2%) | 1,029 (3.7%) |
| $50,000 to $74,999 | 3,266 (18.8%) | 2,017 (7.2%) |
| $75,000 to $99,999 | 2,393 (13.8%) | 4,975 (17.8%) |
| $100,000 to $149,999 | 2,807 (16.1%) | 4,664 (16.7%) |
| $150,000 or more | 2,327 (13.4%) | 7,434 (26.6%) |
| Total | 17,407 (100.0%) | 27,974 (100.0%) |
Property Value to Household Income Ratio in Rankin County
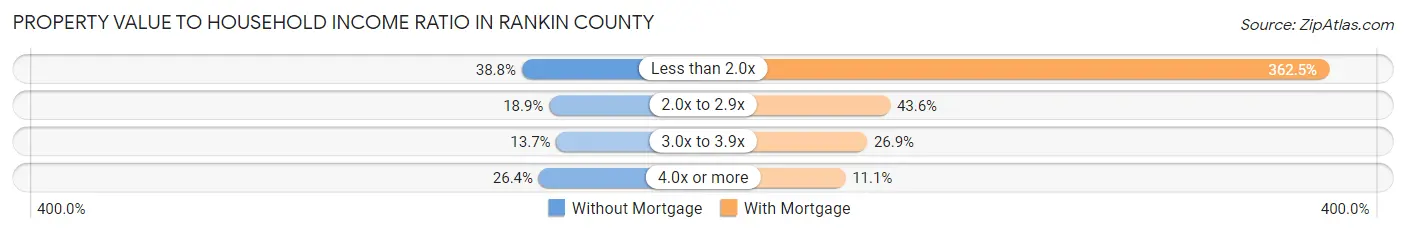
| Value-to-Income Ratio | Without Mortgage | With Mortgage |
| Less than 2.0x | 6,760 (38.8%) | 101,401 (362.5%) |
| 2.0x to 2.9x | 3,294 (18.9%) | 12,193 (43.6%) |
| 3.0x to 3.9x | 2,380 (13.7%) | 7,527 (26.9%) |
| 4.0x or more | 4,597 (26.4%) | 3,101 (11.1%) |
| Total | 17,407 (100.0%) | 27,974 (100.0%) |
Real Estate Taxes by Mortgage Status in Rankin County
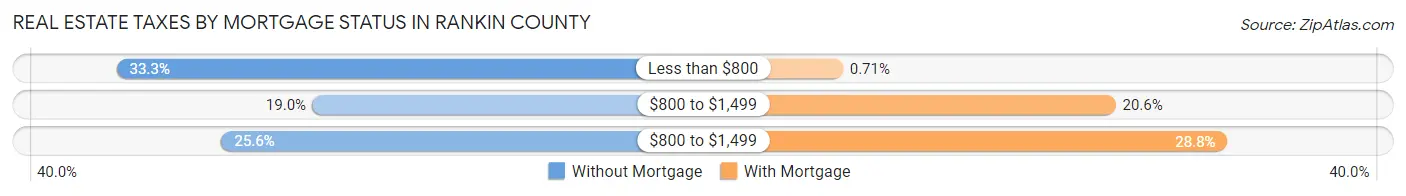
| Property Taxes | Without Mortgage | With Mortgage |
| Less than $800 | 5,793 (33.3%) | 199 (0.7%) |
| $800 to $1,499 | 3,309 (19.0%) | 5,774 (20.6%) |
| $800 to $1,499 | 4,459 (25.6%) | 8,058 (28.8%) |
| Total | 17,407 (100.0%) | 27,974 (100.0%) |
Health & Disability in Rankin County
Health Insurance Coverage by Age in Rankin County
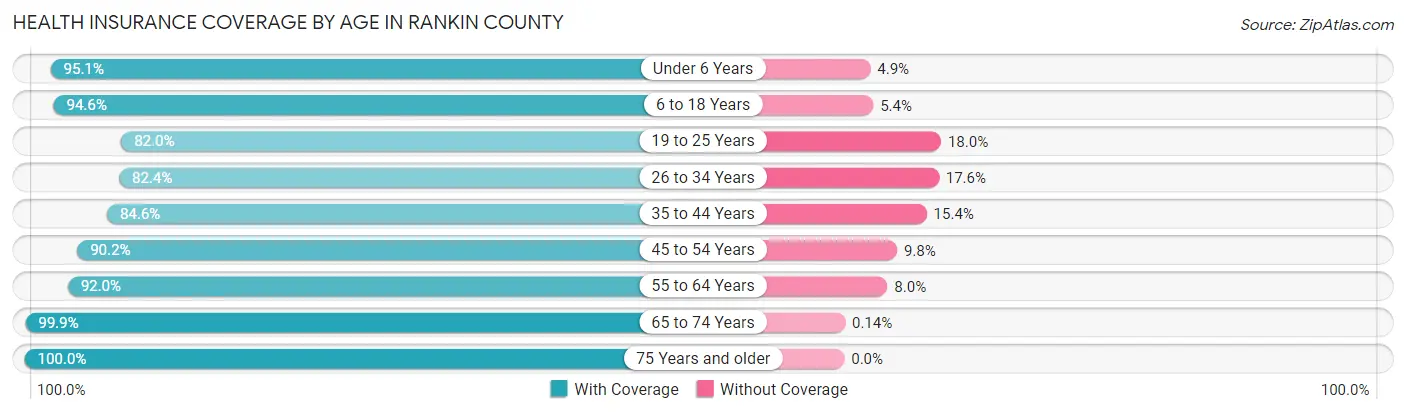
| Age Bracket | With Coverage | Without Coverage |
| Under 6 Years | 9,509 (95.1%) | 486 (4.9%) |
| 6 to 18 Years | 25,649 (94.6%) | 1,463 (5.4%) |
| 19 to 25 Years | 10,414 (82.0%) | 2,291 (18.0%) |
| 26 to 34 Years | 14,789 (82.4%) | 3,163 (17.6%) |
| 35 to 44 Years | 17,870 (84.6%) | 3,244 (15.4%) |
| 45 to 54 Years | 17,971 (90.2%) | 1,958 (9.8%) |
| 55 to 64 Years | 16,979 (92.0%) | 1,485 (8.0%) |
| 65 to 74 Years | 14,680 (99.9%) | 20 (0.1%) |
| 75 Years and older | 9,834 (100.0%) | 0 (0.0%) |
| Total | 137,695 (90.7%) | 14,110 (9.3%) |
Health Insurance Coverage by Citizenship Status in Rankin County
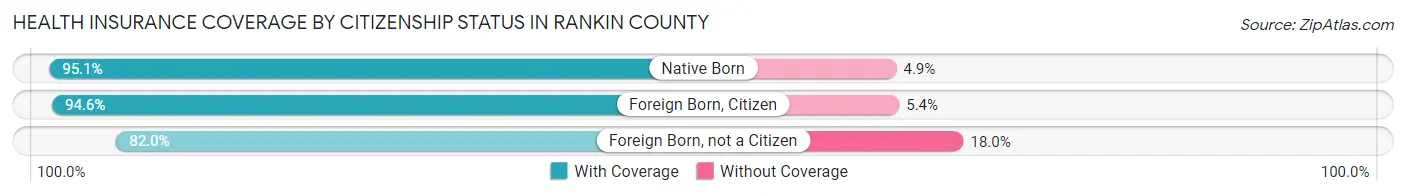
| Citizenship Status | With Coverage | Without Coverage |
| Native Born | 9,509 (95.1%) | 486 (4.9%) |
| Foreign Born, Citizen | 25,649 (94.6%) | 1,463 (5.4%) |
| Foreign Born, not a Citizen | 10,414 (82.0%) | 2,291 (18.0%) |
Health Insurance Coverage by Household Income in Rankin County
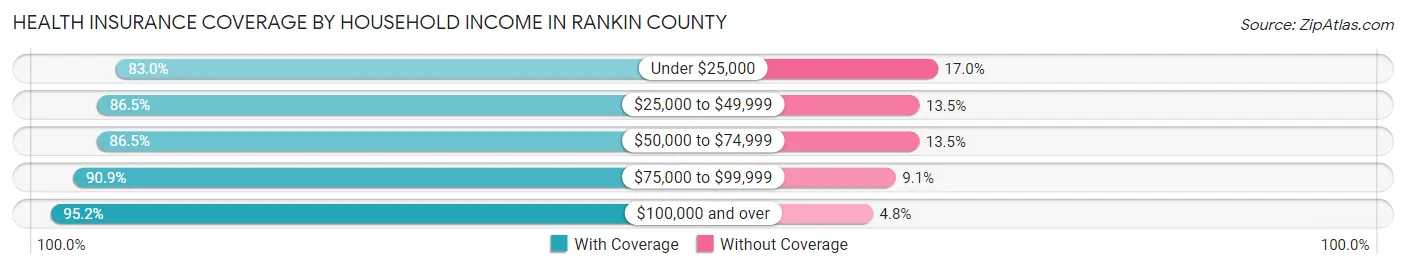
| Household Income | With Coverage | Without Coverage |
| Under $25,000 | 11,053 (83.0%) | 2,263 (17.0%) |
| $25,000 to $49,999 | 18,495 (86.5%) | 2,897 (13.5%) |
| $50,000 to $74,999 | 22,507 (86.5%) | 3,509 (13.5%) |
| $75,000 to $99,999 | 20,878 (90.9%) | 2,091 (9.1%) |
| $100,000 and over | 64,210 (95.2%) | 3,268 (4.8%) |
Public vs Private Health Insurance Coverage by Age in Rankin County
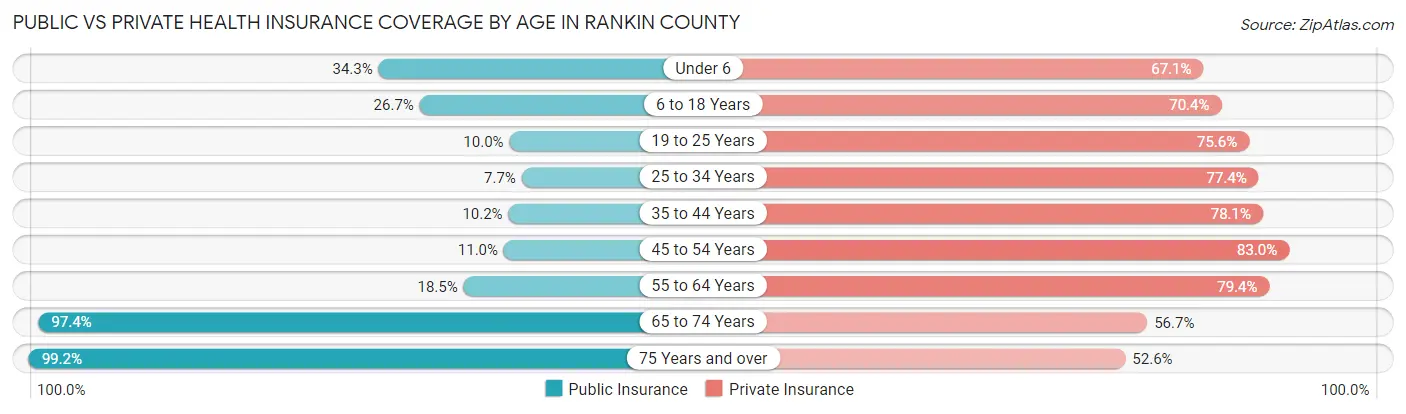
| Age Bracket | Public Insurance | Private Insurance |
| Under 6 | 3,428 (34.3%) | 6,706 (67.1%) |
| 6 to 18 Years | 7,232 (26.7%) | 19,097 (70.4%) |
| 19 to 25 Years | 1,272 (10.0%) | 9,603 (75.6%) |
| 25 to 34 Years | 1,387 (7.7%) | 13,890 (77.4%) |
| 35 to 44 Years | 2,152 (10.2%) | 16,498 (78.1%) |
| 45 to 54 Years | 2,200 (11.0%) | 16,543 (83.0%) |
| 55 to 64 Years | 3,419 (18.5%) | 14,652 (79.3%) |
| 65 to 74 Years | 14,322 (97.4%) | 8,333 (56.7%) |
| 75 Years and over | 9,758 (99.2%) | 5,177 (52.6%) |
| Total | 45,170 (29.8%) | 110,499 (72.8%) |
Disability Status by Sex by Age in Rankin County

| Age Bracket | Male | Female |
| Under 5 Years | 0 (0.0%) | 31 (0.7%) |
| 5 to 17 Years | 1,411 (10.2%) | 577 (4.4%) |
| 18 to 34 Years | 725 (4.7%) | 1,030 (6.1%) |
| 35 to 64 Years | 4,145 (14.6%) | 3,861 (12.4%) |
| 65 to 74 Years | 2,324 (35.4%) | 1,981 (24.3%) |
| 75 Years and over | 1,562 (40.0%) | 3,282 (55.4%) |
Disability Class by Sex by Age in Rankin County
Disability Class: Hearing Difficulty
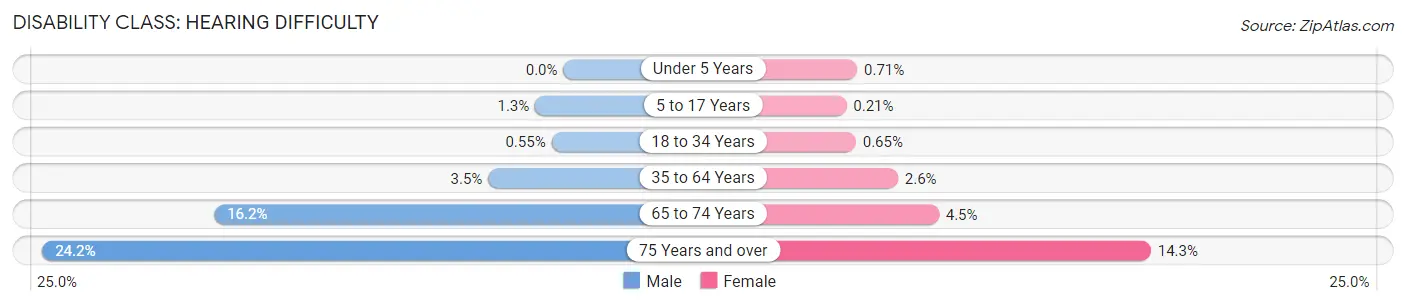
| Age Bracket | Male | Female |
| Under 5 Years | 0 (0.0%) | 31 (0.7%) |
| 5 to 17 Years | 180 (1.3%) | 27 (0.2%) |
| 18 to 34 Years | 85 (0.5%) | 109 (0.6%) |
| 35 to 64 Years | 991 (3.5%) | 807 (2.6%) |
| 65 to 74 Years | 1,064 (16.2%) | 366 (4.5%) |
| 75 Years and over | 945 (24.2%) | 850 (14.3%) |
Disability Class: Vision Difficulty
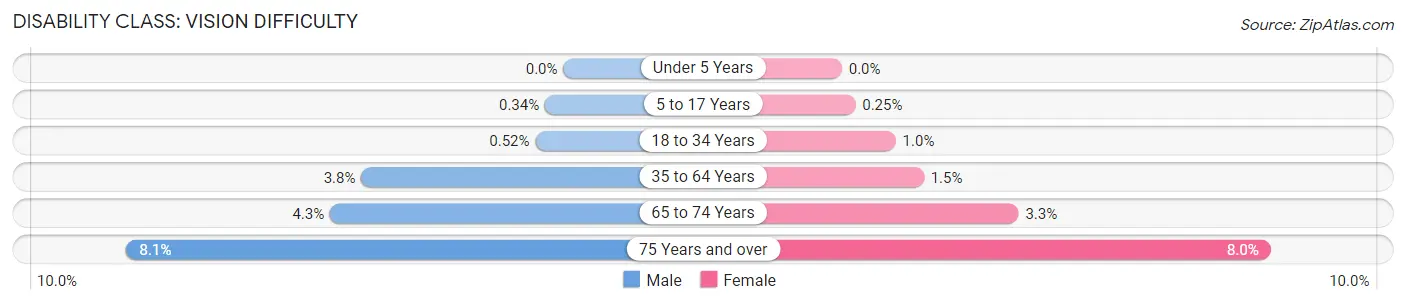
| Age Bracket | Male | Female |
| Under 5 Years | 0 (0.0%) | 0 (0.0%) |
| 5 to 17 Years | 47 (0.3%) | 33 (0.3%) |
| 18 to 34 Years | 80 (0.5%) | 168 (1.0%) |
| 35 to 64 Years | 1,065 (3.7%) | 471 (1.5%) |
| 65 to 74 Years | 284 (4.3%) | 267 (3.3%) |
| 75 Years and over | 317 (8.1%) | 472 (8.0%) |
Disability Class: Cognitive Difficulty
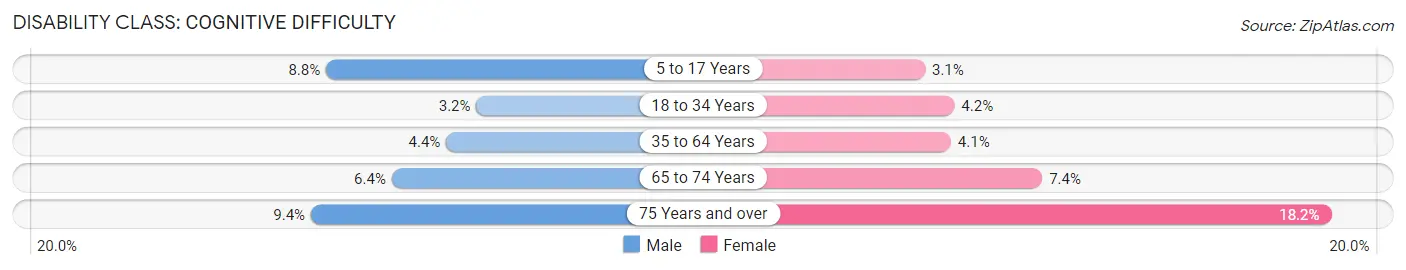
| Age Bracket | Male | Female |
| 5 to 17 Years | 1,214 (8.8%) | 403 (3.1%) |
| 18 to 34 Years | 501 (3.2%) | 702 (4.2%) |
| 35 to 64 Years | 1,237 (4.3%) | 1,259 (4.1%) |
| 65 to 74 Years | 418 (6.4%) | 605 (7.4%) |
| 75 Years and over | 366 (9.4%) | 1,077 (18.2%) |
Disability Class: Ambulatory Difficulty
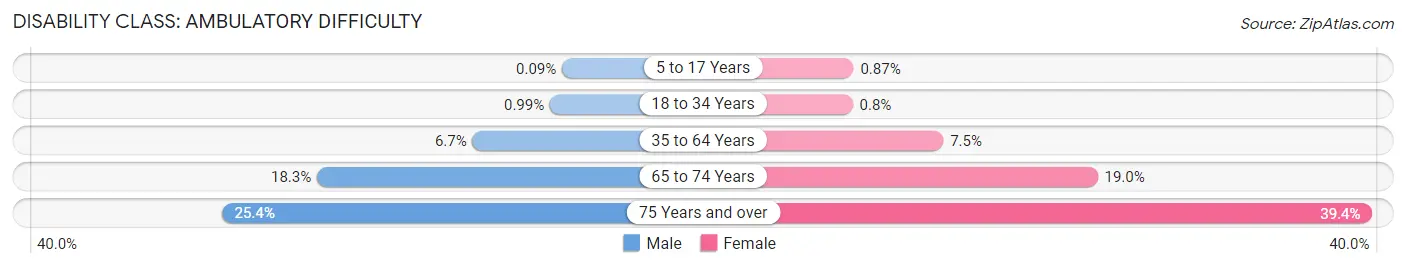
| Age Bracket | Male | Female |
| 5 to 17 Years | 13 (0.1%) | 114 (0.9%) |
| 18 to 34 Years | 154 (1.0%) | 135 (0.8%) |
| 35 to 64 Years | 1,915 (6.7%) | 2,340 (7.5%) |
| 65 to 74 Years | 1,201 (18.3%) | 1,545 (19.0%) |
| 75 Years and over | 992 (25.4%) | 2,334 (39.4%) |
Disability Class: Self-Care Difficulty
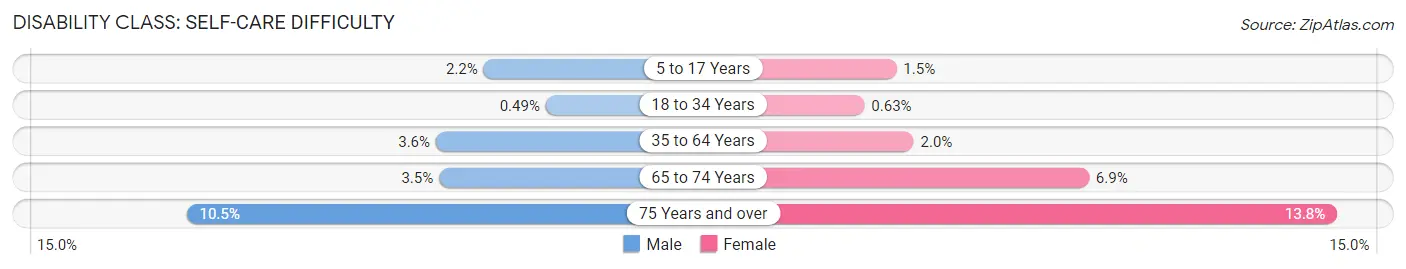
| Age Bracket | Male | Female |
| 5 to 17 Years | 306 (2.2%) | 198 (1.5%) |
| 18 to 34 Years | 76 (0.5%) | 105 (0.6%) |
| 35 to 64 Years | 1,009 (3.5%) | 622 (2.0%) |
| 65 to 74 Years | 227 (3.5%) | 560 (6.9%) |
| 75 Years and over | 410 (10.5%) | 817 (13.8%) |
Technology Access in Rankin County
Computing Device Access in Rankin County
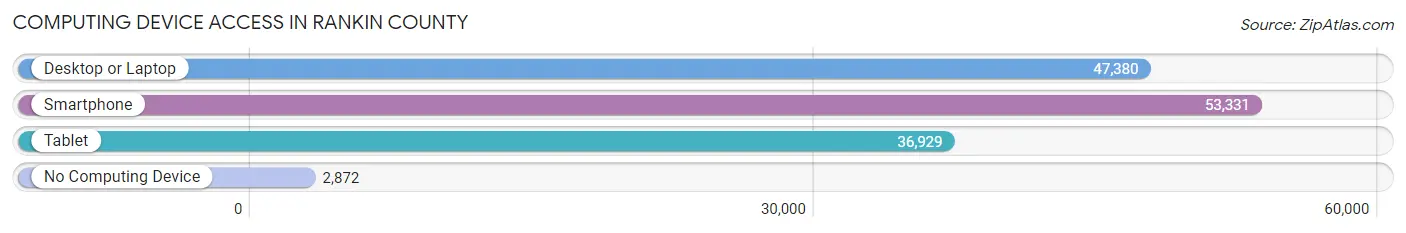
| Device Type | # Households | % Households |
| Desktop or Laptop | 47,380 | 80.3% |
| Smartphone | 53,331 | 90.4% |
| Tablet | 36,929 | 62.6% |
| No Computing Device | 2,872 | 4.9% |
| Total | 58,982 | 100.0% |
Internet Access in Rankin County

| Internet Type | # Households | % Households |
| Dial-Up Internet | 23 | 0.0% |
| Broadband Home | 41,853 | 71.0% |
| Cellular Data Only | 7,591 | 12.9% |
| Satellite Internet | 5,772 | 9.8% |
| No Internet | 6,306 | 10.7% |
| Total | 58,982 | 100.0% |
Rankin County Summary
Rankin County is located in the central part of Mississippi, and is part of the Jackson Metropolitan Statistical Area. It is bordered by Madison County to the north, Scott County to the east, Simpson County to the south, and Hinds County to the west. The county seat is Brandon, and the largest city is Pearl.
History
Rankin County was established in 1828, and was named for Christopher Rankin, a Mississippi politician who served in the United States House of Representatives from 1819 to 1826. The county was originally part of Hinds County, and was created to provide a more convenient location for the county seat.
Geography
Rankin County covers an area of 545 square miles, and is located in the central part of Mississippi. The terrain is mostly flat, with some rolling hills in the northern part of the county. The Pearl River runs through the county, and there are several small lakes and ponds. The county is mostly rural, with some small towns and villages scattered throughout.
Economy
The economy of Rankin County is largely based on agriculture, with the main crops being cotton, soybeans, corn, and wheat. The county also has a strong manufacturing sector, with several large companies located in the area. The largest employers in the county are Nissan, Sanderson Farms, and the Rankin County School District.
Demographics
As of the 2010 census, Rankin County had a population of 141,617. The racial makeup of the county was 79.2% White, 17.7% African American, 0.5% Native American, 0.7% Asian, 0.1% Pacific Islander, and 1.8% from two or more races. The median household income was $50,945, and the median family income was $60,945.
Conclusion
Rankin County is a rural county located in the central part of Mississippi. It has a strong agricultural economy, and is home to several large manufacturing companies. The population is mostly white, with a significant African American population. The median household income is slightly above the state average, and the county is served by the Rankin County School District.
Common Questions
What is the Total Population of Rankin County?
Total Population of Rankin County is 157,185.
What is the Total Male Population of Rankin County?
Total Male Population of Rankin County is 76,152.
What is the Total Female Population of Rankin County?
Total Female Population of Rankin County is 81,033.
What is the Ratio of Males per 100 Females in Rankin County?
There are 93.98 Males per 100 Females in Rankin County.
What is the Ratio of Females per 100 Males in Rankin County?
There are 106.41 Females per 100 Males in Rankin County.
What is the Median Population Age in Rankin County?
Median Population Age in Rankin County is 38.9 Years.
What is the Average Family Size in Rankin County
Average Family Size in Rankin County is 3.1 People.
What is the Average Household Size in Rankin County
Average Household Size in Rankin County is 2.6 People.
What is Per Capita Income in Rankin County?
Per Capita income in Rankin County is $36,605.
What is the Median Family Income in Rankin County?
Median Family Income in Rankin County is $92,709.
What is the Median Household income in Rankin County?
Median Household Income in Rankin County is $76,460.
What is Income or Wage Gap in Rankin County?
Income or Wage Gap in Rankin County is 28.0%.
Women in Rankin County earn 72.0 cents for every dollar earned by a man.
What is Family Income Deficit in Rankin County?
Family Income Deficit in Rankin County is $11,162.
Families that are below poverty line in Rankin County earn $11,162 less on average than the poverty threshold level.
What is Inequality or Gini Index in Rankin County?
Inequality or Gini Index in Rankin County is 0.41.
How Large is the Labor Force in Rankin County?
There are 81,214 People in the Labor Forcein in Rankin County.
What is the Percentage of People in the Labor Force in Rankin County?
64.2% of People are in the Labor Force in Rankin County.
What is the Unemployment Rate in Rankin County?
Unemployment Rate in Rankin County is 4.4%.