Quitman County, MS
Quitman County Map
Quitman County Overview
6,113
TOTAL POPULATION
2,877
MALE POPULATION
3,236
FEMALE POPULATION
88.91
MALES / 100 FEMALES
112.48
FEMALES / 100 MALES
40.1
MEDIAN AGE
2.9
AVG FAMILY SIZE
2.2
AVG HOUSEHOLD SIZE
$18,546
PER CAPITA INCOME
$46,029
AVG FAMILY INCOME
$31,192
AVG HOUSEHOLD INCOME
13.2%
WAGE / INCOME GAP [ % ]
86.8¢/ $1
WAGE / INCOME GAP [ $ ]
$14,664
FAMILY INCOME DEFICIT
0.46
INEQUALITY / GINI INDEX
2,513
LABOR FORCE [ PEOPLE ]
51.6%
PERCENT IN LABOR FORCE
12.2%
UNEMPLOYMENT RATE
Quitman County Area Codes
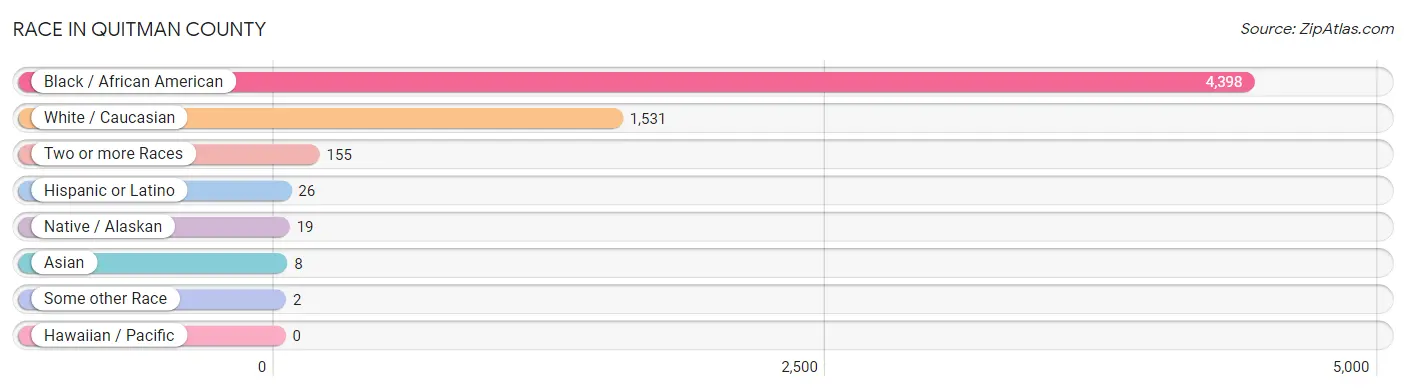
Race in Quitman County
The most populous races in Quitman County are Black / African American (4,398 | 72.0%), White / Caucasian (1,531 | 25.0%), and Two or more Races (155 | 2.5%).
| Race | # Population | % Population |
| Asian | 8 | 0.1% |
| Black / African American | 4,398 | 72.0% |
| Hawaiian / Pacific | 0 | 0.0% |
| Hispanic or Latino | 26 | 0.4% |
| Native / Alaskan | 19 | 0.3% |
| White / Caucasian | 1,531 | 25.0% |
| Two or more Races | 155 | 2.5% |
| Some other Race | 2 | 0.0% |
| Total | 6,113 | 100.0% |
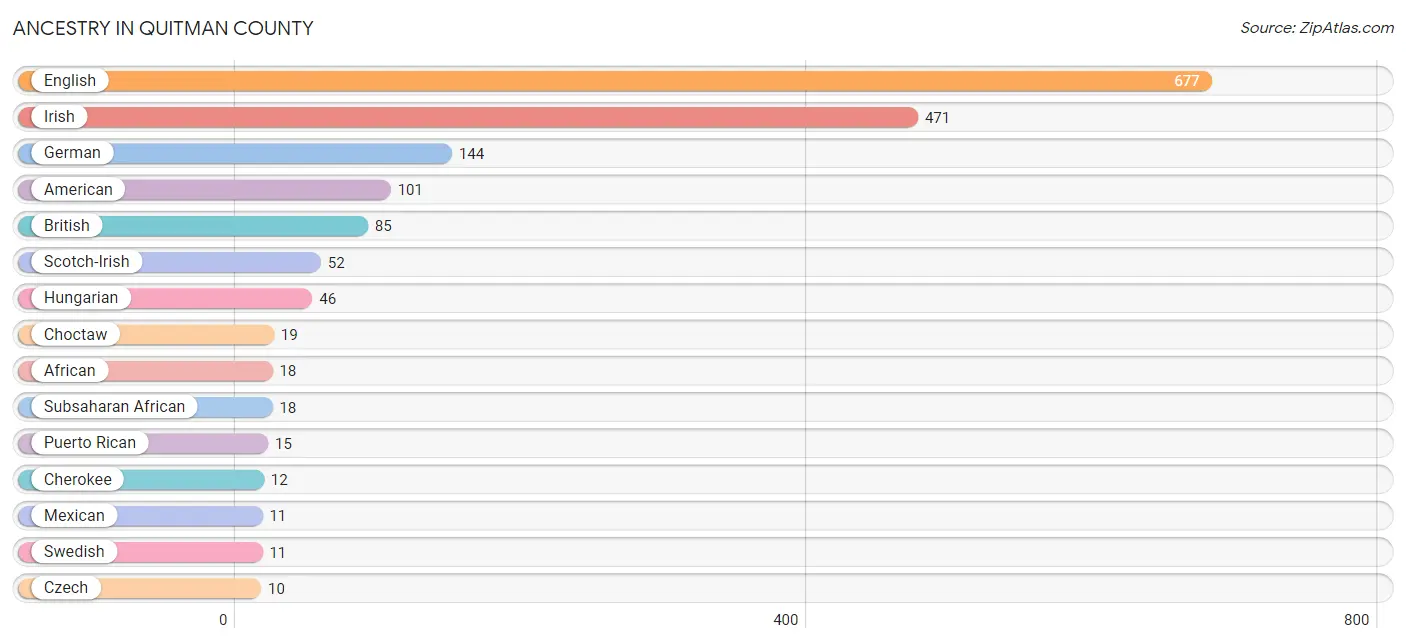
Ancestry in Quitman County
The most populous ancestries reported in Quitman County are English (677 | 11.1%), Irish (471 | 7.7%), German (144 | 2.4%), American (101 | 1.7%), and British (85 | 1.4%), together accounting for 24.2% of all Quitman County residents.
| Ancestry | # Population | % Population |
| African | 18 | 0.3% |
| American | 101 | 1.7% |
| British | 85 | 1.4% |
| Cherokee | 12 | 0.2% |
| Choctaw | 19 | 0.3% |
| Czech | 10 | 0.2% |
| Danish | 7 | 0.1% |
| Dutch | 9 | 0.2% |
| English | 677 | 11.1% |
| French | 7 | 0.1% |
| German | 144 | 2.4% |
| Hungarian | 46 | 0.7% |
| Irish | 471 | 7.7% |
| Italian | 3 | 0.1% |
| Korean | 9 | 0.2% |
| Mexican | 11 | 0.2% |
| Norwegian | 4 | 0.1% |
| Puerto Rican | 15 | 0.3% |
| Scotch-Irish | 52 | 0.9% |
| Scottish | 3 | 0.1% |
| Subsaharan African | 18 | 0.3% |
| Swedish | 11 | 0.2% |
| Swiss | 10 | 0.2% |
| Welsh | 9 | 0.2% | View All 24 Rows |
Immigrants in Quitman County
The most numerous immigrant groups reported in Quitman County came from Africa (6 | 0.1%), Eastern Africa (6 | 0.1%), Eritrea (6 | 0.1%), Asia (2 | 0.0%), and Central America (2 | 0.0%), together accounting for 0.4% of all Quitman County residents.

| Immigration Origin | # Population | % Population |
| Africa | 6 | 0.1% |
| Asia | 2 | 0.0% |
| Central America | 2 | 0.0% |
| Eastern Africa | 6 | 0.1% |
| Eritrea | 6 | 0.1% |
| Latin America | 2 | 0.0% |
| Mexico | 2 | 0.0% |
| Philippines | 2 | 0.0% |
| South Eastern Asia | 2 | 0.0% | View All 9 Rows |
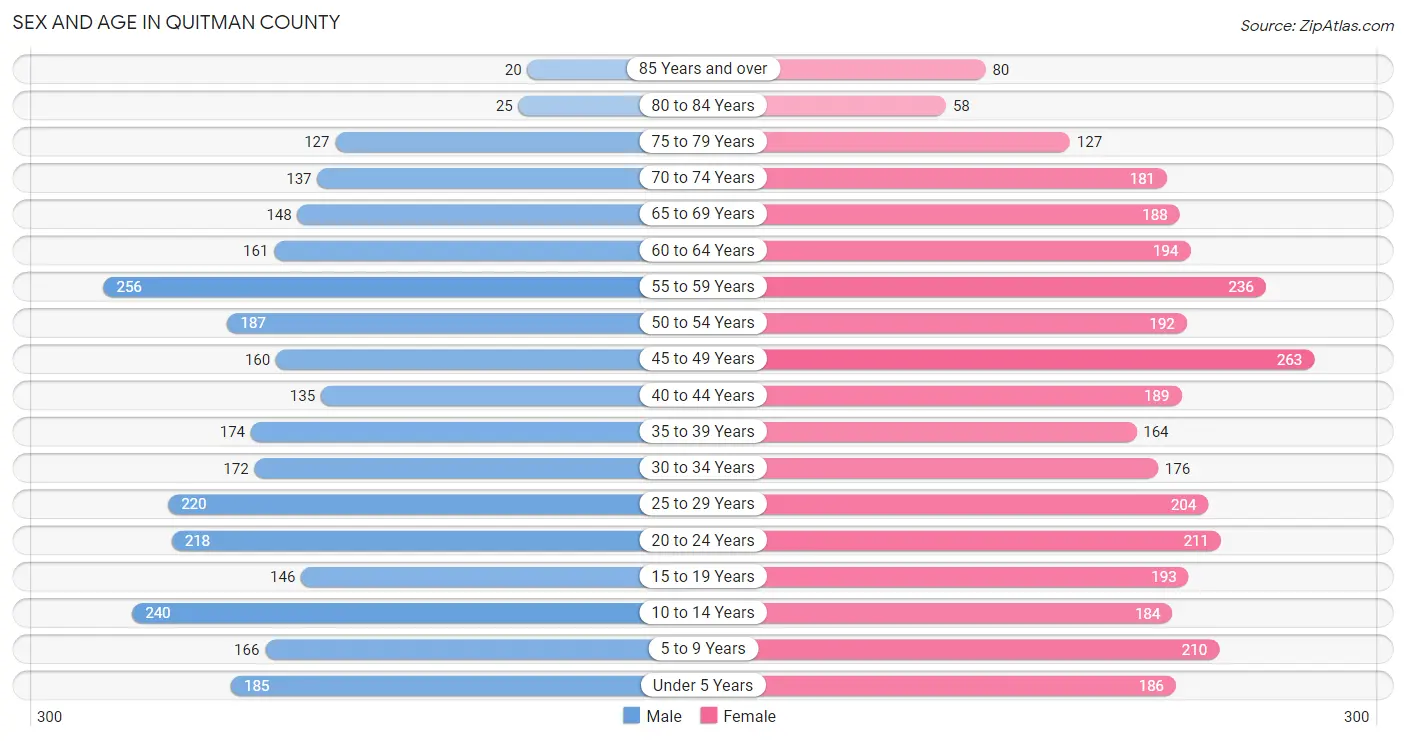
Sex and Age in Quitman County
Sex and Age in Quitman County
The most populous age groups in Quitman County are 55 to 59 Years (256 | 8.9%) for men and 45 to 49 Years (263 | 8.1%) for women.
| Age Bracket | Male | Female |
| Under 5 Years | 185 (6.4%) | 186 (5.8%) |
| 5 to 9 Years | 166 (5.8%) | 210 (6.5%) |
| 10 to 14 Years | 240 (8.3%) | 184 (5.7%) |
| 15 to 19 Years | 146 (5.1%) | 193 (6.0%) |
| 20 to 24 Years | 218 (7.6%) | 211 (6.5%) |
| 25 to 29 Years | 220 (7.6%) | 204 (6.3%) |
| 30 to 34 Years | 172 (6.0%) | 176 (5.4%) |
| 35 to 39 Years | 174 (6.0%) | 164 (5.1%) |
| 40 to 44 Years | 135 (4.7%) | 189 (5.8%) |
| 45 to 49 Years | 160 (5.6%) | 263 (8.1%) |
| 50 to 54 Years | 187 (6.5%) | 192 (5.9%) |
| 55 to 59 Years | 256 (8.9%) | 236 (7.3%) |
| 60 to 64 Years | 161 (5.6%) | 194 (6.0%) |
| 65 to 69 Years | 148 (5.1%) | 188 (5.8%) |
| 70 to 74 Years | 137 (4.8%) | 181 (5.6%) |
| 75 to 79 Years | 127 (4.4%) | 127 (3.9%) |
| 80 to 84 Years | 25 (0.9%) | 58 (1.8%) |
| 85 Years and over | 20 (0.7%) | 80 (2.5%) |
| Total | 2,877 (100.0%) | 3,236 (100.0%) |
Families and Households in Quitman County
Median Family Size in Quitman County
The median family size in Quitman County is 2.94 persons per family, with single female/mother families (671 | 42.7%) accounting for the largest median family size of 3.17 persons per family. On the other hand, single male/father families (165 | 10.5%) represent the smallest median family size with 2.56 persons per family.

| Family Type | # Families | Family Size |
| Married-Couple | 734 (46.8%) | 2.81 |
| Single Male/Father | 165 (10.5%) | 2.56 |
| Single Female/Mother | 671 (42.7%) | 3.17 |
| Total Families | 1,570 (100.0%) | 2.94 |
Median Household Size in Quitman County
The median household size in Quitman County is 2.24 persons per household, with single female/mother households (671 | 25.3%) accounting for the largest median household size of 3.35 persons per household. non-family households (1,086 | 40.9%) represent the smallest median household size with 1.08 persons per household.

| Household Type | # Households | Household Size |
| Married-Couple | 734 (27.6%) | 2.81 |
| Single Male/Father | 165 (6.2%) | 2.82 |
| Single Female/Mother | 671 (25.3%) | 3.35 |
| Non-family | 1,086 (40.9%) | 1.08 |
| Total Households | 2,656 (100.0%) | 2.24 |
Household Size by Marriage Status in Quitman County
Out of a total of 2,656 households in Quitman County, 1,570 (59.1%) are family households, while 1,086 (40.9%) are nonfamily households. The most numerous type of family households are 2-person households, comprising 647, and the most common type of nonfamily households are 1-person households, comprising 1,002.

| Household Size | Family Households | Nonfamily Households |
| 1-Person Households | - | 1,002 (37.7%) |
| 2-Person Households | 647 (24.4%) | 84 (3.2%) |
| 3-Person Households | 404 (15.2%) | 0 (0.0%) |
| 4-Person Households | 271 (10.2%) | 0 (0.0%) |
| 5-Person Households | 128 (4.8%) | 0 (0.0%) |
| 6-Person Households | 79 (3.0%) | 0 (0.0%) |
| 7+ Person Households | 41 (1.5%) | 0 (0.0%) |
| Total | 1,570 (59.1%) | 1,086 (40.9%) |
Female Fertility in Quitman County
Fertility by Age in Quitman County
Average fertility rate in Quitman County is 78.0 births per 1,000 women. Women in the age bracket of 20 to 34 years have the highest fertility rate with 162.0 births per 1,000 women. Women in the age bracket of 20 to 34 years acount for 87.3% of all women with births.

| Age Bracket | Women with Births | Births / 1,000 Women |
| 15 to 19 years | 7 (6.4%) | 36.0 |
| 20 to 34 years | 96 (87.3%) | 162.0 |
| 35 to 50 years | 7 (6.4%) | 11.0 |
| Total | 110 (100.0%) | 78.0 |
Fertility by Age by Marriage Status in Quitman County
15.5% of women with births (110) in Quitman County are married. The highest percentage of unmarried women with births falls into 15 to 19 years age bracket with 100.0% of them unmarried at the time of birth, while the lowest percentage of unmarried women with births belong to 20 to 34 years age bracket with 82.3% of them unmarried.

| Age Bracket | Married | Unmarried |
| 15 to 19 years | 0 (0.0%) | 7 (100.0%) |
| 20 to 34 years | 17 (17.7%) | 79 (82.3%) |
| 35 to 50 years | 0 (0.0%) | 7 (100.0%) |
| Total | 17 (15.4%) | 93 (84.6%) |
Fertility by Education in Quitman County
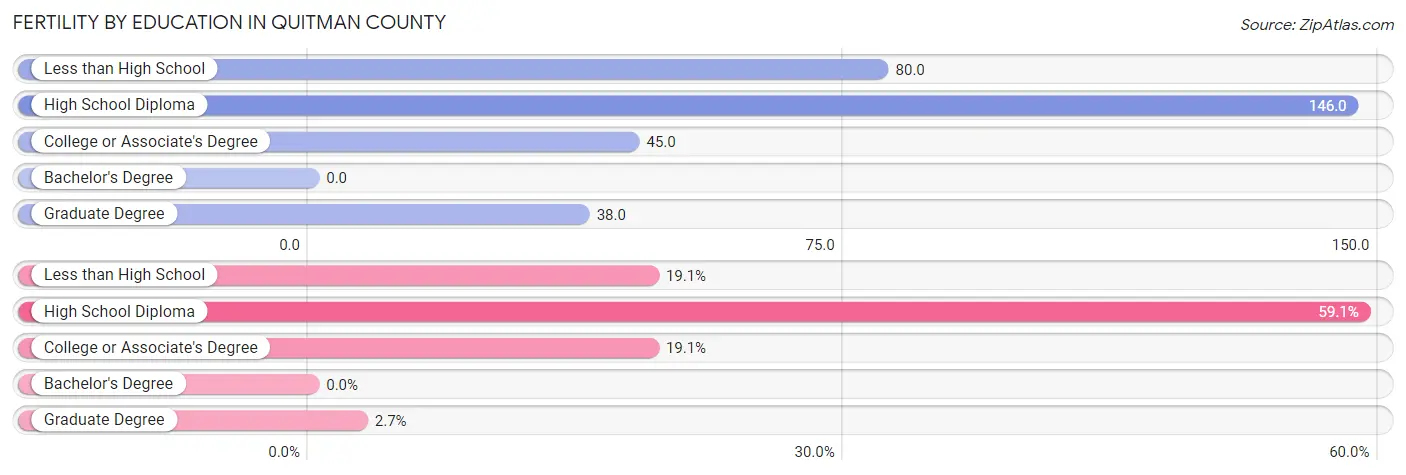
| Educational Attainment | Women with Births | Births / 1,000 Women |
| Less than High School | 21 (19.1%) | 80.0 |
| High School Diploma | 65 (59.1%) | 146.0 |
| College or Associate's Degree | 21 (19.1%) | 45.0 |
| Bachelor's Degree | 0 (0.0%) | 0.0 |
| Graduate Degree | 3 (2.7%) | 38.0 |
| Total | 110 (100.0%) | 78.0 |
Fertility by Education by Marriage Status in Quitman County
84.6% of women with births in Quitman County are unmarried. Women with the educational attainment of graduate degree are most likely to be married with 100.0% of them married at childbirth, while women with the educational attainment of less than high school are least likely to be married with 100.0% of them unmarried at childbirth.
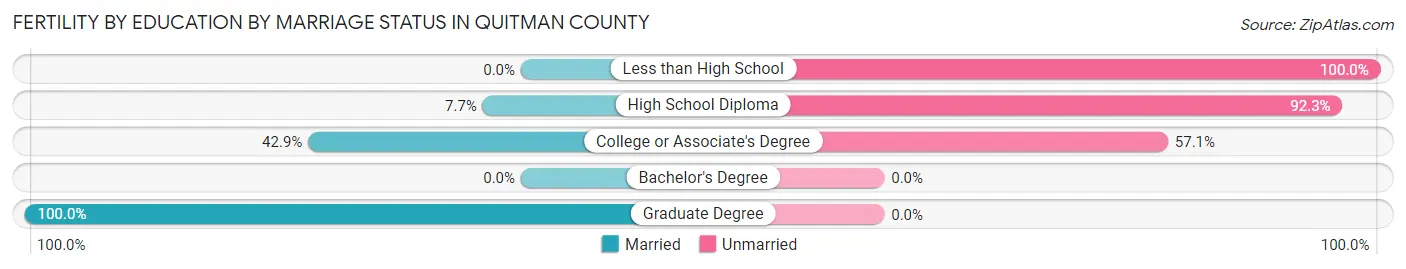
| Educational Attainment | Married | Unmarried |
| Less than High School | 0 (0.0%) | 21 (100.0%) |
| High School Diploma | 5 (7.7%) | 60 (92.3%) |
| College or Associate's Degree | 9 (42.9%) | 12 (57.1%) |
| Bachelor's Degree | 0 (0.0%) | 0 (0.0%) |
| Graduate Degree | 3 (100.0%) | 0 (0.0%) |
| Total | 17 (15.4%) | 93 (84.6%) |
Income in Quitman County
Income Overview in Quitman County
Per Capita Income in Quitman County is $18,546, while median incomes of families and households are $46,029 and $31,192 respectively.
| Characteristic | Number | Measure |
| Per Capita Income | 6,113 | $18,546 |
| Median Family Income | 1,570 | $46,029 |
| Mean Family Income | 1,570 | $53,911 |
| Median Household Income | 2,656 | $31,192 |
| Mean Household Income | 2,656 | $43,369 |
| Income Deficit | 1,570 | $14,664 |
| Wage / Income Gap (%) | 6,113 | 13.24% |
| Wage / Income Gap ($) | 6,113 | 86.76¢ per $1 |
| Gini / Inequality Index | 6,113 | 0.46 |
Earnings by Sex in Quitman County
Average Earnings in Quitman County are $27,651, $30,025 for men and $26,050 for women, a difference of 13.2%.

| Sex | Number | Average Earnings |
| Male | 1,200 (49.3%) | $30,025 |
| Female | 1,236 (50.7%) | $26,050 |
| Total | 2,436 (100.0%) | $27,651 |
Earnings by Sex by Income Bracket in Quitman County
The most common earnings brackets in Quitman County are $30,000 to $34,999 for men (157 | 13.1%) and $30,000 to $34,999 for women (174 | 14.1%).

| Income | Male | Female |
| $2,499 or less | 61 (5.1%) | 76 (6.1%) |
| $2,500 to $4,999 | 15 (1.3%) | 33 (2.7%) |
| $5,000 to $7,499 | 55 (4.6%) | 36 (2.9%) |
| $7,500 to $9,999 | 48 (4.0%) | 34 (2.8%) |
| $10,000 to $12,499 | 16 (1.3%) | 90 (7.3%) |
| $12,500 to $14,999 | 34 (2.8%) | 91 (7.4%) |
| $15,000 to $17,499 | 91 (7.6%) | 62 (5.0%) |
| $17,500 to $19,999 | 66 (5.5%) | 92 (7.4%) |
| $20,000 to $22,499 | 38 (3.2%) | 25 (2.0%) |
| $22,500 to $24,999 | 78 (6.5%) | 58 (4.7%) |
| $25,000 to $29,999 | 97 (8.1%) | 131 (10.6%) |
| $30,000 to $34,999 | 157 (13.1%) | 174 (14.1%) |
| $35,000 to $39,999 | 49 (4.1%) | 73 (5.9%) |
| $40,000 to $44,999 | 117 (9.8%) | 91 (7.4%) |
| $45,000 to $49,999 | 68 (5.7%) | 21 (1.7%) |
| $50,000 to $54,999 | 21 (1.8%) | 57 (4.6%) |
| $55,000 to $64,999 | 66 (5.5%) | 29 (2.4%) |
| $65,000 to $74,999 | 34 (2.8%) | 35 (2.8%) |
| $75,000 to $99,999 | 36 (3.0%) | 12 (1.0%) |
| $100,000+ | 53 (4.4%) | 16 (1.3%) |
| Total | 1,200 (100.0%) | 1,236 (100.0%) |
Earnings by Sex by Educational Attainment in Quitman County
Average earnings in Quitman County are $31,717 for men and $29,007 for women, a difference of 8.5%. Men with an educational attainment of graduate degree enjoy the highest average annual earnings of $43,355, while those with less than high school education earn the least with $16,556. Women with an educational attainment of graduate degree earn the most with the average annual earnings of $56,375, while those with less than high school education have the smallest earnings of $17,250.

| Educational Attainment | Male Income | Female Income |
| Less than High School | $16,556 | $17,250 |
| High School Diploma | $31,383 | $24,100 |
| College or Associate's Degree | $38,884 | $28,347 |
| Bachelor's Degree | - | - |
| Graduate Degree | $43,355 | $56,375 |
| Total | $31,717 | $29,007 |
Family Income in Quitman County
Family Income Brackets in Quitman County
According to the Quitman County family income data, there are 363 families falling into the $50,000 to $74,999 income range, which is the most common income bracket and makes up 23.1% of all families. Conversely, the $200,000+ income bracket is the least frequent group with only 9 families (0.6%) belonging to this category.

| Income Bracket | # Families | % Families |
| Less than $10,000 | 91 | 5.8% |
| $10,000 to $14,999 | 144 | 9.2% |
| $15,000 to $24,999 | 171 | 10.9% |
| $25,000 to $34,999 | 185 | 11.8% |
| $35,000 to $49,999 | 265 | 16.9% |
| $50,000 to $74,999 | 363 | 23.1% |
| $75,000 to $99,999 | 137 | 8.7% |
| $100,000 to $149,999 | 170 | 10.8% |
| $150,000 to $199,999 | 35 | 2.2% |
| $200,000+ | 9 | 0.6% |
Family Income by Famaliy Size in Quitman County
7+ person families (41 | 2.6%) account for the highest median family income in Quitman County with $77,014 per family, while 2-person families (701 | 44.7%) have the highest median income of $22,851 per family member.

| Income Bracket | # Families | Median Income |
| 2-Person Families | 701 (44.7%) | $45,702 |
| 3-Person Families | 427 (27.2%) | $51,813 |
| 4-Person Families | 226 (14.4%) | $37,963 |
| 5-Person Families | 112 (7.1%) | $0 |
| 6-Person Families | 63 (4.0%) | $0 |
| 7+ Person Families | 41 (2.6%) | $77,014 |
| Total | 1,570 (100.0%) | $46,029 |
Family Income by Number of Earners in Quitman County
The median family income in Quitman County is $46,029, with families comprising 3+ earners (102) having the highest median family income of $103,846, while families with no earners (373) have the lowest median family income of $25,481, accounting for 6.5% and 23.8% of families, respectively.

| Number of Earners | # Families | Median Income |
| No Earners | 373 (23.8%) | $25,481 |
| 1 Earner | 612 (39.0%) | $38,400 |
| 2 Earners | 483 (30.8%) | $61,133 |
| 3+ Earners | 102 (6.5%) | $103,846 |
| Total | 1,570 (100.0%) | $46,029 |
Household Income in Quitman County
Household Income Brackets in Quitman County
With 441 households falling in the category, the $15,000 to $24,999 income range is the most frequent in Quitman County, accounting for 16.6% of all households. In contrast, only 24 households (0.9%) fall into the $200,000+ income bracket, making it the least populous group.

| Income Bracket | # Households | % Households |
| Less than $10,000 | 324 | 12.2% |
| $10,000 to $14,999 | 356 | 13.4% |
| $15,000 to $24,999 | 441 | 16.6% |
| $25,000 to $34,999 | 290 | 10.9% |
| $35,000 to $49,999 | 380 | 14.3% |
| $50,000 to $74,999 | 430 | 16.2% |
| $75,000 to $99,999 | 178 | 6.7% |
| $100,000 to $149,999 | 191 | 7.2% |
| $150,000 to $199,999 | 40 | 1.5% |
| $200,000+ | 24 | 0.9% |
Household Income by Householder Age in Quitman County
The median household income in Quitman County is $31,192, with the highest median household income of $35,313 found in the 25 to 44 years age bracket for the primary householder. A total of 743 households (28.0%) fall into this category. Meanwhile, the 15 to 24 years age bracket for the primary householder has the lowest median household income of $0, with 89 households (3.4%) in this group.

| Income Bracket | # Households | Median Income |
| 15 to 24 Years | 89 (3.4%) | $0 |
| 25 to 44 Years | 743 (28.0%) | $35,313 |
| 45 to 64 Years | 1,126 (42.4%) | $28,400 |
| 65+ Years | 698 (26.3%) | $29,924 |
| Total | 2,656 (100.0%) | $31,192 |
Poverty in Quitman County
Income Below Poverty by Sex and Age in Quitman County
With 28.9% poverty level for males and 31.4% for females among the residents of Quitman County, 5 year old males and under 5 year old females are the most vulnerable to poverty, with 26 males (61.9%) and 111 females (59.7%) in their respective age groups living below the poverty level.

| Age Bracket | Male | Female |
| Under 5 Years | 105 (56.8%) | 111 (59.7%) |
| 5 Years | 26 (61.9%) | 25 (52.1%) |
| 6 to 11 Years | 151 (58.1%) | 129 (51.4%) |
| 12 to 14 Years | 40 (38.5%) | 7 (9.7%) |
| 15 Years | 2 (6.1%) | 16 (41.0%) |
| 16 and 17 Years | 28 (33.3%) | 26 (38.2%) |
| 18 to 24 Years | 20 (9.2%) | 57 (19.2%) |
| 25 to 34 Years | 68 (19.3%) | 139 (36.6%) |
| 35 to 44 Years | 49 (16.0%) | 99 (28.1%) |
| 45 to 54 Years | 82 (26.4%) | 77 (16.9%) |
| 55 to 64 Years | 126 (30.2%) | 153 (35.6%) |
| 65 to 74 Years | 66 (23.2%) | 79 (21.4%) |
| 75 Years and over | 38 (22.1%) | 70 (34.5%) |
| Total | 801 (28.9%) | 988 (31.4%) |
Income Above Poverty by Sex and Age in Quitman County
According to the poverty statistics in Quitman County, males aged 15 years and females aged 12 to 14 years are the age groups that are most secure financially, with 93.9% of males and 90.3% of females in these age groups living above the poverty line.

| Age Bracket | Male | Female |
| Under 5 Years | 80 (43.2%) | 75 (40.3%) |
| 5 Years | 16 (38.1%) | 23 (47.9%) |
| 6 to 11 Years | 109 (41.9%) | 122 (48.6%) |
| 12 to 14 Years | 64 (61.5%) | 65 (90.3%) |
| 15 Years | 31 (93.9%) | 23 (59.0%) |
| 16 and 17 Years | 56 (66.7%) | 42 (61.8%) |
| 18 to 24 Years | 197 (90.8%) | 240 (80.8%) |
| 25 to 34 Years | 284 (80.7%) | 241 (63.4%) |
| 35 to 44 Years | 257 (84.0%) | 254 (72.0%) |
| 45 to 54 Years | 229 (73.6%) | 378 (83.1%) |
| 55 to 64 Years | 291 (69.8%) | 277 (64.4%) |
| 65 to 74 Years | 219 (76.8%) | 290 (78.6%) |
| 75 Years and over | 134 (77.9%) | 133 (65.5%) |
| Total | 1,967 (71.1%) | 2,163 (68.6%) |
Income Below Poverty Among Married-Couple Families in Quitman County
The poverty statistics for married-couple families in Quitman County show that 7.1% or 52 of the total 734 families live below the poverty line. Families with 3 or 4 children have the highest poverty rate of 21.9%, comprising of 7 families. On the other hand, families with no children have the lowest poverty rate of 5.9%, which includes 29 families.

| Children | Above Poverty | Below Poverty |
| No Children | 461 (94.1%) | 29 (5.9%) |
| 1 or 2 Children | 196 (92.4%) | 16 (7.5%) |
| 3 or 4 Children | 25 (78.1%) | 7 (21.9%) |
| 5 or more Children | 0 (0.0%) | 0 (0.0%) |
| Total | 682 (92.9%) | 52 (7.1%) |
Income Below Poverty Among Single-Parent Households in Quitman County
According to the poverty data in Quitman County, 30.3% or 50 single-father households and 32.8% or 220 single-mother households are living below the poverty line. Among single-father households, those with 3 or 4 children have the highest poverty rate, with 48 households (100.0%) experiencing poverty. Likewise, among single-mother households, those with 5 or more children have the highest poverty rate, with 4 households (100.0%) falling below the poverty line.
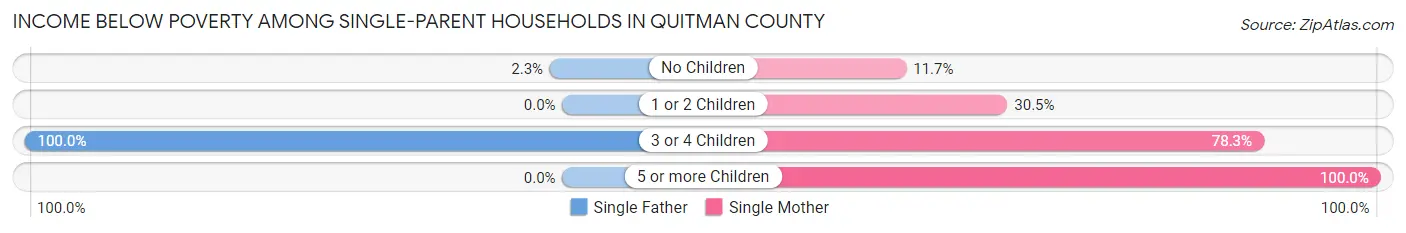
| Children | Single Father | Single Mother |
| No Children | 2 (2.3%) | 33 (11.7%) |
| 1 or 2 Children | 0 (0.0%) | 75 (30.5%) |
| 3 or 4 Children | 48 (100.0%) | 108 (78.3%) |
| 5 or more Children | 0 (0.0%) | 4 (100.0%) |
| Total | 50 (30.3%) | 220 (32.8%) |
Income Below Poverty Among Married-Couple vs Single-Parent Households in Quitman County
The poverty data for Quitman County shows that 52 of the married-couple family households (7.1%) and 270 of the single-parent households (32.3%) are living below the poverty level. Within the married-couple family households, those with 3 or 4 children have the highest poverty rate, with 7 households (21.9%) falling below the poverty line. Among the single-parent households, those with 5 or more children have the highest poverty rate, with 4 household (100.0%) living below poverty.

| Children | Married-Couple Families | Single-Parent Households |
| No Children | 29 (5.9%) | 35 (9.5%) |
| 1 or 2 Children | 16 (7.5%) | 75 (27.1%) |
| 3 or 4 Children | 7 (21.9%) | 156 (83.9%) |
| 5 or more Children | 0 (0.0%) | 4 (100.0%) |
| Total | 52 (7.1%) | 270 (32.3%) |
Employment Characteristics in Quitman County
Employment by Class of Employer in Quitman County
Among the 2,126 employed individuals in Quitman County, private company employees (1,207 | 56.8%), state government employees (302 | 14.2%), and local government employees (278 | 13.1%) make up the most common classes of employment.

| Employer Class | # Employees | % Employees |
| Private Company Employees | 1,207 | 56.8% |
| Self-Employed (Incorporated) | 35 | 1.7% |
| Self-Employed (Not Incorporated) | 140 | 6.6% |
| Not-for-profit Organizations | 78 | 3.7% |
| Local Government Employees | 278 | 13.1% |
| State Government Employees | 302 | 14.2% |
| Federal Government Employees | 85 | 4.0% |
| Unpaid Family Workers | 1 | 0.1% |
| Total | 2,126 | 100.0% |
Employment Status by Age in Quitman County
According to the labor force statistics for Quitman County, out of the total population over 16 years of age (4,870), 51.6% or 2,513 individuals are in the labor force, with 12.2% or 307 of them unemployed. The age group with the highest labor force participation rate is 35 to 44 years, with 75.1% or 497 individuals in the labor force. Within the labor force, the 25 to 29 years age range has the highest percentage of unemployed individuals, with 29.2% or 87 of them being unemployed.

| Age Bracket | In Labor Force | Unemployed |
| 16 to 19 Years | 42 (15.7%) | 8 (19.0%) |
| 20 to 24 Years | 276 (64.3%) | 71 (25.7%) |
| 25 to 29 Years | 298 (70.3%) | 87 (29.2%) |
| 30 to 34 Years | 228 (65.5%) | 10 (4.4%) |
| 35 to 44 Years | 497 (75.1%) | 70 (14.0%) |
| 45 to 54 Years | 523 (65.2%) | 31 (5.9%) |
| 55 to 59 Years | 305 (62.0%) | 22 (7.2%) |
| 60 to 64 Years | 114 (32.1%) | 5 (4.4%) |
| 65 to 74 Years | 196 (30.0%) | 4 (2.0%) |
| 75 Years and over | 33 (7.6%) | 0 (0.0%) |
| Total | 2,513 (51.6%) | 307 (12.2%) |
Employment Status by Educational Attainment in Quitman County
According to labor force statistics for Quitman County, 63.7% of individuals (1,964) out of the total population between 25 and 64 years of age (3,083) are in the labor force, with 11.4% or 224 of them being unemployed. The group with the highest labor force participation rate are those with the educational attainment of college / associate degree, with 82.7% or 820 individuals in the labor force. Within the labor force, individuals with high school diploma education have the highest percentage of unemployment, with 18.0% or 96 of them being unemployed.

| Educational Attainment | In Labor Force | Unemployed |
| Less than High School | 284 (46.0%) | 15 (2.5%) |
| High School Diploma | 533 (50.4%) | 190 (18.0%) |
| College / Associate Degree | 820 (82.7%) | 148 (14.9%) |
| Bachelor's Degree or higher | 328 (79.0%) | 0 (0.0%) |
| Total | 1,964 (63.7%) | 351 (11.4%) |
Employment Occupations by Sex in Quitman County
Management, Business, Science and Arts Occupations
The most common Management, Business, Science and Arts occupations in Quitman County are Management (146 | 6.7%), Health Diagnosing & Treating (141 | 6.5%), Community & Social Service (134 | 6.1%), Health Technologists (103 | 4.7%), and Education Instruction & Library (79 | 3.6%).

Management, Business, Science and Arts Occupations by Sex
Within the Management, Business, Science and Arts occupations in Quitman County, the most male-oriented occupations are Architecture & Engineering (100.0%), Management (59.6%), and Computers, Engineering & Science (54.5%), while the most female-oriented occupations are Life, Physical & Social Science (100.0%), Health Diagnosing & Treating (97.2%), and Business & Financial (97.1%).

| Occupation | Male | Female |
| Management | 87 (59.6%) | 59 (40.4%) |
| Business & Financial | 2 (2.9%) | 66 (97.1%) |
| Computers, Engineering & Science | 6 (54.5%) | 5 (45.5%) |
| Computers & Mathematics | 2 (40.0%) | 3 (60.0%) |
| Architecture & Engineering | 4 (100.0%) | 0 (0.0%) |
| Life, Physical & Social Science | 0 (0.0%) | 2 (100.0%) |
| Community & Social Service | 38 (28.4%) | 96 (71.6%) |
| Education, Arts & Media | 6 (27.3%) | 16 (72.7%) |
| Legal Services & Support | 15 (45.5%) | 18 (54.5%) |
| Education Instruction & Library | 17 (21.5%) | 62 (78.5%) |
| Arts, Media & Entertainment | 0 (0.0%) | 0 (0.0%) |
| Health Diagnosing & Treating | 4 (2.8%) | 137 (97.2%) |
| Health Technologists | 4 (3.9%) | 99 (96.1%) |
| Total (Category) | 137 (27.4%) | 363 (72.6%) |
| Total (Overall) | 1,054 (48.2%) | 1,133 (51.8%) |
Services Occupations
The most common Services occupations in Quitman County are Security & Protection (230 | 10.5%), Cleaning & Maintenance (166 | 7.6%), Law Enforcement (152 | 7.0%), Food Preparation & Serving (90 | 4.1%), and Healthcare Support (87 | 4.0%).

Services Occupations by Sex
Within the Services occupations in Quitman County, the most male-oriented occupations are Cleaning & Maintenance (78.3%), Food Preparation & Serving (58.9%), and Firefighting & Prevention (33.3%), while the most female-oriented occupations are Healthcare Support (96.6%), Personal Care & Service (90.6%), and Law Enforcement (68.4%).
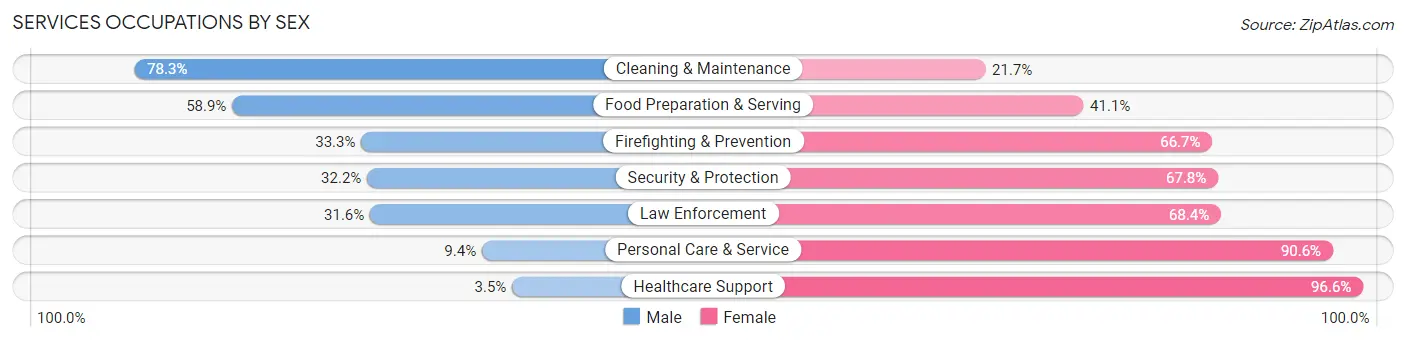
| Occupation | Male | Female |
| Healthcare Support | 3 (3.5%) | 84 (96.6%) |
| Security & Protection | 74 (32.2%) | 156 (67.8%) |
| Firefighting & Prevention | 26 (33.3%) | 52 (66.7%) |
| Law Enforcement | 48 (31.6%) | 104 (68.4%) |
| Food Preparation & Serving | 53 (58.9%) | 37 (41.1%) |
| Cleaning & Maintenance | 130 (78.3%) | 36 (21.7%) |
| Personal Care & Service | 5 (9.4%) | 48 (90.6%) |
| Total (Category) | 265 (42.3%) | 361 (57.7%) |
| Total (Overall) | 1,054 (48.2%) | 1,133 (51.8%) |
Sales and Office Occupations
The most common Sales and Office occupations in Quitman County are Office & Administration (181 | 8.3%), and Sales & Related (148 | 6.8%).

Sales and Office Occupations by Sex

| Occupation | Male | Female |
| Sales & Related | 25 (16.9%) | 123 (83.1%) |
| Office & Administration | 14 (7.7%) | 167 (92.3%) |
| Total (Category) | 39 (11.8%) | 290 (88.1%) |
| Total (Overall) | 1,054 (48.2%) | 1,133 (51.8%) |
Natural Resources, Construction and Maintenance Occupations
The most common Natural Resources, Construction and Maintenance occupations in Quitman County are Construction & Extraction (130 | 5.9%), Installation, Maintenance & Repair (73 | 3.3%), and Farming, Fishing & Forestry (24 | 1.1%).

Natural Resources, Construction and Maintenance Occupations by Sex
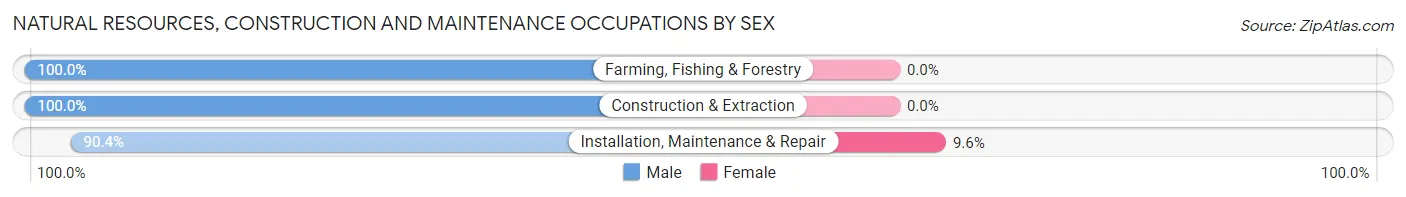
| Occupation | Male | Female |
| Farming, Fishing & Forestry | 24 (100.0%) | 0 (0.0%) |
| Construction & Extraction | 130 (100.0%) | 0 (0.0%) |
| Installation, Maintenance & Repair | 66 (90.4%) | 7 (9.6%) |
| Total (Category) | 220 (96.9%) | 7 (3.1%) |
| Total (Overall) | 1,054 (48.2%) | 1,133 (51.8%) |
Production, Transportation and Moving Occupations
The most common Production, Transportation and Moving occupations in Quitman County are Production (219 | 10.0%), Transportation (176 | 8.1%), and Material Moving (110 | 5.0%).

Production, Transportation and Moving Occupations by Sex
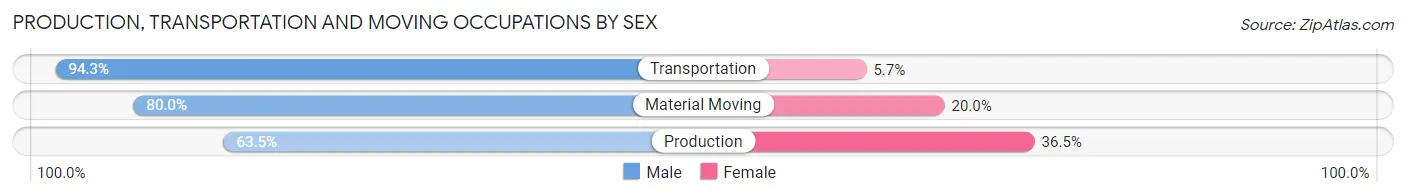
| Occupation | Male | Female |
| Production | 139 (63.5%) | 80 (36.5%) |
| Transportation | 166 (94.3%) | 10 (5.7%) |
| Material Moving | 88 (80.0%) | 22 (20.0%) |
| Total (Category) | 393 (77.8%) | 112 (22.2%) |
| Total (Overall) | 1,054 (48.2%) | 1,133 (51.8%) |
Employment Industries by Sex in Quitman County
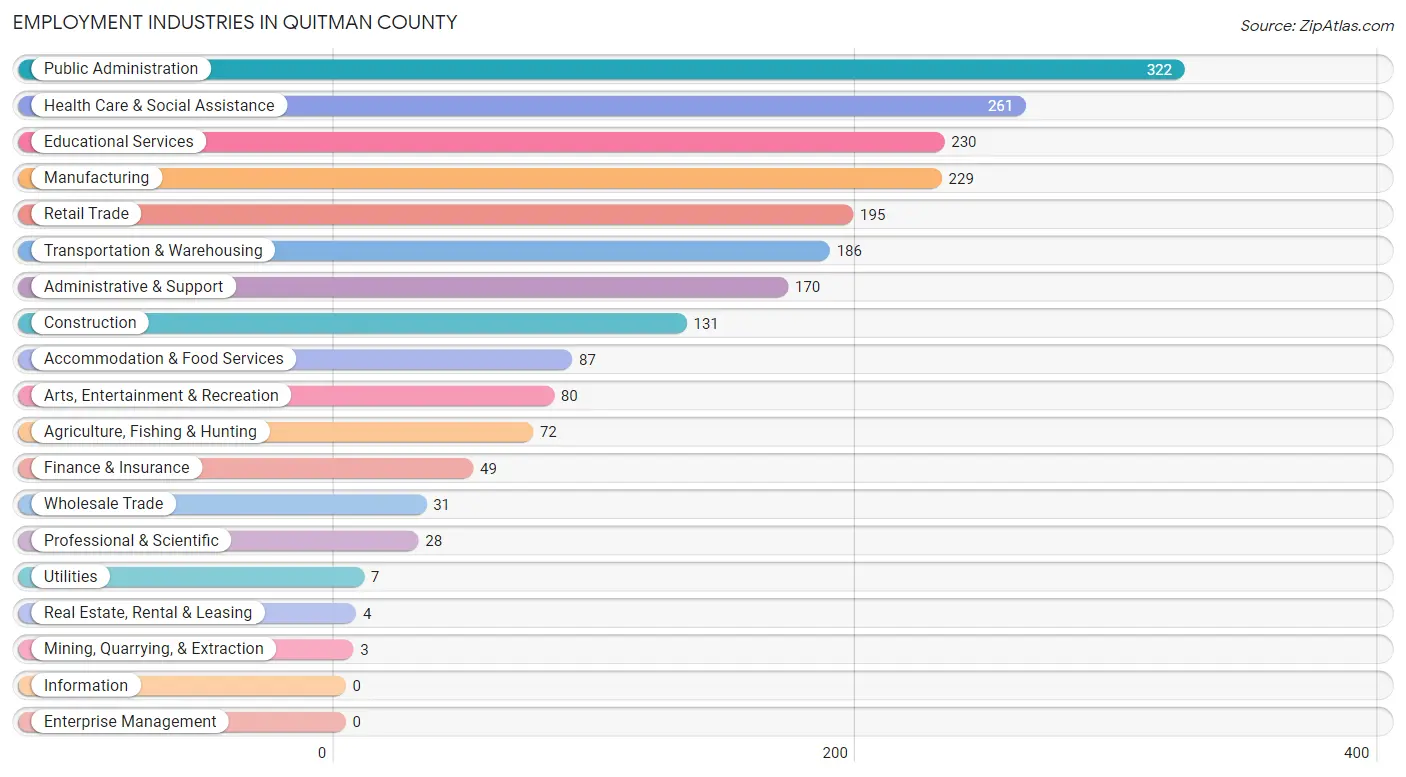
Employment Industries in Quitman County
The major employment industries in Quitman County include Public Administration (322 | 14.7%), Health Care & Social Assistance (261 | 11.9%), Educational Services (230 | 10.5%), Manufacturing (229 | 10.5%), and Retail Trade (195 | 8.9%).
Employment Industries by Sex in Quitman County
The Quitman County industries that see more men than women are Mining, Quarrying, & Extraction (100.0%), Construction (100.0%), and Utilities (100.0%), whereas the industries that tend to have a higher number of women are Real Estate, Rental & Leasing (100.0%), Finance & Insurance (95.9%), and Health Care & Social Assistance (88.9%).
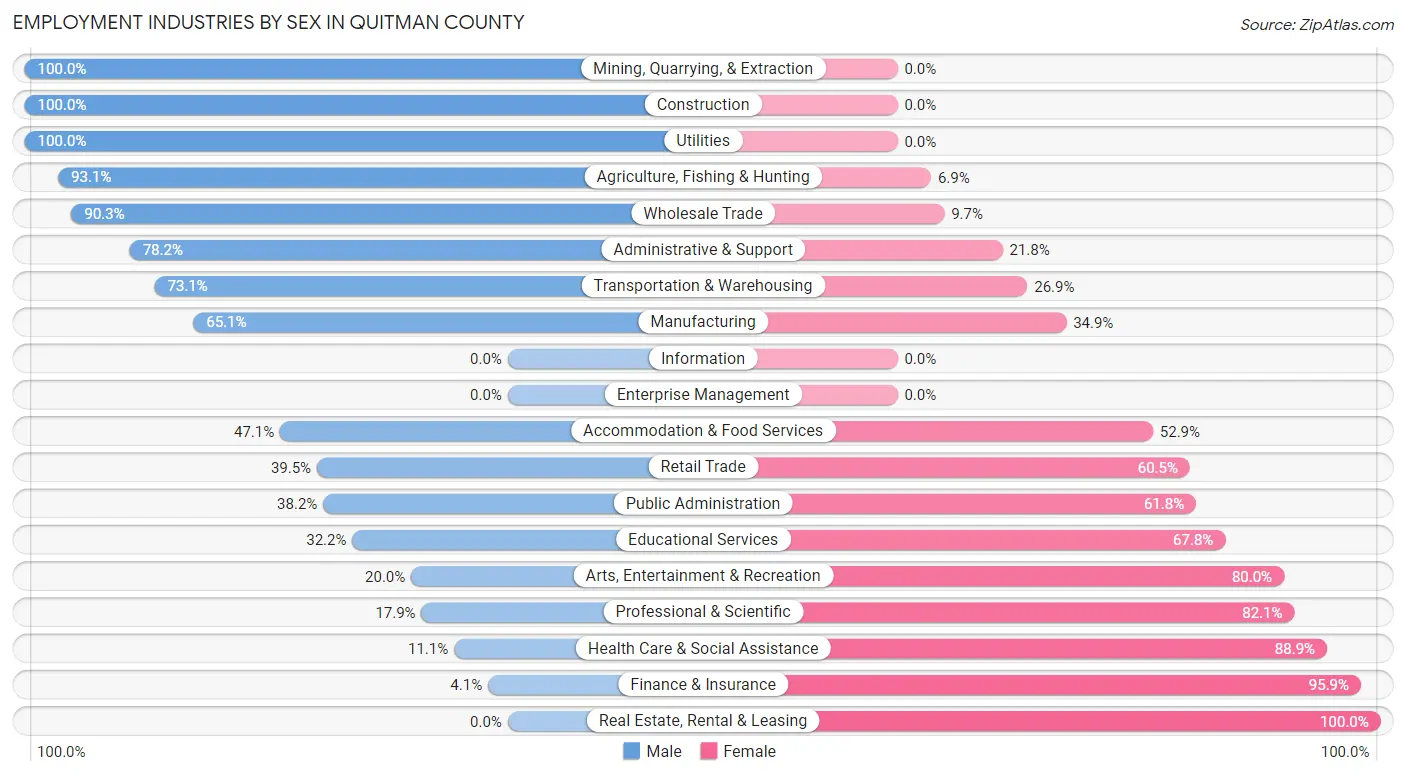
| Industry | Male | Female |
| Agriculture, Fishing & Hunting | 67 (93.1%) | 5 (6.9%) |
| Mining, Quarrying, & Extraction | 3 (100.0%) | 0 (0.0%) |
| Construction | 131 (100.0%) | 0 (0.0%) |
| Manufacturing | 149 (65.1%) | 80 (34.9%) |
| Wholesale Trade | 28 (90.3%) | 3 (9.7%) |
| Retail Trade | 77 (39.5%) | 118 (60.5%) |
| Transportation & Warehousing | 136 (73.1%) | 50 (26.9%) |
| Utilities | 7 (100.0%) | 0 (0.0%) |
| Information | 0 (0.0%) | 0 (0.0%) |
| Finance & Insurance | 2 (4.1%) | 47 (95.9%) |
| Real Estate, Rental & Leasing | 0 (0.0%) | 4 (100.0%) |
| Professional & Scientific | 5 (17.9%) | 23 (82.1%) |
| Enterprise Management | 0 (0.0%) | 0 (0.0%) |
| Administrative & Support | 133 (78.2%) | 37 (21.8%) |
| Educational Services | 74 (32.2%) | 156 (67.8%) |
| Health Care & Social Assistance | 29 (11.1%) | 232 (88.9%) |
| Arts, Entertainment & Recreation | 16 (20.0%) | 64 (80.0%) |
| Accommodation & Food Services | 41 (47.1%) | 46 (52.9%) |
| Public Administration | 123 (38.2%) | 199 (61.8%) |
| Total | 1,054 (48.2%) | 1,133 (51.8%) |
Education in Quitman County
School Enrollment in Quitman County
The most common levels of schooling among the 1,232 students in Quitman County are elementary school (352 | 28.6%), middle school (307 | 24.9%), and high school (267 | 21.7%).

| School Level | # Students | % Students |
| Nursery / Preschool | 86 | 7.0% |
| Kindergarten | 43 | 3.5% |
| Elementary School | 352 | 28.6% |
| Middle School | 307 | 24.9% |
| High School | 267 | 21.7% |
| College / Undergraduate | 176 | 14.3% |
| Graduate / Professional | 1 | 0.1% |
| Total | 1,232 | 100.0% |
School Enrollment by Age by Funding Source in Quitman County
Out of a total of 1,232 students who are enrolled in schools in Quitman County, 108 (8.8%) attend a private institution, while the remaining 1,124 (91.2%) are enrolled in public schools. The age group of 35 years and over has the highest likelihood of being enrolled in private schools, with 4 (15.4% in the age bracket) enrolled. Conversely, the age group of 3 to 4 year olds has the lowest likelihood of being enrolled in a private school, with 64 (100.0% in the age bracket) attending a public institution.
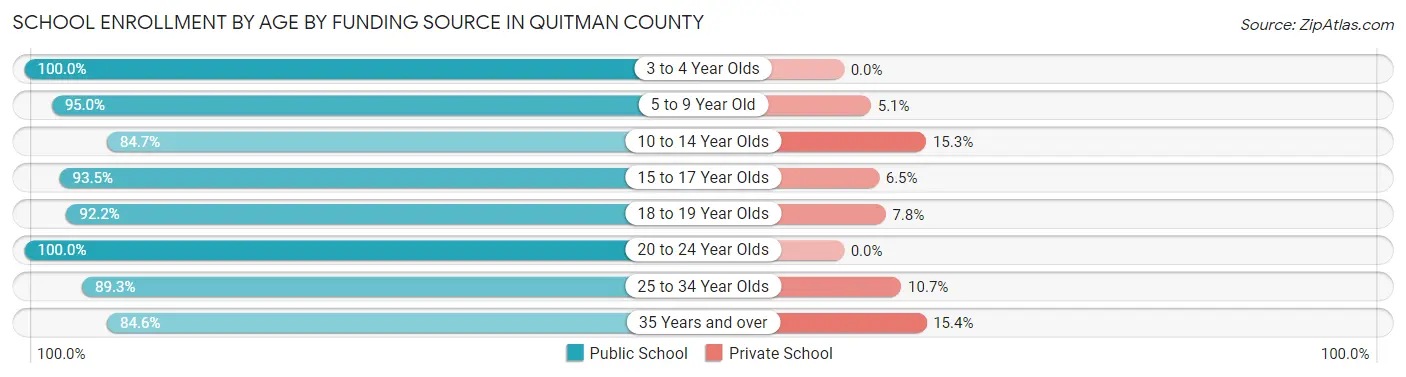
| Age Bracket | Public School | Private School |
| 3 to 4 Year Olds | 64 (100.0%) | 0 (0.0%) |
| 5 to 9 Year Old | 301 (95.0%) | 16 (5.1%) |
| 10 to 14 Year Olds | 359 (84.7%) | 65 (15.3%) |
| 15 to 17 Year Olds | 200 (93.5%) | 14 (6.5%) |
| 18 to 19 Year Olds | 71 (92.2%) | 6 (7.8%) |
| 20 to 24 Year Olds | 82 (100.0%) | 0 (0.0%) |
| 25 to 34 Year Olds | 25 (89.3%) | 3 (10.7%) |
| 35 Years and over | 22 (84.6%) | 4 (15.4%) |
| Total | 1,124 (91.2%) | 108 (8.8%) |
Educational Attainment by Field of Study in Quitman County
Business (156 | 25.8%), education (127 | 21.0%), science & technology (119 | 19.7%), arts & humanities (57 | 9.4%), and communications (39 | 6.5%) are the most common fields of study among 604 individuals in Quitman County who have obtained a bachelor's degree or higher.

| Field of Study | # Graduates | % Graduates |
| Computers & Mathematics | 26 | 4.3% |
| Bio, Nature & Agricultural | 9 | 1.5% |
| Physical & Health Sciences | 1 | 0.2% |
| Psychology | 27 | 4.5% |
| Social Sciences | 2 | 0.3% |
| Engineering | 0 | 0.0% |
| Multidisciplinary Studies | 8 | 1.3% |
| Science & Technology | 119 | 19.7% |
| Business | 156 | 25.8% |
| Education | 127 | 21.0% |
| Literature & Languages | 14 | 2.3% |
| Liberal Arts & History | 7 | 1.2% |
| Visual & Performing Arts | 12 | 2.0% |
| Communications | 39 | 6.5% |
| Arts & Humanities | 57 | 9.4% |
| Total | 604 | 100.0% |
Transportation & Commute in Quitman County
Vehicle Availability by Sex in Quitman County
The most prevalent vehicle ownership categories in Quitman County are males with 2 vehicles (330, accounting for 32.6%) and females with 2 vehicles (364, making up 29.6%).

| Vehicles Available | Male | Female |
| No Vehicle | 35 (3.5%) | 66 (5.9%) |
| 1 Vehicle | 285 (28.2%) | 299 (26.8%) |
| 2 Vehicles | 330 (32.6%) | 364 (32.7%) |
| 3 Vehicles | 217 (21.4%) | 194 (17.4%) |
| 4 Vehicles | 124 (12.2%) | 139 (12.5%) |
| 5 or more Vehicles | 21 (2.1%) | 52 (4.7%) |
| Total | 1,012 (100.0%) | 1,114 (100.0%) |
Commute Time in Quitman County
The most frequently occuring commute durations in Quitman County are 30 to 34 minutes (299 commuters, 14.6%), 10 to 14 minutes (282 commuters, 13.8%), and 15 to 19 minutes (259 commuters, 12.7%).

| Commute Time | # Commuters | % Commuters |
| Less than 5 Minutes | 107 | 5.2% |
| 5 to 9 Minutes | 125 | 6.1% |
| 10 to 14 Minutes | 282 | 13.8% |
| 15 to 19 Minutes | 259 | 12.7% |
| 20 to 24 Minutes | 60 | 2.9% |
| 25 to 29 Minutes | 148 | 7.2% |
| 30 to 34 Minutes | 299 | 14.6% |
| 35 to 39 Minutes | 120 | 5.9% |
| 40 to 44 Minutes | 138 | 6.8% |
| 45 to 59 Minutes | 217 | 10.6% |
| 60 to 89 Minutes | 240 | 11.7% |
| 90 or more Minutes | 50 | 2.4% |
Commute Time by Sex in Quitman County
The most common commute times in Quitman County are 15 to 19 minutes (173 commuters, 17.5%) for males and 10 to 14 minutes (178 commuters, 16.9%) for females.
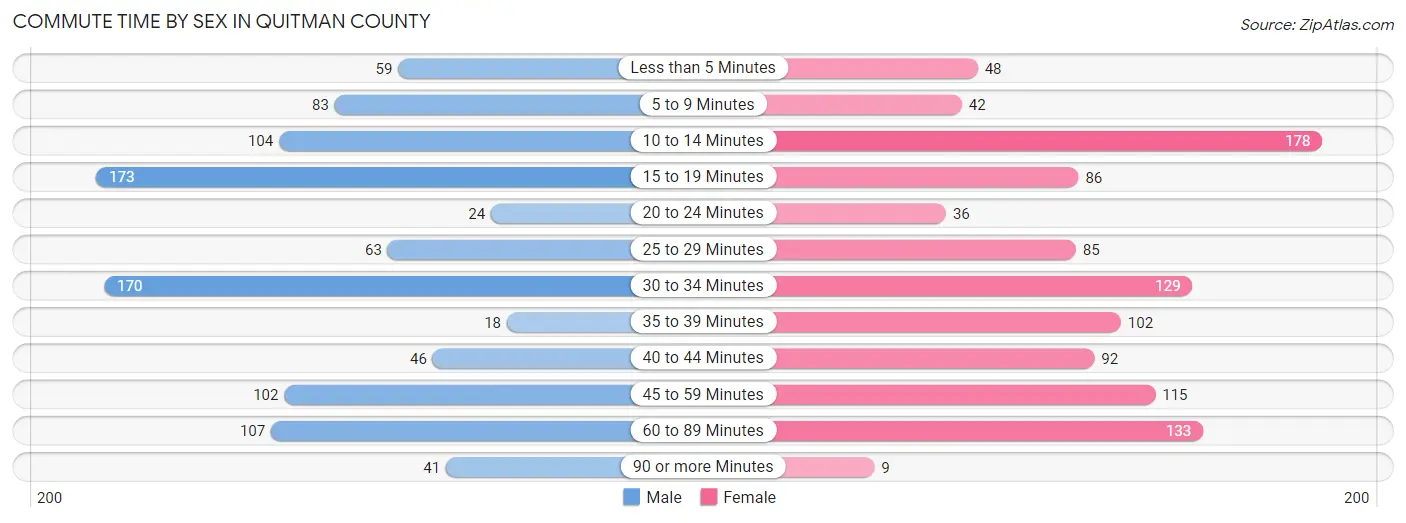
| Commute Time | Male | Female |
| Less than 5 Minutes | 59 (6.0%) | 48 (4.5%) |
| 5 to 9 Minutes | 83 (8.4%) | 42 (4.0%) |
| 10 to 14 Minutes | 104 (10.5%) | 178 (16.9%) |
| 15 to 19 Minutes | 173 (17.5%) | 86 (8.2%) |
| 20 to 24 Minutes | 24 (2.4%) | 36 (3.4%) |
| 25 to 29 Minutes | 63 (6.4%) | 85 (8.1%) |
| 30 to 34 Minutes | 170 (17.2%) | 129 (12.2%) |
| 35 to 39 Minutes | 18 (1.8%) | 102 (9.7%) |
| 40 to 44 Minutes | 46 (4.6%) | 92 (8.7%) |
| 45 to 59 Minutes | 102 (10.3%) | 115 (10.9%) |
| 60 to 89 Minutes | 107 (10.8%) | 133 (12.6%) |
| 90 or more Minutes | 41 (4.1%) | 9 (0.9%) |
Time of Departure to Work by Sex in Quitman County
The most frequent times of departure to work in Quitman County are 6:00 AM to 6:29 AM (230, 23.2%) for males and 7:00 AM to 7:29 AM (151, 14.3%) for females.

| Time of Departure | Male | Female |
| 12:00 AM to 4:59 AM | 75 (7.6%) | 65 (6.2%) |
| 5:00 AM to 5:29 AM | 67 (6.8%) | 37 (3.5%) |
| 5:30 AM to 5:59 AM | 82 (8.3%) | 75 (7.1%) |
| 6:00 AM to 6:29 AM | 230 (23.2%) | 107 (10.1%) |
| 6:30 AM to 6:59 AM | 106 (10.7%) | 110 (10.4%) |
| 7:00 AM to 7:29 AM | 130 (13.1%) | 151 (14.3%) |
| 7:30 AM to 7:59 AM | 73 (7.4%) | 151 (14.3%) |
| 8:00 AM to 8:29 AM | 72 (7.3%) | 77 (7.3%) |
| 8:30 AM to 8:59 AM | 2 (0.2%) | 4 (0.4%) |
| 9:00 AM to 9:59 AM | 16 (1.6%) | 19 (1.8%) |
| 10:00 AM to 10:59 AM | 49 (5.0%) | 25 (2.4%) |
| 11:00 AM to 11:59 AM | 34 (3.4%) | 2 (0.2%) |
| 12:00 PM to 3:59 PM | 15 (1.5%) | 99 (9.4%) |
| 4:00 PM to 11:59 PM | 39 (3.9%) | 133 (12.6%) |
| Total | 990 (100.0%) | 1,055 (100.0%) |
Housing Occupancy in Quitman County
Occupancy by Ownership in Quitman County
Of the total 2,656 dwellings in Quitman County, owner-occupied units account for 1,523 (57.3%), while renter-occupied units make up 1,133 (42.7%).
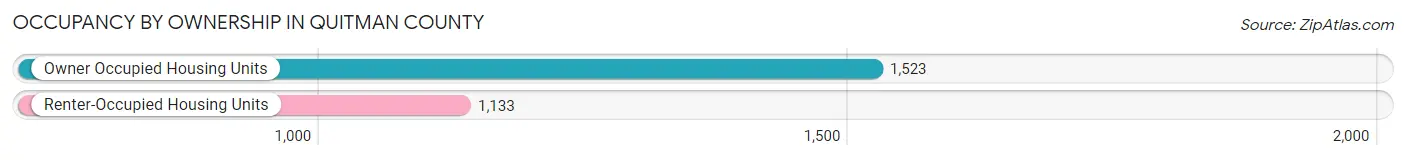
| Occupancy | # Housing Units | % Housing Units |
| Owner Occupied Housing Units | 1,523 | 57.3% |
| Renter-Occupied Housing Units | 1,133 | 42.7% |
| Total Occupied Housing Units | 2,656 | 100.0% |
Occupancy by Household Size in Quitman County

| Household Size | # Housing Units | % Housing Units |
| 1-Person Household | 1,002 | 37.7% |
| 2-Person Household | 731 | 27.5% |
| 3-Person Household | 404 | 15.2% |
| 4+ Person Household | 519 | 19.5% |
| Total Housing Units | 2,656 | 100.0% |
Occupancy by Ownership by Household Size in Quitman County

| Household Size | Owner-occupied | Renter-occupied |
| 1-Person Household | 489 (48.8%) | 513 (51.2%) |
| 2-Person Household | 550 (75.2%) | 181 (24.8%) |
| 3-Person Household | 270 (66.8%) | 134 (33.2%) |
| 4+ Person Household | 214 (41.2%) | 305 (58.8%) |
| Total Housing Units | 1,523 (57.3%) | 1,133 (42.7%) |
Occupancy by Educational Attainment in Quitman County

| Household Size | Owner-occupied | Renter-occupied |
| Less than High School | 322 (45.3%) | 389 (54.7%) |
| High School Diploma | 417 (53.3%) | 366 (46.7%) |
| College/Associate Degree | 479 (60.2%) | 317 (39.8%) |
| Bachelor's Degree or higher | 305 (83.3%) | 61 (16.7%) |
Occupancy by Age of Householder in Quitman County

| Age Bracket | # Households | % Households |
| Under 35 Years | 457 | 17.2% |
| 35 to 44 Years | 375 | 14.1% |
| 45 to 54 Years | 477 | 18.0% |
| 55 to 64 Years | 649 | 24.4% |
| 65 to 74 Years | 415 | 15.6% |
| 75 to 84 Years | 253 | 9.5% |
| 85 Years and Over | 30 | 1.1% |
| Total | 2,656 | 100.0% |
Housing Finances in Quitman County
Median Income by Occupancy in Quitman County

| Occupancy Type | # Households | Median Income |
| Owner-Occupied | 1,523 (57.3%) | $40,625 |
| Renter-Occupied | 1,133 (42.7%) | $18,734 |
| Average | 2,656 (100.0%) | $31,192 |
Occupancy by Householder Income Bracket in Quitman County

| Income Bracket | Owner-occupied | Renter-occupied |
| Less than $5,000 | 37 (2.4%) | 131 (11.6%) |
| $5,000 to $9,999 | 63 (4.1%) | 93 (8.2%) |
| $10,000 to $14,999 | 123 (8.1%) | 234 (20.6%) |
| $15,000 to $19,999 | 136 (8.9%) | 147 (13.0%) |
| $20,000 to $24,999 | 100 (6.6%) | 58 (5.1%) |
| $25,000 to $34,999 | 230 (15.1%) | 60 (5.3%) |
| $35,000 to $49,999 | 227 (14.9%) | 152 (13.4%) |
| $50,000 to $74,999 | 259 (17.0%) | 172 (15.2%) |
| $75,000 to $99,999 | 130 (8.5%) | 48 (4.2%) |
| $100,000 to $149,999 | 155 (10.2%) | 37 (3.3%) |
| $150,000 or more | 63 (4.1%) | 1 (0.1%) |
| Total | 1,523 (100.0%) | 1,133 (100.0%) |
Monthly Housing Cost Tiers in Quitman County

| Monthly Cost | Owner-occupied | Renter-occupied |
| Less than $300 | 406 (26.7%) | 135 (11.9%) |
| $300 to $499 | 516 (33.9%) | 134 (11.8%) |
| $500 to $799 | 265 (17.4%) | 351 (31.0%) |
| $800 to $999 | 193 (12.7%) | 152 (13.4%) |
| $1,000 to $1,499 | 95 (6.2%) | 74 (6.5%) |
| $1,500 to $1,999 | 7 (0.5%) | 1 (0.1%) |
| $2,000 to $2,499 | 6 (0.4%) | 0 (0.0%) |
| $2,500 to $2,999 | 15 (1.0%) | 0 (0.0%) |
| $3,000 or more | 20 (1.3%) | 0 (0.0%) |
| Total | 1,523 (100.0%) | 1,133 (100.0%) |
Physical Housing Characteristics in Quitman County
Housing Structures in Quitman County
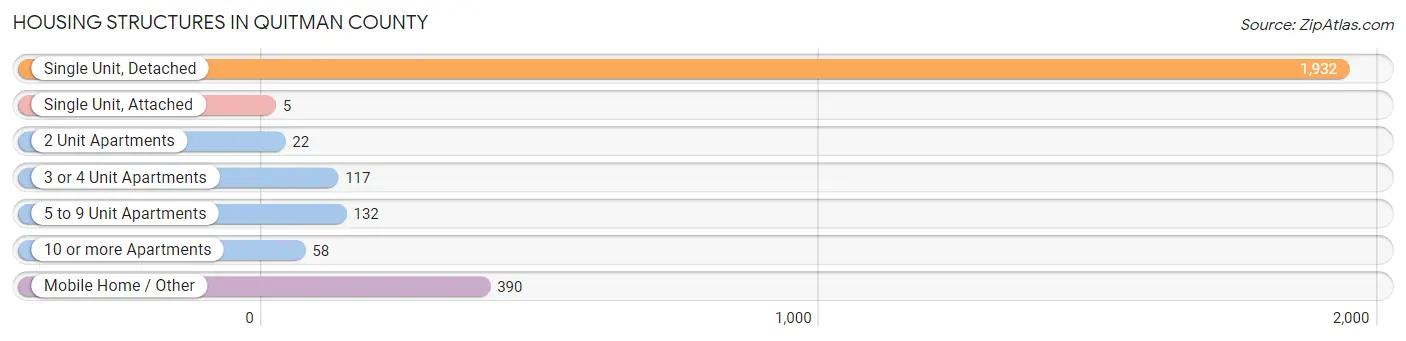
| Structure Type | # Housing Units | % Housing Units |
| Single Unit, Detached | 1,932 | 72.7% |
| Single Unit, Attached | 5 | 0.2% |
| 2 Unit Apartments | 22 | 0.8% |
| 3 or 4 Unit Apartments | 117 | 4.4% |
| 5 to 9 Unit Apartments | 132 | 5.0% |
| 10 or more Apartments | 58 | 2.2% |
| Mobile Home / Other | 390 | 14.7% |
| Total | 2,656 | 100.0% |
Housing Structures by Occupancy in Quitman County

| Structure Type | Owner-occupied | Renter-occupied |
| Single Unit, Detached | 1,255 (65.0%) | 677 (35.0%) |
| Single Unit, Attached | 0 (0.0%) | 5 (100.0%) |
| 2 Unit Apartments | 0 (0.0%) | 22 (100.0%) |
| 3 or 4 Unit Apartments | 0 (0.0%) | 117 (100.0%) |
| 5 to 9 Unit Apartments | 0 (0.0%) | 132 (100.0%) |
| 10 or more Apartments | 0 (0.0%) | 58 (100.0%) |
| Mobile Home / Other | 268 (68.7%) | 122 (31.3%) |
| Total | 1,523 (57.3%) | 1,133 (42.7%) |
Housing Structures by Number of Rooms in Quitman County
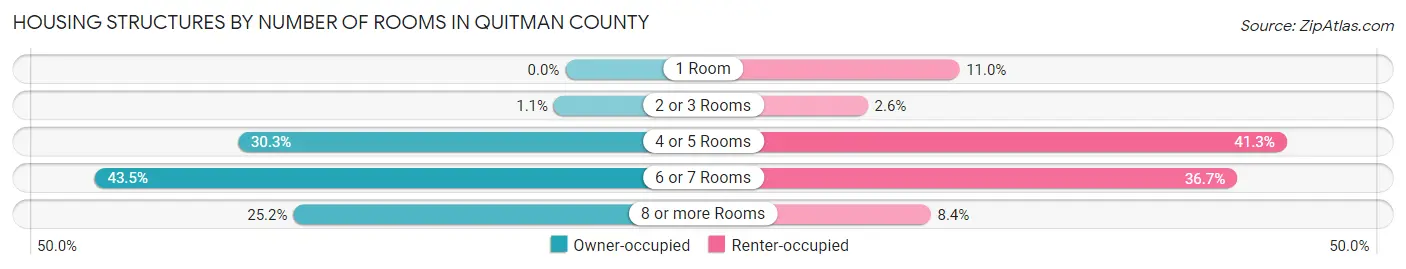
| Number of Rooms | Owner-occupied | Renter-occupied |
| 1 Room | 0 (0.0%) | 125 (11.0%) |
| 2 or 3 Rooms | 16 (1.1%) | 29 (2.6%) |
| 4 or 5 Rooms | 461 (30.3%) | 468 (41.3%) |
| 6 or 7 Rooms | 663 (43.5%) | 416 (36.7%) |
| 8 or more Rooms | 383 (25.2%) | 95 (8.4%) |
| Total | 1,523 (100.0%) | 1,133 (100.0%) |
Housing Structure by Heating Type in Quitman County
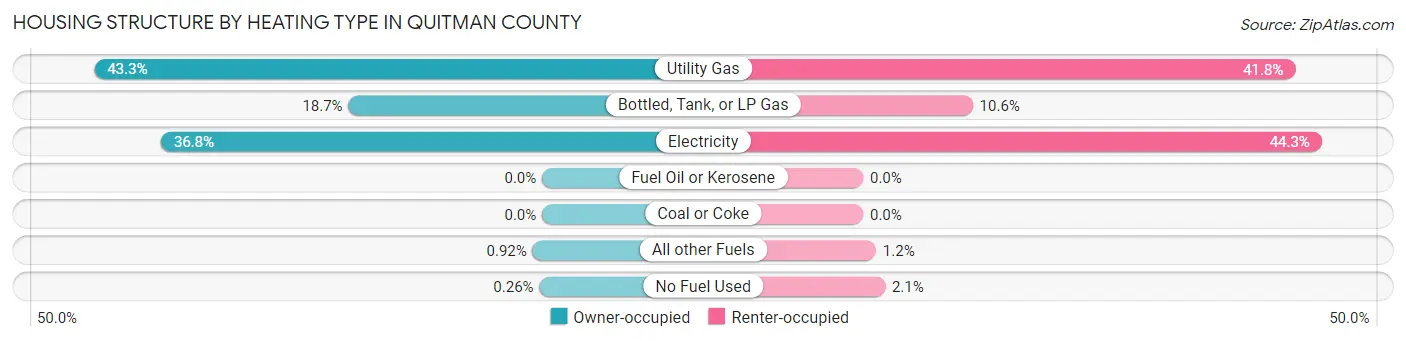
| Heating Type | Owner-occupied | Renter-occupied |
| Utility Gas | 659 (43.3%) | 473 (41.7%) |
| Bottled, Tank, or LP Gas | 285 (18.7%) | 120 (10.6%) |
| Electricity | 561 (36.8%) | 502 (44.3%) |
| Fuel Oil or Kerosene | 0 (0.0%) | 0 (0.0%) |
| Coal or Coke | 0 (0.0%) | 0 (0.0%) |
| All other Fuels | 14 (0.9%) | 14 (1.2%) |
| No Fuel Used | 4 (0.3%) | 24 (2.1%) |
| Total | 1,523 (100.0%) | 1,133 (100.0%) |
Household Vehicle Usage in Quitman County

| Vehicles per Household | Owner-occupied | Renter-occupied |
| No Vehicle | 107 (7.0%) | 282 (24.9%) |
| 1 Vehicle | 542 (35.6%) | 485 (42.8%) |
| 2 Vehicles | 563 (37.0%) | 239 (21.1%) |
| 3 or more Vehicles | 311 (20.4%) | 127 (11.2%) |
| Total | 1,523 (100.0%) | 1,133 (100.0%) |
Real Estate & Mortgages in Quitman County
Real Estate and Mortgage Overview in Quitman County
| Characteristic | Without Mortgage | With Mortgage |
| Housing Units | 1,106 | 417 |
| Median Property Value | $57,300 | $90,100 |
| Median Household Income | $36,125 | $34 |
| Monthly Housing Costs | $365 | $20 |
| Real Estate Taxes | $599 | $118 |
Property Value by Mortgage Status in Quitman County

| Property Value | Without Mortgage | With Mortgage |
| Less than $50,000 | 442 (40.0%) | 57 (13.7%) |
| $50,000 to $99,999 | 424 (38.3%) | 228 (54.7%) |
| $100,000 to $299,999 | 199 (18.0%) | 126 (30.2%) |
| $300,000 to $499,999 | 22 (2.0%) | 5 (1.2%) |
| $500,000 to $749,999 | 10 (0.9%) | 0 (0.0%) |
| $750,000 to $999,999 | 0 (0.0%) | 1 (0.2%) |
| $1,000,000 or more | 9 (0.8%) | 0 (0.0%) |
| Total | 1,106 (100.0%) | 417 (100.0%) |
Household Income by Mortgage Status in Quitman County
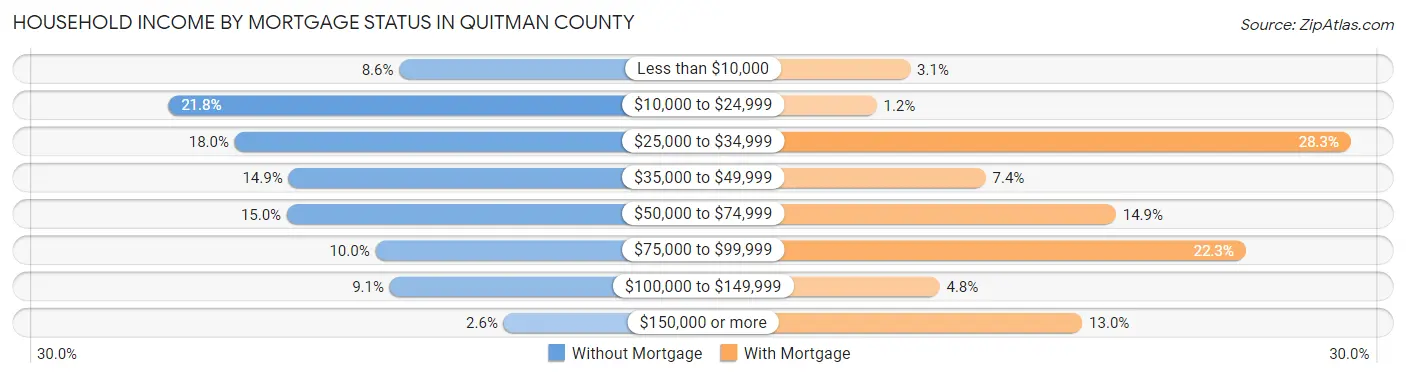
| Household Income | Without Mortgage | With Mortgage |
| Less than $10,000 | 95 (8.6%) | 13 (3.1%) |
| $10,000 to $24,999 | 241 (21.8%) | 5 (1.2%) |
| $25,000 to $34,999 | 199 (18.0%) | 118 (28.3%) |
| $35,000 to $49,999 | 165 (14.9%) | 31 (7.4%) |
| $50,000 to $74,999 | 166 (15.0%) | 62 (14.9%) |
| $75,000 to $99,999 | 110 (10.0%) | 93 (22.3%) |
| $100,000 to $149,999 | 101 (9.1%) | 20 (4.8%) |
| $150,000 or more | 29 (2.6%) | 54 (13.0%) |
| Total | 1,106 (100.0%) | 417 (100.0%) |
Property Value to Household Income Ratio in Quitman County

| Value-to-Income Ratio | Without Mortgage | With Mortgage |
| Less than 2.0x | 684 (61.8%) | 49,279 (11,817.5%) |
| 2.0x to 2.9x | 139 (12.6%) | 261 (62.6%) |
| 3.0x to 3.9x | 67 (6.1%) | 13 (3.1%) |
| 4.0x or more | 207 (18.7%) | 74 (17.7%) |
| Total | 1,106 (100.0%) | 417 (100.0%) |
Real Estate Taxes by Mortgage Status in Quitman County

| Property Taxes | Without Mortgage | With Mortgage |
| Less than $800 | 332 (30.0%) | 4 (1.0%) |
| $800 to $1,499 | 134 (12.1%) | 85 (20.4%) |
| $800 to $1,499 | 45 (4.1%) | 125 (30.0%) |
| Total | 1,106 (100.0%) | 417 (100.0%) |
Health & Disability in Quitman County
Health Insurance Coverage by Age in Quitman County

| Age Bracket | With Coverage | Without Coverage |
| Under 6 Years | 461 (100.0%) | 0 (0.0%) |
| 6 to 18 Years | 967 (98.2%) | 18 (1.8%) |
| 19 to 25 Years | 327 (64.4%) | 181 (35.6%) |
| 26 to 34 Years | 483 (70.3%) | 204 (29.7%) |
| 35 to 44 Years | 426 (66.7%) | 213 (33.3%) |
| 45 to 54 Years | 593 (77.4%) | 173 (22.6%) |
| 55 to 64 Years | 701 (82.8%) | 146 (17.2%) |
| 65 to 74 Years | 654 (100.0%) | 0 (0.0%) |
| 75 Years and older | 375 (100.0%) | 0 (0.0%) |
| Total | 4,987 (84.2%) | 935 (15.8%) |
Health Insurance Coverage by Citizenship Status in Quitman County

| Citizenship Status | With Coverage | Without Coverage |
| Native Born | 461 (100.0%) | 0 (0.0%) |
| Foreign Born, Citizen | 967 (98.2%) | 18 (1.8%) |
| Foreign Born, not a Citizen | 327 (64.4%) | 181 (35.6%) |
Health Insurance Coverage by Household Income in Quitman County

| Household Income | With Coverage | Without Coverage |
| Under $25,000 | 1,669 (78.6%) | 454 (21.4%) |
| $25,000 to $49,999 | 1,189 (87.1%) | 176 (12.9%) |
| $50,000 to $74,999 | 917 (85.5%) | 155 (14.5%) |
| $75,000 to $99,999 | 464 (81.4%) | 106 (18.6%) |
| $100,000 and over | 748 (94.4%) | 44 (5.6%) |
Public vs Private Health Insurance Coverage by Age in Quitman County

| Age Bracket | Public Insurance | Private Insurance |
| Under 6 | 422 (91.5%) | 56 (12.1%) |
| 6 to 18 Years | 767 (77.9%) | 271 (27.5%) |
| 19 to 25 Years | 154 (30.3%) | 185 (36.4%) |
| 25 to 34 Years | 151 (22.0%) | 344 (50.1%) |
| 35 to 44 Years | 151 (23.6%) | 310 (48.5%) |
| 45 to 54 Years | 196 (25.6%) | 423 (55.2%) |
| 55 to 64 Years | 394 (46.5%) | 336 (39.7%) |
| 65 to 74 Years | 637 (97.4%) | 201 (30.7%) |
| 75 Years and over | 375 (100.0%) | 152 (40.5%) |
| Total | 3,247 (54.8%) | 2,278 (38.5%) |
Disability Status by Sex by Age in Quitman County

| Age Bracket | Male | Female |
| Under 5 Years | 0 (0.0%) | 0 (0.0%) |
| 5 to 17 Years | 38 (7.3%) | 33 (6.6%) |
| 18 to 34 Years | 15 (2.6%) | 75 (11.1%) |
| 35 to 64 Years | 194 (19.1%) | 236 (19.1%) |
| 65 to 74 Years | 116 (40.7%) | 139 (37.7%) |
| 75 Years and over | 68 (39.5%) | 91 (44.8%) |
Disability Class by Sex by Age in Quitman County
Disability Class: Hearing Difficulty

| Age Bracket | Male | Female |
| Under 5 Years | 0 (0.0%) | 0 (0.0%) |
| 5 to 17 Years | 0 (0.0%) | 0 (0.0%) |
| 18 to 34 Years | 9 (1.6%) | 12 (1.8%) |
| 35 to 64 Years | 17 (1.7%) | 2 (0.2%) |
| 65 to 74 Years | 32 (11.2%) | 17 (4.6%) |
| 75 Years and over | 16 (9.3%) | 13 (6.4%) |
Disability Class: Vision Difficulty
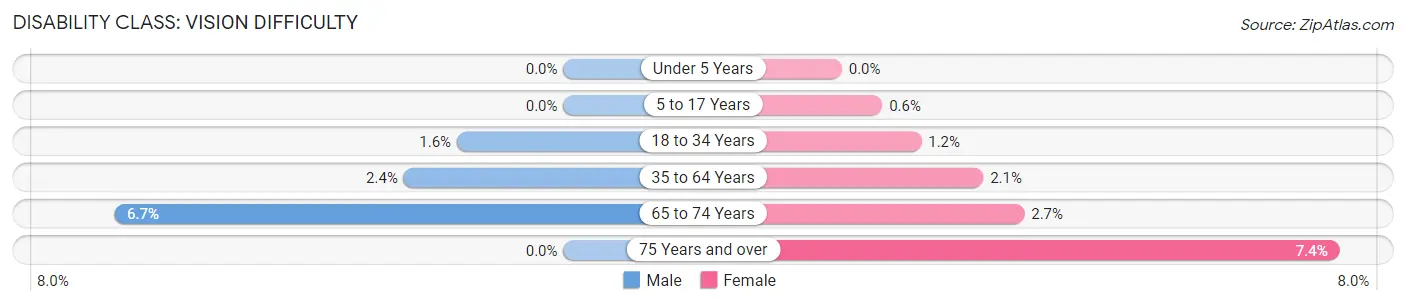
| Age Bracket | Male | Female |
| Under 5 Years | 0 (0.0%) | 0 (0.0%) |
| 5 to 17 Years | 0 (0.0%) | 3 (0.6%) |
| 18 to 34 Years | 9 (1.6%) | 8 (1.2%) |
| 35 to 64 Years | 24 (2.4%) | 26 (2.1%) |
| 65 to 74 Years | 19 (6.7%) | 10 (2.7%) |
| 75 Years and over | 0 (0.0%) | 15 (7.4%) |
Disability Class: Cognitive Difficulty
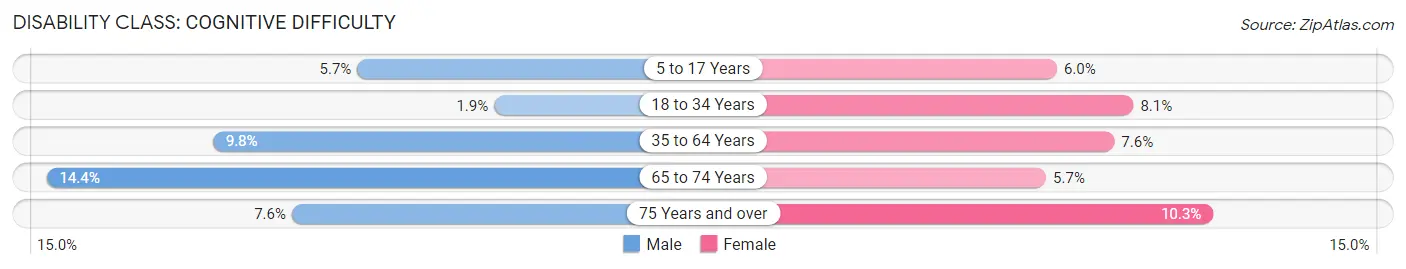
| Age Bracket | Male | Female |
| 5 to 17 Years | 30 (5.7%) | 30 (6.0%) |
| 18 to 34 Years | 11 (1.9%) | 55 (8.1%) |
| 35 to 64 Years | 99 (9.8%) | 94 (7.6%) |
| 65 to 74 Years | 41 (14.4%) | 21 (5.7%) |
| 75 Years and over | 13 (7.6%) | 21 (10.3%) |
Disability Class: Ambulatory Difficulty

| Age Bracket | Male | Female |
| 5 to 17 Years | 12 (2.3%) | 0 (0.0%) |
| 18 to 34 Years | 0 (0.0%) | 51 (7.5%) |
| 35 to 64 Years | 94 (9.3%) | 192 (15.5%) |
| 65 to 74 Years | 55 (19.3%) | 88 (23.8%) |
| 75 Years and over | 50 (29.1%) | 65 (32.0%) |
Disability Class: Self-Care Difficulty

| Age Bracket | Male | Female |
| 5 to 17 Years | 18 (3.4%) | 0 (0.0%) |
| 18 to 34 Years | 0 (0.0%) | 37 (5.5%) |
| 35 to 64 Years | 23 (2.3%) | 41 (3.3%) |
| 65 to 74 Years | 6 (2.1%) | 12 (3.3%) |
| 75 Years and over | 23 (13.4%) | 15 (7.4%) |
Technology Access in Quitman County
Computing Device Access in Quitman County

| Device Type | # Households | % Households |
| Desktop or Laptop | 1,219 | 45.9% |
| Smartphone | 2,065 | 77.7% |
| Tablet | 951 | 35.8% |
| No Computing Device | 460 | 17.3% |
| Total | 2,656 | 100.0% |
Internet Access in Quitman County

| Internet Type | # Households | % Households |
| Dial-Up Internet | 3 | 0.1% |
| Broadband Home | 572 | 21.5% |
| Cellular Data Only | 829 | 31.2% |
| Satellite Internet | 296 | 11.1% |
| No Internet | 972 | 36.6% |
| Total | 2,656 | 100.0% |
Quitman County Summary
Quitman County is located in the northeastern corner of Mississippi, and is bordered by the states of Tennessee and Alabama. It is part of the Delta region of the state, and is home to a population of 8,223 people, according to the 2010 census. The county seat is Marks, and the county is named for John A. Quitman, a former governor of Mississippi.
History
Quitman County was formed in 1877 from portions of Chickasaw and Tallahatchie counties. The county was named for John A. Quitman, a former governor of Mississippi. The county was originally part of the Chickasaw Cession of 1832, and was home to the Chickasaw and Choctaw tribes prior to the arrival of European settlers.
The first settlers in the area were mostly farmers, and the county was largely agricultural until the early 20th century. The first railroad line was built in the county in 1884, and this led to the development of several small towns, including Marks, Lambert, and Crowder.
The county was also home to several large plantations, and the economy was largely based on cotton production. The county was also home to several sawmills and lumber companies, which provided employment for many of the county’s residents.
Geography
Quitman County is located in the northeastern corner of Mississippi, and is bordered by the states of Tennessee and Alabama. It is part of the Delta region of the state, and is home to a population of 8,223 people, according to the 2010 census. The county seat is Marks, and the county is named for John A. Quitman, a former governor of Mississippi.
The county is mostly flat, with an elevation ranging from 200 to 400 feet above sea level. The terrain is mostly covered in hardwood forests, and the soil is mostly sandy loam. The county is drained by the Yalobusha River, which flows through the county from north to south.
Economy
The economy of Quitman County is largely based on agriculture, with cotton, soybeans, and corn being the main crops. The county is also home to several sawmills and lumber companies, which provide employment for many of the county’s residents.
The county is also home to several small businesses, including restaurants, retail stores, and service providers. The county is also home to several manufacturing companies, including a furniture factory and a paper mill.
Demographics
According to the 2010 census, the population of Quitman County was 8,223 people. The racial makeup of the county was 79.3% White, 18.3% African American, 0.3% Native American, 0.2% Asian, 0.1% Pacific Islander, 0.7% from other races, and 1.2% from two or more races. Hispanic or Latino of any race were 1.7% of the population.
The median income for a household in the county was $30,938, and the median income for a family was $37,917. The per capita income for the county was $15,845. About 19.2% of the population was below the poverty line.
Common Questions
What is the Total Population of Quitman County?
Total Population of Quitman County is 6,113.
What is the Total Male Population of Quitman County?
Total Male Population of Quitman County is 2,877.
What is the Total Female Population of Quitman County?
Total Female Population of Quitman County is 3,236.
What is the Ratio of Males per 100 Females in Quitman County?
There are 88.91 Males per 100 Females in Quitman County.
What is the Ratio of Females per 100 Males in Quitman County?
There are 112.48 Females per 100 Males in Quitman County.
What is the Median Population Age in Quitman County?
Median Population Age in Quitman County is 40.1 Years.
What is the Average Family Size in Quitman County
Average Family Size in Quitman County is 2.9 People.
What is the Average Household Size in Quitman County
Average Household Size in Quitman County is 2.2 People.
What is Per Capita Income in Quitman County?
Per Capita income in Quitman County is $18,546.
What is the Median Family Income in Quitman County?
Median Family Income in Quitman County is $46,029.
What is the Median Household income in Quitman County?
Median Household Income in Quitman County is $31,192.
What is Income or Wage Gap in Quitman County?
Income or Wage Gap in Quitman County is 13.2%.
Women in Quitman County earn 86.8 cents for every dollar earned by a man.
What is Family Income Deficit in Quitman County?
Family Income Deficit in Quitman County is $14,664.
Families that are below poverty line in Quitman County earn $14,664 less on average than the poverty threshold level.
What is Inequality or Gini Index in Quitman County?
Inequality or Gini Index in Quitman County is 0.46.
How Large is the Labor Force in Quitman County?
There are 2,513 People in the Labor Forcein in Quitman County.
What is the Percentage of People in the Labor Force in Quitman County?
51.6% of People are in the Labor Force in Quitman County.
What is the Unemployment Rate in Quitman County?
Unemployment Rate in Quitman County is 12.2%.