Lee County, MS
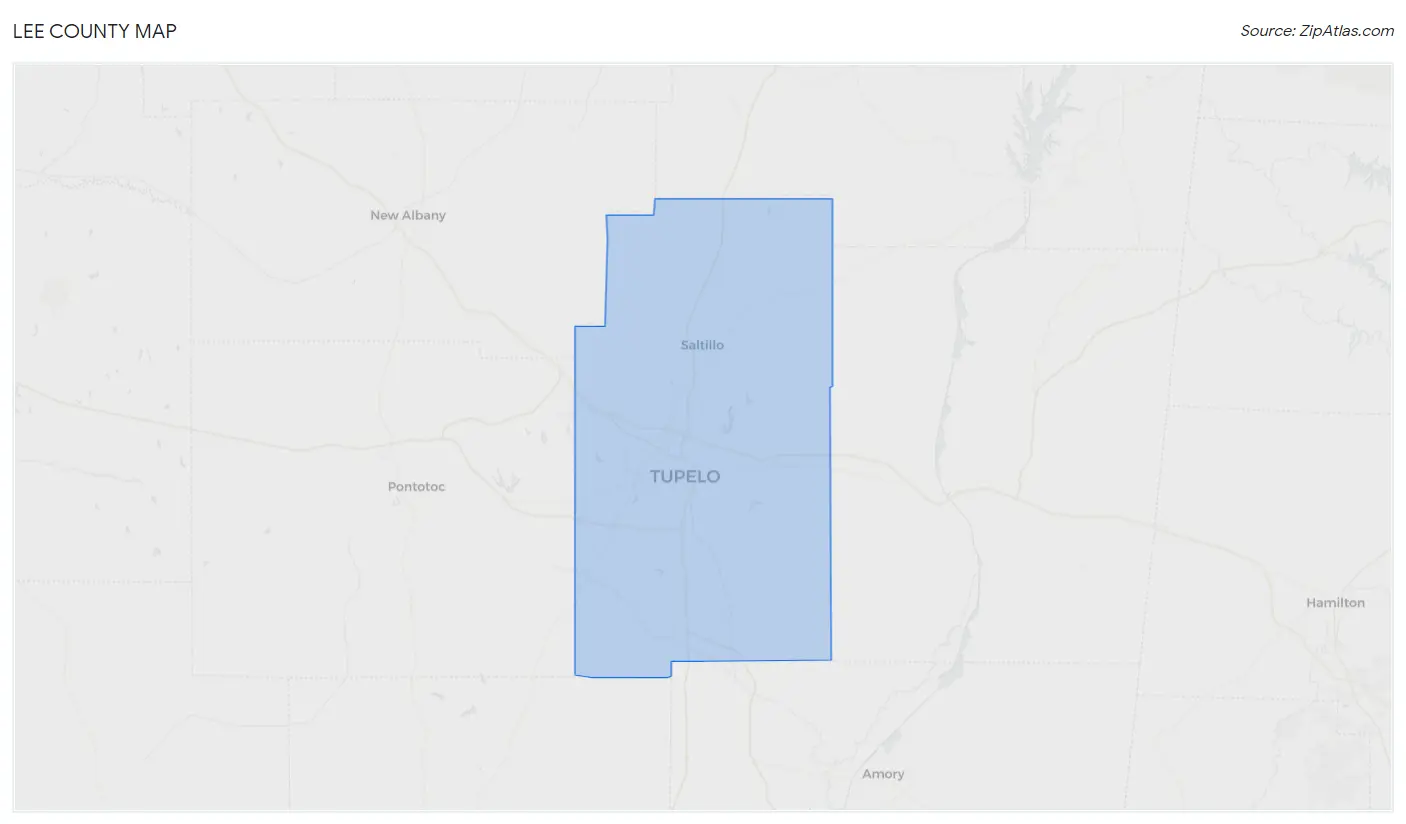
Lee County Map
Lee County Overview
83,343
TOTAL POPULATION
39,817
MALE POPULATION
43,526
FEMALE POPULATION
91.48
MALES / 100 FEMALES
109.32
FEMALES / 100 MALES
37.4
MEDIAN AGE
3.1
AVG FAMILY SIZE
2.6
AVG HOUSEHOLD SIZE
$33,209
PER CAPITA INCOME
$80,674
AVG FAMILY INCOME
$64,479
AVG HOUSEHOLD INCOME
31.4%
WAGE / INCOME GAP [ % ]
68.6¢/ $1
WAGE / INCOME GAP [ $ ]
$10,227
FAMILY INCOME DEFICIT
0.46
INEQUALITY / GINI INDEX
41,054
LABOR FORCE [ PEOPLE ]
62.9%
PERCENT IN LABOR FORCE
5.6%
UNEMPLOYMENT RATE
Lee County Area Codes
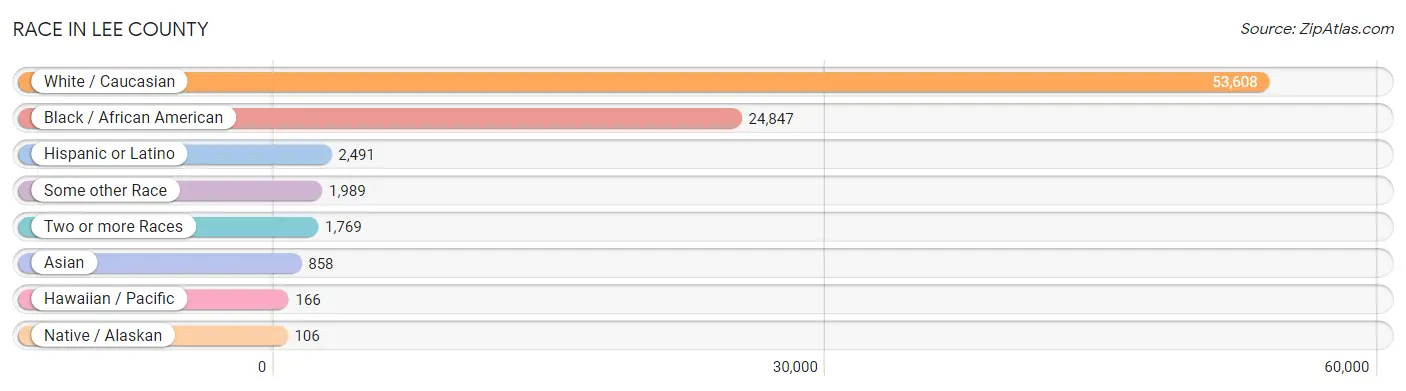
Race in Lee County
The most populous races in Lee County are White / Caucasian (53,608 | 64.3%), Black / African American (24,847 | 29.8%), and Hispanic or Latino (2,491 | 3.0%).
| Race | # Population | % Population |
| Asian | 858 | 1.0% |
| Black / African American | 24,847 | 29.8% |
| Hawaiian / Pacific | 166 | 0.2% |
| Hispanic or Latino | 2,491 | 3.0% |
| Native / Alaskan | 106 | 0.1% |
| White / Caucasian | 53,608 | 64.3% |
| Two or more Races | 1,769 | 2.1% |
| Some other Race | 1,989 | 2.4% |
| Total | 83,343 | 100.0% |
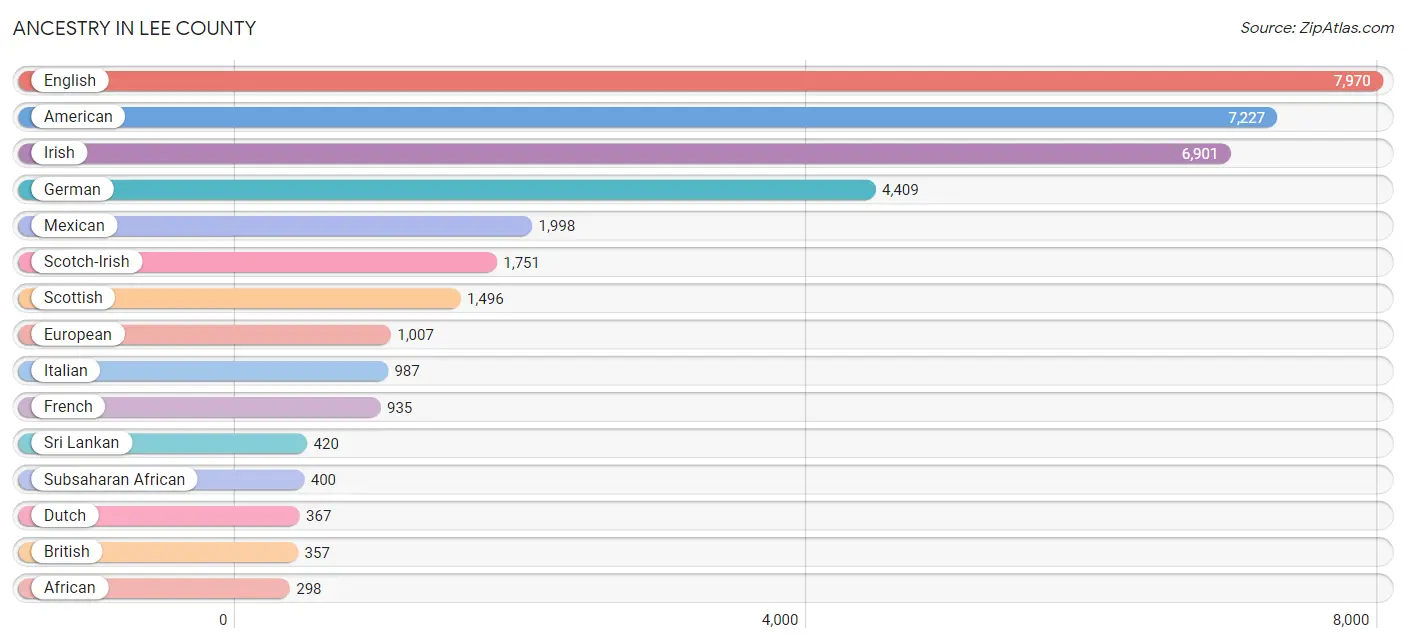
Ancestry in Lee County
The most populous ancestries reported in Lee County are English (7,970 | 9.6%), American (7,227 | 8.7%), Irish (6,901 | 8.3%), German (4,409 | 5.3%), and Mexican (1,998 | 2.4%), together accounting for 34.2% of all Lee County residents.
| Ancestry | # Population | % Population |
| African | 298 | 0.4% |
| American | 7,227 | 8.7% |
| Arab | 165 | 0.2% |
| Austrian | 6 | 0.0% |
| Bhutanese | 8 | 0.0% |
| Brazilian | 9 | 0.0% |
| British | 357 | 0.4% |
| Burmese | 6 | 0.0% |
| Canadian | 5 | 0.0% |
| Central American | 215 | 0.3% |
| Cherokee | 23 | 0.0% |
| Chickasaw | 55 | 0.1% |
| Choctaw | 62 | 0.1% |
| Creek | 8 | 0.0% |
| Cuban | 85 | 0.1% |
| Danish | 49 | 0.1% |
| Dominican | 73 | 0.1% |
| Dutch | 367 | 0.4% |
| Eastern European | 39 | 0.1% |
| English | 7,970 | 9.6% |
| European | 1,007 | 1.2% |
| French | 935 | 1.1% |
| French American Indian | 4 | 0.0% |
| French Canadian | 25 | 0.0% |
| German | 4,409 | 5.3% |
| Greek | 25 | 0.0% |
| Guatemalan | 209 | 0.3% |
| Honduran | 6 | 0.0% |
| Houma | 22 | 0.0% |
| Hungarian | 16 | 0.0% |
| Indian (Asian) | 88 | 0.1% |
| Irish | 6,901 | 8.3% |
| Italian | 987 | 1.2% |
| Jamaican | 181 | 0.2% |
| Jordanian | 31 | 0.0% |
| Korean | 28 | 0.0% |
| Laotian | 4 | 0.0% |
| Lebanese | 10 | 0.0% |
| Lithuanian | 13 | 0.0% |
| Malaysian | 25 | 0.0% |
| Mexican | 1,998 | 2.4% |
| Native Hawaiian | 2 | 0.0% |
| Nigerian | 102 | 0.1% |
| Northern European | 31 | 0.0% |
| Norwegian | 85 | 0.1% |
| Pakistani | 101 | 0.1% |
| Pennsylvania German | 24 | 0.0% |
| Polish | 151 | 0.2% |
| Portuguese | 24 | 0.0% |
| Puerto Rican | 6 | 0.0% |
| Russian | 256 | 0.3% |
| Samoan | 2 | 0.0% |
| Scandinavian | 98 | 0.1% |
| Scotch-Irish | 1,751 | 2.1% |
| Scottish | 1,496 | 1.8% |
| Spaniard | 55 | 0.1% |
| Spanish | 30 | 0.0% |
| Sri Lankan | 420 | 0.5% |
| Subsaharan African | 400 | 0.5% |
| Swedish | 89 | 0.1% |
| Swiss | 11 | 0.0% |
| Thai | 244 | 0.3% |
| Welsh | 279 | 0.3% | View All 63 Rows |
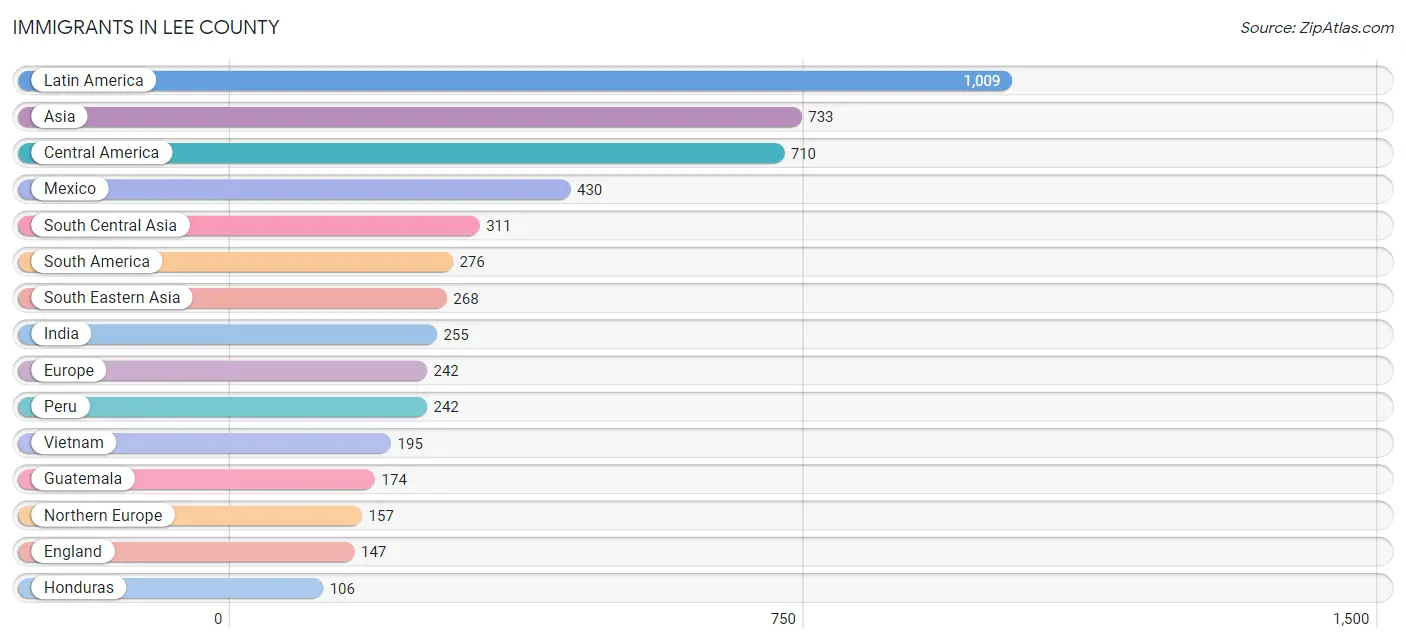
Immigrants in Lee County
The most numerous immigrant groups reported in Lee County came from Latin America (1,009 | 1.2%), Asia (733 | 0.9%), Central America (710 | 0.9%), Mexico (430 | 0.5%), and South Central Asia (311 | 0.4%), together accounting for 3.8% of all Lee County residents.
| Immigration Origin | # Population | % Population |
| Africa | 66 | 0.1% |
| Argentina | 20 | 0.0% |
| Asia | 733 | 0.9% |
| Australia | 9 | 0.0% |
| Brazil | 9 | 0.0% |
| Caribbean | 23 | 0.0% |
| Central America | 710 | 0.9% |
| China | 58 | 0.1% |
| Colombia | 5 | 0.0% |
| Congo | 19 | 0.0% |
| Dominican Republic | 23 | 0.0% |
| Eastern Africa | 24 | 0.0% |
| Eastern Asia | 72 | 0.1% |
| Eastern Europe | 67 | 0.1% |
| England | 147 | 0.2% |
| Europe | 242 | 0.3% |
| Germany | 18 | 0.0% |
| Guatemala | 174 | 0.2% |
| Honduras | 106 | 0.1% |
| India | 255 | 0.3% |
| Indonesia | 4 | 0.0% |
| Japan | 8 | 0.0% |
| Jordan | 21 | 0.0% |
| Korea | 6 | 0.0% |
| Latin America | 1,009 | 1.2% |
| Mexico | 430 | 0.5% |
| Middle Africa | 19 | 0.0% |
| Northern Europe | 157 | 0.2% |
| Oceania | 9 | 0.0% |
| Pakistan | 56 | 0.1% |
| Peru | 242 | 0.3% |
| Philippines | 7 | 0.0% |
| Russia | 67 | 0.1% |
| Senegal | 23 | 0.0% |
| South America | 276 | 0.3% |
| South Central Asia | 311 | 0.4% |
| South Eastern Asia | 268 | 0.3% |
| Thailand | 62 | 0.1% |
| Vietnam | 195 | 0.2% |
| Western Africa | 23 | 0.0% |
| Western Asia | 82 | 0.1% |
| Western Europe | 18 | 0.0% |
| Yemen | 61 | 0.1% | View All 43 Rows |
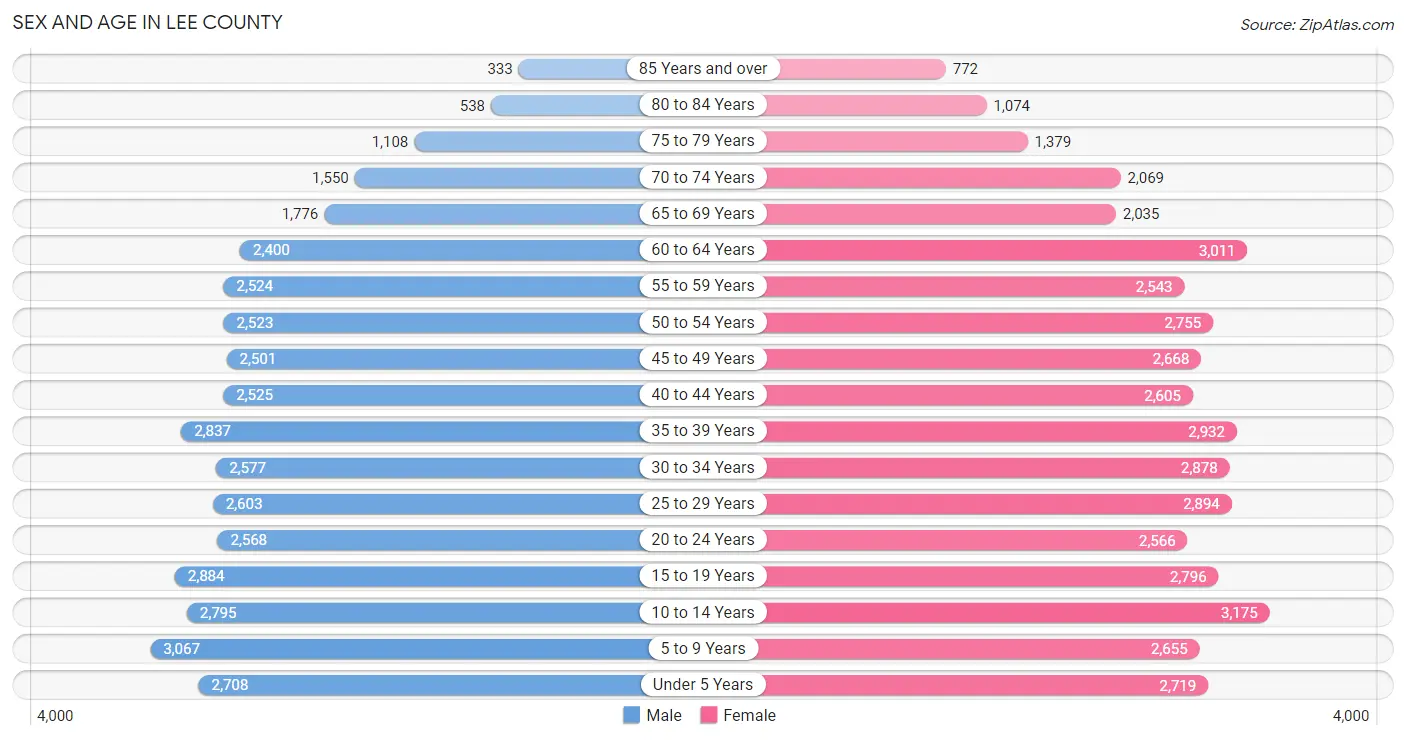
Sex and Age in Lee County
Sex and Age in Lee County
The most populous age groups in Lee County are 5 to 9 Years (3,067 | 7.7%) for men and 10 to 14 Years (3,175 | 7.3%) for women.
| Age Bracket | Male | Female |
| Under 5 Years | 2,708 (6.8%) | 2,719 (6.2%) |
| 5 to 9 Years | 3,067 (7.7%) | 2,655 (6.1%) |
| 10 to 14 Years | 2,795 (7.0%) | 3,175 (7.3%) |
| 15 to 19 Years | 2,884 (7.2%) | 2,796 (6.4%) |
| 20 to 24 Years | 2,568 (6.5%) | 2,566 (5.9%) |
| 25 to 29 Years | 2,603 (6.5%) | 2,894 (6.7%) |
| 30 to 34 Years | 2,577 (6.5%) | 2,878 (6.6%) |
| 35 to 39 Years | 2,837 (7.1%) | 2,932 (6.7%) |
| 40 to 44 Years | 2,525 (6.3%) | 2,605 (6.0%) |
| 45 to 49 Years | 2,501 (6.3%) | 2,668 (6.1%) |
| 50 to 54 Years | 2,523 (6.3%) | 2,755 (6.3%) |
| 55 to 59 Years | 2,524 (6.3%) | 2,543 (5.8%) |
| 60 to 64 Years | 2,400 (6.0%) | 3,011 (6.9%) |
| 65 to 69 Years | 1,776 (4.5%) | 2,035 (4.7%) |
| 70 to 74 Years | 1,550 (3.9%) | 2,069 (4.8%) |
| 75 to 79 Years | 1,108 (2.8%) | 1,379 (3.2%) |
| 80 to 84 Years | 538 (1.3%) | 1,074 (2.5%) |
| 85 Years and over | 333 (0.8%) | 772 (1.8%) |
| Total | 39,817 (100.0%) | 43,526 (100.0%) |
Families and Households in Lee County
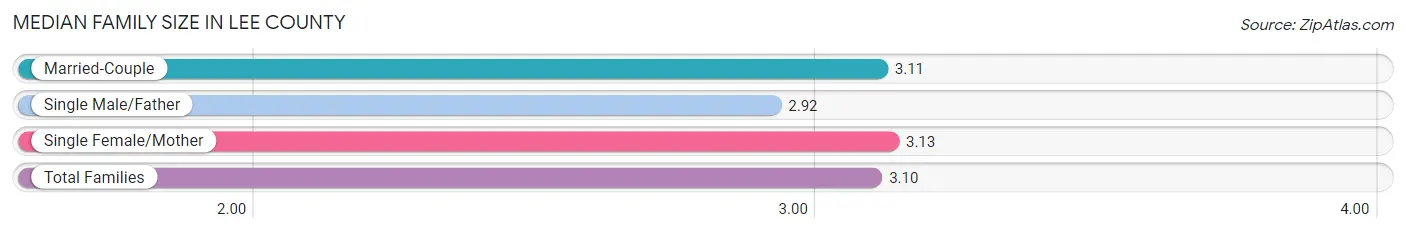
Median Family Size in Lee County
The median family size in Lee County is 3.10 persons per family, with single female/mother families (4,563 | 20.3%) accounting for the largest median family size of 3.13 persons per family. On the other hand, single male/father families (1,640 | 7.3%) represent the smallest median family size with 2.92 persons per family.
| Family Type | # Families | Family Size |
| Married-Couple | 16,274 (72.4%) | 3.11 |
| Single Male/Father | 1,640 (7.3%) | 2.92 |
| Single Female/Mother | 4,563 (20.3%) | 3.13 |
| Total Families | 22,477 (100.0%) | 3.10 |
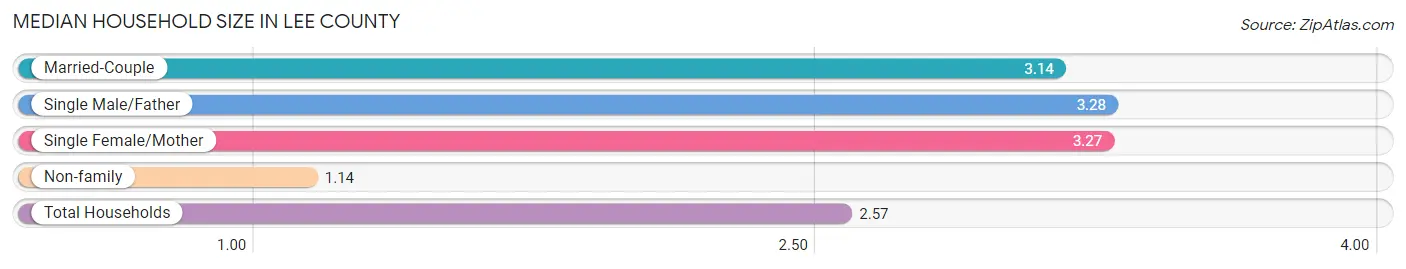
Median Household Size in Lee County
The median household size in Lee County is 2.57 persons per household, with single male/father households (1,640 | 5.1%) accounting for the largest median household size of 3.28 persons per household. non-family households (9,524 | 29.8%) represent the smallest median household size with 1.14 persons per household.
| Household Type | # Households | Household Size |
| Married-Couple | 16,274 (50.8%) | 3.14 |
| Single Male/Father | 1,640 (5.1%) | 3.28 |
| Single Female/Mother | 4,563 (14.3%) | 3.27 |
| Non-family | 9,524 (29.8%) | 1.14 |
| Total Households | 32,001 (100.0%) | 2.57 |
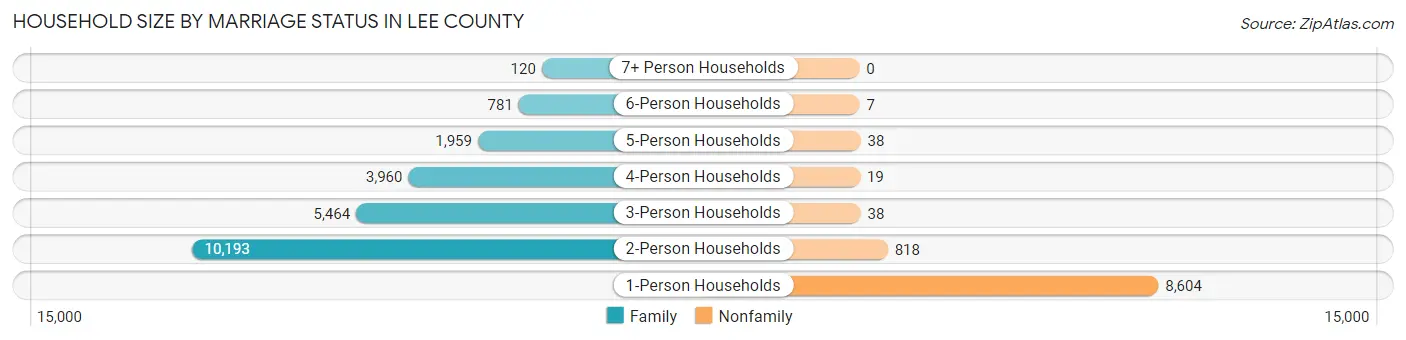
Household Size by Marriage Status in Lee County
Out of a total of 32,001 households in Lee County, 22,477 (70.2%) are family households, while 9,524 (29.8%) are nonfamily households. The most numerous type of family households are 2-person households, comprising 10,193, and the most common type of nonfamily households are 1-person households, comprising 8,604.
| Household Size | Family Households | Nonfamily Households |
| 1-Person Households | - | 8,604 (26.9%) |
| 2-Person Households | 10,193 (31.9%) | 818 (2.6%) |
| 3-Person Households | 5,464 (17.1%) | 38 (0.1%) |
| 4-Person Households | 3,960 (12.4%) | 19 (0.1%) |
| 5-Person Households | 1,959 (6.1%) | 38 (0.1%) |
| 6-Person Households | 781 (2.4%) | 7 (0.0%) |
| 7+ Person Households | 120 (0.4%) | 0 (0.0%) |
| Total | 22,477 (70.2%) | 9,524 (29.8%) |
Female Fertility in Lee County
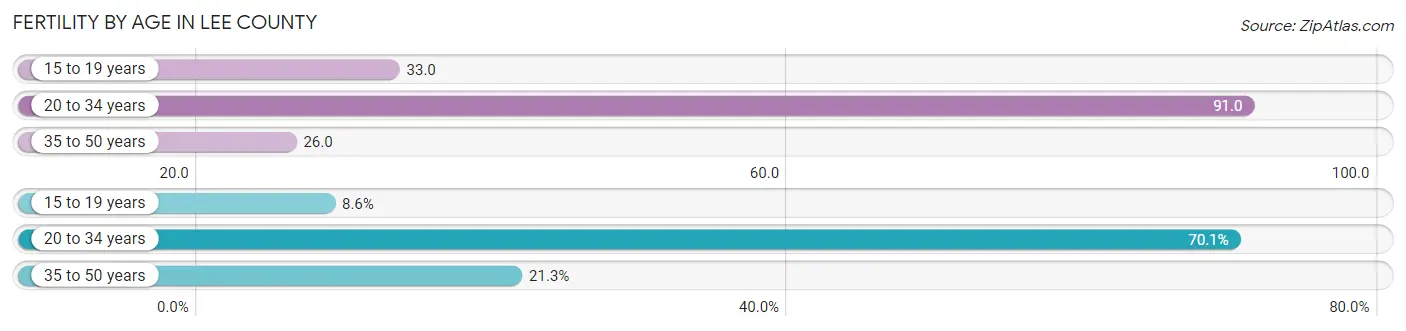
Fertility by Age in Lee County
Average fertility rate in Lee County is 54.0 births per 1,000 women. Women in the age bracket of 20 to 34 years have the highest fertility rate with 91.0 births per 1,000 women. Women in the age bracket of 20 to 34 years acount for 70.1% of all women with births.
| Age Bracket | Women with Births | Births / 1,000 Women |
| 15 to 19 years | 93 (8.6%) | 33.0 |
| 20 to 34 years | 756 (70.1%) | 91.0 |
| 35 to 50 years | 230 (21.3%) | 26.0 |
| Total | 1,079 (100.0%) | 54.0 |
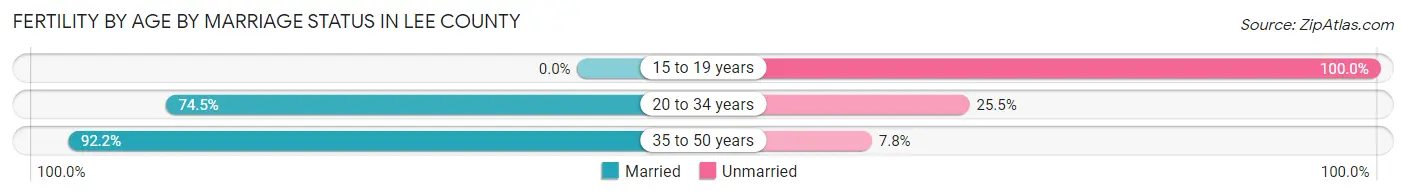
Fertility by Age by Marriage Status in Lee County
71.8% of women with births (1,079) in Lee County are married. The highest percentage of unmarried women with births falls into 15 to 19 years age bracket with 100.0% of them unmarried at the time of birth, while the lowest percentage of unmarried women with births belong to 35 to 50 years age bracket with 7.8% of them unmarried.
| Age Bracket | Married | Unmarried |
| 15 to 19 years | 0 (0.0%) | 93 (100.0%) |
| 20 to 34 years | 563 (74.5%) | 193 (25.5%) |
| 35 to 50 years | 212 (92.2%) | 18 (7.8%) |
| Total | 775 (71.8%) | 304 (28.2%) |
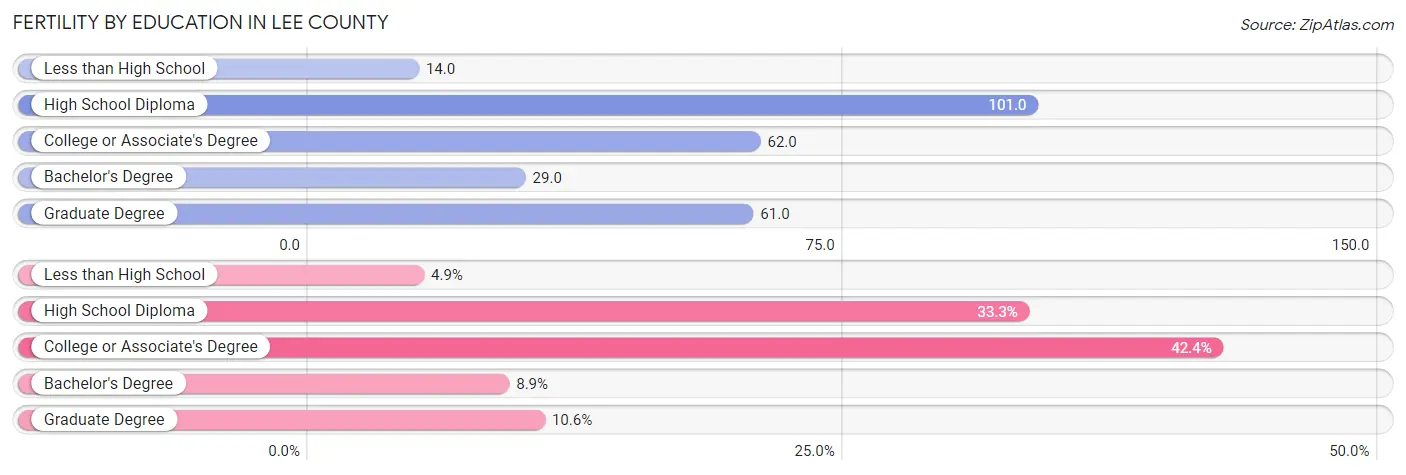
Fertility by Education in Lee County
Average fertility rate in Lee County is 54.0 births per 1,000 women. Women with the education attainment of high school diploma have the highest fertility rate of 101.0 births per 1,000 women, while women with the education attainment of less than high school have the lowest fertility at 14.0 births per 1,000 women. Women with the education attainment of college or associate's degree represent 42.3% of all women with births.
| Educational Attainment | Women with Births | Births / 1,000 Women |
| Less than High School | 53 (4.9%) | 14.0 |
| High School Diploma | 359 (33.3%) | 101.0 |
| College or Associate's Degree | 457 (42.3%) | 62.0 |
| Bachelor's Degree | 96 (8.9%) | 29.0 |
| Graduate Degree | 114 (10.6%) | 61.0 |
| Total | 1,079 (100.0%) | 54.0 |
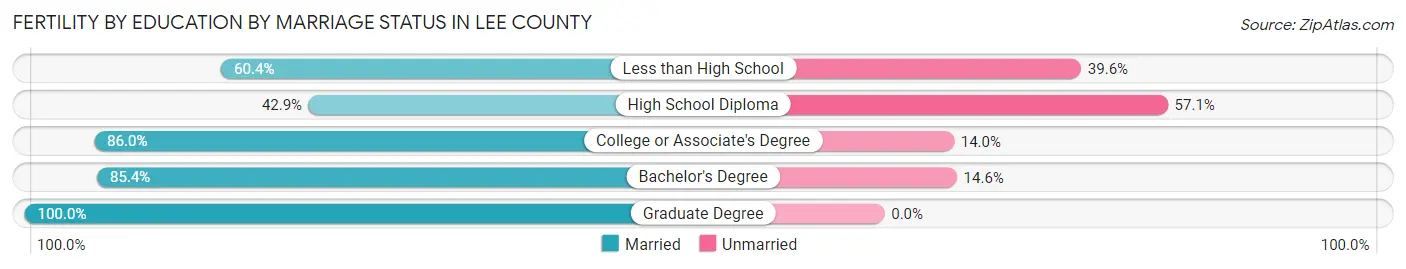
Fertility by Education by Marriage Status in Lee County
28.2% of women with births in Lee County are unmarried. Women with the educational attainment of graduate degree are most likely to be married with 100.0% of them married at childbirth, while women with the educational attainment of high school diploma are least likely to be married with 57.1% of them unmarried at childbirth.
| Educational Attainment | Married | Unmarried |
| Less than High School | 32 (60.4%) | 21 (39.6%) |
| High School Diploma | 154 (42.9%) | 205 (57.1%) |
| College or Associate's Degree | 393 (86.0%) | 64 (14.0%) |
| Bachelor's Degree | 82 (85.4%) | 14 (14.6%) |
| Graduate Degree | 114 (100.0%) | 0 (0.0%) |
| Total | 775 (71.8%) | 304 (28.2%) |
Income in Lee County
Income Overview in Lee County
Per Capita Income in Lee County is $33,209, while median incomes of families and households are $80,674 and $64,479 respectively.
| Characteristic | Number | Measure |
| Per Capita Income | 83,343 | $33,209 |
| Median Family Income | 22,477 | $80,674 |
| Mean Family Income | 22,477 | $100,025 |
| Median Household Income | 32,001 | $64,479 |
| Mean Household Income | 32,001 | $84,321 |
| Income Deficit | 22,477 | $10,227 |
| Wage / Income Gap (%) | 83,343 | 31.39% |
| Wage / Income Gap ($) | 83,343 | 68.61¢ per $1 |
| Gini / Inequality Index | 83,343 | 0.46 |
Earnings by Sex in Lee County
Average Earnings in Lee County are $36,972, $45,374 for men and $31,133 for women, a difference of 31.4%.
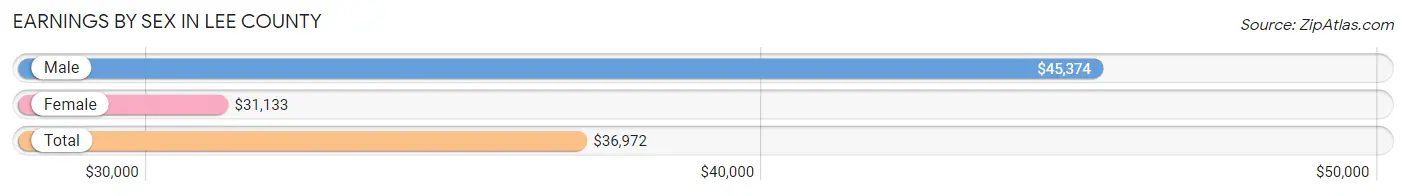
| Sex | Number | Average Earnings |
| Male | 21,829 (52.0%) | $45,374 |
| Female | 20,170 (48.0%) | $31,133 |
| Total | 41,999 (100.0%) | $36,972 |
Earnings by Sex by Income Bracket in Lee County
The most common earnings brackets in Lee County are $100,000+ for men (2,878 | 13.2%) and $30,000 to $34,999 for women (1,614 | 8.0%).
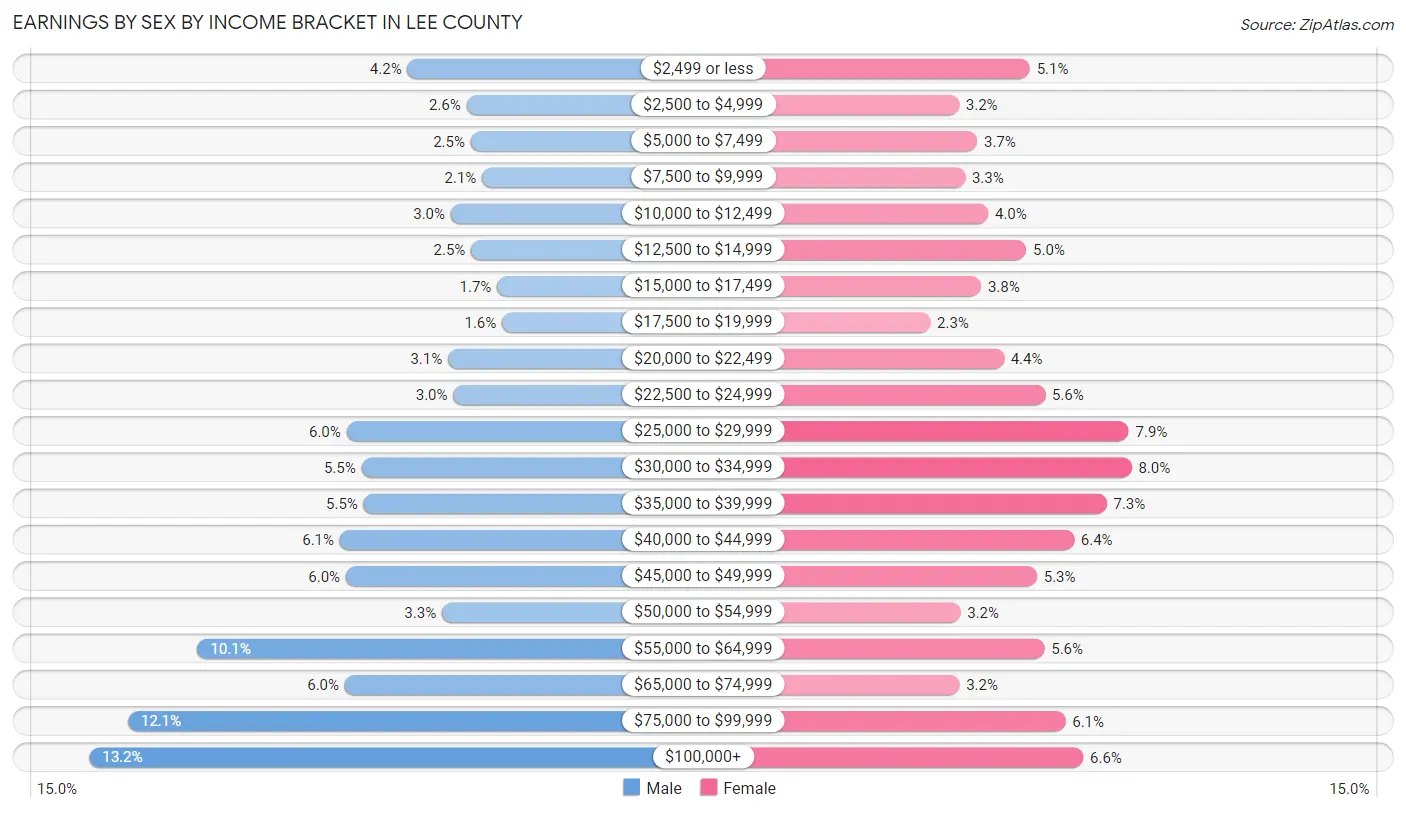
| Income | Male | Female |
| $2,499 or less | 926 (4.2%) | 1,036 (5.1%) |
| $2,500 to $4,999 | 564 (2.6%) | 636 (3.2%) |
| $5,000 to $7,499 | 538 (2.5%) | 739 (3.7%) |
| $7,500 to $9,999 | 467 (2.1%) | 669 (3.3%) |
| $10,000 to $12,499 | 660 (3.0%) | 801 (4.0%) |
| $12,500 to $14,999 | 534 (2.5%) | 1,017 (5.0%) |
| $15,000 to $17,499 | 375 (1.7%) | 760 (3.8%) |
| $17,500 to $19,999 | 345 (1.6%) | 471 (2.3%) |
| $20,000 to $22,499 | 677 (3.1%) | 890 (4.4%) |
| $22,500 to $24,999 | 644 (2.9%) | 1,124 (5.6%) |
| $25,000 to $29,999 | 1,298 (5.9%) | 1,597 (7.9%) |
| $30,000 to $34,999 | 1,208 (5.5%) | 1,614 (8.0%) |
| $35,000 to $39,999 | 1,193 (5.5%) | 1,473 (7.3%) |
| $40,000 to $44,999 | 1,340 (6.1%) | 1,287 (6.4%) |
| $45,000 to $49,999 | 1,304 (6.0%) | 1,077 (5.3%) |
| $50,000 to $54,999 | 714 (3.3%) | 643 (3.2%) |
| $55,000 to $64,999 | 2,213 (10.1%) | 1,120 (5.6%) |
| $65,000 to $74,999 | 1,310 (6.0%) | 638 (3.2%) |
| $75,000 to $99,999 | 2,641 (12.1%) | 1,238 (6.1%) |
| $100,000+ | 2,878 (13.2%) | 1,340 (6.6%) |
| Total | 21,829 (100.0%) | 20,170 (100.0%) |
Earnings by Sex by Educational Attainment in Lee County
Average earnings in Lee County are $51,129 for men and $34,799 for women, a difference of 31.9%. Men with an educational attainment of graduate degree enjoy the highest average annual earnings of $109,220, while those with less than high school education earn the least with $27,517. Women with an educational attainment of graduate degree earn the most with the average annual earnings of $56,464, while those with less than high school education have the smallest earnings of $21,114.
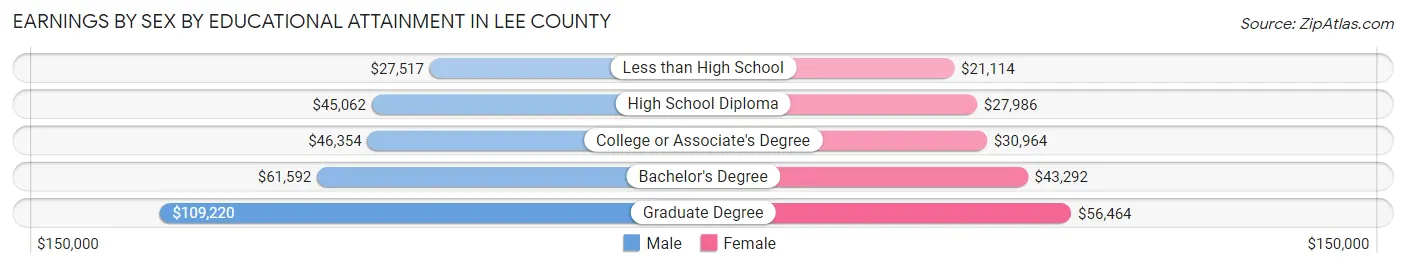
| Educational Attainment | Male Income | Female Income |
| Less than High School | $27,517 | $21,114 |
| High School Diploma | $45,062 | $27,986 |
| College or Associate's Degree | $46,354 | $30,964 |
| Bachelor's Degree | $61,592 | $43,292 |
| Graduate Degree | $109,220 | $56,464 |
| Total | $51,129 | $34,799 |
Family Income in Lee County
Family Income Brackets in Lee County
According to the Lee County family income data, there are 4,698 families falling into the $100,000 to $149,999 income range, which is the most common income bracket and makes up 20.9% of all families. Conversely, the $10,000 to $14,999 income bracket is the least frequent group with only 382 families (1.7%) belonging to this category.
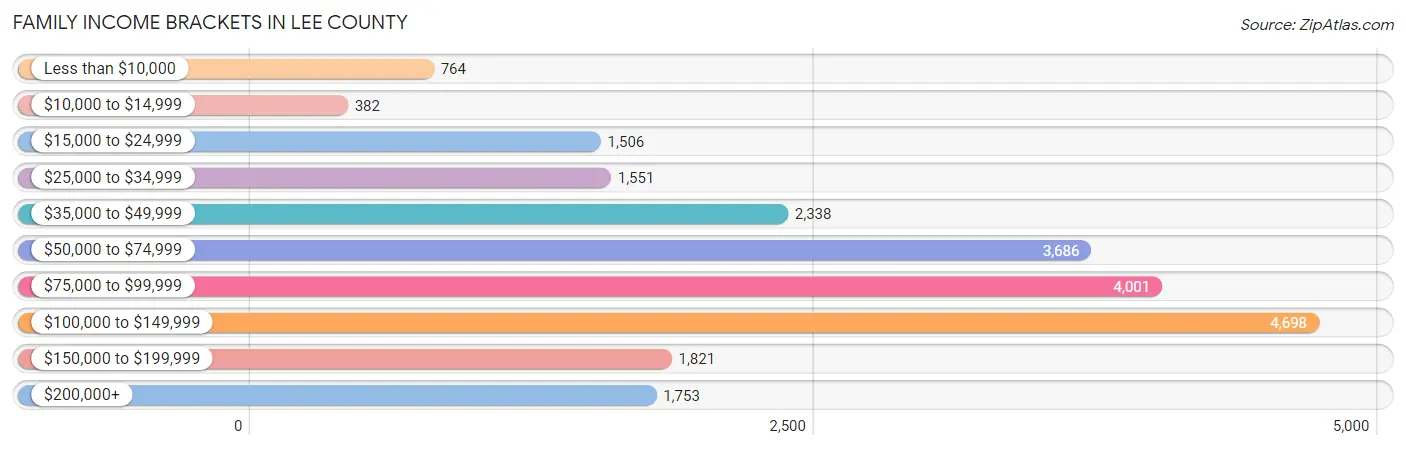
| Income Bracket | # Families | % Families |
| Less than $10,000 | 764 | 3.4% |
| $10,000 to $14,999 | 382 | 1.7% |
| $15,000 to $24,999 | 1,506 | 6.7% |
| $25,000 to $34,999 | 1,551 | 6.9% |
| $35,000 to $49,999 | 2,338 | 10.4% |
| $50,000 to $74,999 | 3,686 | 16.4% |
| $75,000 to $99,999 | 4,001 | 17.8% |
| $100,000 to $149,999 | 4,698 | 20.9% |
| $150,000 to $199,999 | 1,821 | 8.1% |
| $200,000+ | 1,753 | 7.8% |
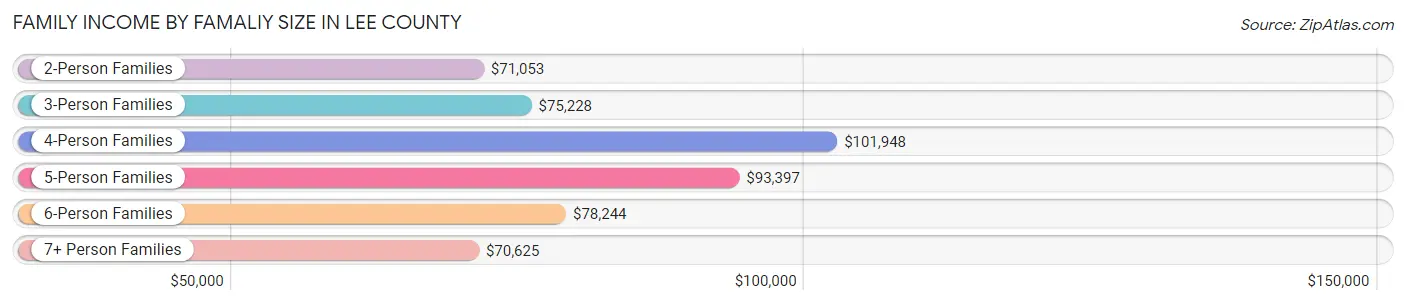
Family Income by Famaliy Size in Lee County
4-person families (3,666 | 16.3%) account for the highest median family income in Lee County with $101,948 per family, while 2-person families (10,608 | 47.2%) have the highest median income of $35,526 per family member.
| Income Bracket | # Families | Median Income |
| 2-Person Families | 10,608 (47.2%) | $71,053 |
| 3-Person Families | 5,693 (25.3%) | $75,228 |
| 4-Person Families | 3,666 (16.3%) | $101,948 |
| 5-Person Families | 1,717 (7.6%) | $93,397 |
| 6-Person Families | 690 (3.1%) | $78,244 |
| 7+ Person Families | 103 (0.5%) | $70,625 |
| Total | 22,477 (100.0%) | $80,674 |
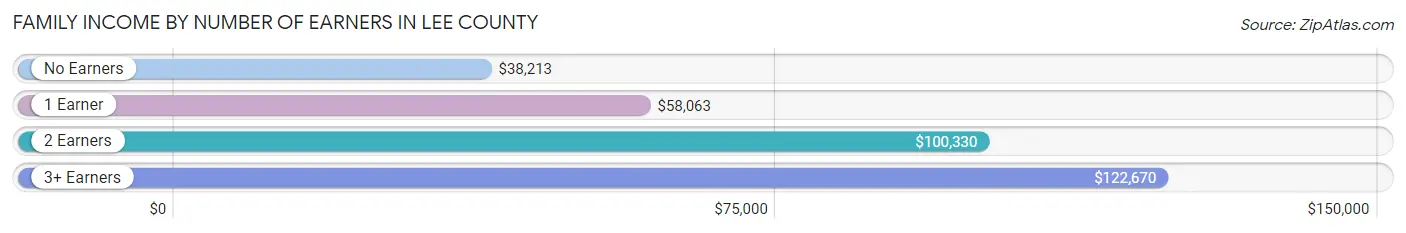
Family Income by Number of Earners in Lee County
The median family income in Lee County is $80,674, with families comprising 3+ earners (1,666) having the highest median family income of $122,670, while families with no earners (3,105) have the lowest median family income of $38,213, accounting for 7.4% and 13.8% of families, respectively.
| Number of Earners | # Families | Median Income |
| No Earners | 3,105 (13.8%) | $38,213 |
| 1 Earner | 7,687 (34.2%) | $58,063 |
| 2 Earners | 10,019 (44.6%) | $100,330 |
| 3+ Earners | 1,666 (7.4%) | $122,670 |
| Total | 22,477 (100.0%) | $80,674 |
Household Income in Lee County
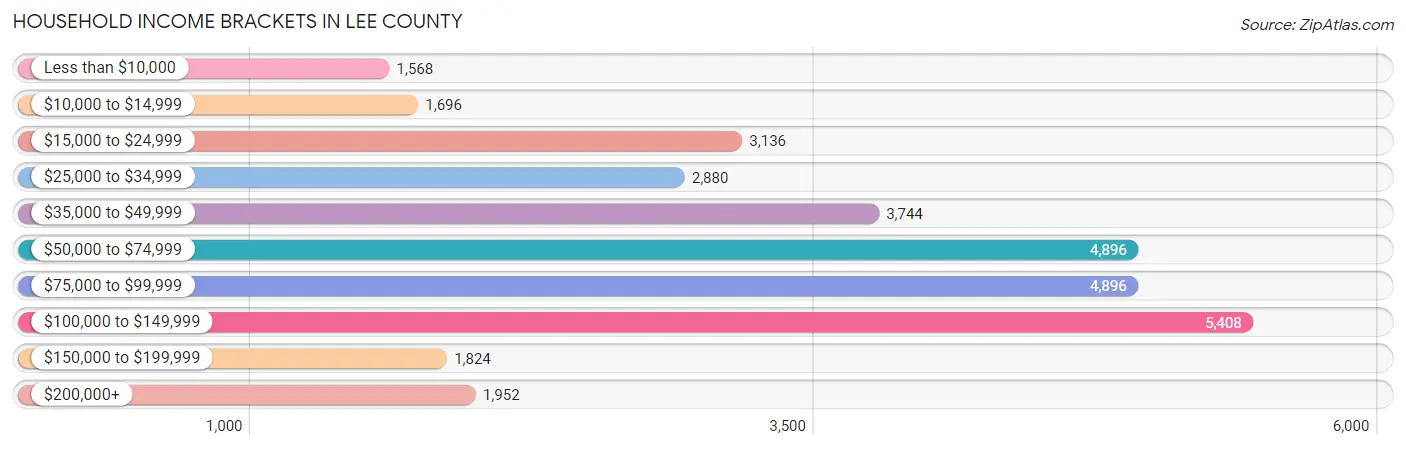
Household Income Brackets in Lee County
With 5,408 households falling in the category, the $100,000 to $149,999 income range is the most frequent in Lee County, accounting for 16.9% of all households. In contrast, only 1,568 households (4.9%) fall into the less than $10,000 income bracket, making it the least populous group.
| Income Bracket | # Households | % Households |
| Less than $10,000 | 1,568 | 4.9% |
| $10,000 to $14,999 | 1,696 | 5.3% |
| $15,000 to $24,999 | 3,136 | 9.8% |
| $25,000 to $34,999 | 2,880 | 9.0% |
| $35,000 to $49,999 | 3,744 | 11.7% |
| $50,000 to $74,999 | 4,896 | 15.3% |
| $75,000 to $99,999 | 4,896 | 15.3% |
| $100,000 to $149,999 | 5,408 | 16.9% |
| $150,000 to $199,999 | 1,824 | 5.7% |
| $200,000+ | 1,952 | 6.1% |
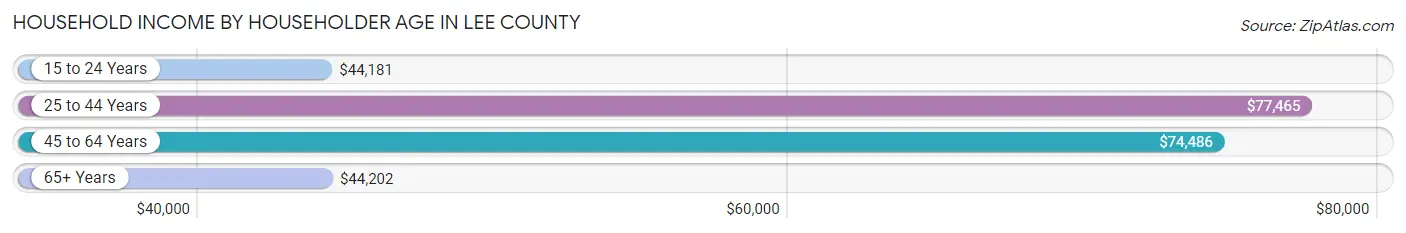
Household Income by Householder Age in Lee County
The median household income in Lee County is $64,479, with the highest median household income of $77,465 found in the 25 to 44 years age bracket for the primary householder. A total of 11,139 households (34.8%) fall into this category. Meanwhile, the 15 to 24 years age bracket for the primary householder has the lowest median household income of $44,181, with 971 households (3.0%) in this group.
| Income Bracket | # Households | Median Income |
| 15 to 24 Years | 971 (3.0%) | $44,181 |
| 25 to 44 Years | 11,139 (34.8%) | $77,465 |
| 45 to 64 Years | 12,162 (38.0%) | $74,486 |
| 65+ Years | 7,729 (24.1%) | $44,202 |
| Total | 32,001 (100.0%) | $64,479 |
Poverty in Lee County
Income Below Poverty by Sex and Age in Lee County
With 11.7% poverty level for males and 15.1% for females among the residents of Lee County, 5 year old males and 5 year old females are the most vulnerable to poverty, with 223 males (41.6%) and 268 females (47.9%) in their respective age groups living below the poverty level.
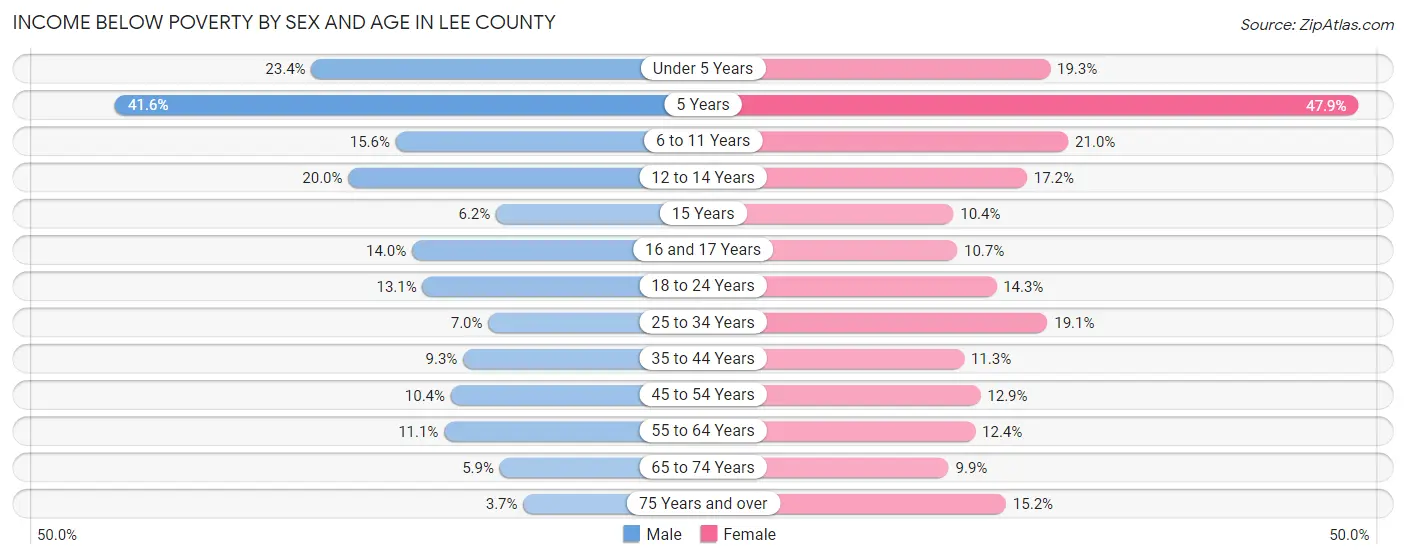
| Age Bracket | Male | Female |
| Under 5 Years | 615 (23.4%) | 509 (19.3%) |
| 5 Years | 223 (41.6%) | 268 (47.9%) |
| 6 to 11 Years | 529 (15.5%) | 773 (21.0%) |
| 12 to 14 Years | 365 (20.0%) | 272 (17.2%) |
| 15 Years | 29 (6.2%) | 50 (10.3%) |
| 16 and 17 Years | 192 (14.0%) | 141 (10.7%) |
| 18 to 24 Years | 468 (13.1%) | 509 (14.3%) |
| 25 to 34 Years | 358 (7.0%) | 1,101 (19.1%) |
| 35 to 44 Years | 490 (9.3%) | 628 (11.3%) |
| 45 to 54 Years | 517 (10.4%) | 694 (12.9%) |
| 55 to 64 Years | 531 (11.1%) | 683 (12.4%) |
| 65 to 74 Years | 192 (5.9%) | 398 (9.9%) |
| 75 Years and over | 72 (3.7%) | 432 (15.2%) |
| Total | 4,581 (11.7%) | 6,458 (15.1%) |
Income Above Poverty by Sex and Age in Lee County
According to the poverty statistics in Lee County, males aged 75 years and over and females aged 65 to 74 years are the age groups that are most secure financially, with 96.3% of males and 90.1% of females in these age groups living above the poverty line.
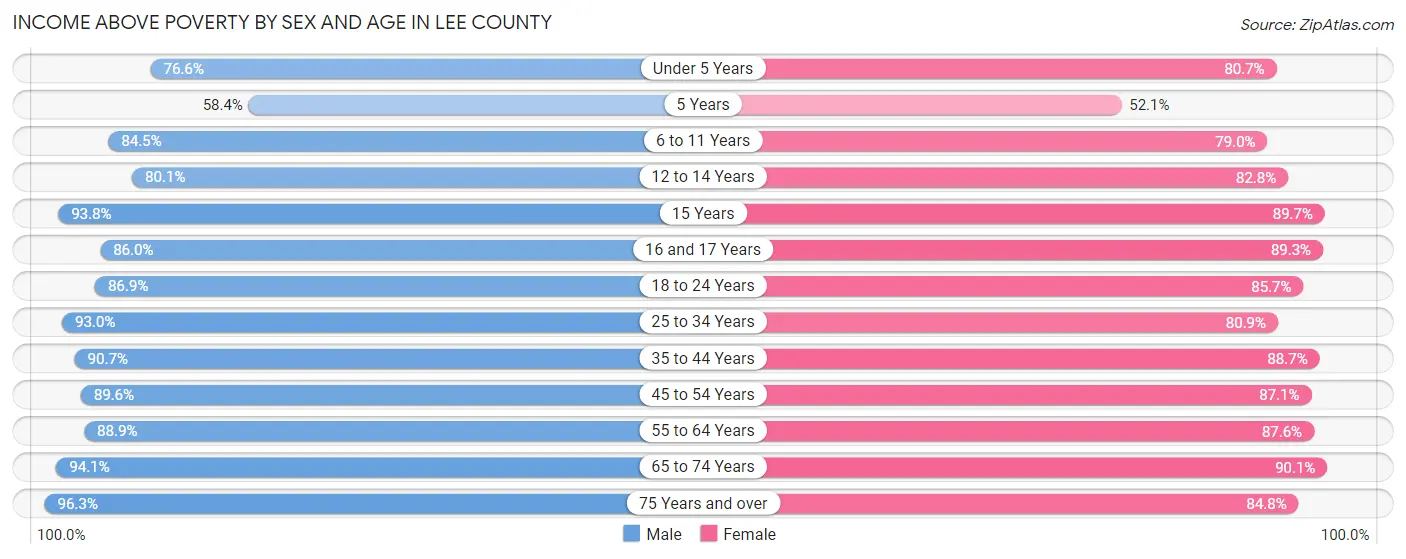
| Age Bracket | Male | Female |
| Under 5 Years | 2,016 (76.6%) | 2,124 (80.7%) |
| 5 Years | 313 (58.4%) | 291 (52.1%) |
| 6 to 11 Years | 2,872 (84.5%) | 2,907 (79.0%) |
| 12 to 14 Years | 1,465 (80.0%) | 1,312 (82.8%) |
| 15 Years | 436 (93.8%) | 433 (89.6%) |
| 16 and 17 Years | 1,176 (86.0%) | 1,177 (89.3%) |
| 18 to 24 Years | 3,114 (86.9%) | 3,042 (85.7%) |
| 25 to 34 Years | 4,782 (93.0%) | 4,671 (80.9%) |
| 35 to 44 Years | 4,780 (90.7%) | 4,909 (88.7%) |
| 45 to 54 Years | 4,433 (89.6%) | 4,702 (87.1%) |
| 55 to 64 Years | 4,268 (88.9%) | 4,839 (87.6%) |
| 65 to 74 Years | 3,062 (94.1%) | 3,619 (90.1%) |
| 75 Years and over | 1,869 (96.3%) | 2,405 (84.8%) |
| Total | 34,586 (88.3%) | 36,431 (84.9%) |
Income Below Poverty Among Married-Couple Families in Lee County
The poverty statistics for married-couple families in Lee County show that 3.3% or 543 of the total 16,274 families live below the poverty line. Families with 5 or more children have the highest poverty rate of 37.8%, comprising of 17 families. On the other hand, families with no children have the lowest poverty rate of 2.7%, which includes 257 families.
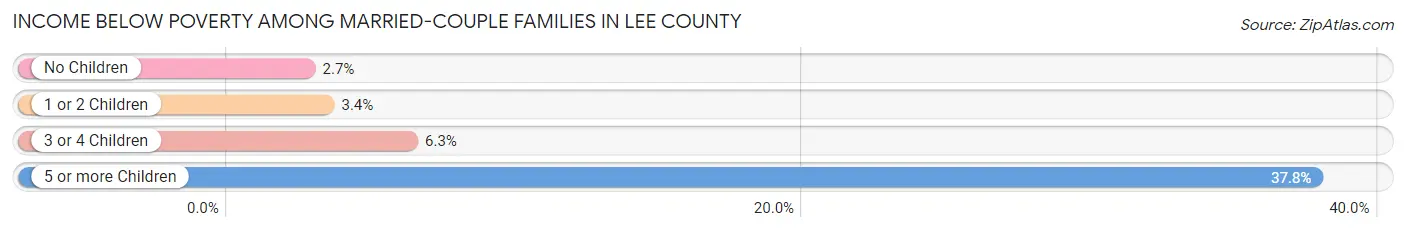
| Children | Above Poverty | Below Poverty |
| No Children | 9,244 (97.3%) | 257 (2.7%) |
| 1 or 2 Children | 5,068 (96.6%) | 176 (3.4%) |
| 3 or 4 Children | 1,391 (93.7%) | 93 (6.3%) |
| 5 or more Children | 28 (62.2%) | 17 (37.8%) |
| Total | 15,731 (96.7%) | 543 (3.3%) |
Income Below Poverty Among Single-Parent Households in Lee County
According to the poverty data in Lee County, 17.9% or 293 single-father households and 30.3% or 1,382 single-mother households are living below the poverty line. Among single-father households, those with 1 or 2 children have the highest poverty rate, with 244 households (34.7%) experiencing poverty. Likewise, among single-mother households, those with 3 or 4 children have the highest poverty rate, with 308 households (78.4%) falling below the poverty line.
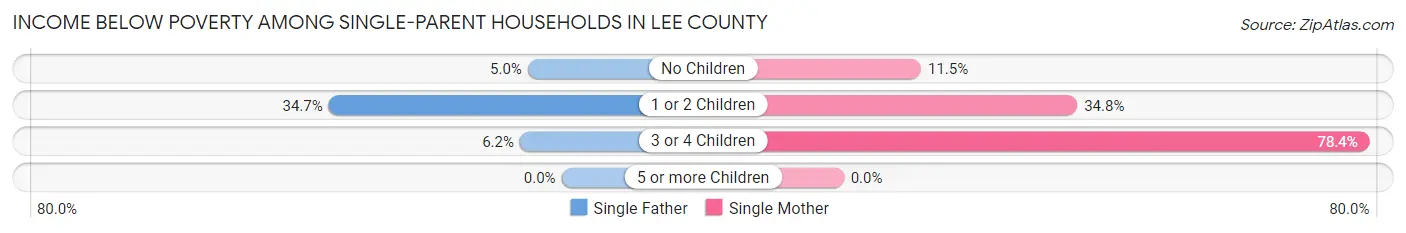
| Children | Single Father | Single Mother |
| No Children | 39 (5.0%) | 183 (11.5%) |
| 1 or 2 Children | 244 (34.7%) | 891 (34.8%) |
| 3 or 4 Children | 10 (6.2%) | 308 (78.4%) |
| 5 or more Children | 0 (0.0%) | 0 (0.0%) |
| Total | 293 (17.9%) | 1,382 (30.3%) |
Income Below Poverty Among Married-Couple vs Single-Parent Households in Lee County
The poverty data for Lee County shows that 543 of the married-couple family households (3.3%) and 1,675 of the single-parent households (27.0%) are living below the poverty level. Within the married-couple family households, those with 5 or more children have the highest poverty rate, with 17 households (37.8%) falling below the poverty line. Among the single-parent households, those with 3 or 4 children have the highest poverty rate, with 318 household (57.4%) living below poverty.
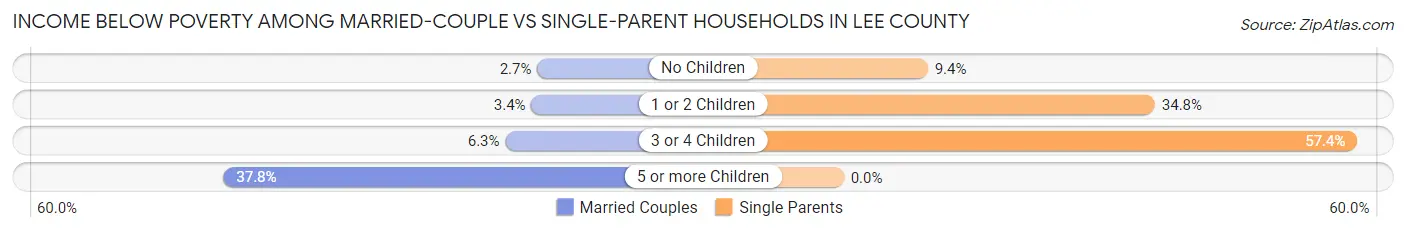
| Children | Married-Couple Families | Single-Parent Households |
| No Children | 257 (2.7%) | 222 (9.4%) |
| 1 or 2 Children | 176 (3.4%) | 1,135 (34.8%) |
| 3 or 4 Children | 93 (6.3%) | 318 (57.4%) |
| 5 or more Children | 17 (37.8%) | 0 (0.0%) |
| Total | 543 (3.3%) | 1,675 (27.0%) |
Employment Characteristics in Lee County
Employment by Class of Employer in Lee County
Among the 38,045 employed individuals in Lee County, private company employees (26,693 | 70.2%), not-for-profit organizations (2,968 | 7.8%), and self-employed (not incorporated) (2,434 | 6.4%) make up the most common classes of employment.
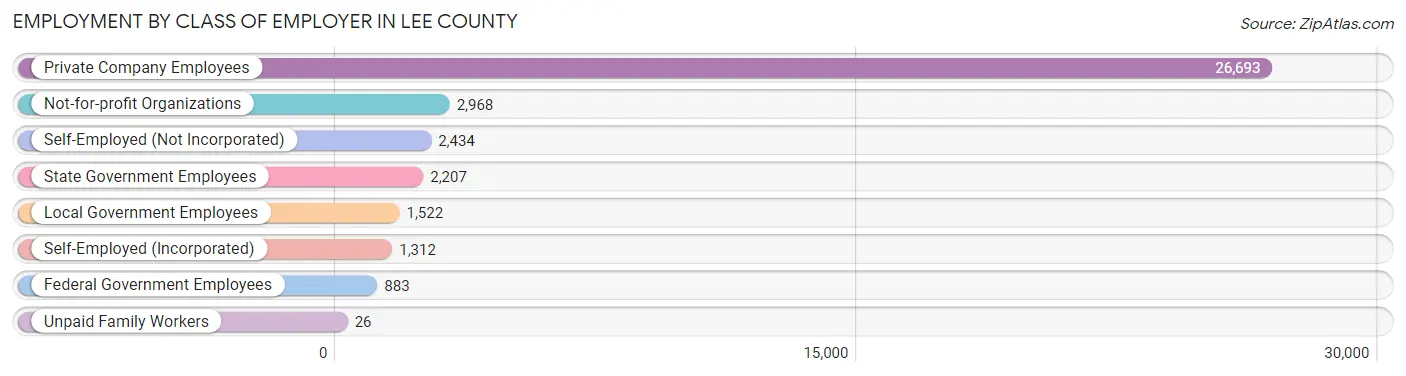
| Employer Class | # Employees | % Employees |
| Private Company Employees | 26,693 | 70.2% |
| Self-Employed (Incorporated) | 1,312 | 3.5% |
| Self-Employed (Not Incorporated) | 2,434 | 6.4% |
| Not-for-profit Organizations | 2,968 | 7.8% |
| Local Government Employees | 1,522 | 4.0% |
| State Government Employees | 2,207 | 5.8% |
| Federal Government Employees | 883 | 2.3% |
| Unpaid Family Workers | 26 | 0.1% |
| Total | 38,045 | 100.0% |
Employment Status by Age in Lee County
According to the labor force statistics for Lee County, out of the total population over 16 years of age (65,268), 62.9% or 41,054 individuals are in the labor force, with 5.6% or 2,299 of them unemployed. The age group with the highest labor force participation rate is 25 to 29 years, with 87.6% or 4,815 individuals in the labor force. Within the labor force, the 16 to 19 years age range has the highest percentage of unemployed individuals, with 18.9% or 350 of them being unemployed.
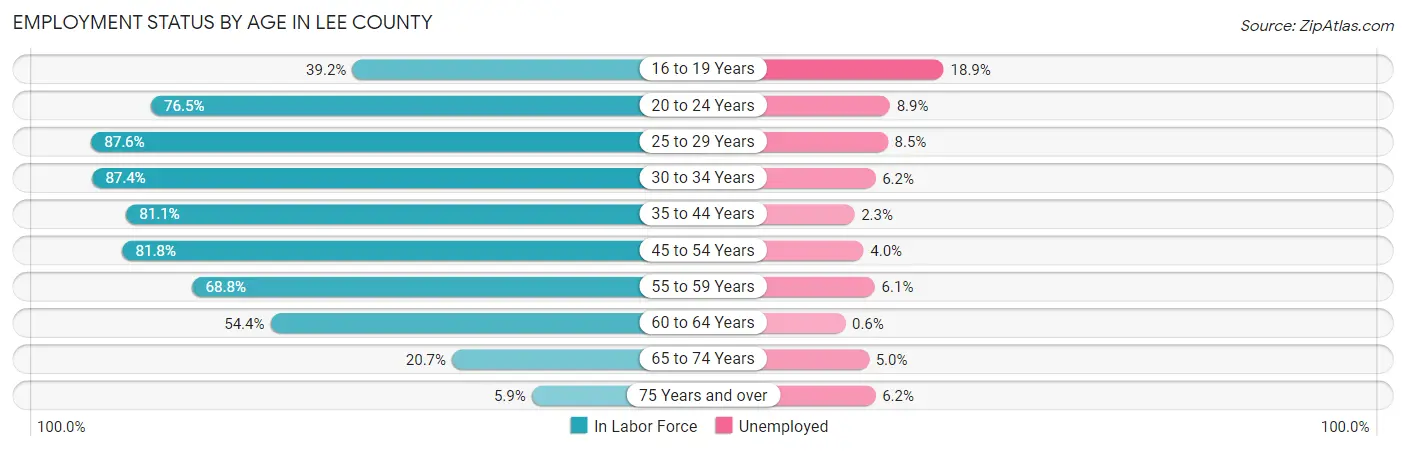
| Age Bracket | In Labor Force | Unemployed |
| 16 to 19 Years | 1,852 (39.2%) | 350 (18.9%) |
| 20 to 24 Years | 3,928 (76.5%) | 350 (8.9%) |
| 25 to 29 Years | 4,815 (87.6%) | 409 (8.5%) |
| 30 to 34 Years | 4,768 (87.4%) | 296 (6.2%) |
| 35 to 44 Years | 8,839 (81.1%) | 203 (2.3%) |
| 45 to 54 Years | 8,546 (81.8%) | 342 (4.0%) |
| 55 to 59 Years | 3,486 (68.8%) | 213 (6.1%) |
| 60 to 64 Years | 2,944 (54.4%) | 18 (0.6%) |
| 65 to 74 Years | 1,538 (20.7%) | 77 (5.0%) |
| 75 Years and over | 307 (5.9%) | 19 (6.2%) |
| Total | 41,054 (62.9%) | 2,299 (5.6%) |
Employment Status by Educational Attainment in Lee County
According to labor force statistics for Lee County, 78.1% of individuals (33,408) out of the total population between 25 and 64 years of age (42,776) are in the labor force, with 4.5% or 1,503 of them being unemployed. The group with the highest labor force participation rate are those with the educational attainment of bachelor's degree or higher, with 88.7% or 11,137 individuals in the labor force. Within the labor force, individuals with less than high school education have the highest percentage of unemployment, with 11.8% or 334 of them being unemployed.
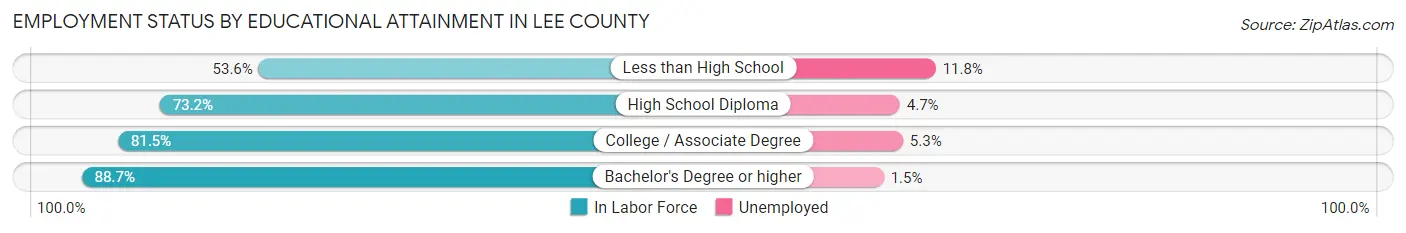
| Educational Attainment | In Labor Force | Unemployed |
| Less than High School | 2,827 (53.6%) | 622 (11.8%) |
| High School Diploma | 7,861 (73.2%) | 505 (4.7%) |
| College / Associate Degree | 11,579 (81.5%) | 753 (5.3%) |
| Bachelor's Degree or higher | 11,137 (88.7%) | 188 (1.5%) |
| Total | 33,408 (78.1%) | 1,925 (4.5%) |
Employment Occupations by Sex in Lee County
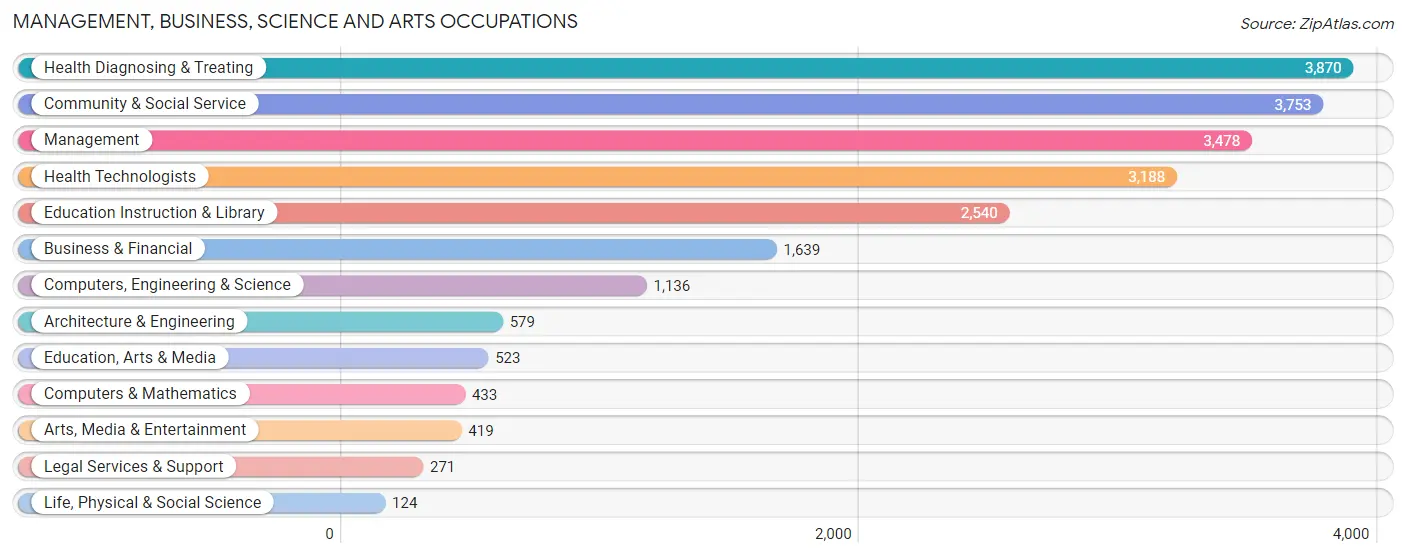
Management, Business, Science and Arts Occupations
The most common Management, Business, Science and Arts occupations in Lee County are Health Diagnosing & Treating (3,870 | 10.1%), Community & Social Service (3,753 | 9.7%), Management (3,478 | 9.0%), Health Technologists (3,188 | 8.3%), and Education Instruction & Library (2,540 | 6.6%).
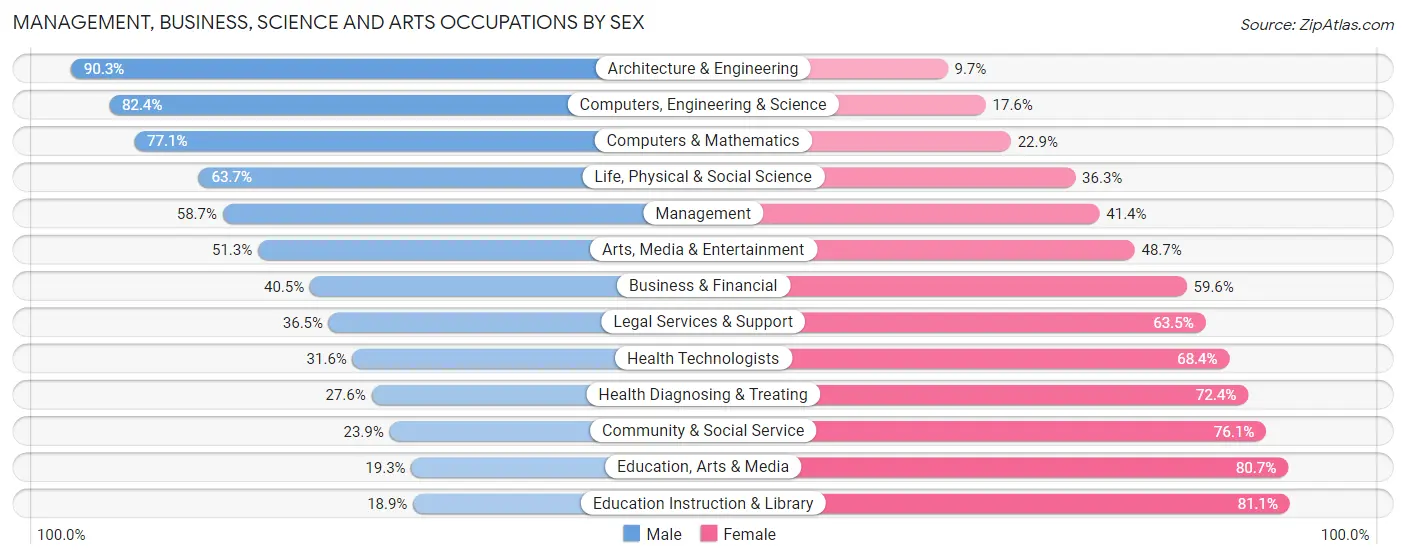
Management, Business, Science and Arts Occupations by Sex
Within the Management, Business, Science and Arts occupations in Lee County, the most male-oriented occupations are Architecture & Engineering (90.3%), Computers, Engineering & Science (82.4%), and Computers & Mathematics (77.1%), while the most female-oriented occupations are Education Instruction & Library (81.1%), Education, Arts & Media (80.7%), and Community & Social Service (76.1%).
| Occupation | Male | Female |
| Management | 2,040 (58.7%) | 1,438 (41.3%) |
| Business & Financial | 663 (40.5%) | 976 (59.6%) |
| Computers, Engineering & Science | 936 (82.4%) | 200 (17.6%) |
| Computers & Mathematics | 334 (77.1%) | 99 (22.9%) |
| Architecture & Engineering | 523 (90.3%) | 56 (9.7%) |
| Life, Physical & Social Science | 79 (63.7%) | 45 (36.3%) |
| Community & Social Service | 896 (23.9%) | 2,857 (76.1%) |
| Education, Arts & Media | 101 (19.3%) | 422 (80.7%) |
| Legal Services & Support | 99 (36.5%) | 172 (63.5%) |
| Education Instruction & Library | 481 (18.9%) | 2,059 (81.1%) |
| Arts, Media & Entertainment | 215 (51.3%) | 204 (48.7%) |
| Health Diagnosing & Treating | 1,069 (27.6%) | 2,801 (72.4%) |
| Health Technologists | 1,006 (31.6%) | 2,182 (68.4%) |
| Total (Category) | 5,604 (40.4%) | 8,272 (59.6%) |
| Total (Overall) | 19,769 (51.3%) | 18,745 (48.7%) |
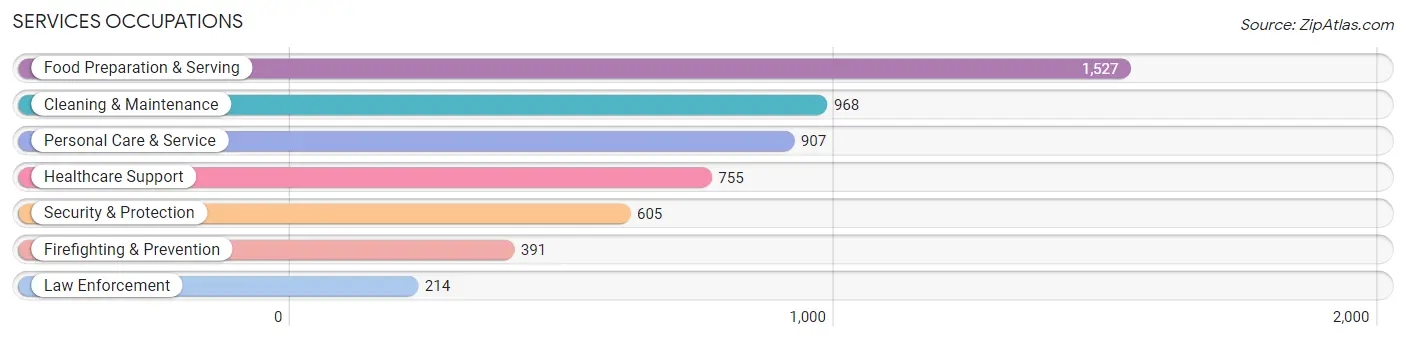
Services Occupations
The most common Services occupations in Lee County are Food Preparation & Serving (1,527 | 4.0%), Cleaning & Maintenance (968 | 2.5%), Personal Care & Service (907 | 2.4%), Healthcare Support (755 | 2.0%), and Security & Protection (605 | 1.6%).
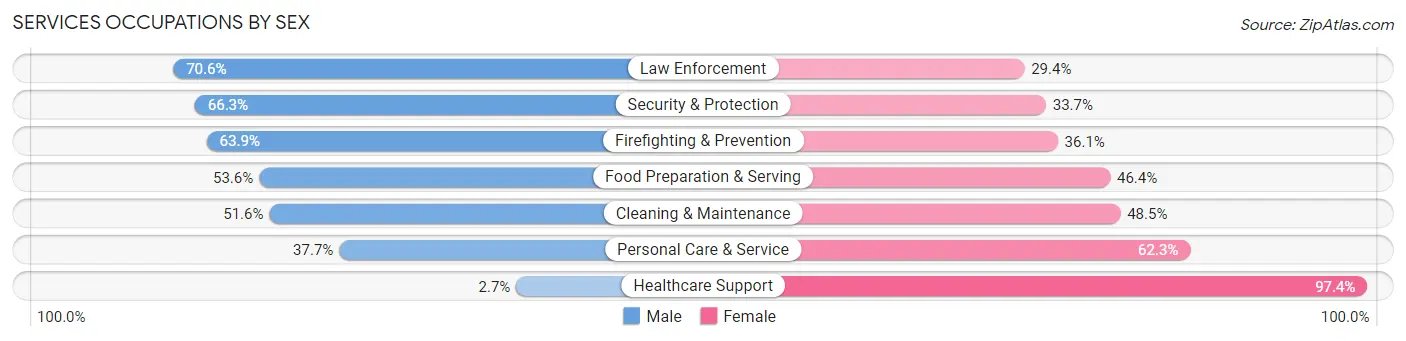
Services Occupations by Sex
Within the Services occupations in Lee County, the most male-oriented occupations are Law Enforcement (70.6%), Security & Protection (66.3%), and Firefighting & Prevention (63.9%), while the most female-oriented occupations are Healthcare Support (97.4%), Personal Care & Service (62.3%), and Cleaning & Maintenance (48.4%).
| Occupation | Male | Female |
| Healthcare Support | 20 (2.6%) | 735 (97.4%) |
| Security & Protection | 401 (66.3%) | 204 (33.7%) |
| Firefighting & Prevention | 250 (63.9%) | 141 (36.1%) |
| Law Enforcement | 151 (70.6%) | 63 (29.4%) |
| Food Preparation & Serving | 818 (53.6%) | 709 (46.4%) |
| Cleaning & Maintenance | 499 (51.5%) | 469 (48.4%) |
| Personal Care & Service | 342 (37.7%) | 565 (62.3%) |
| Total (Category) | 2,080 (43.7%) | 2,682 (56.3%) |
| Total (Overall) | 19,769 (51.3%) | 18,745 (48.7%) |
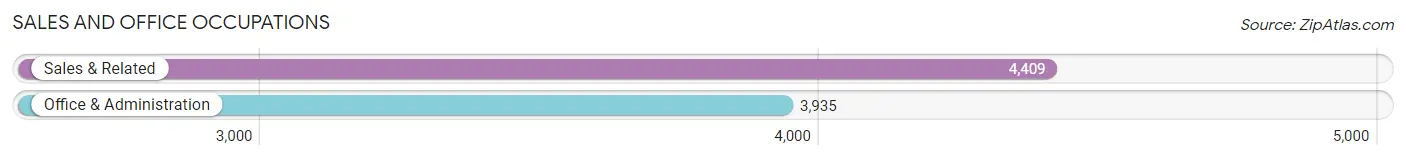
Sales and Office Occupations
The most common Sales and Office occupations in Lee County are Sales & Related (4,409 | 11.5%), and Office & Administration (3,935 | 10.2%).
Sales and Office Occupations by Sex
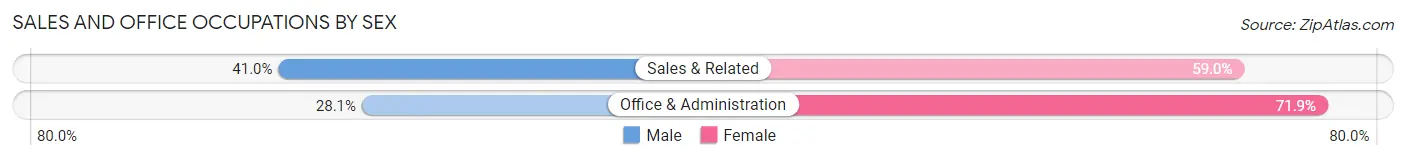
| Occupation | Male | Female |
| Sales & Related | 1,806 (41.0%) | 2,603 (59.0%) |
| Office & Administration | 1,106 (28.1%) | 2,829 (71.9%) |
| Total (Category) | 2,912 (34.9%) | 5,432 (65.1%) |
| Total (Overall) | 19,769 (51.3%) | 18,745 (48.7%) |
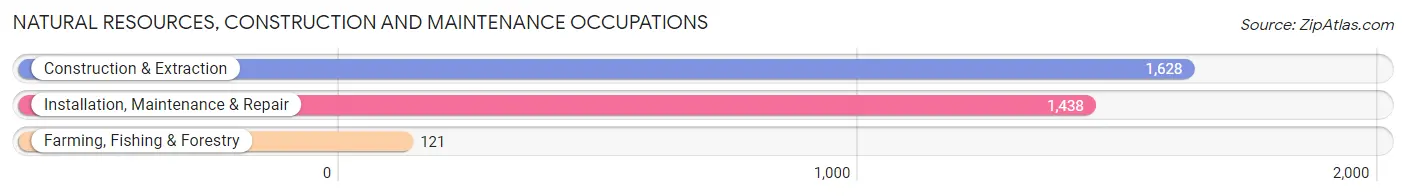
Natural Resources, Construction and Maintenance Occupations
The most common Natural Resources, Construction and Maintenance occupations in Lee County are Construction & Extraction (1,628 | 4.2%), Installation, Maintenance & Repair (1,438 | 3.7%), and Farming, Fishing & Forestry (121 | 0.3%).
Natural Resources, Construction and Maintenance Occupations by Sex
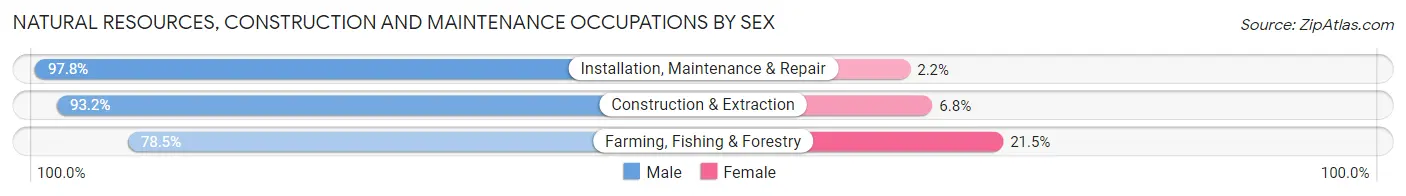
| Occupation | Male | Female |
| Farming, Fishing & Forestry | 95 (78.5%) | 26 (21.5%) |
| Construction & Extraction | 1,518 (93.2%) | 110 (6.8%) |
| Installation, Maintenance & Repair | 1,407 (97.8%) | 31 (2.2%) |
| Total (Category) | 3,020 (94.8%) | 167 (5.2%) |
| Total (Overall) | 19,769 (51.3%) | 18,745 (48.7%) |
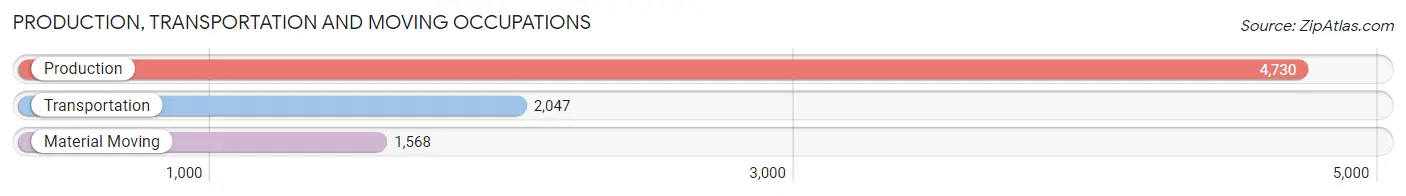
Production, Transportation and Moving Occupations
The most common Production, Transportation and Moving occupations in Lee County are Production (4,730 | 12.3%), Transportation (2,047 | 5.3%), and Material Moving (1,568 | 4.1%).
Production, Transportation and Moving Occupations by Sex
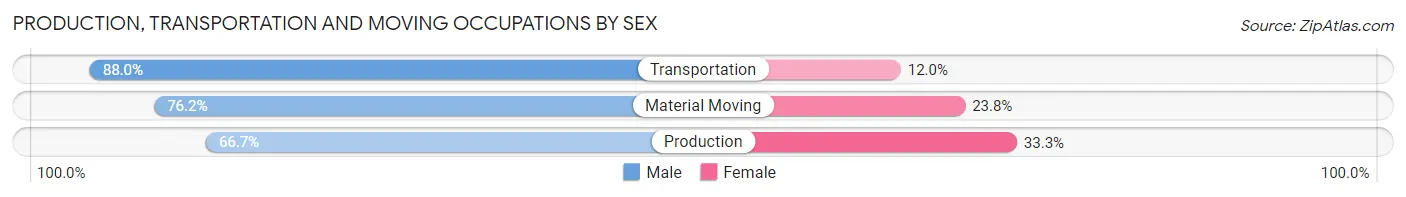
| Occupation | Male | Female |
| Production | 3,156 (66.7%) | 1,574 (33.3%) |
| Transportation | 1,802 (88.0%) | 245 (12.0%) |
| Material Moving | 1,195 (76.2%) | 373 (23.8%) |
| Total (Category) | 6,153 (73.7%) | 2,192 (26.3%) |
| Total (Overall) | 19,769 (51.3%) | 18,745 (48.7%) |
Employment Industries by Sex in Lee County
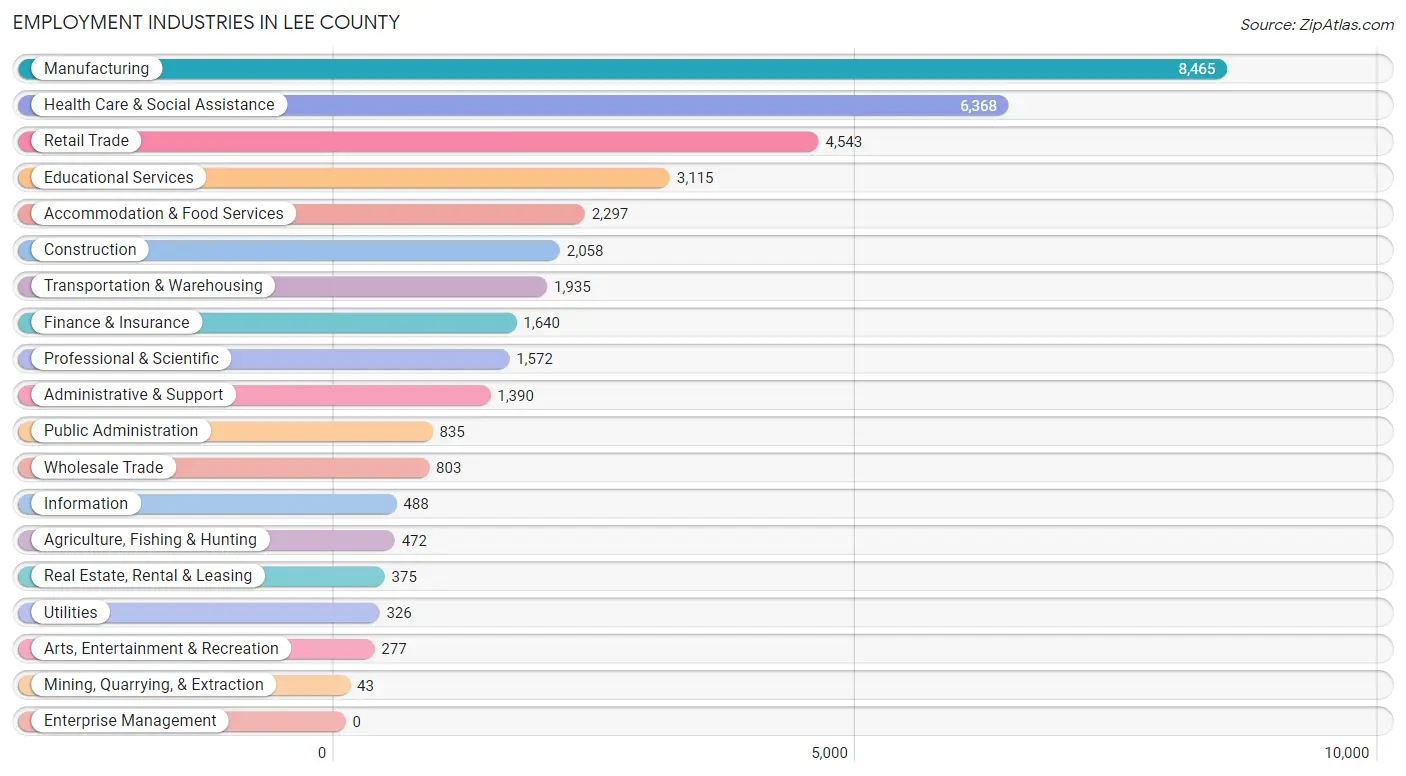
Employment Industries in Lee County
The major employment industries in Lee County include Manufacturing (8,465 | 22.0%), Health Care & Social Assistance (6,368 | 16.5%), Retail Trade (4,543 | 11.8%), Educational Services (3,115 | 8.1%), and Accommodation & Food Services (2,297 | 6.0%).
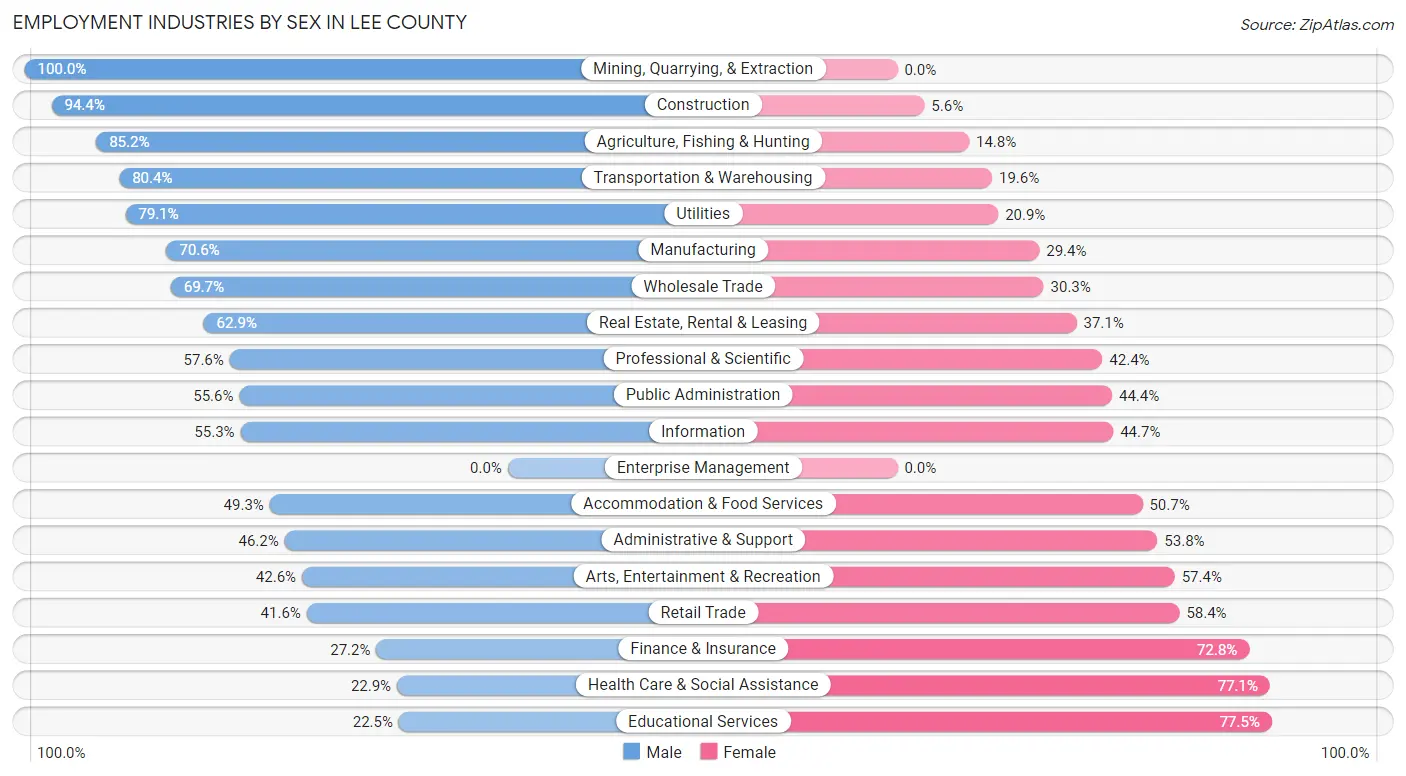
Employment Industries by Sex in Lee County
The Lee County industries that see more men than women are Mining, Quarrying, & Extraction (100.0%), Construction (94.4%), and Agriculture, Fishing & Hunting (85.2%), whereas the industries that tend to have a higher number of women are Educational Services (77.5%), Health Care & Social Assistance (77.1%), and Finance & Insurance (72.8%).
| Industry | Male | Female |
| Agriculture, Fishing & Hunting | 402 (85.2%) | 70 (14.8%) |
| Mining, Quarrying, & Extraction | 43 (100.0%) | 0 (0.0%) |
| Construction | 1,943 (94.4%) | 115 (5.6%) |
| Manufacturing | 5,980 (70.6%) | 2,485 (29.4%) |
| Wholesale Trade | 560 (69.7%) | 243 (30.3%) |
| Retail Trade | 1,891 (41.6%) | 2,652 (58.4%) |
| Transportation & Warehousing | 1,556 (80.4%) | 379 (19.6%) |
| Utilities | 258 (79.1%) | 68 (20.9%) |
| Information | 270 (55.3%) | 218 (44.7%) |
| Finance & Insurance | 446 (27.2%) | 1,194 (72.8%) |
| Real Estate, Rental & Leasing | 236 (62.9%) | 139 (37.1%) |
| Professional & Scientific | 905 (57.6%) | 667 (42.4%) |
| Enterprise Management | 0 (0.0%) | 0 (0.0%) |
| Administrative & Support | 642 (46.2%) | 748 (53.8%) |
| Educational Services | 702 (22.5%) | 2,413 (77.5%) |
| Health Care & Social Assistance | 1,460 (22.9%) | 4,908 (77.1%) |
| Arts, Entertainment & Recreation | 118 (42.6%) | 159 (57.4%) |
| Accommodation & Food Services | 1,132 (49.3%) | 1,165 (50.7%) |
| Public Administration | 464 (55.6%) | 371 (44.4%) |
| Total | 19,769 (51.3%) | 18,745 (48.7%) |
Education in Lee County
School Enrollment in Lee County
The most common levels of schooling among the 20,359 students in Lee County are elementary school (5,169 | 25.4%), high school (4,729 | 23.2%), and middle school (4,457 | 21.9%).
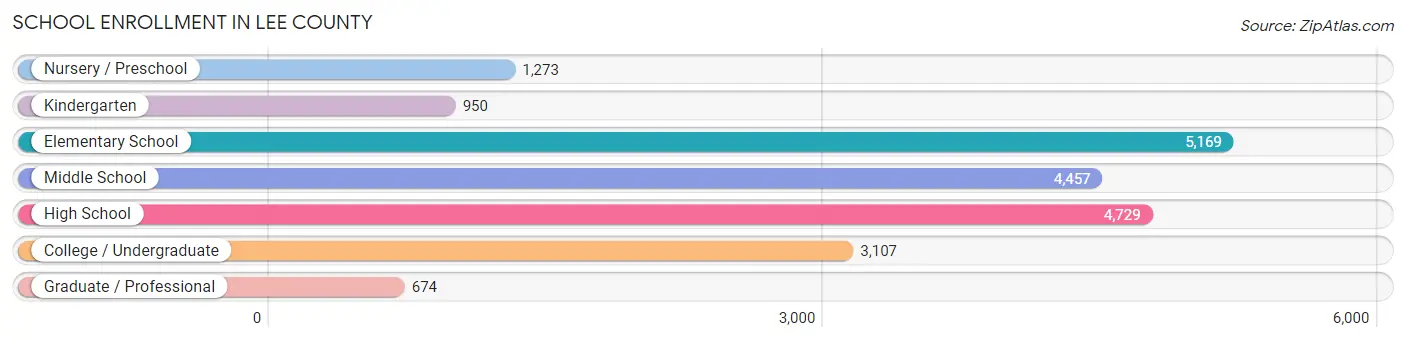
| School Level | # Students | % Students |
| Nursery / Preschool | 1,273 | 6.2% |
| Kindergarten | 950 | 4.7% |
| Elementary School | 5,169 | 25.4% |
| Middle School | 4,457 | 21.9% |
| High School | 4,729 | 23.2% |
| College / Undergraduate | 3,107 | 15.3% |
| Graduate / Professional | 674 | 3.3% |
| Total | 20,359 | 100.0% |
School Enrollment by Age by Funding Source in Lee County
Out of a total of 20,359 students who are enrolled in schools in Lee County, 2,301 (11.3%) attend a private institution, while the remaining 18,058 (88.7%) are enrolled in public schools. The age group of 25 to 34 year olds has the highest likelihood of being enrolled in private schools, with 251 (36.7% in the age bracket) enrolled. Conversely, the age group of 18 to 19 year olds has the lowest likelihood of being enrolled in a private school, with 1,391 (97.7% in the age bracket) attending a public institution.
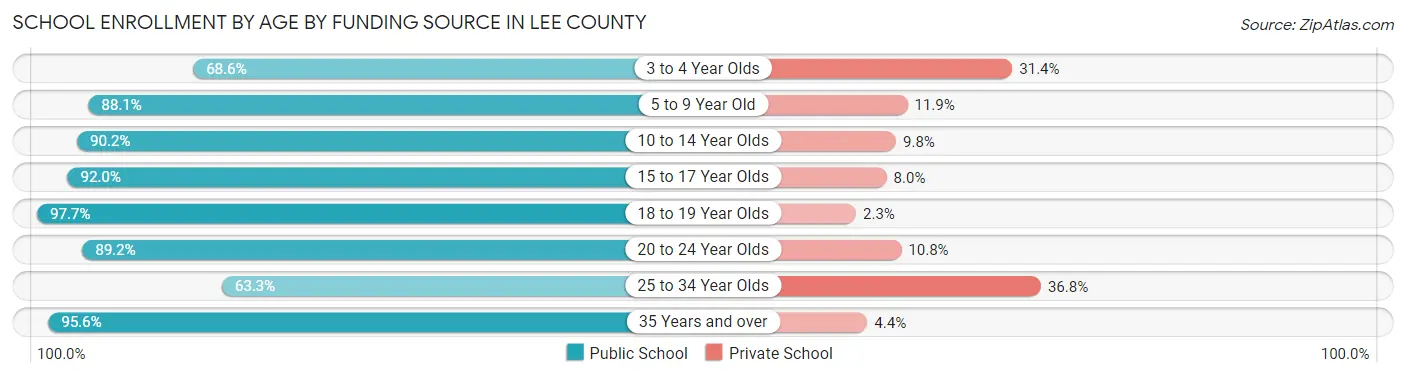
| Age Bracket | Public School | Private School |
| 3 to 4 Year Olds | 670 (68.6%) | 307 (31.4%) |
| 5 to 9 Year Old | 4,831 (88.1%) | 652 (11.9%) |
| 10 to 14 Year Olds | 5,301 (90.2%) | 574 (9.8%) |
| 15 to 17 Year Olds | 3,286 (92.0%) | 286 (8.0%) |
| 18 to 19 Year Olds | 1,391 (97.7%) | 33 (2.3%) |
| 20 to 24 Year Olds | 1,427 (89.2%) | 172 (10.8%) |
| 25 to 34 Year Olds | 432 (63.2%) | 251 (36.7%) |
| 35 Years and over | 713 (95.6%) | 33 (4.4%) |
| Total | 18,058 (88.7%) | 2,301 (11.3%) |
Educational Attainment by Field of Study in Lee County
Education (3,634 | 21.9%), business (3,235 | 19.5%), science & technology (2,786 | 16.8%), arts & humanities (1,675 | 10.1%), and engineering (902 | 5.4%) are the most common fields of study among 16,587 individuals in Lee County who have obtained a bachelor's degree or higher.
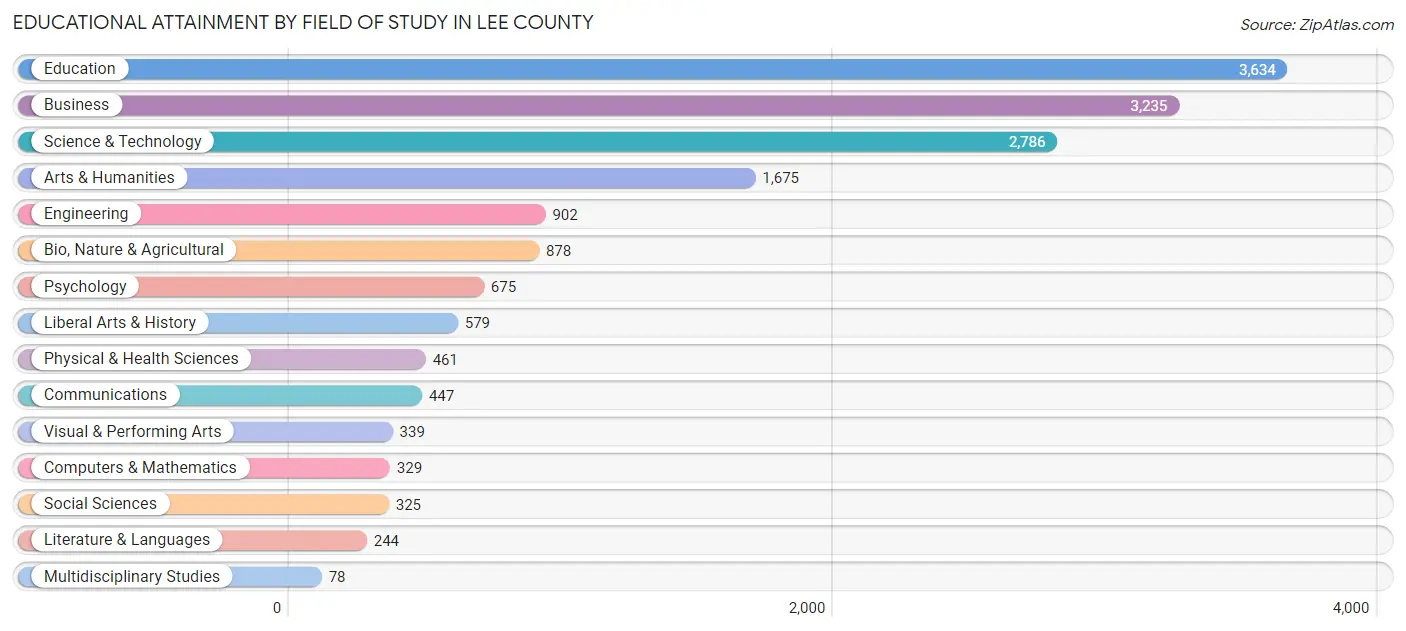
| Field of Study | # Graduates | % Graduates |
| Computers & Mathematics | 329 | 2.0% |
| Bio, Nature & Agricultural | 878 | 5.3% |
| Physical & Health Sciences | 461 | 2.8% |
| Psychology | 675 | 4.1% |
| Social Sciences | 325 | 2.0% |
| Engineering | 902 | 5.4% |
| Multidisciplinary Studies | 78 | 0.5% |
| Science & Technology | 2,786 | 16.8% |
| Business | 3,235 | 19.5% |
| Education | 3,634 | 21.9% |
| Literature & Languages | 244 | 1.5% |
| Liberal Arts & History | 579 | 3.5% |
| Visual & Performing Arts | 339 | 2.0% |
| Communications | 447 | 2.7% |
| Arts & Humanities | 1,675 | 10.1% |
| Total | 16,587 | 100.0% |
Transportation & Commute in Lee County
Vehicle Availability by Sex in Lee County
The most prevalent vehicle ownership categories in Lee County are males with 2 vehicles (8,679, accounting for 43.8%) and females with 2 vehicles (7,696, making up 47.6%).
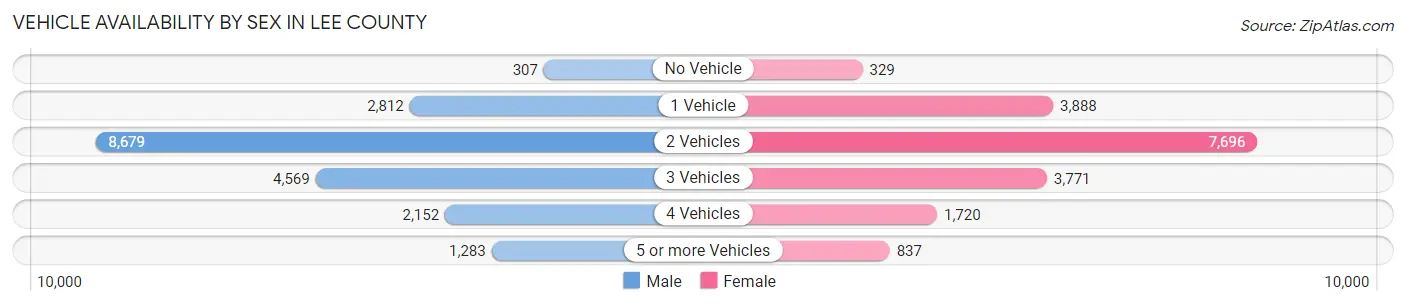
| Vehicles Available | Male | Female |
| No Vehicle | 307 (1.5%) | 329 (1.8%) |
| 1 Vehicle | 2,812 (14.2%) | 3,888 (21.3%) |
| 2 Vehicles | 8,679 (43.8%) | 7,696 (42.2%) |
| 3 Vehicles | 4,569 (23.1%) | 3,771 (20.7%) |
| 4 Vehicles | 2,152 (10.9%) | 1,720 (9.4%) |
| 5 or more Vehicles | 1,283 (6.5%) | 837 (4.6%) |
| Total | 19,802 (100.0%) | 18,241 (100.0%) |
Commute Time in Lee County
The most frequently occuring commute durations in Lee County are 15 to 19 minutes (8,446 commuters, 23.2%), 20 to 24 minutes (6,837 commuters, 18.8%), and 10 to 14 minutes (6,743 commuters, 18.5%).
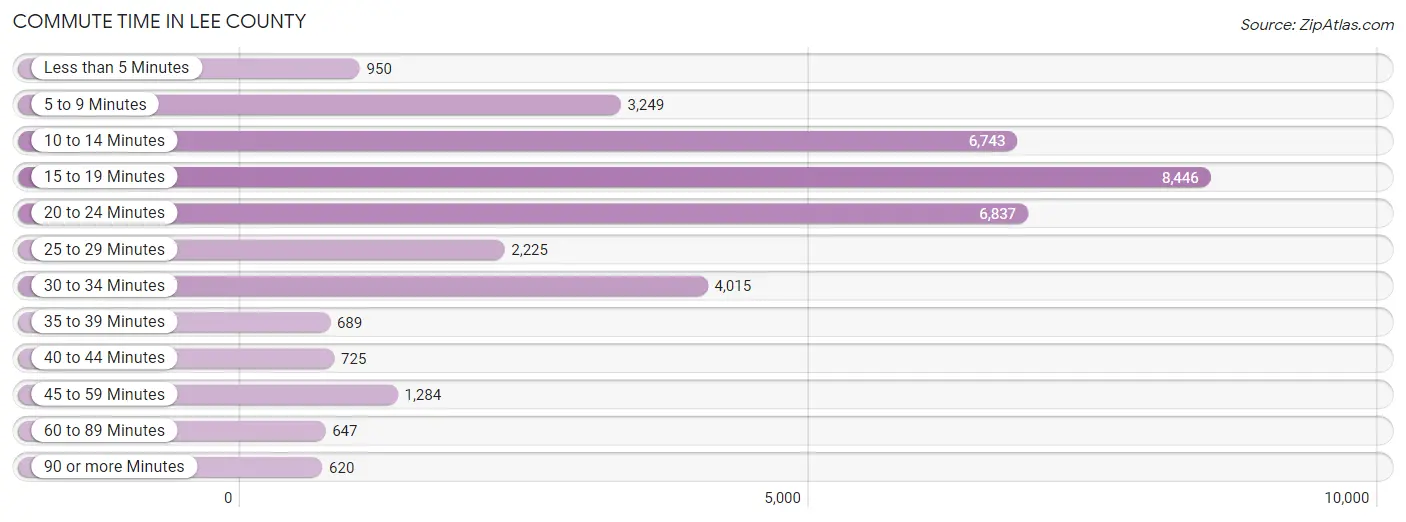
| Commute Time | # Commuters | % Commuters |
| Less than 5 Minutes | 950 | 2.6% |
| 5 to 9 Minutes | 3,249 | 8.9% |
| 10 to 14 Minutes | 6,743 | 18.5% |
| 15 to 19 Minutes | 8,446 | 23.2% |
| 20 to 24 Minutes | 6,837 | 18.8% |
| 25 to 29 Minutes | 2,225 | 6.1% |
| 30 to 34 Minutes | 4,015 | 11.0% |
| 35 to 39 Minutes | 689 | 1.9% |
| 40 to 44 Minutes | 725 | 2.0% |
| 45 to 59 Minutes | 1,284 | 3.5% |
| 60 to 89 Minutes | 647 | 1.8% |
| 90 or more Minutes | 620 | 1.7% |
Commute Time by Sex in Lee County
The most common commute times in Lee County are 15 to 19 minutes (4,492 commuters, 23.5%) for males and 15 to 19 minutes (3,954 commuters, 22.9%) for females.
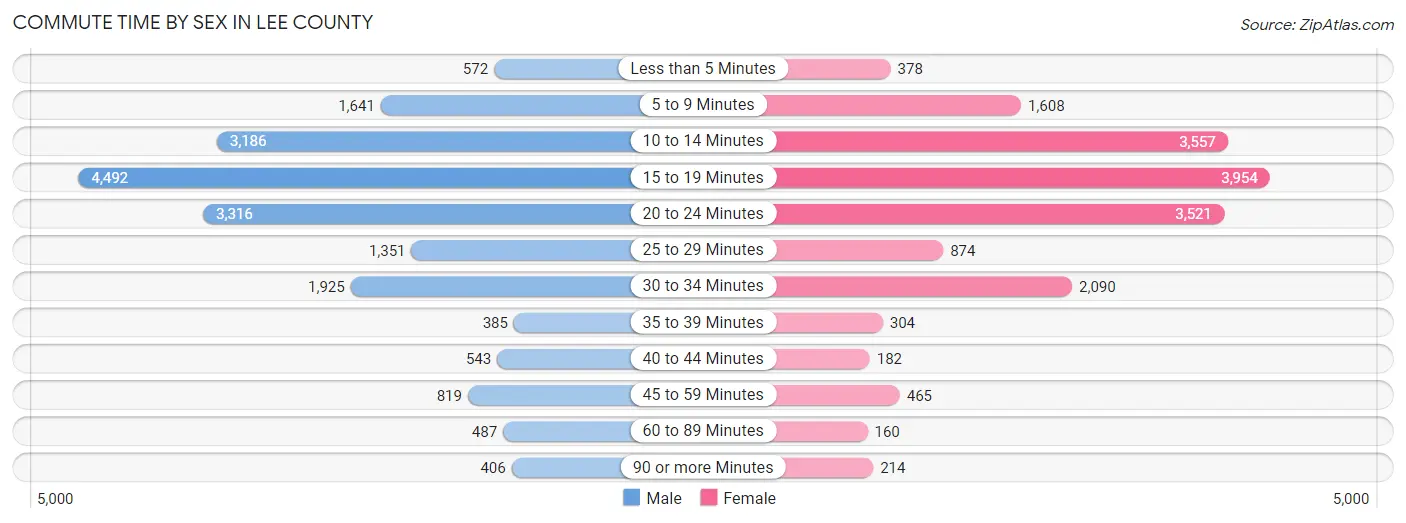
| Commute Time | Male | Female |
| Less than 5 Minutes | 572 (3.0%) | 378 (2.2%) |
| 5 to 9 Minutes | 1,641 (8.6%) | 1,608 (9.3%) |
| 10 to 14 Minutes | 3,186 (16.7%) | 3,557 (20.5%) |
| 15 to 19 Minutes | 4,492 (23.5%) | 3,954 (22.9%) |
| 20 to 24 Minutes | 3,316 (17.3%) | 3,521 (20.3%) |
| 25 to 29 Minutes | 1,351 (7.1%) | 874 (5.1%) |
| 30 to 34 Minutes | 1,925 (10.1%) | 2,090 (12.1%) |
| 35 to 39 Minutes | 385 (2.0%) | 304 (1.8%) |
| 40 to 44 Minutes | 543 (2.8%) | 182 (1.1%) |
| 45 to 59 Minutes | 819 (4.3%) | 465 (2.7%) |
| 60 to 89 Minutes | 487 (2.5%) | 160 (0.9%) |
| 90 or more Minutes | 406 (2.1%) | 214 (1.2%) |
Time of Departure to Work by Sex in Lee County
The most frequent times of departure to work in Lee County are 6:30 AM to 6:59 AM (3,126, 16.4%) for males and 7:00 AM to 7:29 AM (2,907, 16.8%) for females.
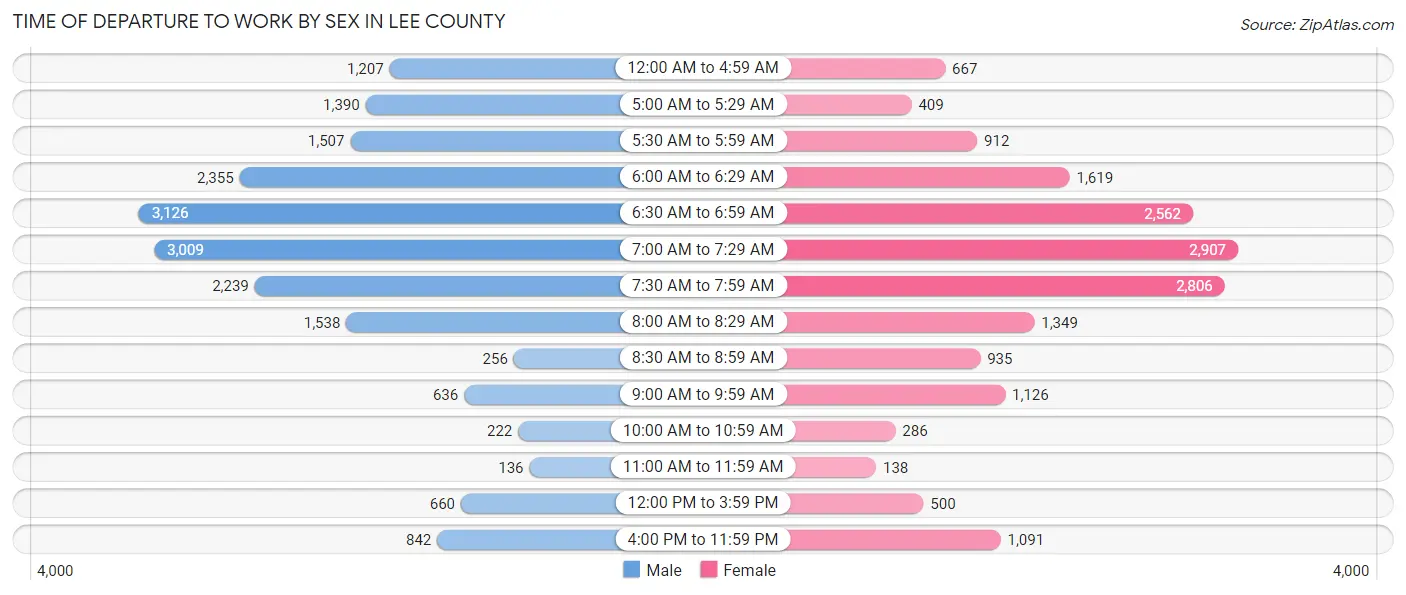
| Time of Departure | Male | Female |
| 12:00 AM to 4:59 AM | 1,207 (6.3%) | 667 (3.8%) |
| 5:00 AM to 5:29 AM | 1,390 (7.3%) | 409 (2.4%) |
| 5:30 AM to 5:59 AM | 1,507 (7.9%) | 912 (5.3%) |
| 6:00 AM to 6:29 AM | 2,355 (12.3%) | 1,619 (9.3%) |
| 6:30 AM to 6:59 AM | 3,126 (16.4%) | 2,562 (14.8%) |
| 7:00 AM to 7:29 AM | 3,009 (15.7%) | 2,907 (16.8%) |
| 7:30 AM to 7:59 AM | 2,239 (11.7%) | 2,806 (16.2%) |
| 8:00 AM to 8:29 AM | 1,538 (8.0%) | 1,349 (7.8%) |
| 8:30 AM to 8:59 AM | 256 (1.3%) | 935 (5.4%) |
| 9:00 AM to 9:59 AM | 636 (3.3%) | 1,126 (6.5%) |
| 10:00 AM to 10:59 AM | 222 (1.2%) | 286 (1.7%) |
| 11:00 AM to 11:59 AM | 136 (0.7%) | 138 (0.8%) |
| 12:00 PM to 3:59 PM | 660 (3.5%) | 500 (2.9%) |
| 4:00 PM to 11:59 PM | 842 (4.4%) | 1,091 (6.3%) |
| Total | 19,123 (100.0%) | 17,307 (100.0%) |
Housing Occupancy in Lee County
Occupancy by Ownership in Lee County
Of the total 32,001 dwellings in Lee County, owner-occupied units account for 22,383 (69.9%), while renter-occupied units make up 9,618 (30.1%).
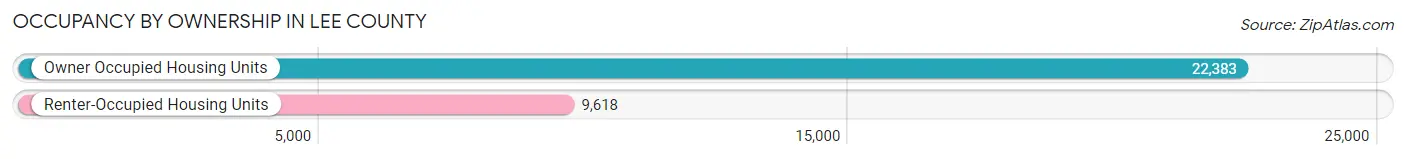
| Occupancy | # Housing Units | % Housing Units |
| Owner Occupied Housing Units | 22,383 | 69.9% |
| Renter-Occupied Housing Units | 9,618 | 30.1% |
| Total Occupied Housing Units | 32,001 | 100.0% |
Occupancy by Household Size in Lee County
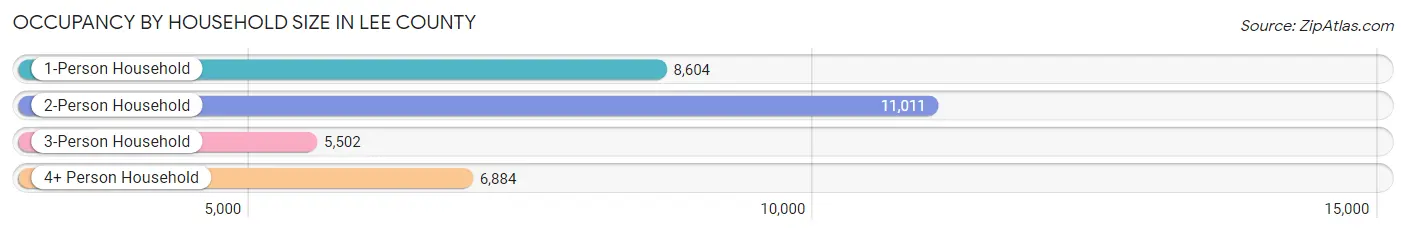
| Household Size | # Housing Units | % Housing Units |
| 1-Person Household | 8,604 | 26.9% |
| 2-Person Household | 11,011 | 34.4% |
| 3-Person Household | 5,502 | 17.2% |
| 4+ Person Household | 6,884 | 21.5% |
| Total Housing Units | 32,001 | 100.0% |
Occupancy by Ownership by Household Size in Lee County
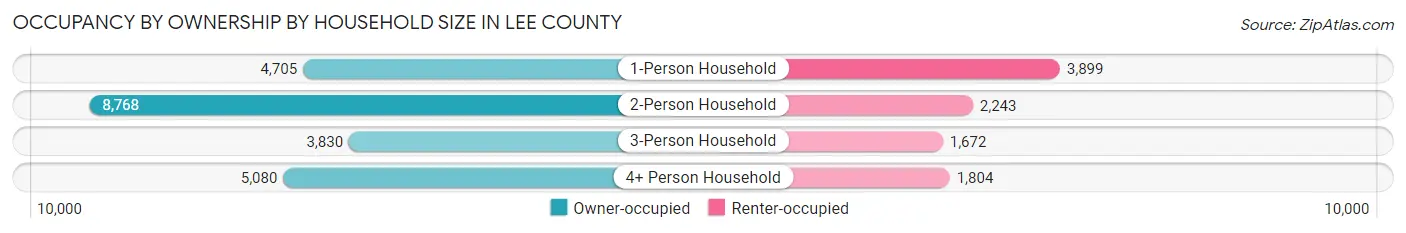
| Household Size | Owner-occupied | Renter-occupied |
| 1-Person Household | 4,705 (54.7%) | 3,899 (45.3%) |
| 2-Person Household | 8,768 (79.6%) | 2,243 (20.4%) |
| 3-Person Household | 3,830 (69.6%) | 1,672 (30.4%) |
| 4+ Person Household | 5,080 (73.8%) | 1,804 (26.2%) |
| Total Housing Units | 22,383 (69.9%) | 9,618 (30.1%) |
Occupancy by Educational Attainment in Lee County
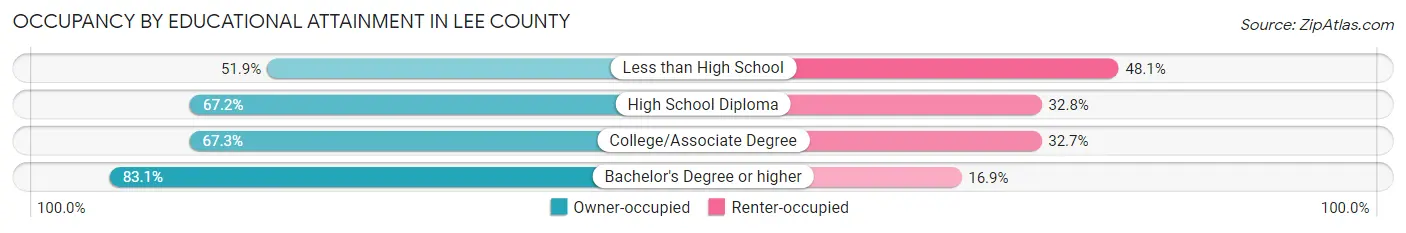
| Household Size | Owner-occupied | Renter-occupied |
| Less than High School | 2,004 (51.9%) | 1,854 (48.1%) |
| High School Diploma | 5,189 (67.2%) | 2,534 (32.8%) |
| College/Associate Degree | 7,564 (67.3%) | 3,681 (32.7%) |
| Bachelor's Degree or higher | 7,626 (83.1%) | 1,549 (16.9%) |
Occupancy by Age of Householder in Lee County
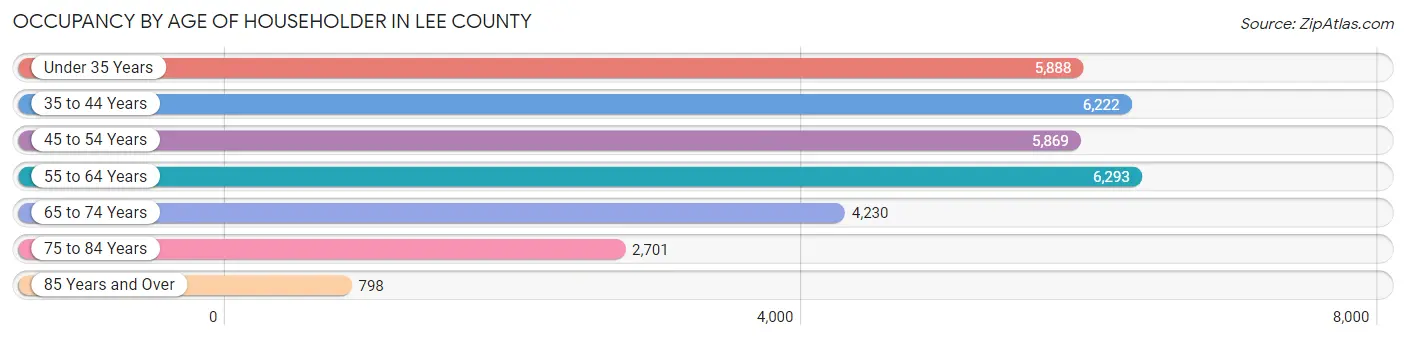
| Age Bracket | # Households | % Households |
| Under 35 Years | 5,888 | 18.4% |
| 35 to 44 Years | 6,222 | 19.4% |
| 45 to 54 Years | 5,869 | 18.3% |
| 55 to 64 Years | 6,293 | 19.7% |
| 65 to 74 Years | 4,230 | 13.2% |
| 75 to 84 Years | 2,701 | 8.4% |
| 85 Years and Over | 798 | 2.5% |
| Total | 32,001 | 100.0% |
Housing Finances in Lee County
Median Income by Occupancy in Lee County
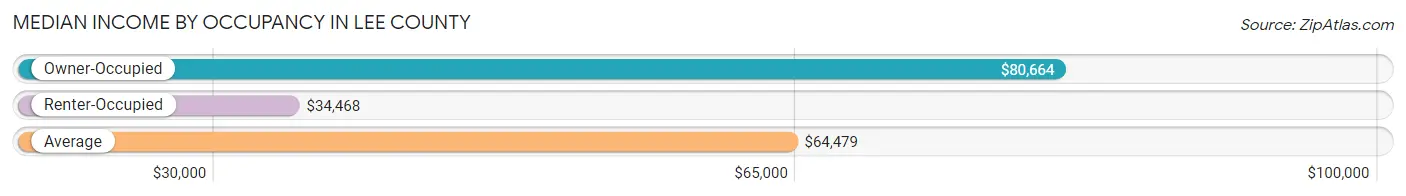
| Occupancy Type | # Households | Median Income |
| Owner-Occupied | 22,383 (69.9%) | $80,664 |
| Renter-Occupied | 9,618 (30.1%) | $34,468 |
| Average | 32,001 (100.0%) | $64,479 |
Occupancy by Householder Income Bracket in Lee County
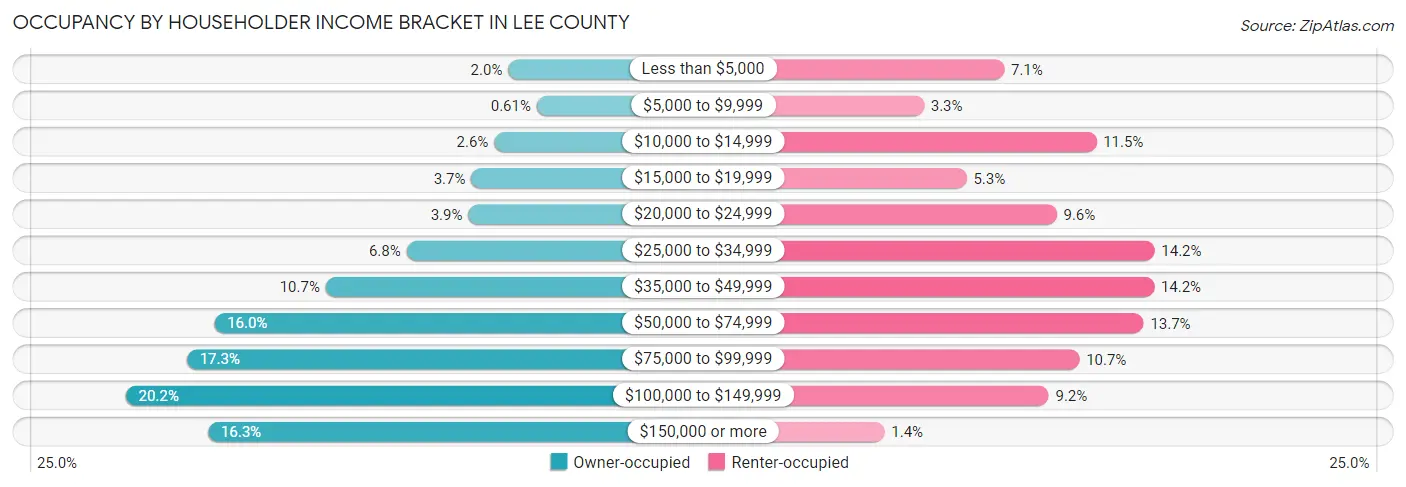
| Income Bracket | Owner-occupied | Renter-occupied |
| Less than $5,000 | 441 (2.0%) | 680 (7.1%) |
| $5,000 to $9,999 | 137 (0.6%) | 313 (3.3%) |
| $10,000 to $14,999 | 591 (2.6%) | 1,102 (11.5%) |
| $15,000 to $19,999 | 834 (3.7%) | 508 (5.3%) |
| $20,000 to $24,999 | 867 (3.9%) | 920 (9.6%) |
| $25,000 to $34,999 | 1,524 (6.8%) | 1,369 (14.2%) |
| $35,000 to $49,999 | 2,385 (10.7%) | 1,367 (14.2%) |
| $50,000 to $74,999 | 3,575 (16.0%) | 1,319 (13.7%) |
| $75,000 to $99,999 | 3,867 (17.3%) | 1,024 (10.6%) |
| $100,000 to $149,999 | 4,520 (20.2%) | 884 (9.2%) |
| $150,000 or more | 3,642 (16.3%) | 132 (1.4%) |
| Total | 22,383 (100.0%) | 9,618 (100.0%) |
Monthly Housing Cost Tiers in Lee County
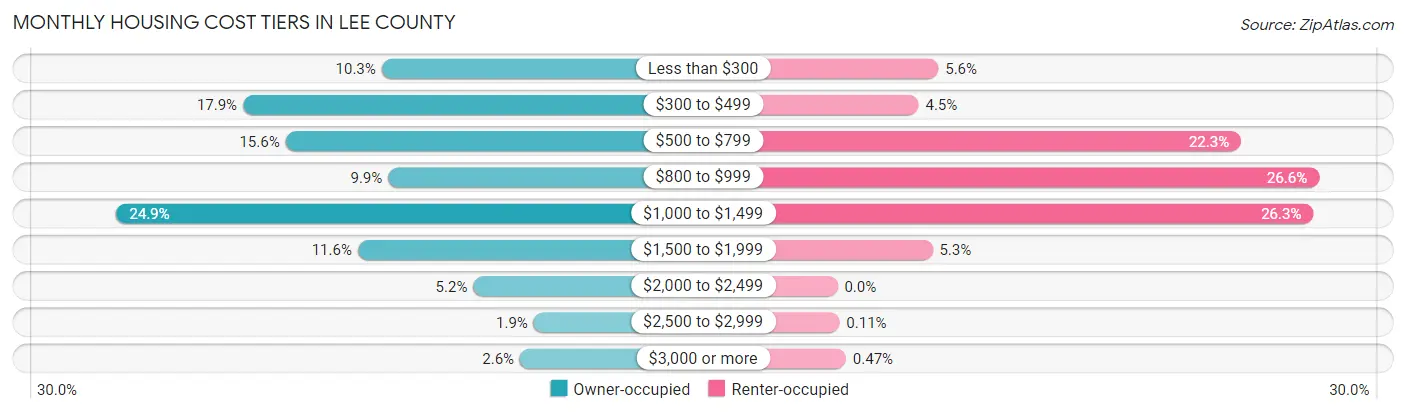
| Monthly Cost | Owner-occupied | Renter-occupied |
| Less than $300 | 2,301 (10.3%) | 536 (5.6%) |
| $300 to $499 | 4,015 (17.9%) | 431 (4.5%) |
| $500 to $799 | 3,490 (15.6%) | 2,144 (22.3%) |
| $800 to $999 | 2,220 (9.9%) | 2,558 (26.6%) |
| $1,000 to $1,499 | 5,580 (24.9%) | 2,528 (26.3%) |
| $1,500 to $1,999 | 2,597 (11.6%) | 505 (5.2%) |
| $2,000 to $2,499 | 1,169 (5.2%) | 0 (0.0%) |
| $2,500 to $2,999 | 421 (1.9%) | 11 (0.1%) |
| $3,000 or more | 590 (2.6%) | 45 (0.5%) |
| Total | 22,383 (100.0%) | 9,618 (100.0%) |
Physical Housing Characteristics in Lee County
Housing Structures in Lee County
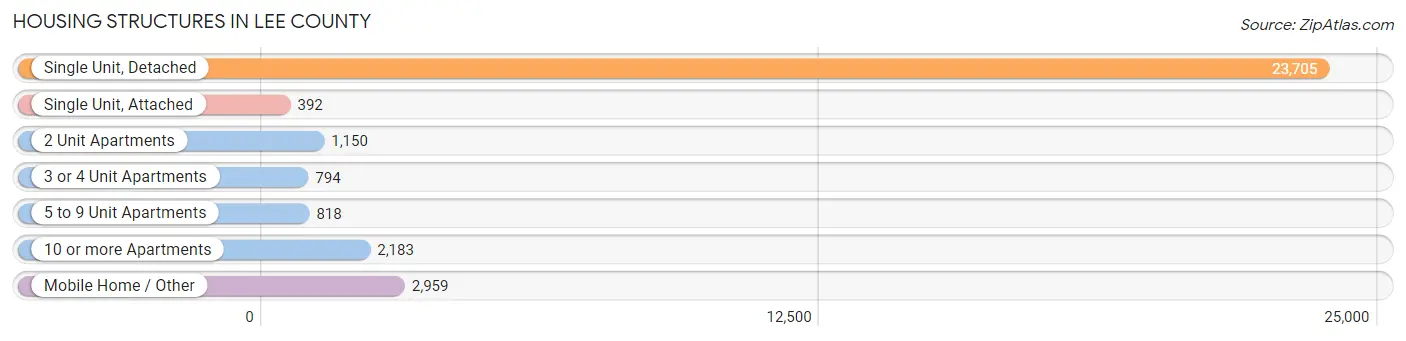
| Structure Type | # Housing Units | % Housing Units |
| Single Unit, Detached | 23,705 | 74.1% |
| Single Unit, Attached | 392 | 1.2% |
| 2 Unit Apartments | 1,150 | 3.6% |
| 3 or 4 Unit Apartments | 794 | 2.5% |
| 5 to 9 Unit Apartments | 818 | 2.6% |
| 10 or more Apartments | 2,183 | 6.8% |
| Mobile Home / Other | 2,959 | 9.2% |
| Total | 32,001 | 100.0% |
Housing Structures by Occupancy in Lee County
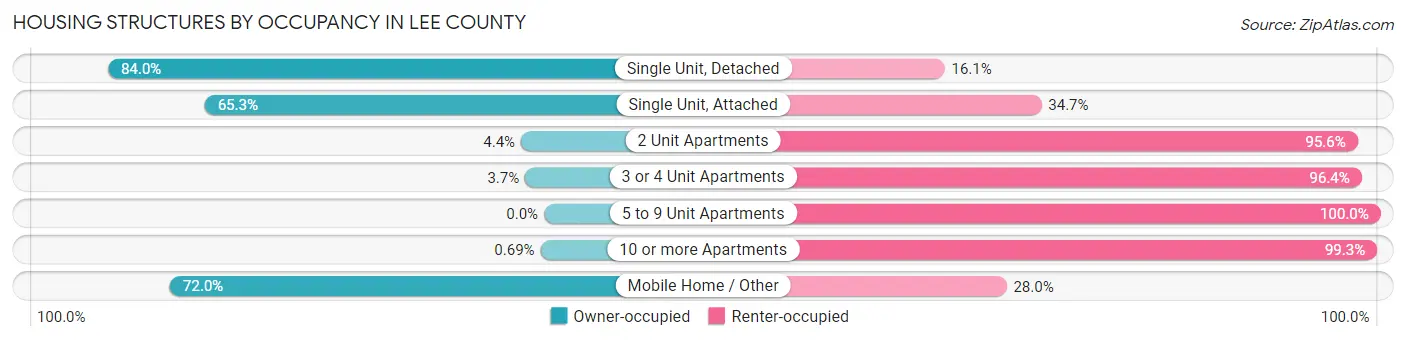
| Structure Type | Owner-occupied | Renter-occupied |
| Single Unit, Detached | 19,901 (84.0%) | 3,804 (16.1%) |
| Single Unit, Attached | 256 (65.3%) | 136 (34.7%) |
| 2 Unit Apartments | 51 (4.4%) | 1,099 (95.6%) |
| 3 or 4 Unit Apartments | 29 (3.6%) | 765 (96.4%) |
| 5 to 9 Unit Apartments | 0 (0.0%) | 818 (100.0%) |
| 10 or more Apartments | 15 (0.7%) | 2,168 (99.3%) |
| Mobile Home / Other | 2,131 (72.0%) | 828 (28.0%) |
| Total | 22,383 (69.9%) | 9,618 (30.1%) |
Housing Structures by Number of Rooms in Lee County
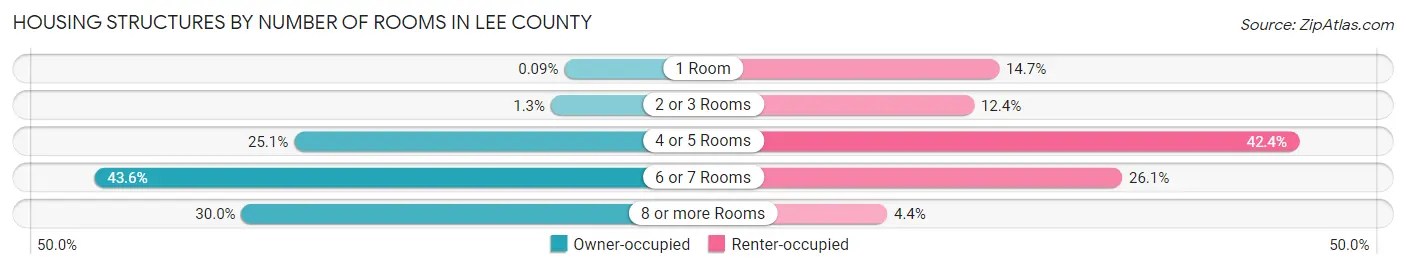
| Number of Rooms | Owner-occupied | Renter-occupied |
| 1 Room | 21 (0.1%) | 1,415 (14.7%) |
| 2 or 3 Rooms | 297 (1.3%) | 1,193 (12.4%) |
| 4 or 5 Rooms | 5,614 (25.1%) | 4,082 (42.4%) |
| 6 or 7 Rooms | 9,748 (43.5%) | 2,509 (26.1%) |
| 8 or more Rooms | 6,703 (29.9%) | 419 (4.4%) |
| Total | 22,383 (100.0%) | 9,618 (100.0%) |
Housing Structure by Heating Type in Lee County
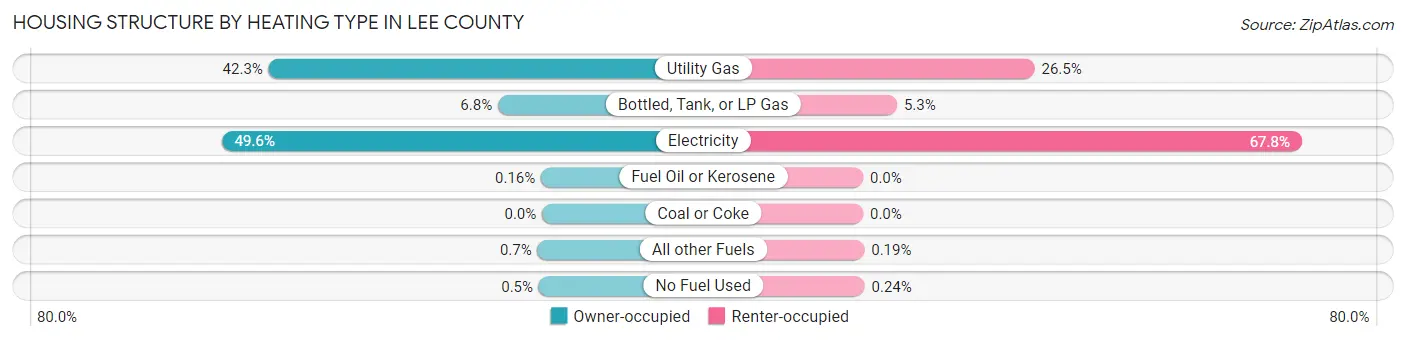
| Heating Type | Owner-occupied | Renter-occupied |
| Utility Gas | 9,461 (42.3%) | 2,550 (26.5%) |
| Bottled, Tank, or LP Gas | 1,526 (6.8%) | 505 (5.2%) |
| Electricity | 11,092 (49.6%) | 6,522 (67.8%) |
| Fuel Oil or Kerosene | 35 (0.2%) | 0 (0.0%) |
| Coal or Coke | 0 (0.0%) | 0 (0.0%) |
| All other Fuels | 156 (0.7%) | 18 (0.2%) |
| No Fuel Used | 113 (0.5%) | 23 (0.2%) |
| Total | 22,383 (100.0%) | 9,618 (100.0%) |
Household Vehicle Usage in Lee County
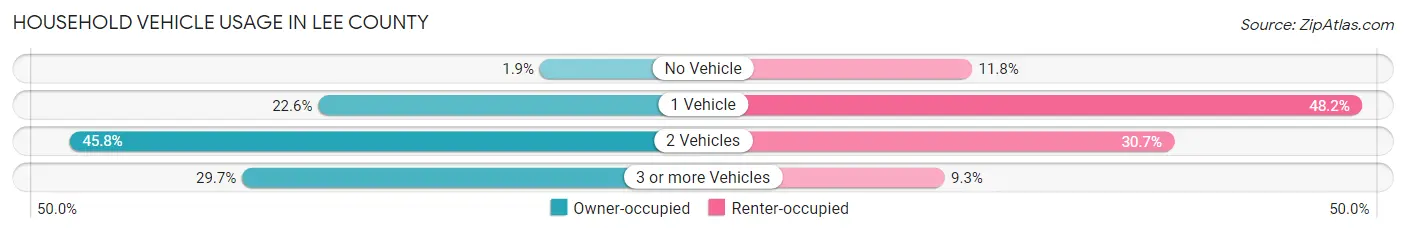
| Vehicles per Household | Owner-occupied | Renter-occupied |
| No Vehicle | 425 (1.9%) | 1,137 (11.8%) |
| 1 Vehicle | 5,056 (22.6%) | 4,638 (48.2%) |
| 2 Vehicles | 10,254 (45.8%) | 2,952 (30.7%) |
| 3 or more Vehicles | 6,648 (29.7%) | 891 (9.3%) |
| Total | 22,383 (100.0%) | 9,618 (100.0%) |
Real Estate & Mortgages in Lee County
Real Estate and Mortgage Overview in Lee County
| Characteristic | Without Mortgage | With Mortgage |
| Housing Units | 8,723 | 13,660 |
| Median Property Value | $144,100 | $185,900 |
| Median Household Income | $58,113 | $2,791 |
| Monthly Housing Costs | $407 | $590 |
| Real Estate Taxes | $974 | $1,075 |
Property Value by Mortgage Status in Lee County
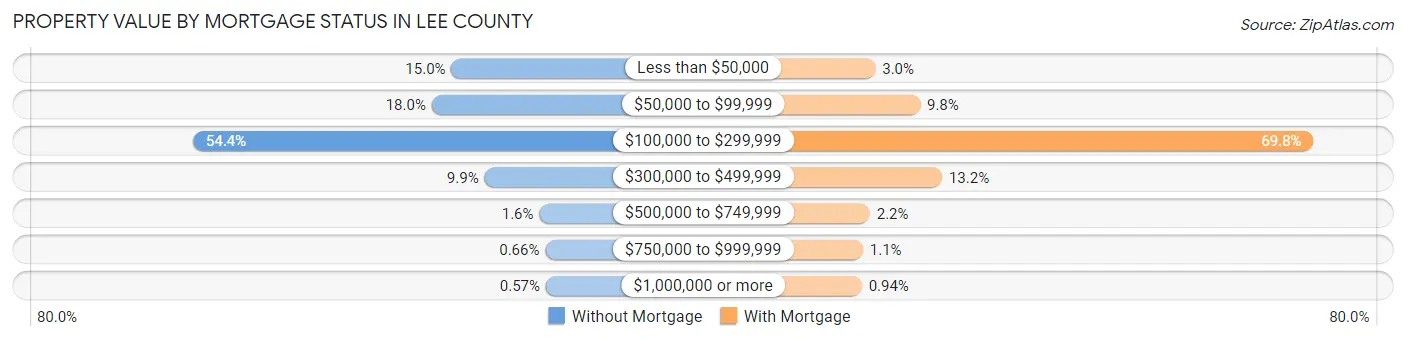
| Property Value | Without Mortgage | With Mortgage |
| Less than $50,000 | 1,305 (15.0%) | 411 (3.0%) |
| $50,000 to $99,999 | 1,567 (18.0%) | 1,343 (9.8%) |
| $100,000 to $299,999 | 4,742 (54.4%) | 9,531 (69.8%) |
| $300,000 to $499,999 | 865 (9.9%) | 1,799 (13.2%) |
| $500,000 to $749,999 | 136 (1.6%) | 296 (2.2%) |
| $750,000 to $999,999 | 58 (0.7%) | 152 (1.1%) |
| $1,000,000 or more | 50 (0.6%) | 128 (0.9%) |
| Total | 8,723 (100.0%) | 13,660 (100.0%) |
Household Income by Mortgage Status in Lee County
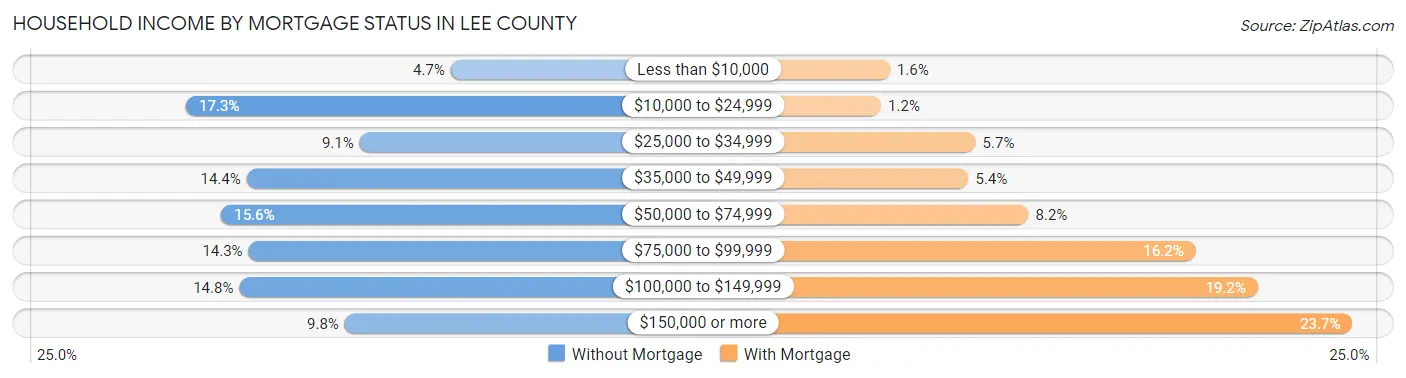
| Household Income | Without Mortgage | With Mortgage |
| Less than $10,000 | 411 (4.7%) | 224 (1.6%) |
| $10,000 to $24,999 | 1,510 (17.3%) | 167 (1.2%) |
| $25,000 to $34,999 | 789 (9.0%) | 782 (5.7%) |
| $35,000 to $49,999 | 1,259 (14.4%) | 735 (5.4%) |
| $50,000 to $74,999 | 1,363 (15.6%) | 1,126 (8.2%) |
| $75,000 to $99,999 | 1,251 (14.3%) | 2,212 (16.2%) |
| $100,000 to $149,999 | 1,289 (14.8%) | 2,616 (19.2%) |
| $150,000 or more | 851 (9.8%) | 3,231 (23.6%) |
| Total | 8,723 (100.0%) | 13,660 (100.0%) |
Property Value to Household Income Ratio in Lee County
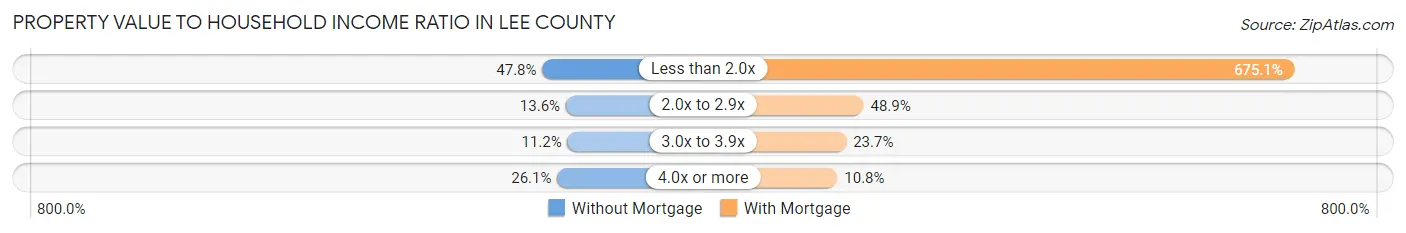
| Value-to-Income Ratio | Without Mortgage | With Mortgage |
| Less than 2.0x | 4,167 (47.8%) | 92,221 (675.1%) |
| 2.0x to 2.9x | 1,182 (13.6%) | 6,676 (48.9%) |
| 3.0x to 3.9x | 977 (11.2%) | 3,238 (23.7%) |
| 4.0x or more | 2,274 (26.1%) | 1,480 (10.8%) |
| Total | 8,723 (100.0%) | 13,660 (100.0%) |
Real Estate Taxes by Mortgage Status in Lee County
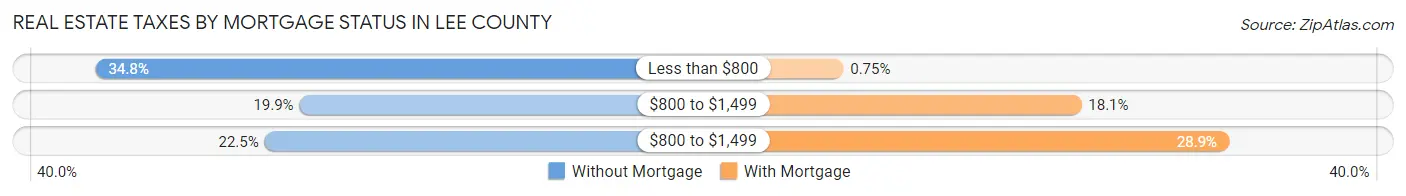
| Property Taxes | Without Mortgage | With Mortgage |
| Less than $800 | 3,037 (34.8%) | 102 (0.7%) |
| $800 to $1,499 | 1,738 (19.9%) | 2,478 (18.1%) |
| $800 to $1,499 | 1,960 (22.5%) | 3,950 (28.9%) |
| Total | 8,723 (100.0%) | 13,660 (100.0%) |
Health & Disability in Lee County
Health Insurance Coverage by Age in Lee County
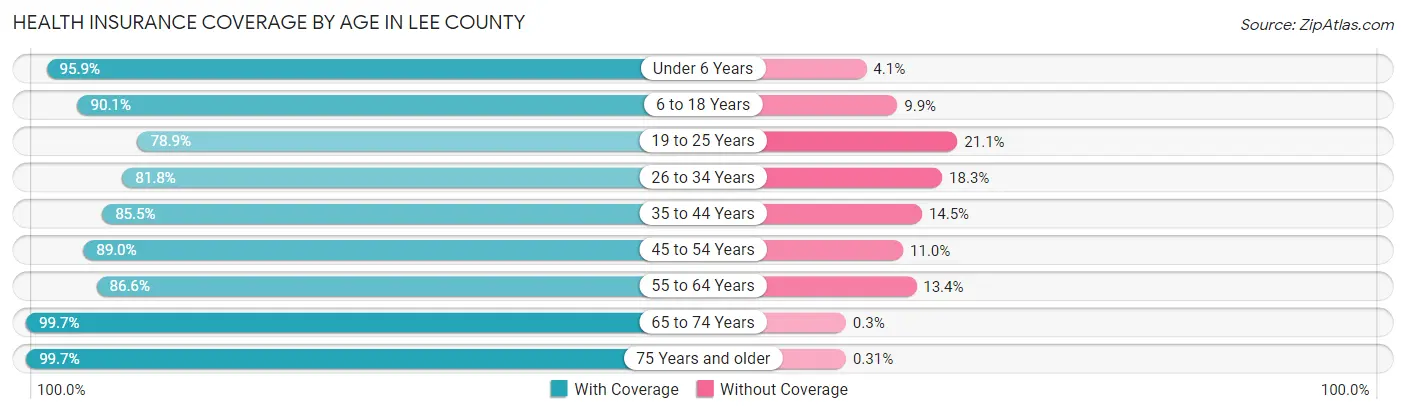
| Age Bracket | With Coverage | Without Coverage |
| Under 6 Years | 6,253 (95.9%) | 269 (4.1%) |
| 6 to 18 Years | 13,642 (90.1%) | 1,498 (9.9%) |
| 19 to 25 Years | 5,926 (78.9%) | 1,584 (21.1%) |
| 26 to 34 Years | 7,803 (81.8%) | 1,742 (18.2%) |
| 35 to 44 Years | 9,104 (85.5%) | 1,542 (14.5%) |
| 45 to 54 Years | 9,204 (89.0%) | 1,134 (11.0%) |
| 55 to 64 Years | 8,935 (86.6%) | 1,386 (13.4%) |
| 65 to 74 Years | 7,249 (99.7%) | 22 (0.3%) |
| 75 Years and older | 4,763 (99.7%) | 15 (0.3%) |
| Total | 72,879 (88.8%) | 9,192 (11.2%) |
Health Insurance Coverage by Citizenship Status in Lee County
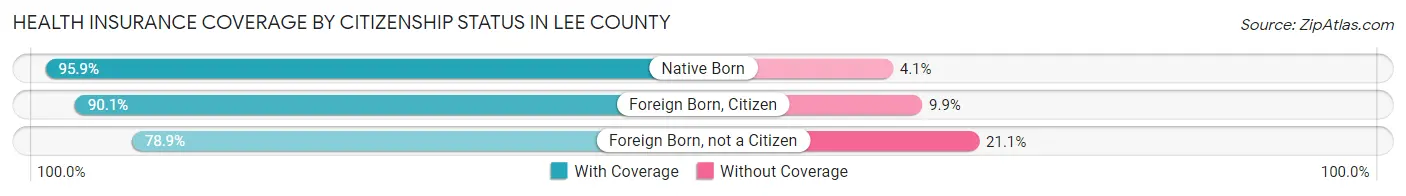
| Citizenship Status | With Coverage | Without Coverage |
| Native Born | 6,253 (95.9%) | 269 (4.1%) |
| Foreign Born, Citizen | 13,642 (90.1%) | 1,498 (9.9%) |
| Foreign Born, not a Citizen | 5,926 (78.9%) | 1,584 (21.1%) |
Health Insurance Coverage by Household Income in Lee County
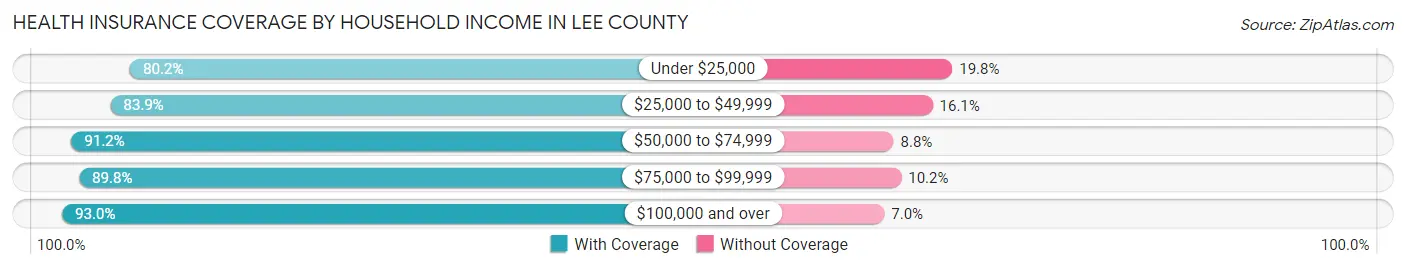
| Household Income | With Coverage | Without Coverage |
| Under $25,000 | 9,115 (80.2%) | 2,246 (19.8%) |
| $25,000 to $49,999 | 11,822 (83.9%) | 2,265 (16.1%) |
| $50,000 to $74,999 | 11,990 (91.2%) | 1,153 (8.8%) |
| $75,000 to $99,999 | 13,134 (89.8%) | 1,494 (10.2%) |
| $100,000 and over | 26,752 (93.0%) | 2,023 (7.0%) |
Public vs Private Health Insurance Coverage by Age in Lee County
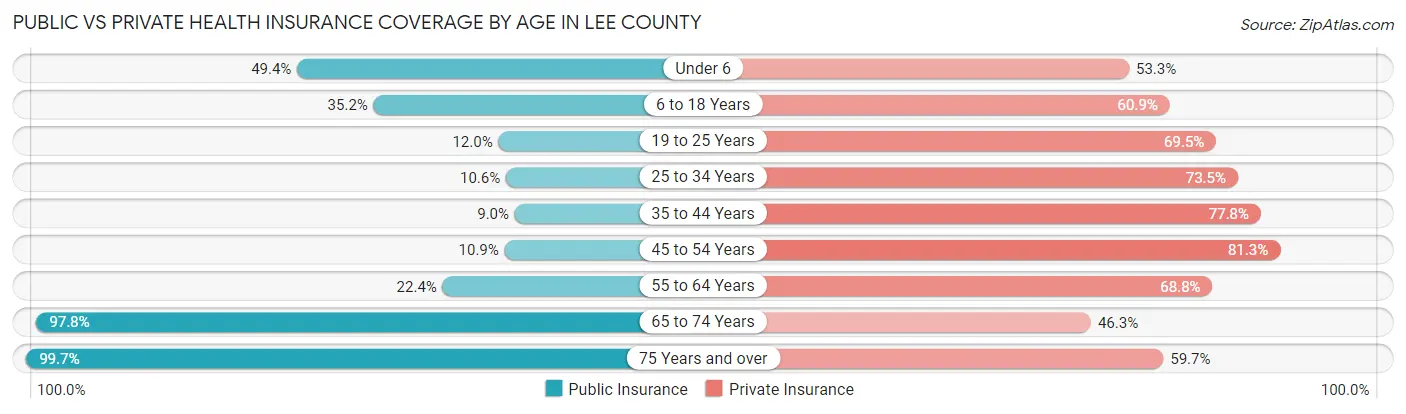
| Age Bracket | Public Insurance | Private Insurance |
| Under 6 | 3,222 (49.4%) | 3,477 (53.3%) |
| 6 to 18 Years | 5,331 (35.2%) | 9,212 (60.9%) |
| 19 to 25 Years | 904 (12.0%) | 5,218 (69.5%) |
| 25 to 34 Years | 1,016 (10.6%) | 7,016 (73.5%) |
| 35 to 44 Years | 958 (9.0%) | 8,280 (77.8%) |
| 45 to 54 Years | 1,127 (10.9%) | 8,408 (81.3%) |
| 55 to 64 Years | 2,312 (22.4%) | 7,099 (68.8%) |
| 65 to 74 Years | 7,112 (97.8%) | 3,363 (46.3%) |
| 75 Years and over | 4,763 (99.7%) | 2,851 (59.7%) |
| Total | 26,745 (32.6%) | 54,924 (66.9%) |
Disability Status by Sex by Age in Lee County
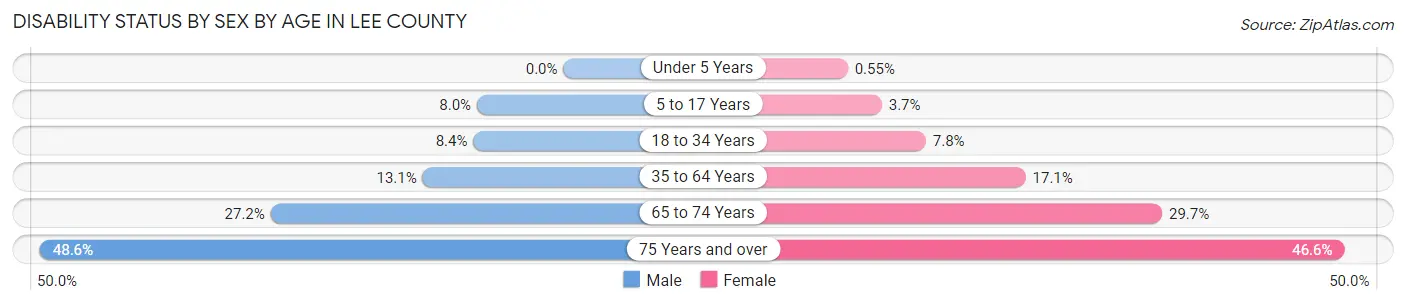
| Age Bracket | Male | Female |
| Under 5 Years | 0 (0.0%) | 15 (0.5%) |
| 5 to 17 Years | 617 (8.0%) | 283 (3.7%) |
| 18 to 34 Years | 723 (8.4%) | 727 (7.8%) |
| 35 to 64 Years | 1,941 (13.1%) | 2,807 (17.1%) |
| 65 to 74 Years | 884 (27.2%) | 1,194 (29.7%) |
| 75 Years and over | 943 (48.6%) | 1,323 (46.6%) |
Disability Class by Sex by Age in Lee County
Disability Class: Hearing Difficulty
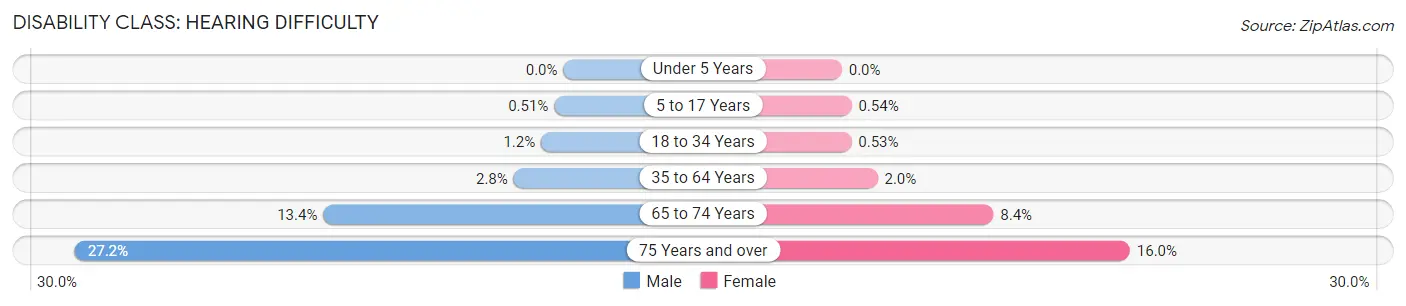
| Age Bracket | Male | Female |
| Under 5 Years | 0 (0.0%) | 0 (0.0%) |
| 5 to 17 Years | 39 (0.5%) | 41 (0.5%) |
| 18 to 34 Years | 107 (1.2%) | 49 (0.5%) |
| 35 to 64 Years | 411 (2.8%) | 327 (2.0%) |
| 65 to 74 Years | 435 (13.4%) | 339 (8.4%) |
| 75 Years and over | 528 (27.2%) | 455 (16.0%) |
Disability Class: Vision Difficulty
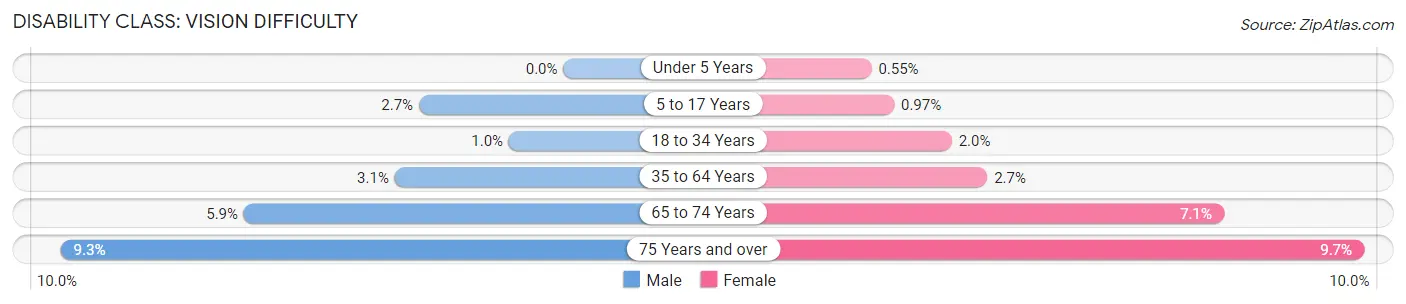
| Age Bracket | Male | Female |
| Under 5 Years | 0 (0.0%) | 15 (0.5%) |
| 5 to 17 Years | 206 (2.7%) | 74 (1.0%) |
| 18 to 34 Years | 87 (1.0%) | 190 (2.0%) |
| 35 to 64 Years | 465 (3.1%) | 445 (2.7%) |
| 65 to 74 Years | 193 (5.9%) | 285 (7.1%) |
| 75 Years and over | 181 (9.3%) | 275 (9.7%) |
Disability Class: Cognitive Difficulty
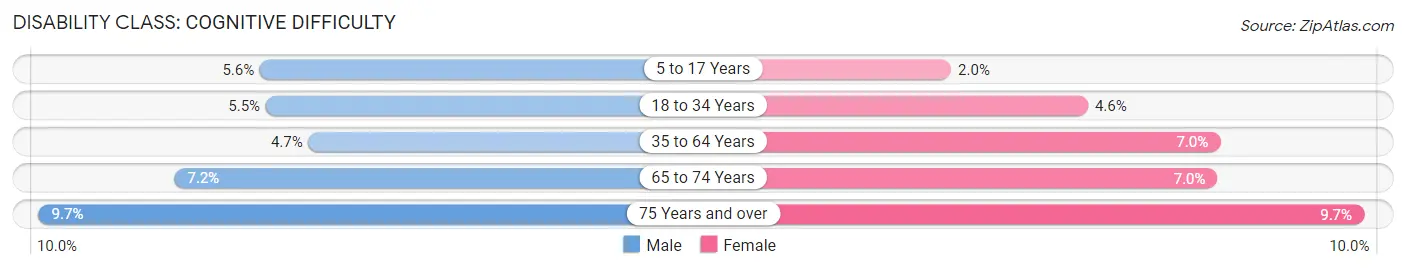
| Age Bracket | Male | Female |
| 5 to 17 Years | 433 (5.6%) | 155 (2.0%) |
| 18 to 34 Years | 477 (5.5%) | 426 (4.6%) |
| 35 to 64 Years | 703 (4.7%) | 1,155 (7.0%) |
| 65 to 74 Years | 235 (7.2%) | 280 (7.0%) |
| 75 Years and over | 189 (9.7%) | 275 (9.7%) |
Disability Class: Ambulatory Difficulty
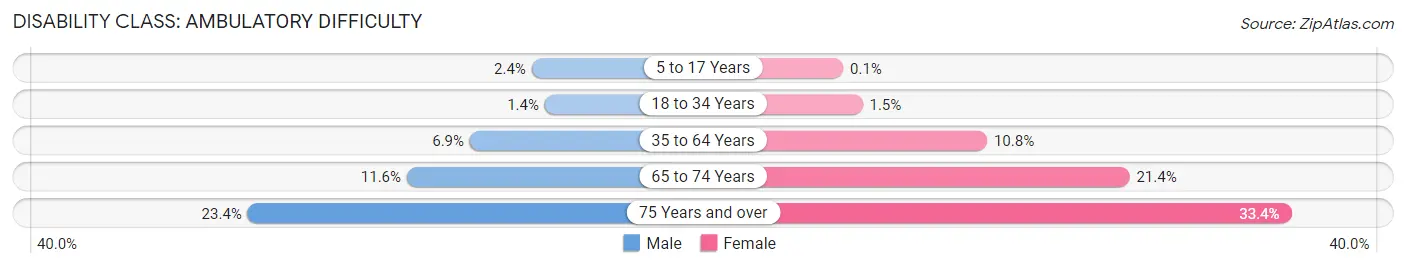
| Age Bracket | Male | Female |
| 5 to 17 Years | 181 (2.4%) | 8 (0.1%) |
| 18 to 34 Years | 119 (1.4%) | 144 (1.5%) |
| 35 to 64 Years | 1,030 (6.9%) | 1,774 (10.8%) |
| 65 to 74 Years | 378 (11.6%) | 858 (21.4%) |
| 75 Years and over | 455 (23.4%) | 947 (33.4%) |
Disability Class: Self-Care Difficulty
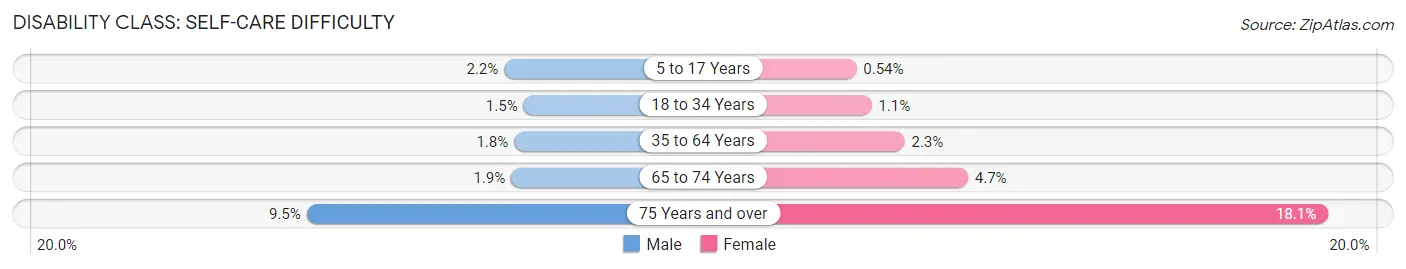
| Age Bracket | Male | Female |
| 5 to 17 Years | 169 (2.2%) | 41 (0.5%) |
| 18 to 34 Years | 128 (1.5%) | 103 (1.1%) |
| 35 to 64 Years | 272 (1.8%) | 384 (2.3%) |
| 65 to 74 Years | 63 (1.9%) | 188 (4.7%) |
| 75 Years and over | 185 (9.5%) | 512 (18.0%) |
Technology Access in Lee County
Computing Device Access in Lee County
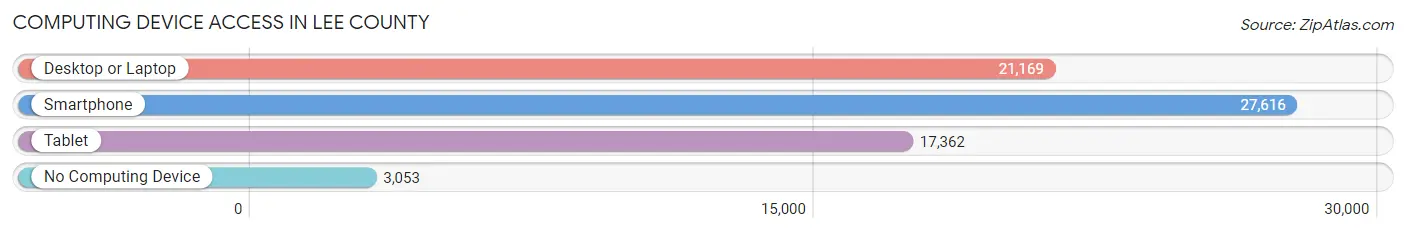
| Device Type | # Households | % Households |
| Desktop or Laptop | 21,169 | 66.1% |
| Smartphone | 27,616 | 86.3% |
| Tablet | 17,362 | 54.2% |
| No Computing Device | 3,053 | 9.5% |
| Total | 32,001 | 100.0% |
Internet Access in Lee County
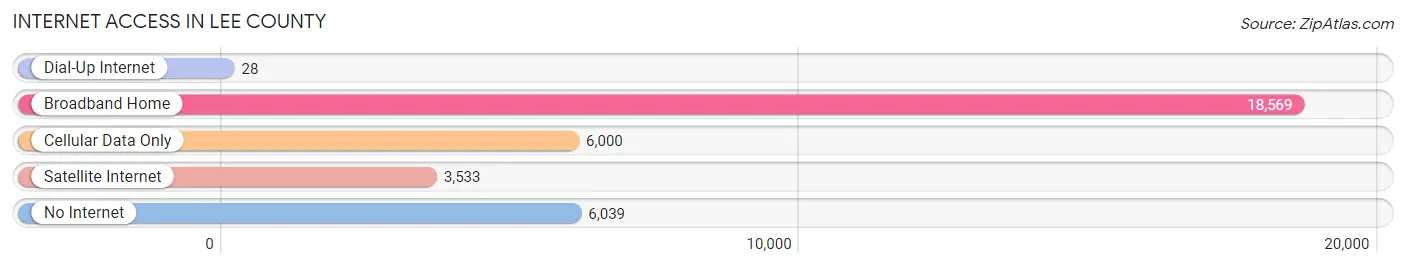
| Internet Type | # Households | % Households |
| Dial-Up Internet | 28 | 0.1% |
| Broadband Home | 18,569 | 58.0% |
| Cellular Data Only | 6,000 | 18.8% |
| Satellite Internet | 3,533 | 11.0% |
| No Internet | 6,039 | 18.9% |
| Total | 32,001 | 100.0% |
Lee County Summary
Lee County is located in the northeastern corner of Mississippi, and is bordered by the states of Tennessee and Alabama. It is part of the Tupelo, MS Metropolitan Statistical Area. The county was established in 1866 and named for Robert E. Lee, the Confederate general. As of the 2010 census, the population was 82,910, making it the fourth most populous county in Mississippi.
Geography
Lee County covers an area of 576 square miles, of which 574 square miles is land and 2 square miles is water. The terrain is mostly flat, with some rolling hills in the northern part of the county. The county is drained by the Tombigbee River, which forms its northern border. The county is located in the Black Belt region of Mississippi, and is part of the East Gulf Coastal Plain.
The county is home to several state parks, including Natchez Trace State Park, Tombigbee State Park, and Tupelo National Battlefield. The Natchez Trace Parkway, a 444-mile scenic byway, runs through the county.
Demographics
As of the 2010 census, there were 82,910 people, 31,845 households, and 22,845 families residing in the county. The population density was 144 people per square mile. The racial makeup of the county was 68.2% White, 28.7% African American, 0.3% Native American, 0.5% Asian, 0.1% Pacific Islander, 0.7% from other races, and 1.5% from two or more races. Hispanic or Latino of any race were 2.2% of the population.
The median income for a household in the county was $37,945, and the median income for a family was $45,945. The per capita income for the county was $19,945. About 17.2% of families and 21.2% of the population were below the poverty line, including 28.2% of those under age 18 and 16.2% of those age 65 or over.
Economy
Lee County is home to several major employers, including Toyota Motor Manufacturing Mississippi, which produces the Corolla and Highlander models. Other major employers include the University of Mississippi Medical Center, North Mississippi Medical Center, and the Tupelo Automobile Museum.
The county is also home to several small businesses, including restaurants, retail stores, and service providers. The county is home to several agricultural operations, including poultry, beef, and dairy farms.
Lee County is served by the Tupelo Regional Airport, which offers daily flights to several major cities. The county is also served by several major highways, including Interstate 22, U.S. Route 45, and U.S. Route 78.
Conclusion
Lee County is a vibrant and diverse county located in the northeastern corner of Mississippi. It is home to several major employers, including Toyota Motor Manufacturing Mississippi, the University of Mississippi Medical Center, and North Mississippi Medical Center. The county is also home to several small businesses, agricultural operations, and state parks. The county is served by the Tupelo Regional Airport and several major highways, making it an ideal location for businesses and residents alike.
Common Questions
What is the Total Population of Lee County?
Total Population of Lee County is 83,343.
What is the Total Male Population of Lee County?
Total Male Population of Lee County is 39,817.
What is the Total Female Population of Lee County?
Total Female Population of Lee County is 43,526.
What is the Ratio of Males per 100 Females in Lee County?
There are 91.48 Males per 100 Females in Lee County.
What is the Ratio of Females per 100 Males in Lee County?
There are 109.32 Females per 100 Males in Lee County.
What is the Median Population Age in Lee County?
Median Population Age in Lee County is 37.4 Years.
What is the Average Family Size in Lee County
Average Family Size in Lee County is 3.1 People.
What is the Average Household Size in Lee County
Average Household Size in Lee County is 2.6 People.
What is Per Capita Income in Lee County?
Per Capita income in Lee County is $33,209.
What is the Median Family Income in Lee County?
Median Family Income in Lee County is $80,674.
What is the Median Household income in Lee County?
Median Household Income in Lee County is $64,479.
What is Income or Wage Gap in Lee County?
Income or Wage Gap in Lee County is 31.4%.
Women in Lee County earn 68.6 cents for every dollar earned by a man.
What is Family Income Deficit in Lee County?
Family Income Deficit in Lee County is $10,227.
Families that are below poverty line in Lee County earn $10,227 less on average than the poverty threshold level.
What is Inequality or Gini Index in Lee County?
Inequality or Gini Index in Lee County is 0.46.
How Large is the Labor Force in Lee County?
There are 41,054 People in the Labor Forcein in Lee County.
What is the Percentage of People in the Labor Force in Lee County?
62.9% of People are in the Labor Force in Lee County.
What is the Unemployment Rate in Lee County?
Unemployment Rate in Lee County is 5.6%.