Leake County, MS
Leake County Map

Leake County Overview
21,335
TOTAL POPULATION
10,586
MALE POPULATION
10,749
FEMALE POPULATION
98.48
MALES / 100 FEMALES
101.54
FEMALES / 100 MALES
40.5
MEDIAN AGE
3.5
AVG FAMILY SIZE
2.8
AVG HOUSEHOLD SIZE
$25,662
PER CAPITA INCOME
$56,044
AVG FAMILY INCOME
$46,669
AVG HOUSEHOLD INCOME
31.1%
WAGE / INCOME GAP [ % ]
68.9¢/ $1
WAGE / INCOME GAP [ $ ]
0.50
INEQUALITY / GINI INDEX
8,623
LABOR FORCE [ PEOPLE ]
50.6%
PERCENT IN LABOR FORCE
6.0%
UNEMPLOYMENT RATE
Leake County Area Codes
Race in Leake County
The most populous races in Leake County are White / Caucasian (10,314 | 48.3%), Black / African American (8,483 | 39.8%), and Native / Alaskan (1,234 | 5.8%).

| Race | # Population | % Population |
| Asian | 96 | 0.4% |
| Black / African American | 8,483 | 39.8% |
| Hawaiian / Pacific | 0 | 0.0% |
| Hispanic or Latino | 1,098 | 5.1% |
| Native / Alaskan | 1,234 | 5.8% |
| White / Caucasian | 10,314 | 48.3% |
| Two or more Races | 397 | 1.9% |
| Some other Race | 811 | 3.8% |
| Total | 21,335 | 100.0% |
Ancestry in Leake County
The most populous ancestries reported in Leake County are American (2,316 | 10.9%), English (1,608 | 7.5%), Choctaw (1,243 | 5.8%), Irish (910 | 4.3%), and Central American (505 | 2.4%), together accounting for 30.9% of all Leake County residents.

| Ancestry | # Population | % Population |
| African | 138 | 0.6% |
| American | 2,316 | 10.9% |
| Brazilian | 29 | 0.1% |
| British | 19 | 0.1% |
| Central American | 505 | 2.4% |
| Cherokee | 5 | 0.0% |
| Chickasaw | 1 | 0.0% |
| Choctaw | 1,243 | 5.8% |
| Cuban | 1 | 0.0% |
| Dominican | 24 | 0.1% |
| Dutch | 79 | 0.4% |
| Eastern European | 53 | 0.3% |
| English | 1,608 | 7.5% |
| European | 124 | 0.6% |
| French | 295 | 1.4% |
| French Canadian | 9 | 0.0% |
| German | 317 | 1.5% |
| Guatemalan | 280 | 1.3% |
| Honduran | 225 | 1.1% |
| Hungarian | 1 | 0.0% |
| Irish | 910 | 4.3% |
| Italian | 81 | 0.4% |
| Laotian | 16 | 0.1% |
| Mexican | 262 | 1.2% |
| Peruvian | 290 | 1.4% |
| Polish | 43 | 0.2% |
| Portuguese | 72 | 0.3% |
| Scandinavian | 53 | 0.3% |
| Scotch-Irish | 93 | 0.4% |
| Scottish | 267 | 1.3% |
| South American | 290 | 1.4% |
| Subsaharan African | 138 | 0.6% |
| Swedish | 9 | 0.0% |
| Thai | 80 | 0.4% |
| Welsh | 110 | 0.5% | View All 35 Rows |
Immigrants in Leake County
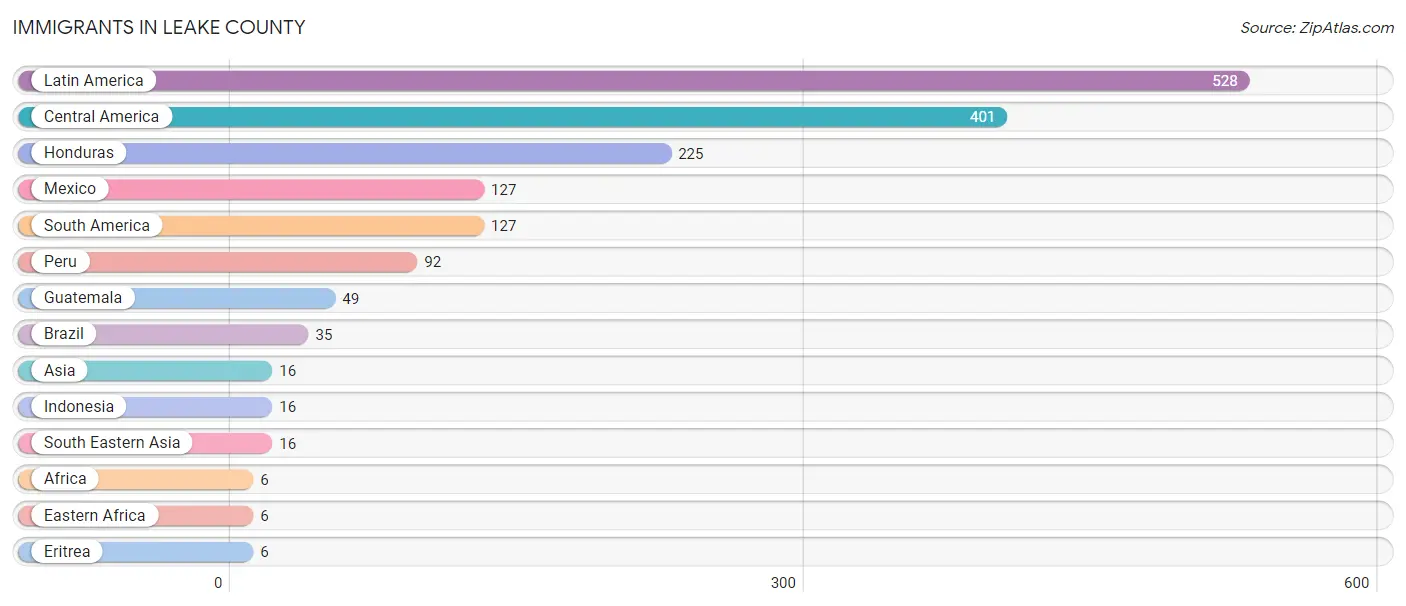
The most numerous immigrant groups reported in Leake County came from Latin America (528 | 2.5%), Central America (401 | 1.9%), Honduras (225 | 1.1%), Mexico (127 | 0.6%), and South America (127 | 0.6%), together accounting for 6.6% of all Leake County residents.
| Immigration Origin | # Population | % Population |
| Africa | 6 | 0.0% |
| Asia | 16 | 0.1% |
| Brazil | 35 | 0.2% |
| Central America | 401 | 1.9% |
| Eastern Africa | 6 | 0.0% |
| Eritrea | 6 | 0.0% |
| Guatemala | 49 | 0.2% |
| Honduras | 225 | 1.1% |
| Indonesia | 16 | 0.1% |
| Latin America | 528 | 2.5% |
| Mexico | 127 | 0.6% |
| Peru | 92 | 0.4% |
| South America | 127 | 0.6% |
| South Eastern Asia | 16 | 0.1% | View All 14 Rows |
Sex and Age in Leake County
Sex and Age in Leake County
The most populous age groups in Leake County are 10 to 14 Years (995 | 9.4%) for men and 40 to 44 Years (750 | 7.0%) for women.

| Age Bracket | Male | Female |
| Under 5 Years | 729 (6.9%) | 603 (5.6%) |
| 5 to 9 Years | 431 (4.1%) | 669 (6.2%) |
| 10 to 14 Years | 995 (9.4%) | 684 (6.4%) |
| 15 to 19 Years | 637 (6.0%) | 636 (5.9%) |
| 20 to 24 Years | 836 (7.9%) | 650 (6.0%) |
| 25 to 29 Years | 654 (6.2%) | 617 (5.7%) |
| 30 to 34 Years | 566 (5.3%) | 668 (6.2%) |
| 35 to 39 Years | 401 (3.8%) | 673 (6.3%) |
| 40 to 44 Years | 990 (9.3%) | 750 (7.0%) |
| 45 to 49 Years | 747 (7.1%) | 601 (5.6%) |
| 50 to 54 Years | 642 (6.1%) | 677 (6.3%) |
| 55 to 59 Years | 729 (6.9%) | 672 (6.2%) |
| 60 to 64 Years | 593 (5.6%) | 748 (7.0%) |
| 65 to 69 Years | 507 (4.8%) | 720 (6.7%) |
| 70 to 74 Years | 550 (5.2%) | 491 (4.6%) |
| 75 to 79 Years | 303 (2.9%) | 413 (3.8%) |
| 80 to 84 Years | 101 (0.9%) | 269 (2.5%) |
| 85 Years and over | 175 (1.7%) | 208 (1.9%) |
| Total | 10,586 (100.0%) | 10,749 (100.0%) |
Families and Households in Leake County
Median Family Size in Leake County
The median family size in Leake County is 3.46 persons per family, with single female/mother families (1,353 | 26.8%) accounting for the largest median family size of 3.97 persons per family. On the other hand, single male/father families (401 | 8.0%) represent the smallest median family size with 2.81 persons per family.

| Family Type | # Families | Family Size |
| Married-Couple | 3,291 (65.2%) | 3.33 |
| Single Male/Father | 401 (8.0%) | 2.81 |
| Single Female/Mother | 1,353 (26.8%) | 3.97 |
| Total Families | 5,045 (100.0%) | 3.46 |
Median Household Size in Leake County
The median household size in Leake County is 2.83 persons per household, with single female/mother households (1,353 | 18.4%) accounting for the largest median household size of 4.14 persons per household. non-family households (2,324 | 31.5%) represent the smallest median household size with 1.25 persons per household.

| Household Type | # Households | Household Size |
| Married-Couple | 3,291 (44.7%) | 3.37 |
| Single Male/Father | 401 (5.4%) | 3.09 |
| Single Female/Mother | 1,353 (18.4%) | 4.14 |
| Non-family | 2,324 (31.5%) | 1.25 |
| Total Households | 7,369 (100.0%) | 2.83 |
Household Size by Marriage Status in Leake County
Out of a total of 7,369 households in Leake County, 5,045 (68.5%) are family households, while 2,324 (31.5%) are nonfamily households. The most numerous type of family households are 2-person households, comprising 2,426, and the most common type of nonfamily households are 1-person households, comprising 2,071.

| Household Size | Family Households | Nonfamily Households |
| 1-Person Households | - | 2,071 (28.1%) |
| 2-Person Households | 2,426 (32.9%) | 132 (1.8%) |
| 3-Person Households | 1,245 (16.9%) | 55 (0.7%) |
| 4-Person Households | 761 (10.3%) | 40 (0.5%) |
| 5-Person Households | 332 (4.5%) | 26 (0.4%) |
| 6-Person Households | 134 (1.8%) | 0 (0.0%) |
| 7+ Person Households | 147 (2.0%) | 0 (0.0%) |
| Total | 5,045 (68.5%) | 2,324 (31.5%) |
Female Fertility in Leake County
Fertility by Age in Leake County
Average fertility rate in Leake County is 60.0 births per 1,000 women. Women in the age bracket of 20 to 34 years have the highest fertility rate with 145.0 births per 1,000 women. Women in the age bracket of 20 to 34 years acount for 100.0% of all women with births.

| Age Bracket | Women with Births | Births / 1,000 Women |
| 15 to 19 years | 0 (0.0%) | 0.0 |
| 20 to 34 years | 281 (100.0%) | 145.0 |
| 35 to 50 years | 0 (0.0%) | 0.0 |
| Total | 281 (100.0%) | 60.0 |
Fertility by Age by Marriage Status in Leake County
43.4% of women with births (281) in Leake County are married. The highest percentage of unmarried women with births falls into 20 to 34 years age bracket with 56.6% of them unmarried at the time of birth, while the lowest percentage of unmarried women with births belong to 20 to 34 years age bracket with 56.6% of them unmarried.

| Age Bracket | Married | Unmarried |
| 15 to 19 years | 0 (0.0%) | 0 (0.0%) |
| 20 to 34 years | 122 (43.4%) | 159 (56.6%) |
| 35 to 50 years | 0 (0.0%) | 0 (0.0%) |
| Total | 122 (43.4%) | 159 (56.6%) |
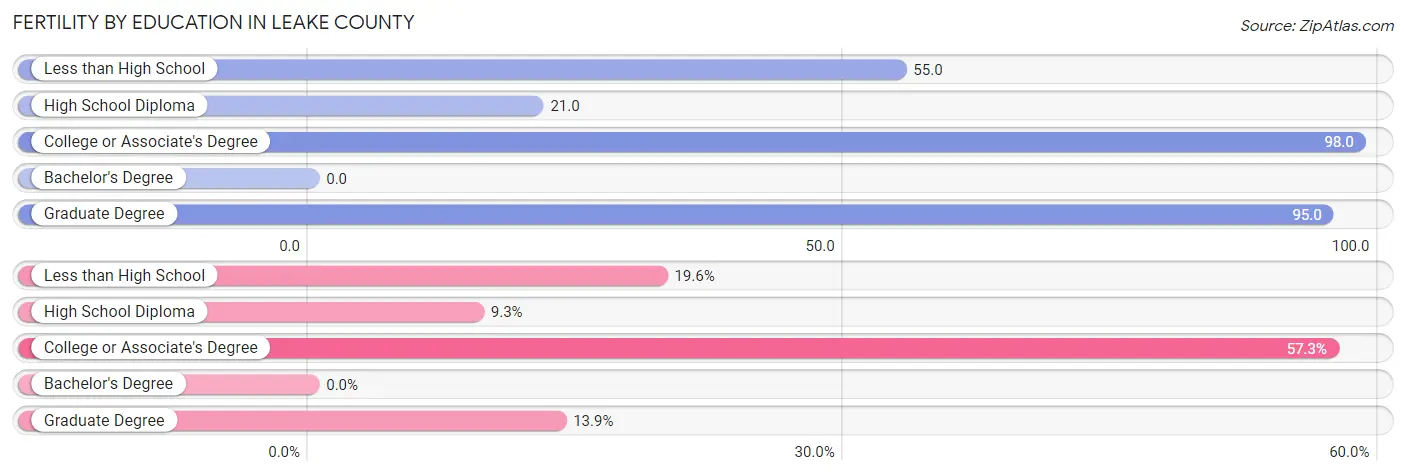
Fertility by Education in Leake County
| Educational Attainment | Women with Births | Births / 1,000 Women |
| Less than High School | 55 (19.6%) | 55.0 |
| High School Diploma | 26 (9.2%) | 21.0 |
| College or Associate's Degree | 161 (57.3%) | 98.0 |
| Bachelor's Degree | 0 (0.0%) | 0.0 |
| Graduate Degree | 39 (13.9%) | 95.0 |
| Total | 281 (100.0%) | 60.0 |
Fertility by Education by Marriage Status in Leake County
56.6% of women with births in Leake County are unmarried. Women with the educational attainment of high school diploma are most likely to be married with 57.7% of them married at childbirth, while women with the educational attainment of less than high school are least likely to be married with 69.1% of them unmarried at childbirth.
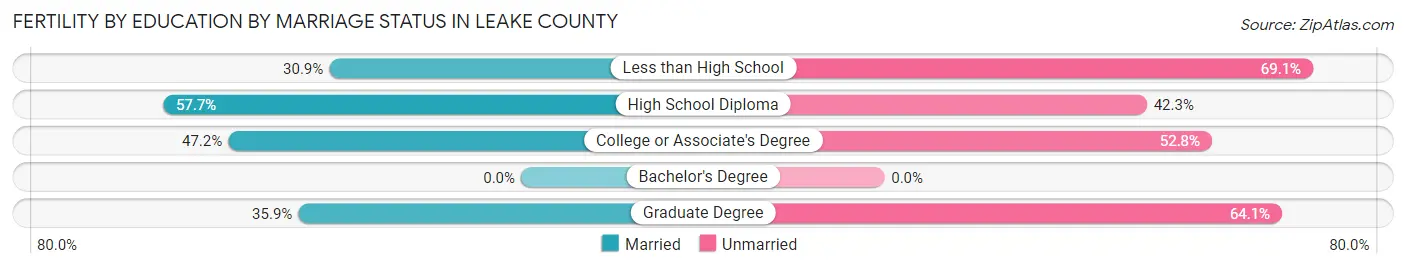
| Educational Attainment | Married | Unmarried |
| Less than High School | 17 (30.9%) | 38 (69.1%) |
| High School Diploma | 15 (57.7%) | 11 (42.3%) |
| College or Associate's Degree | 76 (47.2%) | 85 (52.8%) |
| Bachelor's Degree | 0 (0.0%) | 0 (0.0%) |
| Graduate Degree | 14 (35.9%) | 25 (64.1%) |
| Total | 122 (43.4%) | 159 (56.6%) |
Income in Leake County
Income Overview in Leake County
Per Capita Income in Leake County is $25,662, while median incomes of families and households are $56,044 and $46,669 respectively.
| Characteristic | Number | Measure |
| Per Capita Income | 21,335 | $25,662 |
| Median Family Income | 5,045 | $56,044 |
| Mean Family Income | 5,045 | $78,781 |
| Median Household Income | 7,369 | $46,669 |
| Mean Household Income | 7,369 | $66,515 |
| Income Deficit | 5,045 | $0 |
| Wage / Income Gap (%) | 21,335 | 31.13% |
| Wage / Income Gap ($) | 21,335 | 68.87¢ per $1 |
| Gini / Inequality Index | 21,335 | 0.50 |
Earnings by Sex in Leake County
Average Earnings in Leake County are $32,583, $37,243 for men and $25,650 for women, a difference of 31.1%.

| Sex | Number | Average Earnings |
| Male | 4,732 (51.6%) | $37,243 |
| Female | 4,431 (48.4%) | $25,650 |
| Total | 9,163 (100.0%) | $32,583 |
Earnings by Sex by Income Bracket in Leake County
The most common earnings brackets in Leake County are $45,000 to $49,999 for men (489 | 10.3%) and $2,499 or less for women (455 | 10.3%).

| Income | Male | Female |
| $2,499 or less | 333 (7.0%) | 455 (10.3%) |
| $2,500 to $4,999 | 95 (2.0%) | 29 (0.6%) |
| $5,000 to $7,499 | 277 (5.9%) | 75 (1.7%) |
| $7,500 to $9,999 | 82 (1.7%) | 97 (2.2%) |
| $10,000 to $12,499 | 131 (2.8%) | 331 (7.5%) |
| $12,500 to $14,999 | 40 (0.9%) | 233 (5.3%) |
| $15,000 to $17,499 | 109 (2.3%) | 129 (2.9%) |
| $17,500 to $19,999 | 102 (2.2%) | 172 (3.9%) |
| $20,000 to $22,499 | 248 (5.2%) | 269 (6.1%) |
| $22,500 to $24,999 | 112 (2.4%) | 368 (8.3%) |
| $25,000 to $29,999 | 432 (9.1%) | 357 (8.1%) |
| $30,000 to $34,999 | 108 (2.3%) | 217 (4.9%) |
| $35,000 to $39,999 | 396 (8.4%) | 299 (6.8%) |
| $40,000 to $44,999 | 295 (6.2%) | 365 (8.2%) |
| $45,000 to $49,999 | 489 (10.3%) | 253 (5.7%) |
| $50,000 to $54,999 | 84 (1.8%) | 123 (2.8%) |
| $55,000 to $64,999 | 372 (7.9%) | 138 (3.1%) |
| $65,000 to $74,999 | 272 (5.8%) | 137 (3.1%) |
| $75,000 to $99,999 | 393 (8.3%) | 291 (6.6%) |
| $100,000+ | 362 (7.6%) | 93 (2.1%) |
| Total | 4,732 (100.0%) | 4,431 (100.0%) |
Earnings by Sex by Educational Attainment in Leake County
Average earnings in Leake County are $40,095 for men and $30,732 for women, a difference of 23.4%. Men with an educational attainment of bachelor's degree enjoy the highest average annual earnings of $81,375, while those with less than high school education earn the least with $33,427. Women with an educational attainment of bachelor's degree earn the most with the average annual earnings of $45,278, while those with less than high school education have the smallest earnings of $21,333.

| Educational Attainment | Male Income | Female Income |
| Less than High School | $33,427 | $21,333 |
| High School Diploma | $36,011 | $24,975 |
| College or Associate's Degree | $43,214 | $31,591 |
| Bachelor's Degree | $81,375 | $45,278 |
| Graduate Degree | $41,908 | $40,000 |
| Total | $40,095 | $30,732 |
Family Income in Leake County
Family Income Brackets in Leake County
According to the Leake County family income data, there are 938 families falling into the $50,000 to $74,999 income range, which is the most common income bracket and makes up 18.6% of all families. Conversely, the $150,000 to $199,999 income bracket is the least frequent group with only 136 families (2.7%) belonging to this category.

| Income Bracket | # Families | % Families |
| Less than $10,000 | 313 | 6.2% |
| $10,000 to $14,999 | 146 | 2.9% |
| $15,000 to $24,999 | 494 | 9.8% |
| $25,000 to $34,999 | 404 | 8.0% |
| $35,000 to $49,999 | 893 | 17.7% |
| $50,000 to $74,999 | 938 | 18.6% |
| $75,000 to $99,999 | 787 | 15.6% |
| $100,000 to $149,999 | 666 | 13.2% |
| $150,000 to $199,999 | 136 | 2.7% |
| $200,000+ | 262 | 5.2% |
Family Income by Famaliy Size in Leake County
4-person families (730 | 14.5%) account for the highest median family income in Leake County with $61,944 per family, while 2-person families (2,531 | 50.2%) have the highest median income of $25,292 per family member.

| Income Bracket | # Families | Median Income |
| 2-Person Families | 2,531 (50.2%) | $50,583 |
| 3-Person Families | 1,207 (23.9%) | $52,090 |
| 4-Person Families | 730 (14.5%) | $61,944 |
| 5-Person Families | 322 (6.4%) | $53,056 |
| 6-Person Families | 193 (3.8%) | $58,388 |
| 7+ Person Families | 62 (1.2%) | $59,500 |
| Total | 5,045 (100.0%) | $56,044 |
Family Income by Number of Earners in Leake County
The median family income in Leake County is $56,044, with families comprising 3+ earners (251) having the highest median family income of $145,679, while families with no earners (997) have the lowest median family income of $26,982, accounting for 5.0% and 19.8% of families, respectively.

| Number of Earners | # Families | Median Income |
| No Earners | 997 (19.8%) | $26,982 |
| 1 Earner | 2,264 (44.9%) | $49,808 |
| 2 Earners | 1,533 (30.4%) | $84,190 |
| 3+ Earners | 251 (5.0%) | $145,679 |
| Total | 5,045 (100.0%) | $56,044 |
Household Income in Leake County
Household Income Brackets in Leake County
With 1,194 households falling in the category, the $50,000 to $74,999 income range is the most frequent in Leake County, accounting for 16.2% of all households. In contrast, only 147 households (2.0%) fall into the $150,000 to $199,999 income bracket, making it the least populous group.

| Income Bracket | # Households | % Households |
| Less than $10,000 | 590 | 8.0% |
| $10,000 to $14,999 | 479 | 6.5% |
| $15,000 to $24,999 | 1,039 | 14.1% |
| $25,000 to $34,999 | 803 | 10.9% |
| $35,000 to $49,999 | 1,157 | 15.7% |
| $50,000 to $74,999 | 1,194 | 16.2% |
| $75,000 to $99,999 | 936 | 12.7% |
| $100,000 to $149,999 | 737 | 10.0% |
| $150,000 to $199,999 | 147 | 2.0% |
| $200,000+ | 287 | 3.9% |
Household Income by Householder Age in Leake County
The median household income in Leake County is $46,669, with the highest median household income of $52,071 found in the 45 to 64 years age bracket for the primary householder. A total of 2,778 households (37.7%) fall into this category. Meanwhile, the 65+ years age bracket for the primary householder has the lowest median household income of $35,425, with 2,456 households (33.3%) in this group.

| Income Bracket | # Households | Median Income |
| 15 to 24 Years | 178 (2.4%) | $49,514 |
| 25 to 44 Years | 1,957 (26.6%) | $51,614 |
| 45 to 64 Years | 2,778 (37.7%) | $52,071 |
| 65+ Years | 2,456 (33.3%) | $35,425 |
| Total | 7,369 (100.0%) | $46,669 |
Poverty in Leake County
Income Below Poverty by Sex and Age in Leake County
With 20.5% poverty level for males and 21.4% for females among the residents of Leake County, 15 year old males and 15 year old females are the most vulnerable to poverty, with 78 males (48.4%) and 22 females (100.0%) in their respective age groups living below the poverty level.

| Age Bracket | Male | Female |
| Under 5 Years | 264 (39.4%) | 167 (28.7%) |
| 5 Years | 0 (0.0%) | 34 (18.8%) |
| 6 to 11 Years | 229 (36.4%) | 163 (25.7%) |
| 12 to 14 Years | 195 (26.5%) | 200 (41.4%) |
| 15 Years | 78 (48.4%) | 22 (100.0%) |
| 16 and 17 Years | 35 (13.6%) | 151 (44.5%) |
| 18 to 24 Years | 201 (19.4%) | 248 (26.8%) |
| 25 to 34 Years | 117 (10.8%) | 301 (23.4%) |
| 35 to 44 Years | 360 (27.7%) | 167 (11.7%) |
| 45 to 54 Years | 196 (14.5%) | 250 (19.6%) |
| 55 to 64 Years | 216 (16.6%) | 176 (12.4%) |
| 65 to 74 Years | 150 (14.6%) | 192 (16.1%) |
| 75 Years and over | 26 (4.8%) | 197 (24.5%) |
| Total | 2,067 (20.5%) | 2,268 (21.4%) |
Income Above Poverty by Sex and Age in Leake County
According to the poverty statistics in Leake County, males aged 5 years and females aged 35 to 44 years are the age groups that are most secure financially, with 100.0% of males and 88.3% of females in these age groups living above the poverty line.

| Age Bracket | Male | Female |
| Under 5 Years | 406 (60.6%) | 414 (71.3%) |
| 5 Years | 5 (100.0%) | 147 (81.2%) |
| 6 to 11 Years | 400 (63.6%) | 471 (74.3%) |
| 12 to 14 Years | 540 (73.5%) | 283 (58.6%) |
| 15 Years | 83 (51.5%) | 0 (0.0%) |
| 16 and 17 Years | 222 (86.4%) | 188 (55.5%) |
| 18 to 24 Years | 833 (80.6%) | 677 (73.2%) |
| 25 to 34 Years | 968 (89.2%) | 984 (76.6%) |
| 35 to 44 Years | 940 (72.3%) | 1,256 (88.3%) |
| 45 to 54 Years | 1,158 (85.5%) | 1,028 (80.4%) |
| 55 to 64 Years | 1,085 (83.4%) | 1,244 (87.6%) |
| 65 to 74 Years | 876 (85.4%) | 1,004 (84.0%) |
| 75 Years and over | 521 (95.3%) | 607 (75.5%) |
| Total | 8,037 (79.5%) | 8,303 (78.5%) |
Income Below Poverty Among Married-Couple Families in Leake County
The poverty statistics for married-couple families in Leake County show that 9.0% or 298 of the total 3,291 families live below the poverty line. Families with 5 or more children have the highest poverty rate of 61.1%, comprising of 22 families. On the other hand, families with 3 or 4 children have the lowest poverty rate of 0.7%, which includes 1 families.

| Children | Above Poverty | Below Poverty |
| No Children | 1,853 (94.6%) | 105 (5.4%) |
| 1 or 2 Children | 984 (85.3%) | 170 (14.7%) |
| 3 or 4 Children | 142 (99.3%) | 1 (0.7%) |
| 5 or more Children | 14 (38.9%) | 22 (61.1%) |
| Total | 2,993 (90.9%) | 298 (9.0%) |
Income Below Poverty Among Single-Parent Households in Leake County
According to the poverty data in Leake County, 3.0% or 12 single-father households and 36.0% or 487 single-mother households are living below the poverty line. Among single-father households, those with 3 or 4 children have the highest poverty rate, with 12 households (100.0%) experiencing poverty. Likewise, among single-mother households, those with 5 or more children have the highest poverty rate, with 11 households (100.0%) falling below the poverty line.

| Children | Single Father | Single Mother |
| No Children | 0 (0.0%) | 102 (17.6%) |
| 1 or 2 Children | 0 (0.0%) | 266 (43.8%) |
| 3 or 4 Children | 12 (100.0%) | 108 (69.7%) |
| 5 or more Children | 0 (0.0%) | 11 (100.0%) |
| Total | 12 (3.0%) | 487 (36.0%) |
Income Below Poverty Among Married-Couple vs Single-Parent Households in Leake County
The poverty data for Leake County shows that 298 of the married-couple family households (9.0%) and 499 of the single-parent households (28.4%) are living below the poverty level. Within the married-couple family households, those with 5 or more children have the highest poverty rate, with 22 households (61.1%) falling below the poverty line. Among the single-parent households, those with 5 or more children have the highest poverty rate, with 11 household (100.0%) living below poverty.

| Children | Married-Couple Families | Single-Parent Households |
| No Children | 105 (5.4%) | 102 (11.8%) |
| 1 or 2 Children | 170 (14.7%) | 266 (37.5%) |
| 3 or 4 Children | 1 (0.7%) | 120 (71.9%) |
| 5 or more Children | 22 (61.1%) | 11 (100.0%) |
| Total | 298 (9.0%) | 499 (28.4%) |
Employment Characteristics in Leake County
Employment by Class of Employer in Leake County
Among the 8,014 employed individuals in Leake County, private company employees (5,106 | 63.7%), federal government employees (635 | 7.9%), and state government employees (604 | 7.5%) make up the most common classes of employment.
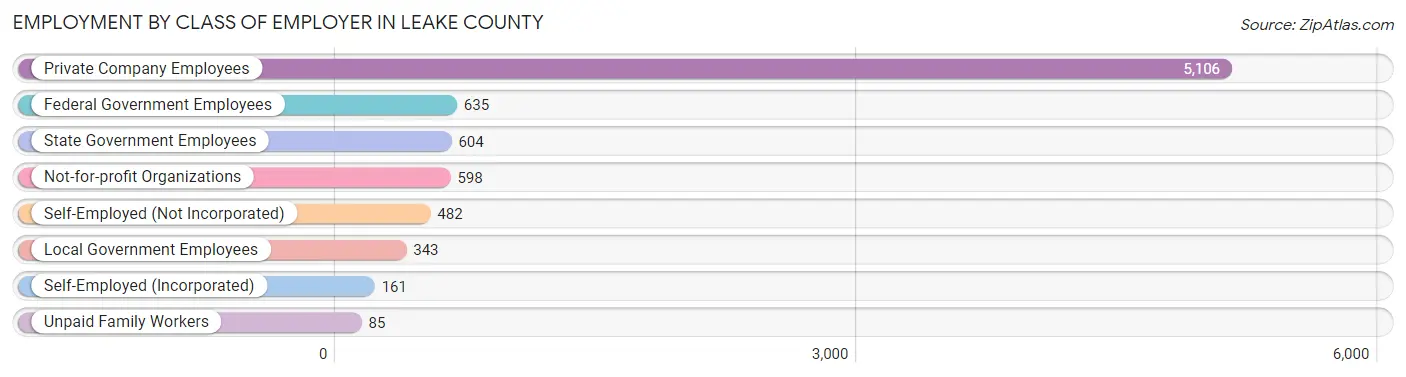
| Employer Class | # Employees | % Employees |
| Private Company Employees | 5,106 | 63.7% |
| Self-Employed (Incorporated) | 161 | 2.0% |
| Self-Employed (Not Incorporated) | 482 | 6.0% |
| Not-for-profit Organizations | 598 | 7.5% |
| Local Government Employees | 343 | 4.3% |
| State Government Employees | 604 | 7.5% |
| Federal Government Employees | 635 | 7.9% |
| Unpaid Family Workers | 85 | 1.1% |
| Total | 8,014 | 100.0% |
Employment Status by Age in Leake County
According to the labor force statistics for Leake County, out of the total population over 16 years of age (17,041), 50.6% or 8,623 individuals are in the labor force, with 6.0% or 517 of them unemployed. The age group with the highest labor force participation rate is 30 to 34 years, with 78.1% or 964 individuals in the labor force. Within the labor force, the 16 to 19 years age range has the highest percentage of unemployed individuals, with 31.6% or 112 of them being unemployed.
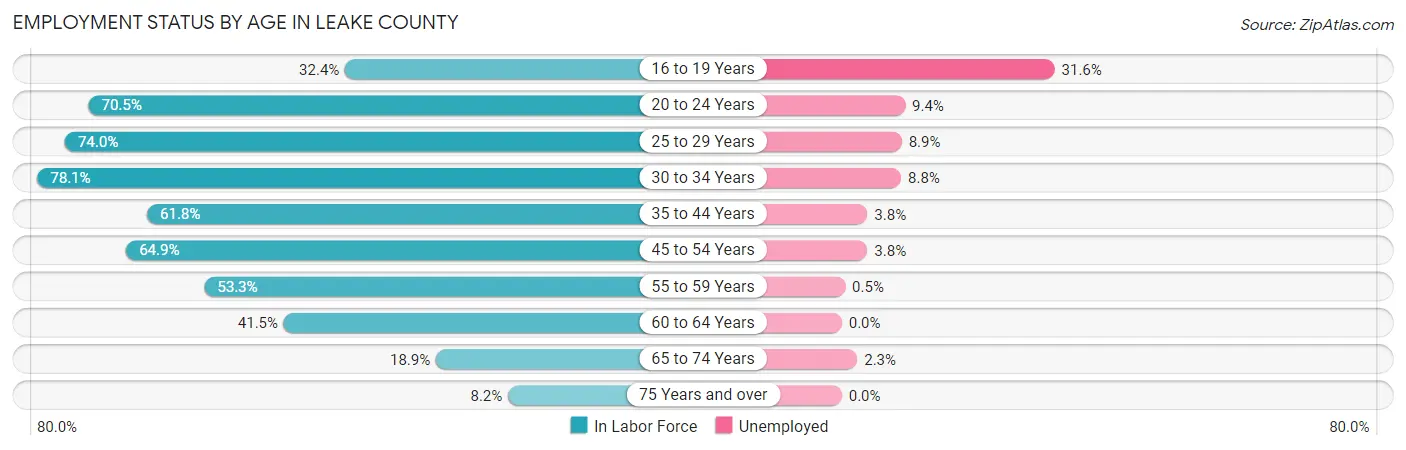
| Age Bracket | In Labor Force | Unemployed |
| 16 to 19 Years | 353 (32.4%) | 112 (31.6%) |
| 20 to 24 Years | 1,048 (70.5%) | 99 (9.4%) |
| 25 to 29 Years | 941 (74.0%) | 84 (8.9%) |
| 30 to 34 Years | 964 (78.1%) | 85 (8.8%) |
| 35 to 44 Years | 1,739 (61.8%) | 66 (3.8%) |
| 45 to 54 Years | 1,731 (64.9%) | 66 (3.8%) |
| 55 to 59 Years | 747 (53.3%) | 4 (0.5%) |
| 60 to 64 Years | 557 (41.5%) | 0 (0.0%) |
| 65 to 74 Years | 429 (18.9%) | 10 (2.3%) |
| 75 Years and over | 120 (8.2%) | 0 (0.0%) |
| Total | 8,623 (50.6%) | 517 (6.0%) |
Employment Status by Educational Attainment in Leake County
According to labor force statistics for Leake County, 62.2% of individuals (6,673) out of the total population between 25 and 64 years of age (10,728) are in the labor force, with 4.5% or 300 of them being unemployed. The group with the highest labor force participation rate are those with the educational attainment of bachelor's degree or higher, with 77.3% or 1,493 individuals in the labor force. Within the labor force, individuals with less than high school education have the highest percentage of unemployment, with 7.6% or 74 of them being unemployed.
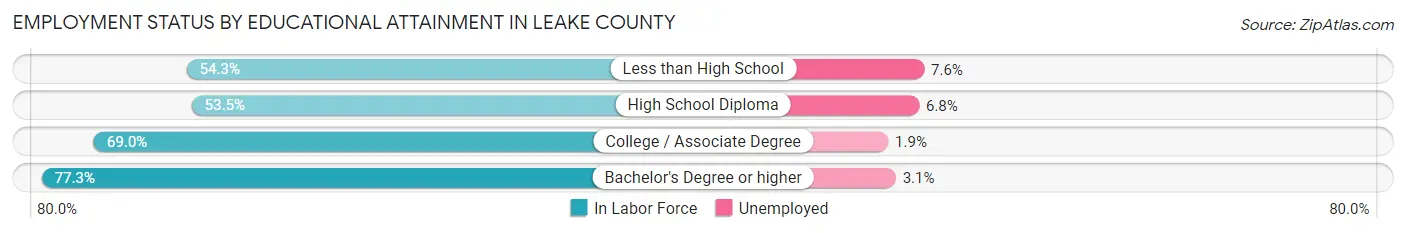
| Educational Attainment | In Labor Force | Unemployed |
| Less than High School | 974 (54.3%) | 136 (7.6%) |
| High School Diploma | 2,146 (53.5%) | 273 (6.8%) |
| College / Associate Degree | 2,064 (69.0%) | 57 (1.9%) |
| Bachelor's Degree or higher | 1,493 (77.3%) | 60 (3.1%) |
| Total | 6,673 (62.2%) | 483 (4.5%) |
Employment Occupations by Sex in Leake County
Management, Business, Science and Arts Occupations
The most common Management, Business, Science and Arts occupations in Leake County are Management (519 | 6.4%), Business & Financial (500 | 6.2%), Community & Social Service (490 | 6.1%), Health Diagnosing & Treating (394 | 4.9%), and Education Instruction & Library (368 | 4.6%).

Management, Business, Science and Arts Occupations by Sex
Within the Management, Business, Science and Arts occupations in Leake County, the most male-oriented occupations are Architecture & Engineering (100.0%), Computers, Engineering & Science (77.2%), and Computers & Mathematics (71.2%), while the most female-oriented occupations are Legal Services & Support (100.0%), Arts, Media & Entertainment (100.0%), and Health Technologists (95.8%).

| Occupation | Male | Female |
| Management | 346 (66.7%) | 173 (33.3%) |
| Business & Financial | 185 (37.0%) | 315 (63.0%) |
| Computers, Engineering & Science | 122 (77.2%) | 36 (22.8%) |
| Computers & Mathematics | 52 (71.2%) | 21 (28.8%) |
| Architecture & Engineering | 36 (100.0%) | 0 (0.0%) |
| Life, Physical & Social Science | 34 (69.4%) | 15 (30.6%) |
| Community & Social Service | 79 (16.1%) | 411 (83.9%) |
| Education, Arts & Media | 56 (51.4%) | 53 (48.6%) |
| Legal Services & Support | 0 (0.0%) | 1 (100.0%) |
| Education Instruction & Library | 23 (6.2%) | 345 (93.8%) |
| Arts, Media & Entertainment | 0 (0.0%) | 12 (100.0%) |
| Health Diagnosing & Treating | 50 (12.7%) | 344 (87.3%) |
| Health Technologists | 9 (4.2%) | 204 (95.8%) |
| Total (Category) | 782 (37.9%) | 1,279 (62.1%) |
| Total (Overall) | 4,235 (52.6%) | 3,821 (47.4%) |
Services Occupations
The most common Services occupations in Leake County are Healthcare Support (621 | 7.7%), Cleaning & Maintenance (377 | 4.7%), Food Preparation & Serving (368 | 4.6%), Security & Protection (159 | 2.0%), and Law Enforcement (137 | 1.7%).

Services Occupations by Sex
Within the Services occupations in Leake County, the most male-oriented occupations are Firefighting & Prevention (100.0%), Cleaning & Maintenance (64.5%), and Food Preparation & Serving (59.5%), while the most female-oriented occupations are Healthcare Support (87.9%), Personal Care & Service (67.1%), and Law Enforcement (51.8%).
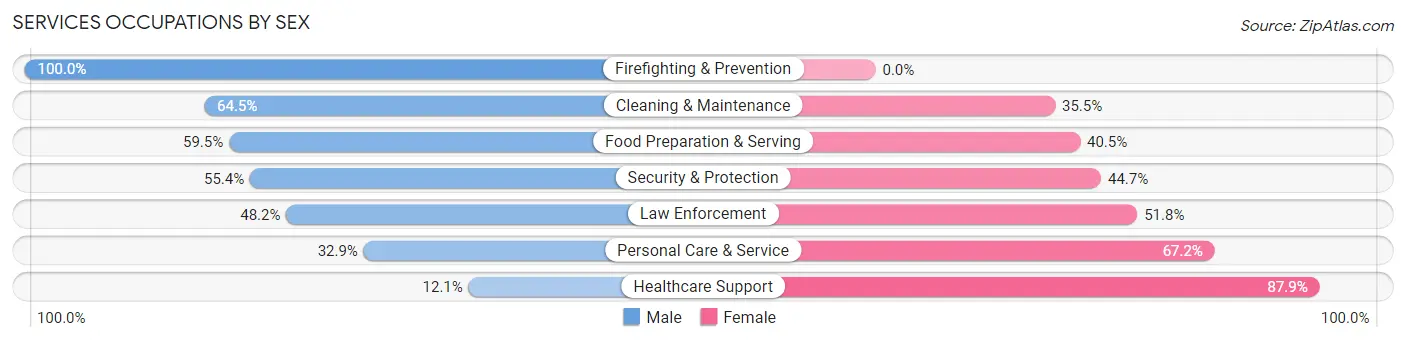
| Occupation | Male | Female |
| Healthcare Support | 75 (12.1%) | 546 (87.9%) |
| Security & Protection | 88 (55.3%) | 71 (44.7%) |
| Firefighting & Prevention | 22 (100.0%) | 0 (0.0%) |
| Law Enforcement | 66 (48.2%) | 71 (51.8%) |
| Food Preparation & Serving | 219 (59.5%) | 149 (40.5%) |
| Cleaning & Maintenance | 243 (64.5%) | 134 (35.5%) |
| Personal Care & Service | 45 (32.9%) | 92 (67.1%) |
| Total (Category) | 670 (40.3%) | 992 (59.7%) |
| Total (Overall) | 4,235 (52.6%) | 3,821 (47.4%) |
Sales and Office Occupations
The most common Sales and Office occupations in Leake County are Office & Administration (890 | 11.1%), and Sales & Related (513 | 6.4%).
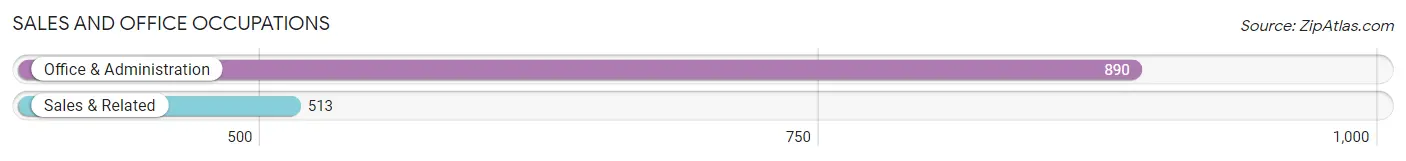
Sales and Office Occupations by Sex

| Occupation | Male | Female |
| Sales & Related | 197 (38.4%) | 316 (61.6%) |
| Office & Administration | 297 (33.4%) | 593 (66.6%) |
| Total (Category) | 494 (35.2%) | 909 (64.8%) |
| Total (Overall) | 4,235 (52.6%) | 3,821 (47.4%) |
Natural Resources, Construction and Maintenance Occupations
The most common Natural Resources, Construction and Maintenance occupations in Leake County are Construction & Extraction (649 | 8.1%), Installation, Maintenance & Repair (467 | 5.8%), and Farming, Fishing & Forestry (117 | 1.5%).

Natural Resources, Construction and Maintenance Occupations by Sex

| Occupation | Male | Female |
| Farming, Fishing & Forestry | 89 (76.1%) | 28 (23.9%) |
| Construction & Extraction | 649 (100.0%) | 0 (0.0%) |
| Installation, Maintenance & Repair | 442 (94.7%) | 25 (5.3%) |
| Total (Category) | 1,180 (95.7%) | 53 (4.3%) |
| Total (Overall) | 4,235 (52.6%) | 3,821 (47.4%) |
Production, Transportation and Moving Occupations
The most common Production, Transportation and Moving occupations in Leake County are Production (906 | 11.3%), Material Moving (424 | 5.3%), and Transportation (367 | 4.6%).

Production, Transportation and Moving Occupations by Sex

| Occupation | Male | Female |
| Production | 379 (41.8%) | 527 (58.2%) |
| Transportation | 360 (98.1%) | 7 (1.9%) |
| Material Moving | 370 (87.3%) | 54 (12.7%) |
| Total (Category) | 1,109 (65.3%) | 588 (34.6%) |
| Total (Overall) | 4,235 (52.6%) | 3,821 (47.4%) |
Employment Industries by Sex in Leake County
Employment Industries in Leake County
The major employment industries in Leake County include Manufacturing (1,571 | 19.5%), Health Care & Social Assistance (1,310 | 16.3%), Retail Trade (814 | 10.1%), Educational Services (560 | 7.0%), and Construction (558 | 6.9%).

Employment Industries by Sex in Leake County
The Leake County industries that see more men than women are Mining, Quarrying, & Extraction (100.0%), Construction (98.4%), and Agriculture, Fishing & Hunting (88.5%), whereas the industries that tend to have a higher number of women are Professional & Scientific (87.5%), Health Care & Social Assistance (85.8%), and Educational Services (83.9%).

| Industry | Male | Female |
| Agriculture, Fishing & Hunting | 232 (88.5%) | 30 (11.5%) |
| Mining, Quarrying, & Extraction | 177 (100.0%) | 0 (0.0%) |
| Construction | 549 (98.4%) | 9 (1.6%) |
| Manufacturing | 1,003 (63.8%) | 568 (36.2%) |
| Wholesale Trade | 26 (57.8%) | 19 (42.2%) |
| Retail Trade | 370 (45.5%) | 444 (54.5%) |
| Transportation & Warehousing | 335 (87.9%) | 46 (12.1%) |
| Utilities | 188 (87.4%) | 27 (12.6%) |
| Information | 55 (68.8%) | 25 (31.2%) |
| Finance & Insurance | 69 (16.5%) | 350 (83.5%) |
| Real Estate, Rental & Leasing | 0 (0.0%) | 0 (0.0%) |
| Professional & Scientific | 14 (12.5%) | 98 (87.5%) |
| Enterprise Management | 0 (0.0%) | 0 (0.0%) |
| Administrative & Support | 166 (64.6%) | 91 (35.4%) |
| Educational Services | 90 (16.1%) | 470 (83.9%) |
| Health Care & Social Assistance | 186 (14.2%) | 1,124 (85.8%) |
| Arts, Entertainment & Recreation | 48 (34.5%) | 91 (65.5%) |
| Accommodation & Food Services | 107 (48.4%) | 114 (51.6%) |
| Public Administration | 195 (49.5%) | 199 (50.5%) |
| Total | 4,235 (52.6%) | 3,821 (47.4%) |
Education in Leake County
School Enrollment in Leake County
The most common levels of schooling among the 4,844 students in Leake County are middle school (1,395 | 28.8%), high school (1,208 | 24.9%), and elementary school (886 | 18.3%).

| School Level | # Students | % Students |
| Nursery / Preschool | 429 | 8.9% |
| Kindergarten | 136 | 2.8% |
| Elementary School | 886 | 18.3% |
| Middle School | 1,395 | 28.8% |
| High School | 1,208 | 24.9% |
| College / Undergraduate | 649 | 13.4% |
| Graduate / Professional | 141 | 2.9% |
| Total | 4,844 | 100.0% |
School Enrollment by Age by Funding Source in Leake County
Out of a total of 4,844 students who are enrolled in schools in Leake County, 1,187 (24.5%) attend a private institution, while the remaining 3,657 (75.5%) are enrolled in public schools. The age group of 35 years and over has the highest likelihood of being enrolled in private schools, with 96 (78.0% in the age bracket) enrolled. Conversely, the age group of 20 to 24 year olds has the lowest likelihood of being enrolled in a private school, with 421 (89.8% in the age bracket) attending a public institution.

| Age Bracket | Public School | Private School |
| 3 to 4 Year Olds | 306 (78.5%) | 84 (21.5%) |
| 5 to 9 Year Old | 834 (85.5%) | 142 (14.5%) |
| 10 to 14 Year Olds | 1,266 (76.7%) | 384 (23.3%) |
| 15 to 17 Year Olds | 412 (54.3%) | 346 (45.7%) |
| 18 to 19 Year Olds | 290 (82.2%) | 63 (17.8%) |
| 20 to 24 Year Olds | 421 (89.8%) | 48 (10.2%) |
| 25 to 34 Year Olds | 103 (82.4%) | 22 (17.6%) |
| 35 Years and over | 27 (22.0%) | 96 (78.0%) |
| Total | 3,657 (75.5%) | 1,187 (24.5%) |
Educational Attainment by Field of Study in Leake County
Education (701 | 27.2%), business (632 | 24.5%), science & technology (427 | 16.6%), liberal arts & history (201 | 7.8%), and arts & humanities (108 | 4.2%) are the most common fields of study among 2,576 individuals in Leake County who have obtained a bachelor's degree or higher.

| Field of Study | # Graduates | % Graduates |
| Computers & Mathematics | 79 | 3.1% |
| Bio, Nature & Agricultural | 76 | 2.9% |
| Physical & Health Sciences | 56 | 2.2% |
| Psychology | 0 | 0.0% |
| Social Sciences | 83 | 3.2% |
| Engineering | 94 | 3.6% |
| Multidisciplinary Studies | 0 | 0.0% |
| Science & Technology | 427 | 16.6% |
| Business | 632 | 24.5% |
| Education | 701 | 27.2% |
| Literature & Languages | 7 | 0.3% |
| Liberal Arts & History | 201 | 7.8% |
| Visual & Performing Arts | 69 | 2.7% |
| Communications | 43 | 1.7% |
| Arts & Humanities | 108 | 4.2% |
| Total | 2,576 | 100.0% |
Transportation & Commute in Leake County
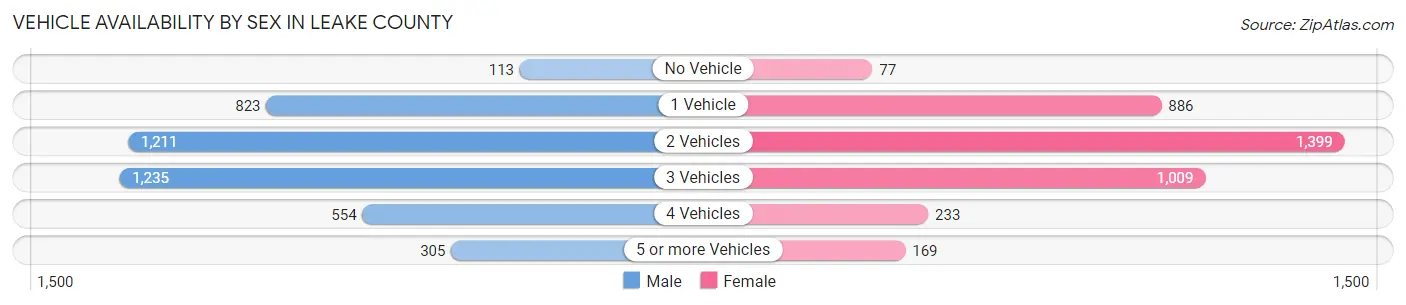
Vehicle Availability by Sex in Leake County
The most prevalent vehicle ownership categories in Leake County are males with 3 vehicles (1,235, accounting for 29.1%) and females with 3 vehicles (1,009, making up 32.7%).
| Vehicles Available | Male | Female |
| No Vehicle | 113 (2.7%) | 77 (2.0%) |
| 1 Vehicle | 823 (19.4%) | 886 (23.5%) |
| 2 Vehicles | 1,211 (28.5%) | 1,399 (37.1%) |
| 3 Vehicles | 1,235 (29.1%) | 1,009 (26.7%) |
| 4 Vehicles | 554 (13.1%) | 233 (6.2%) |
| 5 or more Vehicles | 305 (7.2%) | 169 (4.5%) |
| Total | 4,241 (100.0%) | 3,773 (100.0%) |
Commute Time in Leake County
The most frequently occuring commute durations in Leake County are 10 to 14 minutes (1,217 commuters, 16.0%), 60 to 89 minutes (1,078 commuters, 14.2%), and 15 to 19 minutes (938 commuters, 12.3%).

| Commute Time | # Commuters | % Commuters |
| Less than 5 Minutes | 251 | 3.3% |
| 5 to 9 Minutes | 922 | 12.1% |
| 10 to 14 Minutes | 1,217 | 16.0% |
| 15 to 19 Minutes | 938 | 12.3% |
| 20 to 24 Minutes | 668 | 8.8% |
| 25 to 29 Minutes | 233 | 3.1% |
| 30 to 34 Minutes | 749 | 9.8% |
| 35 to 39 Minutes | 215 | 2.8% |
| 40 to 44 Minutes | 130 | 1.7% |
| 45 to 59 Minutes | 794 | 10.4% |
| 60 to 89 Minutes | 1,078 | 14.2% |
| 90 or more Minutes | 417 | 5.5% |
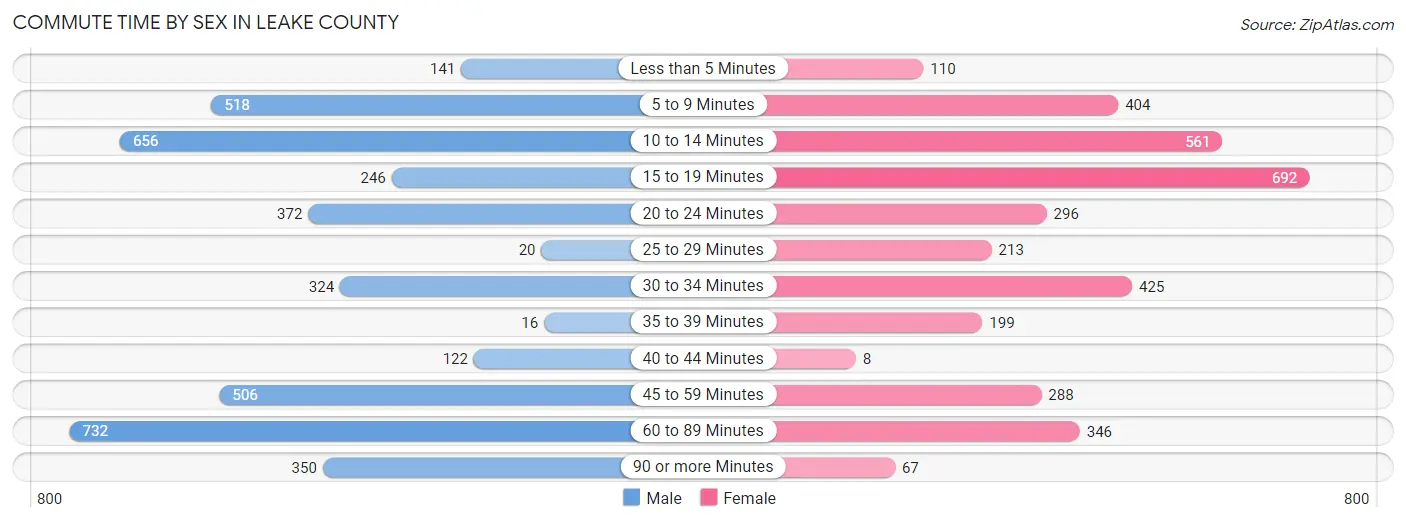
Commute Time by Sex in Leake County
The most common commute times in Leake County are 60 to 89 minutes (732 commuters, 18.3%) for males and 15 to 19 minutes (692 commuters, 19.2%) for females.
| Commute Time | Male | Female |
| Less than 5 Minutes | 141 (3.5%) | 110 (3.0%) |
| 5 to 9 Minutes | 518 (12.9%) | 404 (11.2%) |
| 10 to 14 Minutes | 656 (16.4%) | 561 (15.5%) |
| 15 to 19 Minutes | 246 (6.1%) | 692 (19.2%) |
| 20 to 24 Minutes | 372 (9.3%) | 296 (8.2%) |
| 25 to 29 Minutes | 20 (0.5%) | 213 (5.9%) |
| 30 to 34 Minutes | 324 (8.1%) | 425 (11.8%) |
| 35 to 39 Minutes | 16 (0.4%) | 199 (5.5%) |
| 40 to 44 Minutes | 122 (3.0%) | 8 (0.2%) |
| 45 to 59 Minutes | 506 (12.6%) | 288 (8.0%) |
| 60 to 89 Minutes | 732 (18.3%) | 346 (9.6%) |
| 90 or more Minutes | 350 (8.7%) | 67 (1.9%) |
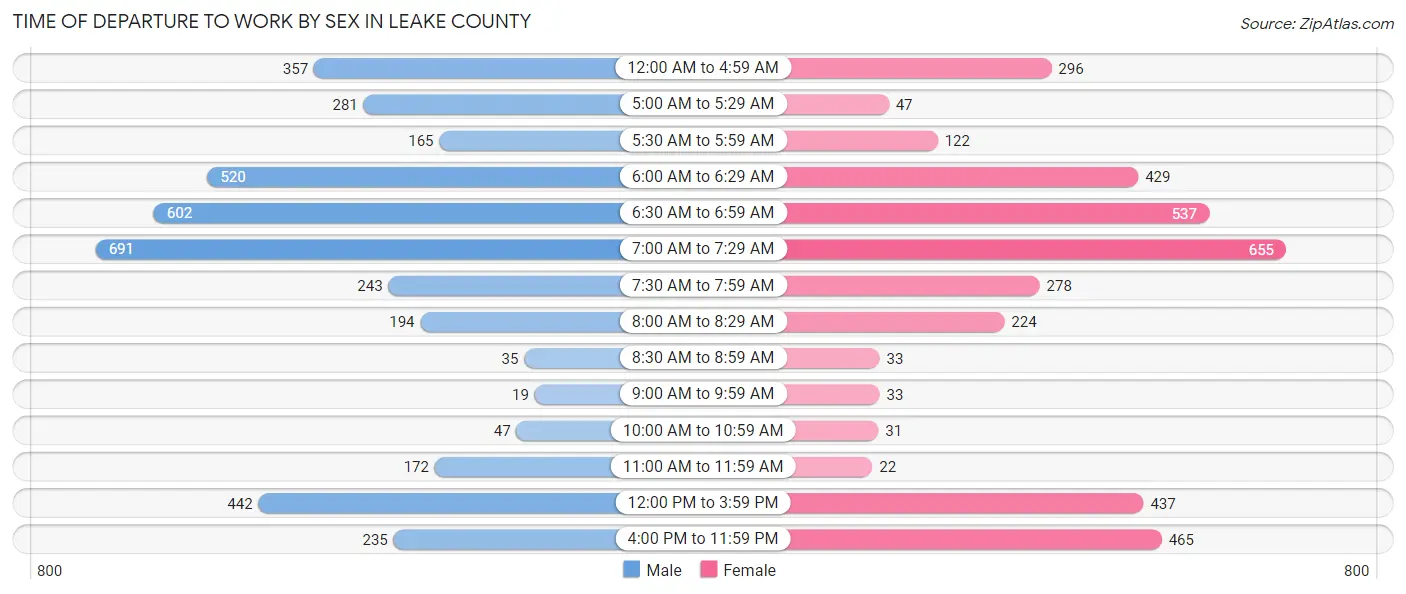
Time of Departure to Work by Sex in Leake County
The most frequent times of departure to work in Leake County are 7:00 AM to 7:29 AM (691, 17.3%) for males and 7:00 AM to 7:29 AM (655, 18.1%) for females.
| Time of Departure | Male | Female |
| 12:00 AM to 4:59 AM | 357 (8.9%) | 296 (8.2%) |
| 5:00 AM to 5:29 AM | 281 (7.0%) | 47 (1.3%) |
| 5:30 AM to 5:59 AM | 165 (4.1%) | 122 (3.4%) |
| 6:00 AM to 6:29 AM | 520 (13.0%) | 429 (11.9%) |
| 6:30 AM to 6:59 AM | 602 (15.0%) | 537 (14.9%) |
| 7:00 AM to 7:29 AM | 691 (17.3%) | 655 (18.1%) |
| 7:30 AM to 7:59 AM | 243 (6.1%) | 278 (7.7%) |
| 8:00 AM to 8:29 AM | 194 (4.9%) | 224 (6.2%) |
| 8:30 AM to 8:59 AM | 35 (0.9%) | 33 (0.9%) |
| 9:00 AM to 9:59 AM | 19 (0.5%) | 33 (0.9%) |
| 10:00 AM to 10:59 AM | 47 (1.2%) | 31 (0.9%) |
| 11:00 AM to 11:59 AM | 172 (4.3%) | 22 (0.6%) |
| 12:00 PM to 3:59 PM | 442 (11.0%) | 437 (12.1%) |
| 4:00 PM to 11:59 PM | 235 (5.9%) | 465 (12.9%) |
| Total | 4,003 (100.0%) | 3,609 (100.0%) |
Housing Occupancy in Leake County
Occupancy by Ownership in Leake County
Of the total 7,369 dwellings in Leake County, owner-occupied units account for 5,601 (76.0%), while renter-occupied units make up 1,768 (24.0%).

| Occupancy | # Housing Units | % Housing Units |
| Owner Occupied Housing Units | 5,601 | 76.0% |
| Renter-Occupied Housing Units | 1,768 | 24.0% |
| Total Occupied Housing Units | 7,369 | 100.0% |
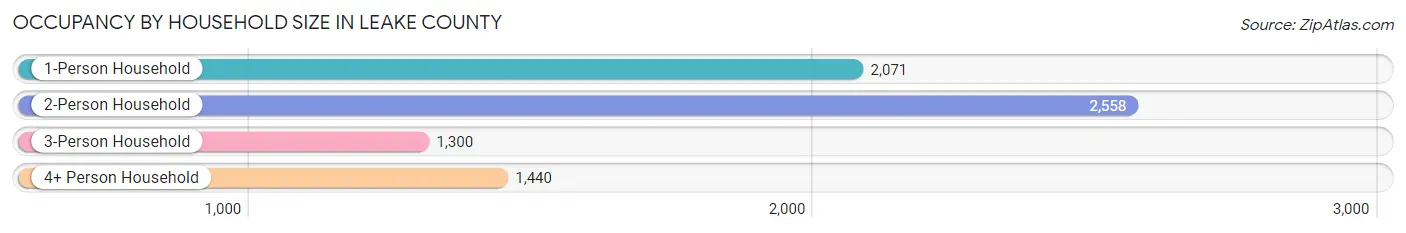
Occupancy by Household Size in Leake County
| Household Size | # Housing Units | % Housing Units |
| 1-Person Household | 2,071 | 28.1% |
| 2-Person Household | 2,558 | 34.7% |
| 3-Person Household | 1,300 | 17.6% |
| 4+ Person Household | 1,440 | 19.5% |
| Total Housing Units | 7,369 | 100.0% |
Occupancy by Ownership by Household Size in Leake County
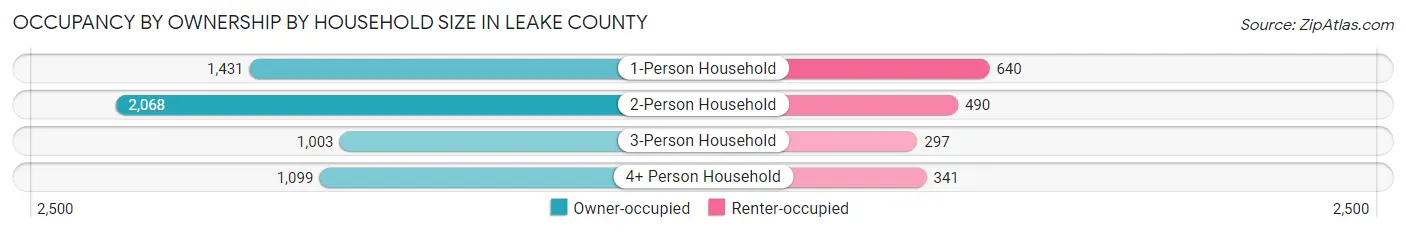
| Household Size | Owner-occupied | Renter-occupied |
| 1-Person Household | 1,431 (69.1%) | 640 (30.9%) |
| 2-Person Household | 2,068 (80.8%) | 490 (19.2%) |
| 3-Person Household | 1,003 (77.1%) | 297 (22.9%) |
| 4+ Person Household | 1,099 (76.3%) | 341 (23.7%) |
| Total Housing Units | 5,601 (76.0%) | 1,768 (24.0%) |
Occupancy by Educational Attainment in Leake County

| Household Size | Owner-occupied | Renter-occupied |
| Less than High School | 995 (76.5%) | 305 (23.5%) |
| High School Diploma | 1,696 (70.5%) | 709 (29.5%) |
| College/Associate Degree | 1,890 (77.5%) | 550 (22.5%) |
| Bachelor's Degree or higher | 1,020 (83.3%) | 204 (16.7%) |
Occupancy by Age of Householder in Leake County

| Age Bracket | # Households | % Households |
| Under 35 Years | 1,147 | 15.6% |
| 35 to 44 Years | 988 | 13.4% |
| 45 to 54 Years | 1,140 | 15.5% |
| 55 to 64 Years | 1,638 | 22.2% |
| 65 to 74 Years | 1,477 | 20.0% |
| 75 to 84 Years | 719 | 9.8% |
| 85 Years and Over | 260 | 3.5% |
| Total | 7,369 | 100.0% |
Housing Finances in Leake County
Median Income by Occupancy in Leake County

| Occupancy Type | # Households | Median Income |
| Owner-Occupied | 5,601 (76.0%) | $53,585 |
| Renter-Occupied | 1,768 (24.0%) | $28,750 |
| Average | 7,369 (100.0%) | $46,669 |
Occupancy by Householder Income Bracket in Leake County

| Income Bracket | Owner-occupied | Renter-occupied |
| Less than $5,000 | 142 (2.5%) | 144 (8.1%) |
| $5,000 to $9,999 | 117 (2.1%) | 187 (10.6%) |
| $10,000 to $14,999 | 255 (4.5%) | 221 (12.5%) |
| $15,000 to $19,999 | 432 (7.7%) | 28 (1.6%) |
| $20,000 to $24,999 | 393 (7.0%) | 188 (10.6%) |
| $25,000 to $34,999 | 527 (9.4%) | 274 (15.5%) |
| $35,000 to $49,999 | 765 (13.7%) | 395 (22.3%) |
| $50,000 to $74,999 | 999 (17.8%) | 195 (11.0%) |
| $75,000 to $99,999 | 844 (15.1%) | 95 (5.4%) |
| $100,000 to $149,999 | 723 (12.9%) | 15 (0.9%) |
| $150,000 or more | 404 (7.2%) | 26 (1.5%) |
| Total | 5,601 (100.0%) | 1,768 (100.0%) |
Monthly Housing Cost Tiers in Leake County
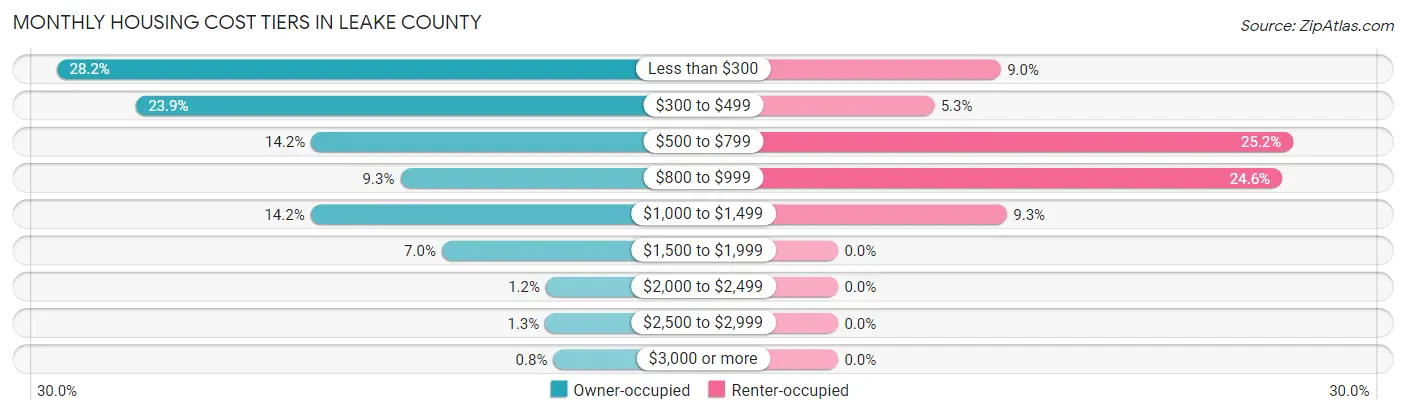
| Monthly Cost | Owner-occupied | Renter-occupied |
| Less than $300 | 1,582 (28.2%) | 159 (9.0%) |
| $300 to $499 | 1,338 (23.9%) | 94 (5.3%) |
| $500 to $799 | 794 (14.2%) | 445 (25.2%) |
| $800 to $999 | 518 (9.2%) | 434 (24.5%) |
| $1,000 to $1,499 | 796 (14.2%) | 165 (9.3%) |
| $1,500 to $1,999 | 390 (7.0%) | 0 (0.0%) |
| $2,000 to $2,499 | 68 (1.2%) | 0 (0.0%) |
| $2,500 to $2,999 | 70 (1.3%) | 0 (0.0%) |
| $3,000 or more | 45 (0.8%) | 0 (0.0%) |
| Total | 5,601 (100.0%) | 1,768 (100.0%) |
Physical Housing Characteristics in Leake County
Housing Structures in Leake County

| Structure Type | # Housing Units | % Housing Units |
| Single Unit, Detached | 5,056 | 68.6% |
| Single Unit, Attached | 61 | 0.8% |
| 2 Unit Apartments | 106 | 1.4% |
| 3 or 4 Unit Apartments | 159 | 2.2% |
| 5 to 9 Unit Apartments | 153 | 2.1% |
| 10 or more Apartments | 86 | 1.2% |
| Mobile Home / Other | 1,748 | 23.7% |
| Total | 7,369 | 100.0% |
Housing Structures by Occupancy in Leake County

| Structure Type | Owner-occupied | Renter-occupied |
| Single Unit, Detached | 4,368 (86.4%) | 688 (13.6%) |
| Single Unit, Attached | 29 (47.5%) | 32 (52.5%) |
| 2 Unit Apartments | 12 (11.3%) | 94 (88.7%) |
| 3 or 4 Unit Apartments | 2 (1.3%) | 157 (98.7%) |
| 5 to 9 Unit Apartments | 0 (0.0%) | 153 (100.0%) |
| 10 or more Apartments | 0 (0.0%) | 86 (100.0%) |
| Mobile Home / Other | 1,190 (68.1%) | 558 (31.9%) |
| Total | 5,601 (76.0%) | 1,768 (24.0%) |
Housing Structures by Number of Rooms in Leake County

| Number of Rooms | Owner-occupied | Renter-occupied |
| 1 Room | 9 (0.2%) | 115 (6.5%) |
| 2 or 3 Rooms | 285 (5.1%) | 207 (11.7%) |
| 4 or 5 Rooms | 1,774 (31.7%) | 907 (51.3%) |
| 6 or 7 Rooms | 2,416 (43.1%) | 446 (25.2%) |
| 8 or more Rooms | 1,117 (19.9%) | 93 (5.3%) |
| Total | 5,601 (100.0%) | 1,768 (100.0%) |
Housing Structure by Heating Type in Leake County
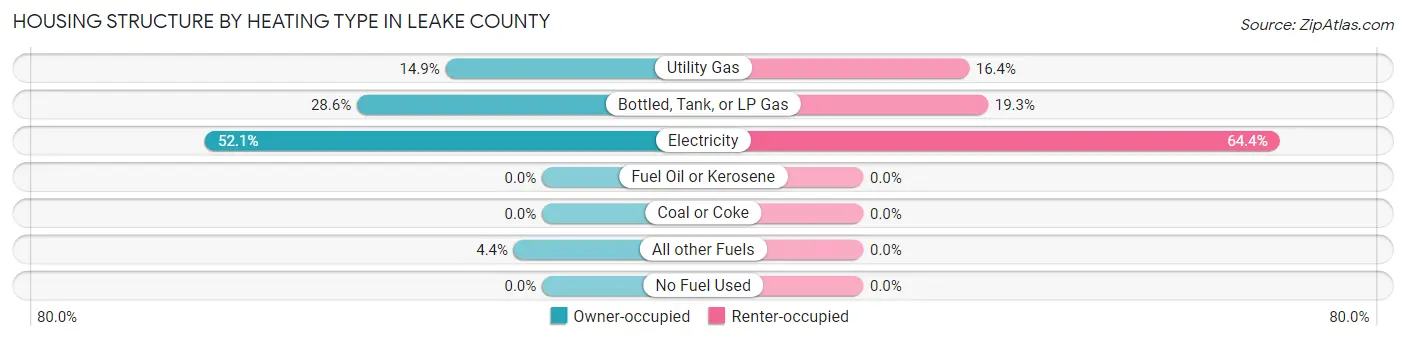
| Heating Type | Owner-occupied | Renter-occupied |
| Utility Gas | 836 (14.9%) | 289 (16.4%) |
| Bottled, Tank, or LP Gas | 1,603 (28.6%) | 341 (19.3%) |
| Electricity | 2,918 (52.1%) | 1,138 (64.4%) |
| Fuel Oil or Kerosene | 0 (0.0%) | 0 (0.0%) |
| Coal or Coke | 0 (0.0%) | 0 (0.0%) |
| All other Fuels | 244 (4.4%) | 0 (0.0%) |
| No Fuel Used | 0 (0.0%) | 0 (0.0%) |
| Total | 5,601 (100.0%) | 1,768 (100.0%) |
Household Vehicle Usage in Leake County

| Vehicles per Household | Owner-occupied | Renter-occupied |
| No Vehicle | 343 (6.1%) | 314 (17.8%) |
| 1 Vehicle | 1,395 (24.9%) | 718 (40.6%) |
| 2 Vehicles | 1,823 (32.6%) | 591 (33.4%) |
| 3 or more Vehicles | 2,040 (36.4%) | 145 (8.2%) |
| Total | 5,601 (100.0%) | 1,768 (100.0%) |
Real Estate & Mortgages in Leake County
Real Estate and Mortgage Overview in Leake County
| Characteristic | Without Mortgage | With Mortgage |
| Housing Units | 3,664 | 1,937 |
| Median Property Value | $87,600 | $139,300 |
| Median Household Income | $39,848 | $252 |
| Monthly Housing Costs | $339 | $45 |
| Real Estate Taxes | $557 | $512 |
Property Value by Mortgage Status in Leake County
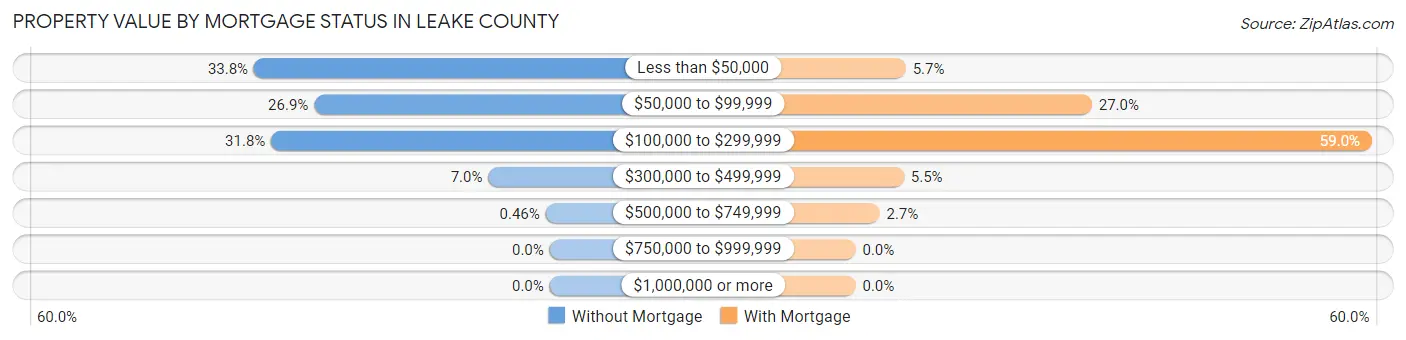
| Property Value | Without Mortgage | With Mortgage |
| Less than $50,000 | 1,238 (33.8%) | 111 (5.7%) |
| $50,000 to $99,999 | 986 (26.9%) | 523 (27.0%) |
| $100,000 to $299,999 | 1,166 (31.8%) | 1,143 (59.0%) |
| $300,000 to $499,999 | 257 (7.0%) | 107 (5.5%) |
| $500,000 to $749,999 | 17 (0.5%) | 53 (2.7%) |
| $750,000 to $999,999 | 0 (0.0%) | 0 (0.0%) |
| $1,000,000 or more | 0 (0.0%) | 0 (0.0%) |
| Total | 3,664 (100.0%) | 1,937 (100.0%) |
Household Income by Mortgage Status in Leake County

| Household Income | Without Mortgage | With Mortgage |
| Less than $10,000 | 247 (6.7%) | 28 (1.5%) |
| $10,000 to $24,999 | 866 (23.6%) | 12 (0.6%) |
| $25,000 to $34,999 | 441 (12.0%) | 214 (11.1%) |
| $35,000 to $49,999 | 591 (16.1%) | 86 (4.4%) |
| $50,000 to $74,999 | 617 (16.8%) | 174 (9.0%) |
| $75,000 to $99,999 | 421 (11.5%) | 382 (19.7%) |
| $100,000 to $149,999 | 329 (9.0%) | 423 (21.8%) |
| $150,000 or more | 152 (4.2%) | 394 (20.3%) |
| Total | 3,664 (100.0%) | 1,937 (100.0%) |
Property Value to Household Income Ratio in Leake County

| Value-to-Income Ratio | Without Mortgage | With Mortgage |
| Less than 2.0x | 1,915 (52.3%) | 78,937 (4,075.2%) |
| 2.0x to 2.9x | 559 (15.3%) | 976 (50.4%) |
| 3.0x to 3.9x | 309 (8.4%) | 550 (28.4%) |
| 4.0x or more | 873 (23.8%) | 271 (14.0%) |
| Total | 3,664 (100.0%) | 1,937 (100.0%) |
Real Estate Taxes by Mortgage Status in Leake County
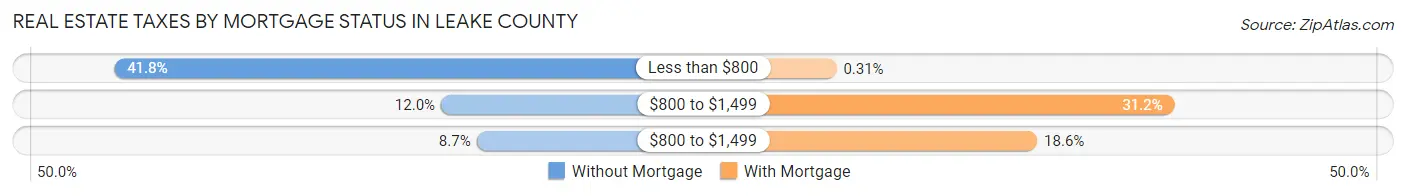
| Property Taxes | Without Mortgage | With Mortgage |
| Less than $800 | 1,532 (41.8%) | 6 (0.3%) |
| $800 to $1,499 | 439 (12.0%) | 604 (31.2%) |
| $800 to $1,499 | 320 (8.7%) | 361 (18.6%) |
| Total | 3,664 (100.0%) | 1,937 (100.0%) |
Health & Disability in Leake County
Health Insurance Coverage by Age in Leake County
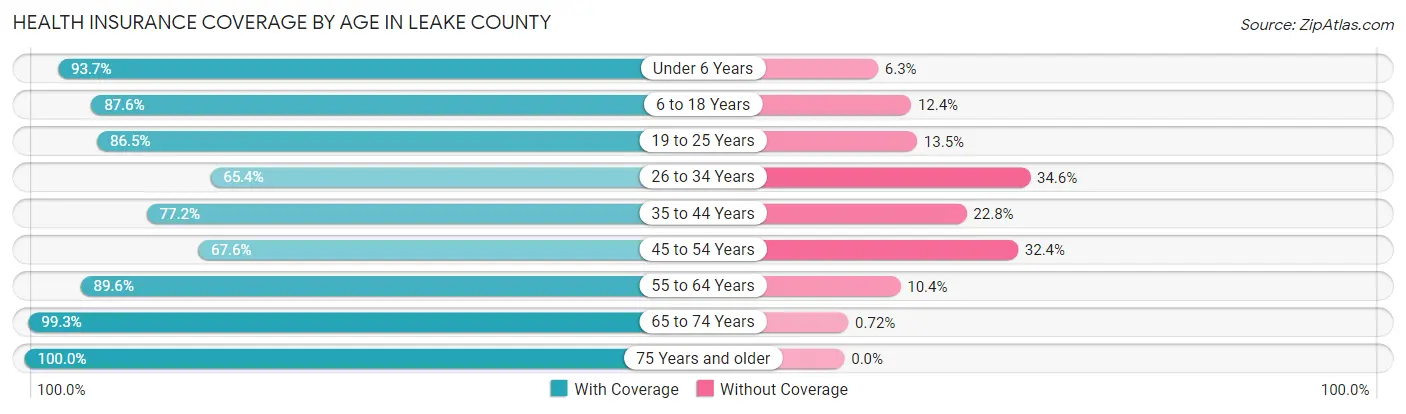
| Age Bracket | With Coverage | Without Coverage |
| Under 6 Years | 1,423 (93.7%) | 95 (6.3%) |
| 6 to 18 Years | 3,177 (87.6%) | 451 (12.4%) |
| 19 to 25 Years | 1,616 (86.5%) | 253 (13.5%) |
| 26 to 34 Years | 1,402 (65.4%) | 743 (34.6%) |
| 35 to 44 Years | 2,103 (77.2%) | 620 (22.8%) |
| 45 to 54 Years | 1,780 (67.6%) | 852 (32.4%) |
| 55 to 64 Years | 2,437 (89.6%) | 284 (10.4%) |
| 65 to 74 Years | 2,206 (99.3%) | 16 (0.7%) |
| 75 Years and older | 1,351 (100.0%) | 0 (0.0%) |
| Total | 17,495 (84.1%) | 3,314 (15.9%) |
Health Insurance Coverage by Citizenship Status in Leake County

| Citizenship Status | With Coverage | Without Coverage |
| Native Born | 1,423 (93.7%) | 95 (6.3%) |
| Foreign Born, Citizen | 3,177 (87.6%) | 451 (12.4%) |
| Foreign Born, not a Citizen | 1,616 (86.5%) | 253 (13.5%) |
Health Insurance Coverage by Household Income in Leake County

| Household Income | With Coverage | Without Coverage |
| Under $25,000 | 3,319 (75.2%) | 1,092 (24.8%) |
| $25,000 to $49,999 | 4,247 (84.9%) | 755 (15.1%) |
| $50,000 to $74,999 | 3,539 (83.9%) | 680 (16.1%) |
| $75,000 to $99,999 | 2,274 (81.1%) | 531 (18.9%) |
| $100,000 and over | 4,116 (94.1%) | 256 (5.9%) |
Public vs Private Health Insurance Coverage by Age in Leake County

| Age Bracket | Public Insurance | Private Insurance |
| Under 6 | 1,067 (70.3%) | 399 (26.3%) |
| 6 to 18 Years | 2,270 (62.6%) | 998 (27.5%) |
| 19 to 25 Years | 398 (21.3%) | 1,311 (70.1%) |
| 25 to 34 Years | 323 (15.1%) | 1,115 (52.0%) |
| 35 to 44 Years | 520 (19.1%) | 1,685 (61.9%) |
| 45 to 54 Years | 444 (16.9%) | 1,461 (55.5%) |
| 55 to 64 Years | 1,062 (39.0%) | 1,661 (61.0%) |
| 65 to 74 Years | 2,101 (94.6%) | 954 (42.9%) |
| 75 Years and over | 1,351 (100.0%) | 656 (48.6%) |
| Total | 9,536 (45.8%) | 10,240 (49.2%) |
Disability Status by Sex by Age in Leake County

| Age Bracket | Male | Female |
| Under 5 Years | 0 (0.0%) | 0 (0.0%) |
| 5 to 17 Years | 173 (9.4%) | 90 (5.2%) |
| 18 to 34 Years | 233 (11.2%) | 337 (15.4%) |
| 35 to 64 Years | 1,008 (25.5%) | 1,026 (24.9%) |
| 65 to 74 Years | 618 (60.2%) | 452 (37.8%) |
| 75 Years and over | 345 (63.1%) | 563 (70.0%) |
Disability Class by Sex by Age in Leake County
Disability Class: Hearing Difficulty
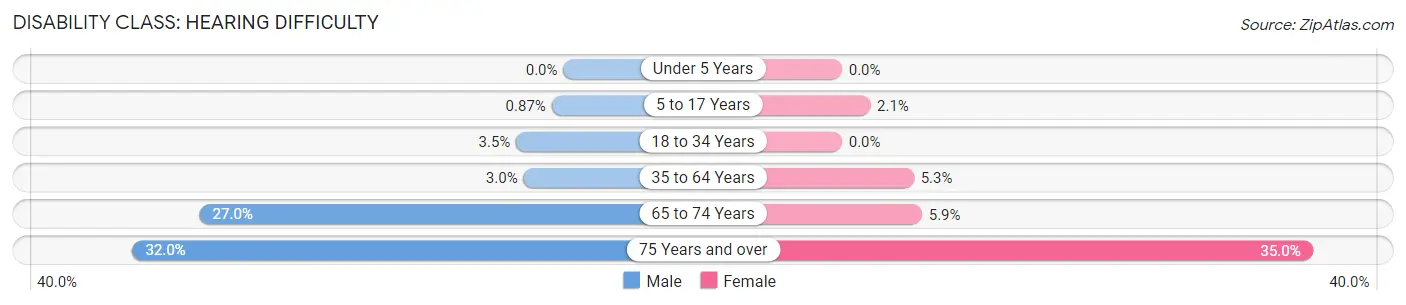
| Age Bracket | Male | Female |
| Under 5 Years | 0 (0.0%) | 0 (0.0%) |
| 5 to 17 Years | 16 (0.9%) | 36 (2.1%) |
| 18 to 34 Years | 73 (3.5%) | 0 (0.0%) |
| 35 to 64 Years | 117 (3.0%) | 220 (5.3%) |
| 65 to 74 Years | 277 (27.0%) | 71 (5.9%) |
| 75 Years and over | 175 (32.0%) | 281 (34.9%) |
Disability Class: Vision Difficulty

| Age Bracket | Male | Female |
| Under 5 Years | 0 (0.0%) | 0 (0.0%) |
| 5 to 17 Years | 38 (2.1%) | 0 (0.0%) |
| 18 to 34 Years | 14 (0.7%) | 200 (9.2%) |
| 35 to 64 Years | 239 (6.0%) | 188 (4.6%) |
| 65 to 74 Years | 189 (18.4%) | 112 (9.4%) |
| 75 Years and over | 96 (17.5%) | 124 (15.4%) |
Disability Class: Cognitive Difficulty

| Age Bracket | Male | Female |
| 5 to 17 Years | 121 (6.6%) | 84 (4.9%) |
| 18 to 34 Years | 181 (8.7%) | 168 (7.7%) |
| 35 to 64 Years | 439 (11.1%) | 328 (8.0%) |
| 65 to 74 Years | 252 (24.6%) | 125 (10.4%) |
| 75 Years and over | 49 (9.0%) | 229 (28.5%) |
Disability Class: Ambulatory Difficulty

| Age Bracket | Male | Female |
| 5 to 17 Years | 0 (0.0%) | 15 (0.9%) |
| 18 to 34 Years | 23 (1.1%) | 0 (0.0%) |
| 35 to 64 Years | 797 (20.2%) | 765 (18.6%) |
| 65 to 74 Years | 422 (41.1%) | 375 (31.4%) |
| 75 Years and over | 282 (51.5%) | 460 (57.2%) |
Disability Class: Self-Care Difficulty

| Age Bracket | Male | Female |
| 5 to 17 Years | 4 (0.2%) | 18 (1.1%) |
| 18 to 34 Years | 0 (0.0%) | 11 (0.5%) |
| 35 to 64 Years | 291 (7.4%) | 195 (4.7%) |
| 65 to 74 Years | 136 (13.3%) | 38 (3.2%) |
| 75 Years and over | 142 (26.0%) | 150 (18.7%) |
Technology Access in Leake County
Computing Device Access in Leake County

| Device Type | # Households | % Households |
| Desktop or Laptop | 3,379 | 45.9% |
| Smartphone | 5,926 | 80.4% |
| Tablet | 2,825 | 38.3% |
| No Computing Device | 1,181 | 16.0% |
| Total | 7,369 | 100.0% |
Internet Access in Leake County

| Internet Type | # Households | % Households |
| Dial-Up Internet | 38 | 0.5% |
| Broadband Home | 2,300 | 31.2% |
| Cellular Data Only | 2,156 | 29.3% |
| Satellite Internet | 1,145 | 15.5% |
| No Internet | 2,140 | 29.0% |
| Total | 7,369 | 100.0% |
Leake County Summary
Leake County is located in the central part of Mississippi, in the United States. It is bordered by Attala, Neshoba, Newton, Scott, and Winston counties. The county seat is Carthage, and the county has a total area of 576 square miles.
History
Leake County was established in 1833 and named for Walter Leake, the third governor of Mississippi. The county was originally part of the Choctaw Nation, and the area was home to the Choctaw people for centuries before the arrival of European settlers. The county was part of the Natchez District until 1836, when it became part of the newly formed Winston County. In 1871, Leake County was officially established.
The county was largely agricultural in the 19th century, with cotton being the main crop. The county was also home to several sawmills and gristmills. The county seat of Carthage was established in 1834, and the town quickly became a center of commerce and industry.
Geography
Leake County is located in the central part of Mississippi, in the United States. It is bordered by Attala, Neshoba, Newton, Scott, and Winston counties. The county has a total area of 576 square miles, of which 574 square miles is land and 2 square miles is water. The county is mostly flat, with some rolling hills in the northern part. The Pearl River runs through the county, and there are several small creeks and streams.
The county is home to several state parks, including Nanih Waiya State Park, which is located in the northern part of the county. The park is home to a large mound that is believed to be the birthplace of the Choctaw people.
Economy
Leake County has a largely agricultural economy, with cotton being the main crop. Other crops grown in the county include corn, soybeans, and wheat. The county is also home to several sawmills and gristmills.
The county is home to several manufacturing companies, including a furniture factory, a textile mill, and a paper mill. The county is also home to several retail stores, restaurants, and other businesses.
Demographics
As of the 2010 census, the population of Leake County was 23,805. The population is largely rural, with most of the population living in small towns and villages. The racial makeup of the county is 79.3% White, 18.7% African American, 0.3% Native American, 0.2% Asian, 0.1% Pacific Islander, 0.7% from other races, and 0.9% from two or more races.
The median household income in the county is $33,945, and the median family income is $41,945. The per capita income in the county is $17,845. The unemployment rate in the county is 8.2%.
Leake County is served by the Leake County School District, which consists of seven elementary schools, two middle schools, and two high schools. The county is also home to several private schools. The county is served by the Leake County Library System, which consists of four branches.
Common Questions
What is the Total Population of Leake County?
Total Population of Leake County is 21,335.
What is the Total Male Population of Leake County?
Total Male Population of Leake County is 10,586.
What is the Total Female Population of Leake County?
Total Female Population of Leake County is 10,749.
What is the Ratio of Males per 100 Females in Leake County?
There are 98.48 Males per 100 Females in Leake County.
What is the Ratio of Females per 100 Males in Leake County?
There are 101.54 Females per 100 Males in Leake County.
What is the Median Population Age in Leake County?
Median Population Age in Leake County is 40.5 Years.
What is the Average Family Size in Leake County
Average Family Size in Leake County is 3.5 People.
What is the Average Household Size in Leake County
Average Household Size in Leake County is 2.8 People.
What is Per Capita Income in Leake County?
Per Capita income in Leake County is $25,662.
What is the Median Family Income in Leake County?
Median Family Income in Leake County is $56,044.
What is the Median Household income in Leake County?
Median Household Income in Leake County is $46,669.
What is Income or Wage Gap in Leake County?
Income or Wage Gap in Leake County is 31.1%.
Women in Leake County earn 68.9 cents for every dollar earned by a man.
What is Inequality or Gini Index in Leake County?
Inequality or Gini Index in Leake County is 0.50.
How Large is the Labor Force in Leake County?
There are 8,623 People in the Labor Forcein in Leake County.
What is the Percentage of People in the Labor Force in Leake County?
50.6% of People are in the Labor Force in Leake County.
What is the Unemployment Rate in Leake County?
Unemployment Rate in Leake County is 6.0%.