Lawrence County, MS
Lawrence County Map

Lawrence County Overview
11,933
TOTAL POPULATION
5,840
MALE POPULATION
6,093
FEMALE POPULATION
95.85
MALES / 100 FEMALES
104.33
FEMALES / 100 MALES
41.1
MEDIAN AGE
3.4
AVG FAMILY SIZE
2.7
AVG HOUSEHOLD SIZE
$24,809
PER CAPITA INCOME
$52,156
AVG FAMILY INCOME
$41,096
AVG HOUSEHOLD INCOME
36.7%
WAGE / INCOME GAP [ % ]
63.3¢/ $1
WAGE / INCOME GAP [ $ ]
0.46
INEQUALITY / GINI INDEX
4,616
LABOR FORCE [ PEOPLE ]
50.0%
PERCENT IN LABOR FORCE
12.0%
UNEMPLOYMENT RATE
Race in Lawrence County
The most populous races in Lawrence County are White / Caucasian (7,656 | 64.2%), Black / African American (3,755 | 31.5%), and Hispanic or Latino (281 | 2.4%).

| Race | # Population | % Population |
| Asian | 25 | 0.2% |
| Black / African American | 3,755 | 31.5% |
| Hawaiian / Pacific | 0 | 0.0% |
| Hispanic or Latino | 281 | 2.4% |
| Native / Alaskan | 40 | 0.3% |
| White / Caucasian | 7,656 | 64.2% |
| Two or more Races | 221 | 1.8% |
| Some other Race | 236 | 2.0% |
| Total | 11,933 | 100.0% |
Ancestry in Lawrence County
The most populous ancestries reported in Lawrence County are English (972 | 8.2%), American (721 | 6.0%), Irish (655 | 5.5%), German (350 | 2.9%), and European (286 | 2.4%), together accounting for 25.0% of all Lawrence County residents.

| Ancestry | # Population | % Population |
| African | 54 | 0.4% |
| American | 721 | 6.0% |
| Apache | 20 | 0.2% |
| British | 9 | 0.1% |
| Central American | 25 | 0.2% |
| Cherokee | 54 | 0.4% |
| Chickasaw | 3 | 0.0% |
| Choctaw | 33 | 0.3% |
| Creek | 15 | 0.1% |
| Cuban | 4 | 0.0% |
| Dutch | 15 | 0.1% |
| Eastern European | 1 | 0.0% |
| English | 972 | 8.2% |
| European | 286 | 2.4% |
| French | 274 | 2.3% |
| French Canadian | 7 | 0.1% |
| German | 350 | 2.9% |
| Honduran | 8 | 0.1% |
| Houma | 3 | 0.0% |
| Indonesian | 18 | 0.2% |
| Irish | 655 | 5.5% |
| Italian | 66 | 0.5% |
| Mexican | 231 | 1.9% |
| Norwegian | 90 | 0.7% |
| Polish | 8 | 0.1% |
| Salvadoran | 17 | 0.1% |
| Scandinavian | 1 | 0.0% |
| Scotch-Irish | 163 | 1.4% |
| Scottish | 96 | 0.8% |
| Serbian | 10 | 0.1% |
| Spanish | 21 | 0.2% |
| Subsaharan African | 54 | 0.4% |
| Swedish | 10 | 0.1% |
| Thai | 7 | 0.1% |
| Welsh | 14 | 0.1% | View All 35 Rows |
Immigrants in Lawrence County
The most numerous immigrant groups reported in Lawrence County came from Central America (46 | 0.4%), Latin America (46 | 0.4%), Mexico (46 | 0.4%), Europe (29 | 0.2%), and Northern Europe (19 | 0.2%), together accounting for 1.6% of all Lawrence County residents.

| Immigration Origin | # Population | % Population |
| Asia | 7 | 0.1% |
| Central America | 46 | 0.4% |
| Denmark | 18 | 0.2% |
| Eastern Asia | 7 | 0.1% |
| Eastern Europe | 10 | 0.1% |
| Europe | 29 | 0.2% |
| Korea | 7 | 0.1% |
| Latin America | 46 | 0.4% |
| Mexico | 46 | 0.4% |
| Northern Europe | 19 | 0.2% |
| Serbia | 10 | 0.1% | View All 11 Rows |
Sex and Age in Lawrence County
Sex and Age in Lawrence County
The most populous age groups in Lawrence County are 45 to 49 Years (470 | 8.1%) for men and 15 to 19 Years (543 | 8.9%) for women.
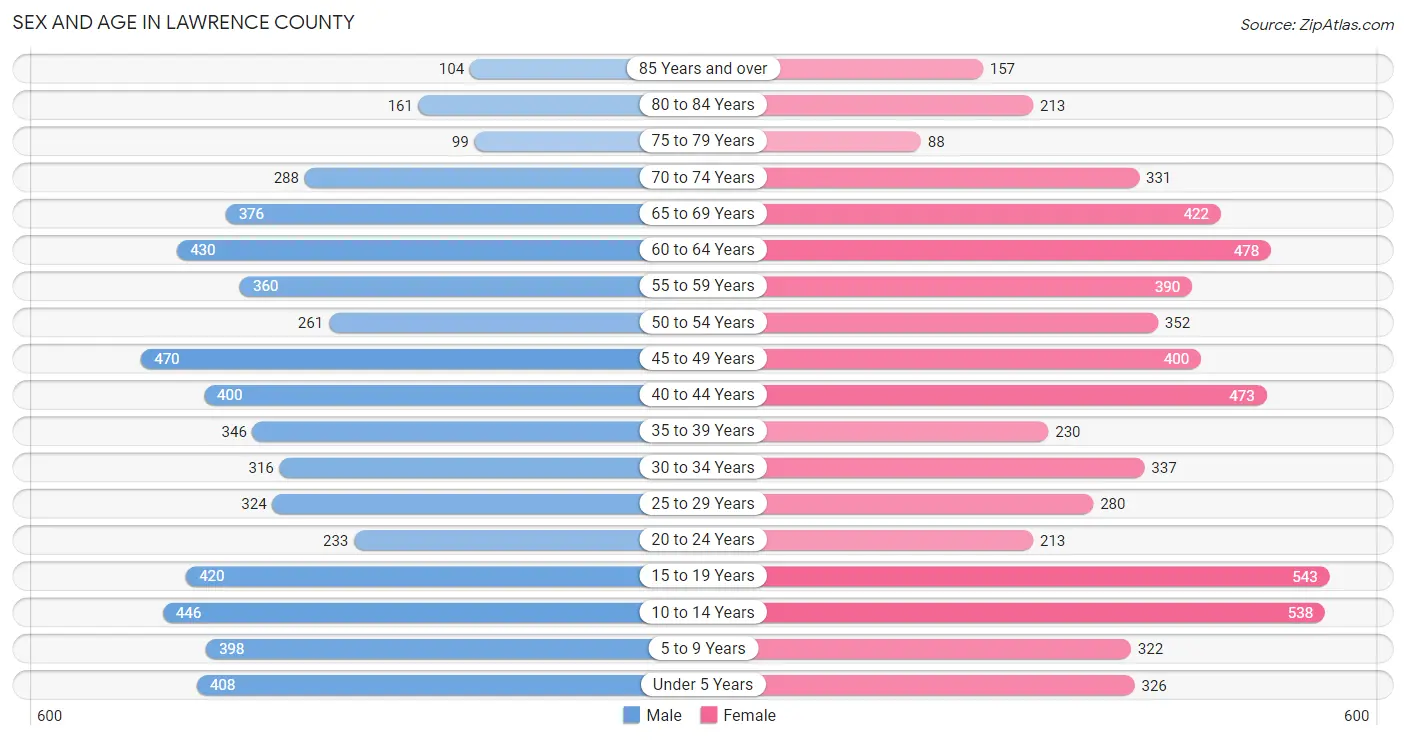
| Age Bracket | Male | Female |
| Under 5 Years | 408 (7.0%) | 326 (5.3%) |
| 5 to 9 Years | 398 (6.8%) | 322 (5.3%) |
| 10 to 14 Years | 446 (7.6%) | 538 (8.8%) |
| 15 to 19 Years | 420 (7.2%) | 543 (8.9%) |
| 20 to 24 Years | 233 (4.0%) | 213 (3.5%) |
| 25 to 29 Years | 324 (5.6%) | 280 (4.6%) |
| 30 to 34 Years | 316 (5.4%) | 337 (5.5%) |
| 35 to 39 Years | 346 (5.9%) | 230 (3.8%) |
| 40 to 44 Years | 400 (6.9%) | 473 (7.8%) |
| 45 to 49 Years | 470 (8.1%) | 400 (6.6%) |
| 50 to 54 Years | 261 (4.5%) | 352 (5.8%) |
| 55 to 59 Years | 360 (6.2%) | 390 (6.4%) |
| 60 to 64 Years | 430 (7.4%) | 478 (7.9%) |
| 65 to 69 Years | 376 (6.4%) | 422 (6.9%) |
| 70 to 74 Years | 288 (4.9%) | 331 (5.4%) |
| 75 to 79 Years | 99 (1.7%) | 88 (1.4%) |
| 80 to 84 Years | 161 (2.8%) | 213 (3.5%) |
| 85 Years and over | 104 (1.8%) | 157 (2.6%) |
| Total | 5,840 (100.0%) | 6,093 (100.0%) |
Families and Households in Lawrence County
Median Family Size in Lawrence County
The median family size in Lawrence County is 3.43 persons per family, with single female/mother families (610 | 20.5%) accounting for the largest median family size of 4.07 persons per family. On the other hand, single male/father families (189 | 6.3%) represent the smallest median family size with 2.35 persons per family.

| Family Type | # Families | Family Size |
| Married-Couple | 2,180 (73.2%) | 3.34 |
| Single Male/Father | 189 (6.3%) | 2.35 |
| Single Female/Mother | 610 (20.5%) | 4.07 |
| Total Families | 2,979 (100.0%) | 3.43 |
Median Household Size in Lawrence County
The median household size in Lawrence County is 2.66 persons per household, with single female/mother households (610 | 13.6%) accounting for the largest median household size of 4.09 persons per household. non-family households (1,494 | 33.4%) represent the smallest median household size with 1.11 persons per household.

| Household Type | # Households | Household Size |
| Married-Couple | 2,180 (48.7%) | 3.35 |
| Single Male/Father | 189 (4.2%) | 2.49 |
| Single Female/Mother | 610 (13.6%) | 4.09 |
| Non-family | 1,494 (33.4%) | 1.11 |
| Total Households | 4,473 (100.0%) | 2.66 |
Household Size by Marriage Status in Lawrence County
Out of a total of 4,473 households in Lawrence County, 2,979 (66.6%) are family households, while 1,494 (33.4%) are nonfamily households. The most numerous type of family households are 2-person households, comprising 1,369, and the most common type of nonfamily households are 1-person households, comprising 1,355.

| Household Size | Family Households | Nonfamily Households |
| 1-Person Households | - | 1,355 (30.3%) |
| 2-Person Households | 1,369 (30.6%) | 95 (2.1%) |
| 3-Person Households | 752 (16.8%) | 44 (1.0%) |
| 4-Person Households | 331 (7.4%) | 0 (0.0%) |
| 5-Person Households | 387 (8.6%) | 0 (0.0%) |
| 6-Person Households | 89 (2.0%) | 0 (0.0%) |
| 7+ Person Households | 51 (1.1%) | 0 (0.0%) |
| Total | 2,979 (66.6%) | 1,494 (33.4%) |
Female Fertility in Lawrence County
Fertility by Age in Lawrence County
Average fertility rate in Lawrence County is 52.0 births per 1,000 women. Women in the age bracket of 15 to 19 years have the highest fertility rate with 110.0 births per 1,000 women. Women in the age bracket of 15 to 19 years acount for 46.2% of all women with births.

| Age Bracket | Women with Births | Births / 1,000 Women |
| 15 to 19 years | 60 (46.2%) | 110.0 |
| 20 to 34 years | 59 (45.4%) | 71.0 |
| 35 to 50 years | 11 (8.5%) | 10.0 |
| Total | 130 (100.0%) | 52.0 |
Fertility by Age by Marriage Status in Lawrence County
58.5% of women with births (130) in Lawrence County are married. The highest percentage of unmarried women with births falls into 15 to 19 years age bracket with 68.3% of them unmarried at the time of birth, while the lowest percentage of unmarried women with births belong to 35 to 50 years age bracket with 0.0% of them unmarried.
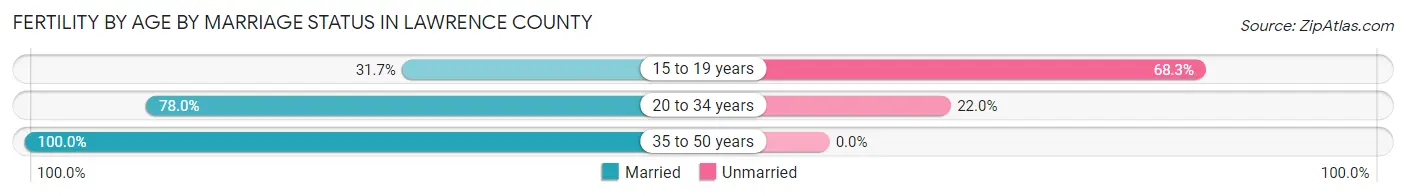
| Age Bracket | Married | Unmarried |
| 15 to 19 years | 19 (31.7%) | 41 (68.3%) |
| 20 to 34 years | 46 (78.0%) | 13 (22.0%) |
| 35 to 50 years | 11 (100.0%) | 0 (0.0%) |
| Total | 76 (58.5%) | 54 (41.5%) |
Fertility by Education in Lawrence County

| Educational Attainment | Women with Births | Births / 1,000 Women |
| Less than High School | 10 (7.7%) | 23.0 |
| High School Diploma | 80 (61.5%) | 128.0 |
| College or Associate's Degree | 18 (13.9%) | 18.0 |
| Bachelor's Degree | 22 (16.9%) | 94.0 |
| Graduate Degree | 0 (0.0%) | 0.0 |
| Total | 130 (100.0%) | 52.0 |
Fertility by Education by Marriage Status in Lawrence County
41.5% of women with births in Lawrence County are unmarried. Women with the educational attainment of less than high school are most likely to be married with 100.0% of them married at childbirth, while women with the educational attainment of high school diploma are least likely to be married with 67.5% of them unmarried at childbirth.

| Educational Attainment | Married | Unmarried |
| Less than High School | 10 (100.0%) | 0 (0.0%) |
| High School Diploma | 26 (32.5%) | 54 (67.5%) |
| College or Associate's Degree | 18 (100.0%) | 0 (0.0%) |
| Bachelor's Degree | 22 (100.0%) | 0 (0.0%) |
| Graduate Degree | 0 (0.0%) | 0 (0.0%) |
| Total | 76 (58.5%) | 54 (41.5%) |
Income in Lawrence County
Income Overview in Lawrence County
Per Capita Income in Lawrence County is $24,809, while median incomes of families and households are $52,156 and $41,096 respectively.
| Characteristic | Number | Measure |
| Per Capita Income | 11,933 | $24,809 |
| Median Family Income | 2,979 | $52,156 |
| Mean Family Income | 2,979 | $71,318 |
| Median Household Income | 4,473 | $41,096 |
| Mean Household Income | 4,473 | $58,693 |
| Income Deficit | 2,979 | $0 |
| Wage / Income Gap (%) | 11,933 | 36.73% |
| Wage / Income Gap ($) | 11,933 | 63.27¢ per $1 |
| Gini / Inequality Index | 11,933 | 0.46 |
Earnings by Sex in Lawrence County
Average Earnings in Lawrence County are $34,334, $40,750 for men and $25,782 for women, a difference of 36.7%.

| Sex | Number | Average Earnings |
| Male | 2,672 (58.9%) | $40,750 |
| Female | 1,863 (41.1%) | $25,782 |
| Total | 4,535 (100.0%) | $34,334 |
Earnings by Sex by Income Bracket in Lawrence County
The most common earnings brackets in Lawrence County are $100,000+ for men (354 | 13.3%) and $25,000 to $29,999 for women (207 | 11.1%).

| Income | Male | Female |
| $2,499 or less | 90 (3.4%) | 147 (7.9%) |
| $2,500 to $4,999 | 198 (7.4%) | 76 (4.1%) |
| $5,000 to $7,499 | 87 (3.3%) | 128 (6.9%) |
| $7,500 to $9,999 | 45 (1.7%) | 137 (7.3%) |
| $10,000 to $12,499 | 34 (1.3%) | 22 (1.2%) |
| $12,500 to $14,999 | 46 (1.7%) | 72 (3.9%) |
| $15,000 to $17,499 | 53 (2.0%) | 45 (2.4%) |
| $17,500 to $19,999 | 6 (0.2%) | 32 (1.7%) |
| $20,000 to $22,499 | 149 (5.6%) | 79 (4.2%) |
| $22,500 to $24,999 | 61 (2.3%) | 145 (7.8%) |
| $25,000 to $29,999 | 223 (8.4%) | 207 (11.1%) |
| $30,000 to $34,999 | 92 (3.4%) | 122 (6.6%) |
| $35,000 to $39,999 | 213 (8.0%) | 64 (3.4%) |
| $40,000 to $44,999 | 169 (6.3%) | 128 (6.9%) |
| $45,000 to $49,999 | 167 (6.2%) | 99 (5.3%) |
| $50,000 to $54,999 | 106 (4.0%) | 70 (3.8%) |
| $55,000 to $64,999 | 215 (8.1%) | 25 (1.3%) |
| $65,000 to $74,999 | 87 (3.3%) | 15 (0.8%) |
| $75,000 to $99,999 | 277 (10.4%) | 202 (10.8%) |
| $100,000+ | 354 (13.3%) | 48 (2.6%) |
| Total | 2,672 (100.0%) | 1,863 (100.0%) |
Earnings by Sex by Educational Attainment in Lawrence County
Average earnings in Lawrence County are $42,724 for men and $27,113 for women, a difference of 36.5%. Men with an educational attainment of graduate degree enjoy the highest average annual earnings of $98,889, while those with college or associate's degree education earn the least with $39,899. Women with an educational attainment of bachelor's degree earn the most with the average annual earnings of $69,444, while those with college or associate's degree education have the smallest earnings of $23,796.

| Educational Attainment | Male Income | Female Income |
| Less than High School | $53,214 | $0 |
| High School Diploma | $42,500 | $27,308 |
| College or Associate's Degree | $39,899 | $23,796 |
| Bachelor's Degree | $79,321 | $69,444 |
| Graduate Degree | $98,889 | $47,500 |
| Total | $42,724 | $27,113 |
Family Income in Lawrence County
Family Income Brackets in Lawrence County
According to the Lawrence County family income data, there are 685 families falling into the $50,000 to $74,999 income range, which is the most common income bracket and makes up 23.0% of all families. Conversely, the $10,000 to $14,999 income bracket is the least frequent group with only 80 families (2.7%) belonging to this category.

| Income Bracket | # Families | % Families |
| Less than $10,000 | 152 | 5.1% |
| $10,000 to $14,999 | 80 | 2.7% |
| $15,000 to $24,999 | 256 | 8.6% |
| $25,000 to $34,999 | 352 | 11.8% |
| $35,000 to $49,999 | 545 | 18.3% |
| $50,000 to $74,999 | 685 | 23.0% |
| $75,000 to $99,999 | 313 | 10.5% |
| $100,000 to $149,999 | 310 | 10.4% |
| $150,000 to $199,999 | 158 | 5.3% |
| $200,000+ | 128 | 4.3% |
Family Income by Famaliy Size in Lawrence County
6-person families (88 | 2.9%) account for the highest median family income in Lawrence County with $101,023 per family, while 2-person families (1,384 | 46.5%) have the highest median income of $25,252 per family member.

| Income Bracket | # Families | Median Income |
| 2-Person Families | 1,384 (46.5%) | $50,505 |
| 3-Person Families | 745 (25.0%) | $52,813 |
| 4-Person Families | 337 (11.3%) | $73,194 |
| 5-Person Families | 374 (12.6%) | $55,972 |
| 6-Person Families | 88 (2.9%) | $101,023 |
| 7+ Person Families | 51 (1.7%) | $0 |
| Total | 2,979 (100.0%) | $52,156 |
Family Income by Number of Earners in Lawrence County
The median family income in Lawrence County is $52,156, with families comprising 3+ earners (112) having the highest median family income of $132,500, while families with no earners (676) have the lowest median family income of $36,974, accounting for 3.8% and 22.7% of families, respectively.

| Number of Earners | # Families | Median Income |
| No Earners | 676 (22.7%) | $36,974 |
| 1 Earner | 1,286 (43.2%) | $39,606 |
| 2 Earners | 905 (30.4%) | $87,543 |
| 3+ Earners | 112 (3.8%) | $132,500 |
| Total | 2,979 (100.0%) | $52,156 |
Household Income in Lawrence County
Household Income Brackets in Lawrence County
With 845 households falling in the category, the $35,000 to $49,999 income range is the most frequent in Lawrence County, accounting for 18.9% of all households. In contrast, only 130 households (2.9%) fall into the $200,000+ income bracket, making it the least populous group.
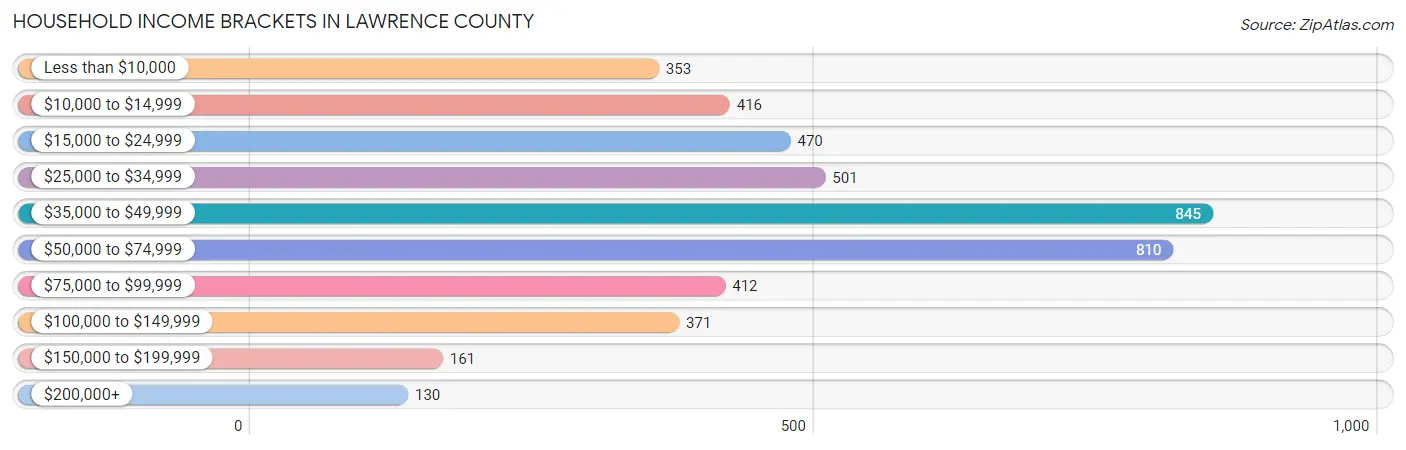
| Income Bracket | # Households | % Households |
| Less than $10,000 | 353 | 7.9% |
| $10,000 to $14,999 | 416 | 9.3% |
| $15,000 to $24,999 | 470 | 10.5% |
| $25,000 to $34,999 | 501 | 11.2% |
| $35,000 to $49,999 | 845 | 18.9% |
| $50,000 to $74,999 | 810 | 18.1% |
| $75,000 to $99,999 | 412 | 9.2% |
| $100,000 to $149,999 | 371 | 8.3% |
| $150,000 to $199,999 | 161 | 3.6% |
| $200,000+ | 130 | 2.9% |
Household Income by Householder Age in Lawrence County
The median household income in Lawrence County is $41,096, with the highest median household income of $46,250 found in the 25 to 44 years age bracket for the primary householder. A total of 1,246 households (27.9%) fall into this category. Meanwhile, the 15 to 24 years age bracket for the primary householder has the lowest median household income of $30,556, with 48 households (1.1%) in this group.

| Income Bracket | # Households | Median Income |
| 15 to 24 Years | 48 (1.1%) | $30,556 |
| 25 to 44 Years | 1,246 (27.9%) | $46,250 |
| 45 to 64 Years | 1,780 (39.8%) | $43,929 |
| 65+ Years | 1,399 (31.3%) | $38,946 |
| Total | 4,473 (100.0%) | $41,096 |
Poverty in Lawrence County
Income Below Poverty by Sex and Age in Lawrence County
With 21.3% poverty level for males and 23.7% for females among the residents of Lawrence County, 15 year old males and 18 to 24 year old females are the most vulnerable to poverty, with 114 males (73.1%) and 242 females (46.8%) in their respective age groups living below the poverty level.

| Age Bracket | Male | Female |
| Under 5 Years | 142 (34.9%) | 107 (32.8%) |
| 5 Years | 11 (44.0%) | 14 (18.4%) |
| 6 to 11 Years | 178 (31.2%) | 41 (10.1%) |
| 12 to 14 Years | 26 (10.4%) | 170 (44.9%) |
| 15 Years | 114 (73.1%) | 4 (3.7%) |
| 16 and 17 Years | 21 (12.1%) | 6 (4.5%) |
| 18 to 24 Years | 14 (4.3%) | 242 (46.8%) |
| 25 to 34 Years | 91 (14.2%) | 131 (21.2%) |
| 35 to 44 Years | 215 (28.8%) | 108 (15.4%) |
| 45 to 54 Years | 89 (12.2%) | 124 (16.5%) |
| 55 to 64 Years | 238 (30.2%) | 209 (24.2%) |
| 65 to 74 Years | 104 (15.7%) | 154 (20.5%) |
| 75 Years and over | 0 (0.0%) | 130 (28.5%) |
| Total | 1,243 (21.3%) | 1,440 (23.7%) |
Income Above Poverty by Sex and Age in Lawrence County
According to the poverty statistics in Lawrence County, males aged 75 years and over and females aged 15 years are the age groups that are most secure financially, with 100.0% of males and 96.3% of females in these age groups living above the poverty line.

| Age Bracket | Male | Female |
| Under 5 Years | 265 (65.1%) | 219 (67.2%) |
| 5 Years | 14 (56.0%) | 62 (81.6%) |
| 6 to 11 Years | 392 (68.8%) | 364 (89.9%) |
| 12 to 14 Years | 223 (89.6%) | 209 (55.1%) |
| 15 Years | 42 (26.9%) | 103 (96.3%) |
| 16 and 17 Years | 153 (87.9%) | 126 (95.5%) |
| 18 to 24 Years | 309 (95.7%) | 275 (53.2%) |
| 25 to 34 Years | 549 (85.8%) | 486 (78.8%) |
| 35 to 44 Years | 531 (71.2%) | 595 (84.6%) |
| 45 to 54 Years | 640 (87.8%) | 628 (83.5%) |
| 55 to 64 Years | 551 (69.8%) | 655 (75.8%) |
| 65 to 74 Years | 558 (84.3%) | 597 (79.5%) |
| 75 Years and over | 362 (100.0%) | 326 (71.5%) |
| Total | 4,589 (78.7%) | 4,645 (76.3%) |
Income Below Poverty Among Married-Couple Families in Lawrence County
The poverty statistics for married-couple families in Lawrence County show that 9.1% or 199 of the total 2,180 families live below the poverty line. Families with 5 or more children have the highest poverty rate of 100.0%, comprising of 8 families. On the other hand, families with no children have the lowest poverty rate of 6.3%, which includes 76 families.

| Children | Above Poverty | Below Poverty |
| No Children | 1,132 (93.7%) | 76 (6.3%) |
| 1 or 2 Children | 507 (89.9%) | 57 (10.1%) |
| 3 or 4 Children | 342 (85.5%) | 58 (14.5%) |
| 5 or more Children | 0 (0.0%) | 8 (100.0%) |
| Total | 1,981 (90.9%) | 199 (9.1%) |
Income Below Poverty Among Single-Parent Households in Lawrence County
According to the poverty data in Lawrence County, 10.1% or 19 single-father households and 32.6% or 199 single-mother households are living below the poverty line. Among single-father households, those with 1 or 2 children have the highest poverty rate, with 15 households (20.8%) experiencing poverty. Likewise, among single-mother households, those with 5 or more children have the highest poverty rate, with 8 households (100.0%) falling below the poverty line.

| Children | Single Father | Single Mother |
| No Children | 4 (3.8%) | 55 (21.7%) |
| 1 or 2 Children | 15 (20.8%) | 110 (34.7%) |
| 3 or 4 Children | 0 (0.0%) | 26 (81.2%) |
| 5 or more Children | 0 (0.0%) | 8 (100.0%) |
| Total | 19 (10.1%) | 199 (32.6%) |
Income Below Poverty Among Married-Couple vs Single-Parent Households in Lawrence County
The poverty data for Lawrence County shows that 199 of the married-couple family households (9.1%) and 218 of the single-parent households (27.3%) are living below the poverty level. Within the married-couple family households, those with 5 or more children have the highest poverty rate, with 8 households (100.0%) falling below the poverty line. Among the single-parent households, those with 5 or more children have the highest poverty rate, with 8 household (100.0%) living below poverty.

| Children | Married-Couple Families | Single-Parent Households |
| No Children | 76 (6.3%) | 59 (16.4%) |
| 1 or 2 Children | 57 (10.1%) | 125 (32.1%) |
| 3 or 4 Children | 58 (14.5%) | 26 (60.5%) |
| 5 or more Children | 8 (100.0%) | 8 (100.0%) |
| Total | 199 (9.1%) | 218 (27.3%) |
Employment Characteristics in Lawrence County
Employment by Class of Employer in Lawrence County
Among the 4,037 employed individuals in Lawrence County, private company employees (2,592 | 64.2%), state government employees (443 | 11.0%), and local government employees (323 | 8.0%) make up the most common classes of employment.

| Employer Class | # Employees | % Employees |
| Private Company Employees | 2,592 | 64.2% |
| Self-Employed (Incorporated) | 64 | 1.6% |
| Self-Employed (Not Incorporated) | 274 | 6.8% |
| Not-for-profit Organizations | 261 | 6.5% |
| Local Government Employees | 323 | 8.0% |
| State Government Employees | 443 | 11.0% |
| Federal Government Employees | 60 | 1.5% |
| Unpaid Family Workers | 20 | 0.5% |
| Total | 4,037 | 100.0% |
Employment Status by Age in Lawrence County
According to the labor force statistics for Lawrence County, out of the total population over 16 years of age (9,232), 50.0% or 4,616 individuals are in the labor force, with 12.0% or 554 of them unemployed. The age group with the highest labor force participation rate is 35 to 44 years, with 84.1% or 1,219 individuals in the labor force. Within the labor force, the 20 to 24 years age range has the highest percentage of unemployed individuals, with 41.9% or 109 of them being unemployed.

| Age Bracket | In Labor Force | Unemployed |
| 16 to 19 Years | 197 (28.1%) | 42 (21.3%) |
| 20 to 24 Years | 260 (58.3%) | 109 (41.9%) |
| 25 to 29 Years | 431 (71.4%) | 95 (22.0%) |
| 30 to 34 Years | 538 (82.4%) | 67 (12.5%) |
| 35 to 44 Years | 1,219 (84.1%) | 200 (16.4%) |
| 45 to 54 Years | 997 (67.2%) | 25 (2.5%) |
| 55 to 59 Years | 405 (54.0%) | 2 (0.5%) |
| 60 to 64 Years | 366 (40.3%) | 4 (1.1%) |
| 65 to 74 Years | 184 (13.0%) | 10 (5.4%) |
| 75 Years and over | 24 (2.9%) | 0 (0.0%) |
| Total | 4,616 (50.0%) | 554 (12.0%) |
Employment Status by Educational Attainment in Lawrence County
According to labor force statistics for Lawrence County, 67.6% of individuals (3,953) out of the total population between 25 and 64 years of age (5,847) are in the labor force, with 9.9% or 391 of them being unemployed. The group with the highest labor force participation rate are those with the educational attainment of bachelor's degree or higher, with 89.7% or 668 individuals in the labor force. Within the labor force, individuals with high school diploma education have the highest percentage of unemployment, with 17.3% or 238 of them being unemployed.

| Educational Attainment | In Labor Force | Unemployed |
| Less than High School | 376 (48.5%) | 9 (1.1%) |
| High School Diploma | 1,377 (58.4%) | 408 (17.3%) |
| College / Associate Degree | 1,534 (77.9%) | 83 (4.2%) |
| Bachelor's Degree or higher | 668 (89.7%) | 96 (12.9%) |
| Total | 3,953 (67.6%) | 579 (9.9%) |
Employment Occupations by Sex in Lawrence County
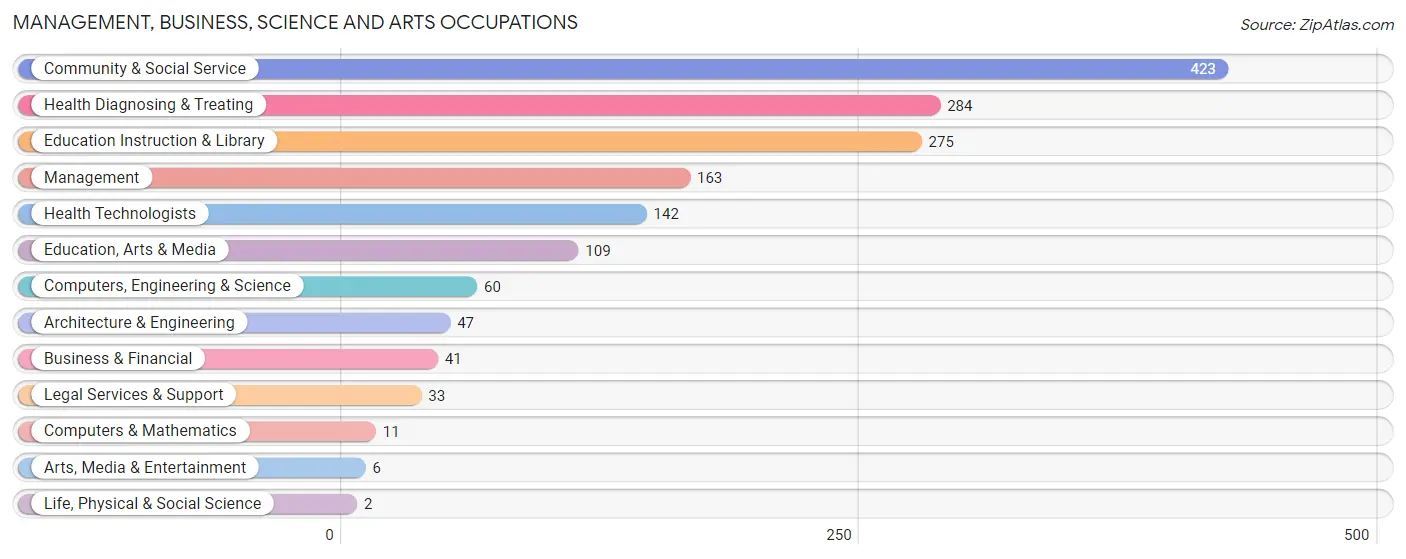
Management, Business, Science and Arts Occupations
The most common Management, Business, Science and Arts occupations in Lawrence County are Community & Social Service (423 | 10.4%), Health Diagnosing & Treating (284 | 7.0%), Education Instruction & Library (275 | 6.8%), Management (163 | 4.0%), and Health Technologists (142 | 3.5%).
Management, Business, Science and Arts Occupations by Sex
Within the Management, Business, Science and Arts occupations in Lawrence County, the most male-oriented occupations are Computers, Engineering & Science (100.0%), Computers & Mathematics (100.0%), and Architecture & Engineering (100.0%), while the most female-oriented occupations are Arts, Media & Entertainment (83.3%), Health Technologists (77.5%), and Education Instruction & Library (73.1%).

| Occupation | Male | Female |
| Management | 93 (57.1%) | 70 (42.9%) |
| Business & Financial | 21 (51.2%) | 20 (48.8%) |
| Computers, Engineering & Science | 60 (100.0%) | 0 (0.0%) |
| Computers & Mathematics | 11 (100.0%) | 0 (0.0%) |
| Architecture & Engineering | 47 (100.0%) | 0 (0.0%) |
| Life, Physical & Social Science | 2 (100.0%) | 0 (0.0%) |
| Community & Social Service | 180 (42.5%) | 243 (57.5%) |
| Education, Arts & Media | 89 (81.7%) | 20 (18.3%) |
| Legal Services & Support | 16 (48.5%) | 17 (51.5%) |
| Education Instruction & Library | 74 (26.9%) | 201 (73.1%) |
| Arts, Media & Entertainment | 1 (16.7%) | 5 (83.3%) |
| Health Diagnosing & Treating | 94 (33.1%) | 190 (66.9%) |
| Health Technologists | 32 (22.5%) | 110 (77.5%) |
| Total (Category) | 448 (46.1%) | 523 (53.9%) |
| Total (Overall) | 2,471 (60.8%) | 1,595 (39.2%) |
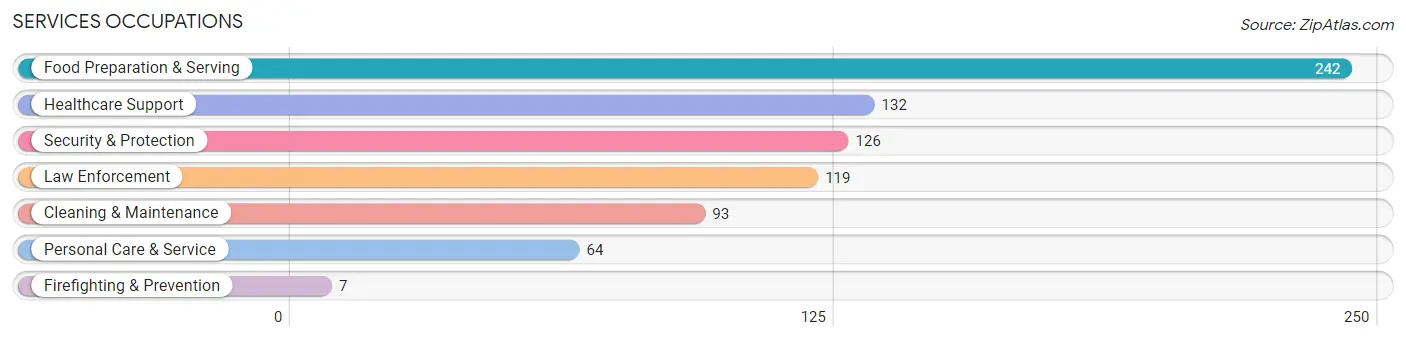
Services Occupations
The most common Services occupations in Lawrence County are Food Preparation & Serving (242 | 5.9%), Healthcare Support (132 | 3.3%), Security & Protection (126 | 3.1%), Law Enforcement (119 | 2.9%), and Cleaning & Maintenance (93 | 2.3%).
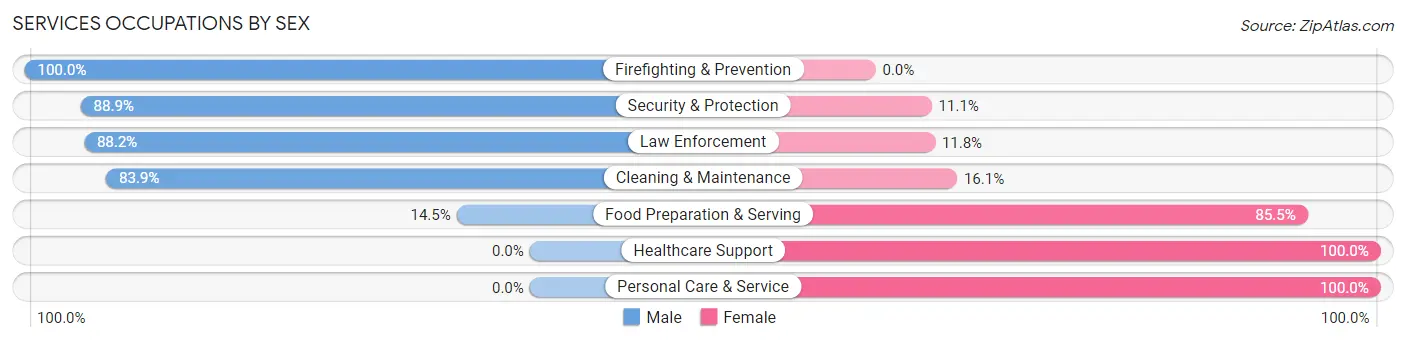
Services Occupations by Sex
Within the Services occupations in Lawrence County, the most male-oriented occupations are Firefighting & Prevention (100.0%), Security & Protection (88.9%), and Law Enforcement (88.2%), while the most female-oriented occupations are Healthcare Support (100.0%), Personal Care & Service (100.0%), and Food Preparation & Serving (85.5%).
| Occupation | Male | Female |
| Healthcare Support | 0 (0.0%) | 132 (100.0%) |
| Security & Protection | 112 (88.9%) | 14 (11.1%) |
| Firefighting & Prevention | 7 (100.0%) | 0 (0.0%) |
| Law Enforcement | 105 (88.2%) | 14 (11.8%) |
| Food Preparation & Serving | 35 (14.5%) | 207 (85.5%) |
| Cleaning & Maintenance | 78 (83.9%) | 15 (16.1%) |
| Personal Care & Service | 0 (0.0%) | 64 (100.0%) |
| Total (Category) | 225 (34.3%) | 432 (65.7%) |
| Total (Overall) | 2,471 (60.8%) | 1,595 (39.2%) |
Sales and Office Occupations
The most common Sales and Office occupations in Lawrence County are Sales & Related (484 | 11.9%), and Office & Administration (364 | 8.9%).

Sales and Office Occupations by Sex

| Occupation | Male | Female |
| Sales & Related | 200 (41.3%) | 284 (58.7%) |
| Office & Administration | 88 (24.2%) | 276 (75.8%) |
| Total (Category) | 288 (34.0%) | 560 (66.0%) |
| Total (Overall) | 2,471 (60.8%) | 1,595 (39.2%) |
Natural Resources, Construction and Maintenance Occupations
The most common Natural Resources, Construction and Maintenance occupations in Lawrence County are Construction & Extraction (444 | 10.9%), Installation, Maintenance & Repair (302 | 7.4%), and Farming, Fishing & Forestry (88 | 2.2%).

Natural Resources, Construction and Maintenance Occupations by Sex

| Occupation | Male | Female |
| Farming, Fishing & Forestry | 77 (87.5%) | 11 (12.5%) |
| Construction & Extraction | 436 (98.2%) | 8 (1.8%) |
| Installation, Maintenance & Repair | 302 (100.0%) | 0 (0.0%) |
| Total (Category) | 815 (97.7%) | 19 (2.3%) |
| Total (Overall) | 2,471 (60.8%) | 1,595 (39.2%) |
Production, Transportation and Moving Occupations
The most common Production, Transportation and Moving occupations in Lawrence County are Production (279 | 6.9%), Material Moving (257 | 6.3%), and Transportation (220 | 5.4%).

Production, Transportation and Moving Occupations by Sex

| Occupation | Male | Female |
| Production | 258 (92.5%) | 21 (7.5%) |
| Transportation | 211 (95.9%) | 9 (4.1%) |
| Material Moving | 226 (87.9%) | 31 (12.1%) |
| Total (Category) | 695 (91.9%) | 61 (8.1%) |
| Total (Overall) | 2,471 (60.8%) | 1,595 (39.2%) |
Employment Industries by Sex in Lawrence County
Employment Industries in Lawrence County
The major employment industries in Lawrence County include Retail Trade (598 | 14.7%), Health Care & Social Assistance (560 | 13.8%), Manufacturing (446 | 11.0%), Construction (377 | 9.3%), and Public Administration (357 | 8.8%).

Employment Industries by Sex in Lawrence County
The Lawrence County industries that see more men than women are Mining, Quarrying, & Extraction (100.0%), Arts, Entertainment & Recreation (100.0%), and Construction (96.8%), whereas the industries that tend to have a higher number of women are Administrative & Support (88.1%), Accommodation & Food Services (87.8%), and Health Care & Social Assistance (78.9%).

| Industry | Male | Female |
| Agriculture, Fishing & Hunting | 118 (81.4%) | 27 (18.6%) |
| Mining, Quarrying, & Extraction | 191 (100.0%) | 0 (0.0%) |
| Construction | 365 (96.8%) | 12 (3.2%) |
| Manufacturing | 399 (89.5%) | 47 (10.5%) |
| Wholesale Trade | 124 (90.5%) | 13 (9.5%) |
| Retail Trade | 371 (62.0%) | 227 (38.0%) |
| Transportation & Warehousing | 88 (85.4%) | 15 (14.6%) |
| Utilities | 97 (83.6%) | 19 (16.4%) |
| Information | 8 (80.0%) | 2 (20.0%) |
| Finance & Insurance | 8 (66.7%) | 4 (33.3%) |
| Real Estate, Rental & Leasing | 22 (73.3%) | 8 (26.7%) |
| Professional & Scientific | 60 (75.0%) | 20 (25.0%) |
| Enterprise Management | 0 (0.0%) | 0 (0.0%) |
| Administrative & Support | 18 (11.9%) | 133 (88.1%) |
| Educational Services | 79 (22.9%) | 266 (77.1%) |
| Health Care & Social Assistance | 118 (21.1%) | 442 (78.9%) |
| Arts, Entertainment & Recreation | 1 (100.0%) | 0 (0.0%) |
| Accommodation & Food Services | 22 (12.1%) | 159 (87.8%) |
| Public Administration | 265 (74.2%) | 92 (25.8%) |
| Total | 2,471 (60.8%) | 1,595 (39.2%) |
Education in Lawrence County
School Enrollment in Lawrence County
The most common levels of schooling among the 3,101 students in Lawrence County are high school (879 | 28.3%), elementary school (764 | 24.6%), and middle school (629 | 20.3%).

| School Level | # Students | % Students |
| Nursery / Preschool | 142 | 4.6% |
| Kindergarten | 110 | 3.5% |
| Elementary School | 764 | 24.6% |
| Middle School | 629 | 20.3% |
| High School | 879 | 28.3% |
| College / Undergraduate | 488 | 15.7% |
| Graduate / Professional | 89 | 2.9% |
| Total | 3,101 | 100.0% |
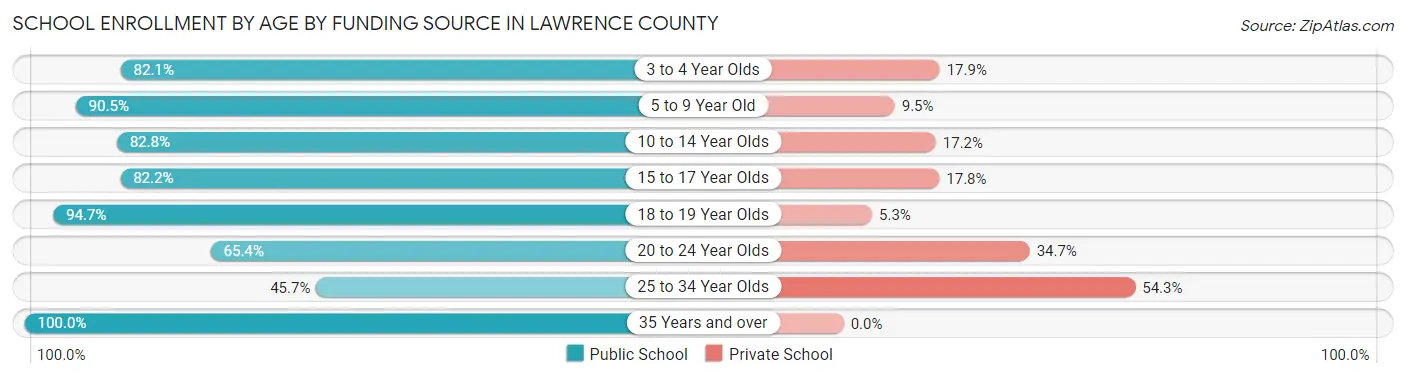
School Enrollment by Age by Funding Source in Lawrence County
Out of a total of 3,101 students who are enrolled in schools in Lawrence County, 502 (16.2%) attend a private institution, while the remaining 2,599 (83.8%) are enrolled in public schools. The age group of 25 to 34 year olds has the highest likelihood of being enrolled in private schools, with 44 (54.3% in the age bracket) enrolled. Conversely, the age group of 35 years and over has the lowest likelihood of being enrolled in a private school, with 133 (100.0% in the age bracket) attending a public institution.
| Age Bracket | Public School | Private School |
| 3 to 4 Year Olds | 101 (82.1%) | 22 (17.9%) |
| 5 to 9 Year Old | 627 (90.5%) | 66 (9.5%) |
| 10 to 14 Year Olds | 815 (82.8%) | 169 (17.2%) |
| 15 to 17 Year Olds | 452 (82.2%) | 98 (17.8%) |
| 18 to 19 Year Olds | 268 (94.7%) | 15 (5.3%) |
| 20 to 24 Year Olds | 166 (65.3%) | 88 (34.6%) |
| 25 to 34 Year Olds | 37 (45.7%) | 44 (54.3%) |
| 35 Years and over | 133 (100.0%) | 0 (0.0%) |
| Total | 2,599 (83.8%) | 502 (16.2%) |
Educational Attainment by Field of Study in Lawrence County
Business (374 | 29.9%), education (294 | 23.5%), science & technology (237 | 19.0%), bio, nature & agricultural (92 | 7.4%), and arts & humanities (56 | 4.5%) are the most common fields of study among 1,250 individuals in Lawrence County who have obtained a bachelor's degree or higher.

| Field of Study | # Graduates | % Graduates |
| Computers & Mathematics | 32 | 2.6% |
| Bio, Nature & Agricultural | 92 | 7.4% |
| Physical & Health Sciences | 33 | 2.6% |
| Psychology | 19 | 1.5% |
| Social Sciences | 12 | 1.0% |
| Engineering | 22 | 1.8% |
| Multidisciplinary Studies | 7 | 0.6% |
| Science & Technology | 237 | 19.0% |
| Business | 374 | 29.9% |
| Education | 294 | 23.5% |
| Literature & Languages | 0 | 0.0% |
| Liberal Arts & History | 36 | 2.9% |
| Visual & Performing Arts | 5 | 0.4% |
| Communications | 31 | 2.5% |
| Arts & Humanities | 56 | 4.5% |
| Total | 1,250 | 100.0% |
Transportation & Commute in Lawrence County
Vehicle Availability by Sex in Lawrence County
The most prevalent vehicle ownership categories in Lawrence County are males with 2 vehicles (863, accounting for 35.2%) and females with 2 vehicles (537, making up 54.5%).

| Vehicles Available | Male | Female |
| No Vehicle | 74 (3.0%) | 5 (0.3%) |
| 1 Vehicle | 346 (14.1%) | 366 (23.1%) |
| 2 Vehicles | 863 (35.2%) | 537 (33.9%) |
| 3 Vehicles | 713 (29.1%) | 315 (19.9%) |
| 4 Vehicles | 396 (16.1%) | 338 (21.3%) |
| 5 or more Vehicles | 61 (2.5%) | 23 (1.5%) |
| Total | 2,453 (100.0%) | 1,584 (100.0%) |
Commute Time in Lawrence County
The most frequently occuring commute durations in Lawrence County are 30 to 34 minutes (570 commuters, 14.3%), 15 to 19 minutes (508 commuters, 12.8%), and 5 to 9 minutes (494 commuters, 12.4%).

| Commute Time | # Commuters | % Commuters |
| Less than 5 Minutes | 188 | 4.7% |
| 5 to 9 Minutes | 494 | 12.4% |
| 10 to 14 Minutes | 399 | 10.1% |
| 15 to 19 Minutes | 508 | 12.8% |
| 20 to 24 Minutes | 174 | 4.4% |
| 25 to 29 Minutes | 185 | 4.7% |
| 30 to 34 Minutes | 570 | 14.3% |
| 35 to 39 Minutes | 258 | 6.5% |
| 40 to 44 Minutes | 155 | 3.9% |
| 45 to 59 Minutes | 324 | 8.2% |
| 60 to 89 Minutes | 449 | 11.3% |
| 90 or more Minutes | 267 | 6.7% |
Commute Time by Sex in Lawrence County
The most common commute times in Lawrence County are 60 to 89 minutes (426 commuters, 17.6%) for males and 30 to 34 minutes (246 commuters, 15.8%) for females.

| Commute Time | Male | Female |
| Less than 5 Minutes | 129 (5.3%) | 59 (3.8%) |
| 5 to 9 Minutes | 329 (13.6%) | 165 (10.6%) |
| 10 to 14 Minutes | 263 (10.9%) | 136 (8.8%) |
| 15 to 19 Minutes | 302 (12.5%) | 206 (13.3%) |
| 20 to 24 Minutes | 85 (3.5%) | 89 (5.7%) |
| 25 to 29 Minutes | 86 (3.6%) | 99 (6.4%) |
| 30 to 34 Minutes | 324 (13.4%) | 246 (15.8%) |
| 35 to 39 Minutes | 59 (2.4%) | 199 (12.8%) |
| 40 to 44 Minutes | 65 (2.7%) | 90 (5.8%) |
| 45 to 59 Minutes | 121 (5.0%) | 203 (13.1%) |
| 60 to 89 Minutes | 426 (17.6%) | 23 (1.5%) |
| 90 or more Minutes | 229 (9.5%) | 38 (2.5%) |
Time of Departure to Work by Sex in Lawrence County
The most frequent times of departure to work in Lawrence County are 12:00 AM to 4:59 AM (442, 18.3%) for males and 7:00 AM to 7:29 AM (401, 25.8%) for females.

| Time of Departure | Male | Female |
| 12:00 AM to 4:59 AM | 442 (18.3%) | 60 (3.9%) |
| 5:00 AM to 5:29 AM | 60 (2.5%) | 30 (1.9%) |
| 5:30 AM to 5:59 AM | 188 (7.8%) | 52 (3.4%) |
| 6:00 AM to 6:29 AM | 433 (17.9%) | 136 (8.8%) |
| 6:30 AM to 6:59 AM | 371 (15.3%) | 128 (8.2%) |
| 7:00 AM to 7:29 AM | 214 (8.8%) | 401 (25.8%) |
| 7:30 AM to 7:59 AM | 152 (6.3%) | 231 (14.9%) |
| 8:00 AM to 8:29 AM | 86 (3.6%) | 117 (7.5%) |
| 8:30 AM to 8:59 AM | 187 (7.7%) | 198 (12.8%) |
| 9:00 AM to 9:59 AM | 59 (2.4%) | 32 (2.1%) |
| 10:00 AM to 10:59 AM | 0 (0.0%) | 31 (2.0%) |
| 11:00 AM to 11:59 AM | 0 (0.0%) | 0 (0.0%) |
| 12:00 PM to 3:59 PM | 116 (4.8%) | 63 (4.1%) |
| 4:00 PM to 11:59 PM | 110 (4.5%) | 74 (4.8%) |
| Total | 2,418 (100.0%) | 1,553 (100.0%) |
Housing Occupancy in Lawrence County
Occupancy by Ownership in Lawrence County
Of the total 4,473 dwellings in Lawrence County, owner-occupied units account for 3,519 (78.7%), while renter-occupied units make up 954 (21.3%).

| Occupancy | # Housing Units | % Housing Units |
| Owner Occupied Housing Units | 3,519 | 78.7% |
| Renter-Occupied Housing Units | 954 | 21.3% |
| Total Occupied Housing Units | 4,473 | 100.0% |
Occupancy by Household Size in Lawrence County

| Household Size | # Housing Units | % Housing Units |
| 1-Person Household | 1,355 | 30.3% |
| 2-Person Household | 1,464 | 32.7% |
| 3-Person Household | 796 | 17.8% |
| 4+ Person Household | 858 | 19.2% |
| Total Housing Units | 4,473 | 100.0% |
Occupancy by Ownership by Household Size in Lawrence County

| Household Size | Owner-occupied | Renter-occupied |
| 1-Person Household | 992 (73.2%) | 363 (26.8%) |
| 2-Person Household | 1,245 (85.0%) | 219 (15.0%) |
| 3-Person Household | 581 (73.0%) | 215 (27.0%) |
| 4+ Person Household | 701 (81.7%) | 157 (18.3%) |
| Total Housing Units | 3,519 (78.7%) | 954 (21.3%) |
Occupancy by Educational Attainment in Lawrence County

| Household Size | Owner-occupied | Renter-occupied |
| Less than High School | 458 (71.8%) | 180 (28.2%) |
| High School Diploma | 1,486 (83.4%) | 296 (16.6%) |
| College/Associate Degree | 1,054 (76.3%) | 327 (23.7%) |
| Bachelor's Degree or higher | 521 (77.5%) | 151 (22.5%) |
Occupancy by Age of Householder in Lawrence County

| Age Bracket | # Households | % Households |
| Under 35 Years | 615 | 13.8% |
| 35 to 44 Years | 679 | 15.2% |
| 45 to 54 Years | 855 | 19.1% |
| 55 to 64 Years | 925 | 20.7% |
| 65 to 74 Years | 832 | 18.6% |
| 75 to 84 Years | 343 | 7.7% |
| 85 Years and Over | 224 | 5.0% |
| Total | 4,473 | 100.0% |
Housing Finances in Lawrence County
Median Income by Occupancy in Lawrence County

| Occupancy Type | # Households | Median Income |
| Owner-Occupied | 3,519 (78.7%) | $47,345 |
| Renter-Occupied | 954 (21.3%) | $27,786 |
| Average | 4,473 (100.0%) | $41,096 |
Occupancy by Householder Income Bracket in Lawrence County

| Income Bracket | Owner-occupied | Renter-occupied |
| Less than $5,000 | 138 (3.9%) | 21 (2.2%) |
| $5,000 to $9,999 | 93 (2.6%) | 102 (10.7%) |
| $10,000 to $14,999 | 280 (8.0%) | 138 (14.5%) |
| $15,000 to $19,999 | 153 (4.3%) | 101 (10.6%) |
| $20,000 to $24,999 | 165 (4.7%) | 52 (5.4%) |
| $25,000 to $34,999 | 257 (7.3%) | 244 (25.6%) |
| $35,000 to $49,999 | 739 (21.0%) | 107 (11.2%) |
| $50,000 to $74,999 | 724 (20.6%) | 84 (8.8%) |
| $75,000 to $99,999 | 332 (9.4%) | 79 (8.3%) |
| $100,000 to $149,999 | 366 (10.4%) | 6 (0.6%) |
| $150,000 or more | 272 (7.7%) | 20 (2.1%) |
| Total | 3,519 (100.0%) | 954 (100.0%) |
Monthly Housing Cost Tiers in Lawrence County

| Monthly Cost | Owner-occupied | Renter-occupied |
| Less than $300 | 730 (20.7%) | 86 (9.0%) |
| $300 to $499 | 1,033 (29.3%) | 19 (2.0%) |
| $500 to $799 | 685 (19.5%) | 281 (29.4%) |
| $800 to $999 | 386 (11.0%) | 279 (29.2%) |
| $1,000 to $1,499 | 278 (7.9%) | 55 (5.8%) |
| $1,500 to $1,999 | 177 (5.0%) | 0 (0.0%) |
| $2,000 to $2,499 | 187 (5.3%) | 0 (0.0%) |
| $2,500 to $2,999 | 13 (0.4%) | 0 (0.0%) |
| $3,000 or more | 30 (0.9%) | 10 (1.1%) |
| Total | 3,519 (100.0%) | 954 (100.0%) |
Physical Housing Characteristics in Lawrence County
Housing Structures in Lawrence County

| Structure Type | # Housing Units | % Housing Units |
| Single Unit, Detached | 3,034 | 67.8% |
| Single Unit, Attached | 120 | 2.7% |
| 2 Unit Apartments | 107 | 2.4% |
| 3 or 4 Unit Apartments | 12 | 0.3% |
| 5 to 9 Unit Apartments | 47 | 1.1% |
| 10 or more Apartments | 0 | 0.0% |
| Mobile Home / Other | 1,153 | 25.8% |
| Total | 4,473 | 100.0% |
Housing Structures by Occupancy in Lawrence County

| Structure Type | Owner-occupied | Renter-occupied |
| Single Unit, Detached | 2,500 (82.4%) | 534 (17.6%) |
| Single Unit, Attached | 105 (87.5%) | 15 (12.5%) |
| 2 Unit Apartments | 0 (0.0%) | 107 (100.0%) |
| 3 or 4 Unit Apartments | 0 (0.0%) | 12 (100.0%) |
| 5 to 9 Unit Apartments | 0 (0.0%) | 47 (100.0%) |
| 10 or more Apartments | 0 (0.0%) | 0 (0.0%) |
| Mobile Home / Other | 914 (79.3%) | 239 (20.7%) |
| Total | 3,519 (78.7%) | 954 (21.3%) |
Housing Structures by Number of Rooms in Lawrence County

| Number of Rooms | Owner-occupied | Renter-occupied |
| 1 Room | 77 (2.2%) | 0 (0.0%) |
| 2 or 3 Rooms | 107 (3.0%) | 151 (15.8%) |
| 4 or 5 Rooms | 1,433 (40.7%) | 615 (64.5%) |
| 6 or 7 Rooms | 1,292 (36.7%) | 176 (18.4%) |
| 8 or more Rooms | 610 (17.3%) | 12 (1.3%) |
| Total | 3,519 (100.0%) | 954 (100.0%) |
Housing Structure by Heating Type in Lawrence County

| Heating Type | Owner-occupied | Renter-occupied |
| Utility Gas | 302 (8.6%) | 72 (7.5%) |
| Bottled, Tank, or LP Gas | 742 (21.1%) | 182 (19.1%) |
| Electricity | 2,382 (67.7%) | 590 (61.8%) |
| Fuel Oil or Kerosene | 14 (0.4%) | 11 (1.1%) |
| Coal or Coke | 0 (0.0%) | 0 (0.0%) |
| All other Fuels | 70 (2.0%) | 98 (10.3%) |
| No Fuel Used | 9 (0.3%) | 1 (0.1%) |
| Total | 3,519 (100.0%) | 954 (100.0%) |
Household Vehicle Usage in Lawrence County

| Vehicles per Household | Owner-occupied | Renter-occupied |
| No Vehicle | 195 (5.5%) | 44 (4.6%) |
| 1 Vehicle | 952 (27.1%) | 481 (50.4%) |
| 2 Vehicles | 1,366 (38.8%) | 295 (30.9%) |
| 3 or more Vehicles | 1,006 (28.6%) | 134 (14.1%) |
| Total | 3,519 (100.0%) | 954 (100.0%) |
Real Estate & Mortgages in Lawrence County
Real Estate and Mortgage Overview in Lawrence County
| Characteristic | Without Mortgage | With Mortgage |
| Housing Units | 2,350 | 1,169 |
| Median Property Value | $92,900 | $133,900 |
| Median Household Income | $41,328 | $142 |
| Monthly Housing Costs | $385 | $30 |
| Real Estate Taxes | $575 | $185 |
Property Value by Mortgage Status in Lawrence County
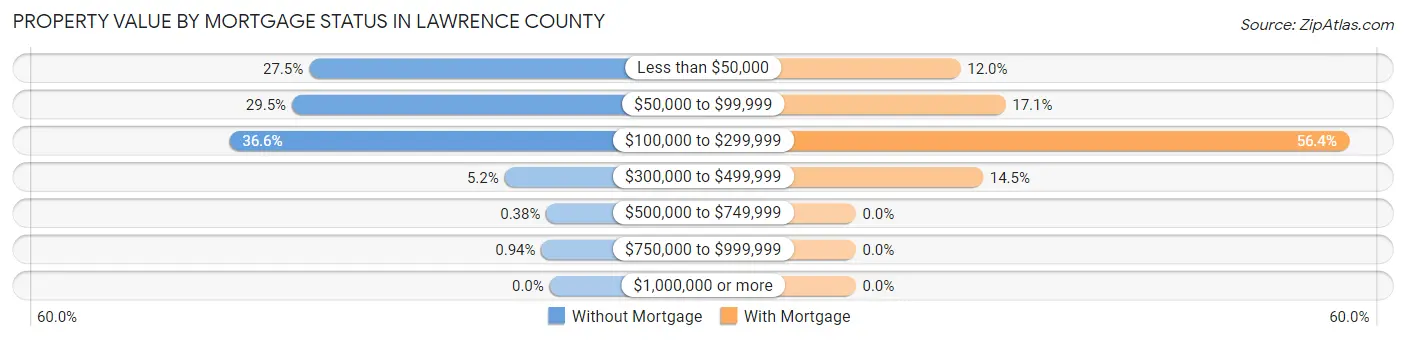
| Property Value | Without Mortgage | With Mortgage |
| Less than $50,000 | 646 (27.5%) | 140 (12.0%) |
| $50,000 to $99,999 | 692 (29.4%) | 200 (17.1%) |
| $100,000 to $299,999 | 860 (36.6%) | 659 (56.4%) |
| $300,000 to $499,999 | 121 (5.1%) | 170 (14.5%) |
| $500,000 to $749,999 | 9 (0.4%) | 0 (0.0%) |
| $750,000 to $999,999 | 22 (0.9%) | 0 (0.0%) |
| $1,000,000 or more | 0 (0.0%) | 0 (0.0%) |
| Total | 2,350 (100.0%) | 1,169 (100.0%) |
Household Income by Mortgage Status in Lawrence County

| Household Income | Without Mortgage | With Mortgage |
| Less than $10,000 | 214 (9.1%) | 33 (2.8%) |
| $10,000 to $24,999 | 432 (18.4%) | 17 (1.5%) |
| $25,000 to $34,999 | 224 (9.5%) | 166 (14.2%) |
| $35,000 to $49,999 | 552 (23.5%) | 33 (2.8%) |
| $50,000 to $74,999 | 500 (21.3%) | 187 (16.0%) |
| $75,000 to $99,999 | 139 (5.9%) | 224 (19.2%) |
| $100,000 to $149,999 | 159 (6.8%) | 193 (16.5%) |
| $150,000 or more | 130 (5.5%) | 207 (17.7%) |
| Total | 2,350 (100.0%) | 1,169 (100.0%) |
Property Value to Household Income Ratio in Lawrence County
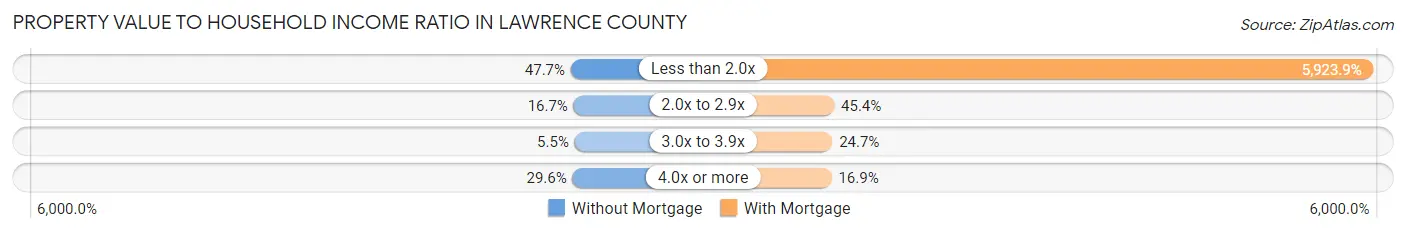
| Value-to-Income Ratio | Without Mortgage | With Mortgage |
| Less than 2.0x | 1,121 (47.7%) | 69,250 (5,923.9%) |
| 2.0x to 2.9x | 393 (16.7%) | 531 (45.4%) |
| 3.0x to 3.9x | 128 (5.4%) | 289 (24.7%) |
| 4.0x or more | 695 (29.6%) | 197 (16.9%) |
| Total | 2,350 (100.0%) | 1,169 (100.0%) |
Real Estate Taxes by Mortgage Status in Lawrence County

| Property Taxes | Without Mortgage | With Mortgage |
| Less than $800 | 902 (38.4%) | 0 (0.0%) |
| $800 to $1,499 | 298 (12.7%) | 374 (32.0%) |
| $800 to $1,499 | 264 (11.2%) | 274 (23.4%) |
| Total | 2,350 (100.0%) | 1,169 (100.0%) |
Health & Disability in Lawrence County
Health Insurance Coverage by Age in Lawrence County

| Age Bracket | With Coverage | Without Coverage |
| Under 6 Years | 835 (100.0%) | 0 (0.0%) |
| 6 to 18 Years | 2,095 (88.9%) | 261 (11.1%) |
| 19 to 25 Years | 524 (63.7%) | 298 (36.2%) |
| 26 to 34 Years | 816 (74.8%) | 275 (25.2%) |
| 35 to 44 Years | 1,124 (77.6%) | 325 (22.4%) |
| 45 to 54 Years | 1,243 (83.9%) | 238 (16.1%) |
| 55 to 64 Years | 1,413 (85.5%) | 240 (14.5%) |
| 65 to 74 Years | 1,397 (98.9%) | 16 (1.1%) |
| 75 Years and older | 818 (100.0%) | 0 (0.0%) |
| Total | 10,265 (86.1%) | 1,653 (13.9%) |
Health Insurance Coverage by Citizenship Status in Lawrence County
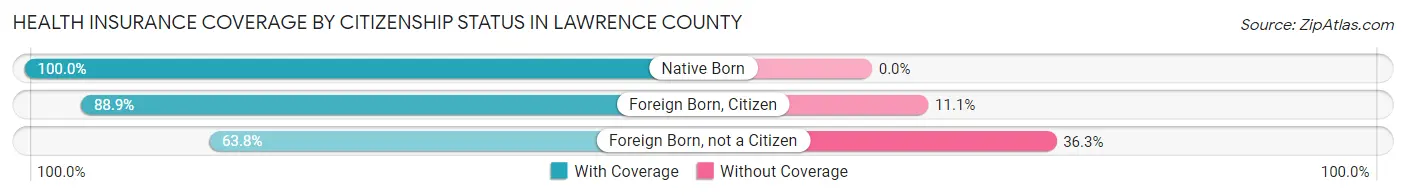
| Citizenship Status | With Coverage | Without Coverage |
| Native Born | 835 (100.0%) | 0 (0.0%) |
| Foreign Born, Citizen | 2,095 (88.9%) | 261 (11.1%) |
| Foreign Born, not a Citizen | 524 (63.7%) | 298 (36.2%) |
Health Insurance Coverage by Household Income in Lawrence County

| Household Income | With Coverage | Without Coverage |
| Under $25,000 | 2,147 (81.7%) | 481 (18.3%) |
| $25,000 to $49,999 | 2,808 (82.5%) | 597 (17.5%) |
| $50,000 to $74,999 | 1,891 (84.0%) | 359 (16.0%) |
| $75,000 to $99,999 | 1,183 (97.1%) | 35 (2.9%) |
| $100,000 and over | 2,236 (92.5%) | 181 (7.5%) |
Public vs Private Health Insurance Coverage by Age in Lawrence County

| Age Bracket | Public Insurance | Private Insurance |
| Under 6 | 489 (58.6%) | 368 (44.1%) |
| 6 to 18 Years | 1,301 (55.2%) | 960 (40.7%) |
| 19 to 25 Years | 141 (17.2%) | 399 (48.5%) |
| 25 to 34 Years | 213 (19.5%) | 624 (57.2%) |
| 35 to 44 Years | 204 (14.1%) | 932 (64.3%) |
| 45 to 54 Years | 324 (21.9%) | 967 (65.3%) |
| 55 to 64 Years | 551 (33.3%) | 1,027 (62.1%) |
| 65 to 74 Years | 1,384 (98.0%) | 800 (56.6%) |
| 75 Years and over | 796 (97.3%) | 554 (67.7%) |
| Total | 5,403 (45.3%) | 6,631 (55.6%) |
Disability Status by Sex by Age in Lawrence County
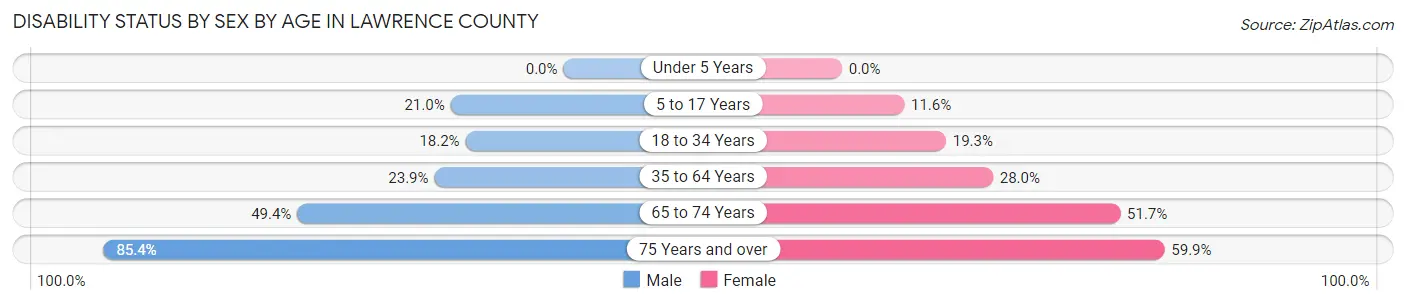
| Age Bracket | Male | Female |
| Under 5 Years | 0 (0.0%) | 0 (0.0%) |
| 5 to 17 Years | 246 (20.9%) | 127 (11.6%) |
| 18 to 34 Years | 175 (18.2%) | 219 (19.3%) |
| 35 to 64 Years | 542 (23.9%) | 650 (28.0%) |
| 65 to 74 Years | 327 (49.4%) | 388 (51.7%) |
| 75 Years and over | 309 (85.4%) | 273 (59.9%) |
Disability Class by Sex by Age in Lawrence County
Disability Class: Hearing Difficulty

| Age Bracket | Male | Female |
| Under 5 Years | 0 (0.0%) | 0 (0.0%) |
| 5 to 17 Years | 6 (0.5%) | 0 (0.0%) |
| 18 to 34 Years | 28 (2.9%) | 0 (0.0%) |
| 35 to 64 Years | 214 (9.5%) | 27 (1.2%) |
| 65 to 74 Years | 112 (16.9%) | 127 (16.9%) |
| 75 Years and over | 185 (51.1%) | 93 (20.4%) |
Disability Class: Vision Difficulty

| Age Bracket | Male | Female |
| Under 5 Years | 0 (0.0%) | 0 (0.0%) |
| 5 to 17 Years | 79 (6.7%) | 44 (4.0%) |
| 18 to 34 Years | 28 (2.9%) | 95 (8.4%) |
| 35 to 64 Years | 155 (6.9%) | 239 (10.3%) |
| 65 to 74 Years | 107 (16.2%) | 160 (21.3%) |
| 75 Years and over | 54 (14.9%) | 50 (11.0%) |
Disability Class: Cognitive Difficulty

| Age Bracket | Male | Female |
| 5 to 17 Years | 130 (11.1%) | 79 (7.2%) |
| 18 to 34 Years | 175 (18.2%) | 138 (12.2%) |
| 35 to 64 Years | 186 (8.2%) | 220 (9.5%) |
| 65 to 74 Years | 122 (18.4%) | 146 (19.4%) |
| 75 Years and over | 118 (32.6%) | 135 (29.6%) |
Disability Class: Ambulatory Difficulty

| Age Bracket | Male | Female |
| 5 to 17 Years | 16 (1.4%) | 0 (0.0%) |
| 18 to 34 Years | 0 (0.0%) | 82 (7.2%) |
| 35 to 64 Years | 194 (8.6%) | 250 (10.8%) |
| 65 to 74 Years | 170 (25.7%) | 250 (33.3%) |
| 75 Years and over | 173 (47.8%) | 151 (33.1%) |
Disability Class: Self-Care Difficulty
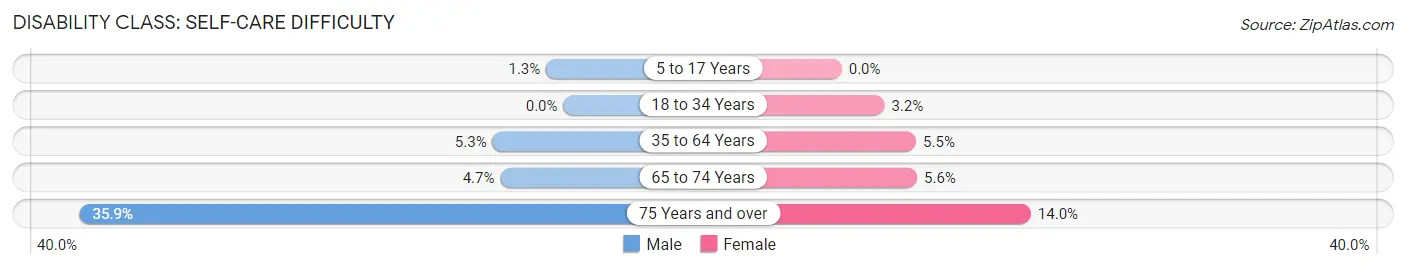
| Age Bracket | Male | Female |
| 5 to 17 Years | 15 (1.3%) | 0 (0.0%) |
| 18 to 34 Years | 0 (0.0%) | 36 (3.2%) |
| 35 to 64 Years | 119 (5.3%) | 128 (5.5%) |
| 65 to 74 Years | 31 (4.7%) | 42 (5.6%) |
| 75 Years and over | 130 (35.9%) | 64 (14.0%) |
Technology Access in Lawrence County
Computing Device Access in Lawrence County

| Device Type | # Households | % Households |
| Desktop or Laptop | 2,512 | 56.2% |
| Smartphone | 3,332 | 74.5% |
| Tablet | 1,450 | 32.4% |
| No Computing Device | 688 | 15.4% |
| Total | 4,473 | 100.0% |
Internet Access in Lawrence County

| Internet Type | # Households | % Households |
| Dial-Up Internet | 0 | 0.0% |
| Broadband Home | 1,229 | 27.5% |
| Cellular Data Only | 994 | 22.2% |
| Satellite Internet | 504 | 11.3% |
| No Internet | 1,819 | 40.7% |
| Total | 4,473 | 100.0% |
Lawrence County Summary
Lawrence County, Mississippi is located in the southeastern corner of the state, bordered by the state of Alabama to the east and the state of Tennessee to the north. The county seat is Monticello, and the county is part of the Jackson Metropolitan Statistical Area. As of the 2010 census, the population of Lawrence County was 12,929, making it the second least populous county in Mississippi.
Geography
Lawrence County is located in the southeastern corner of Mississippi, bordered by the state of Alabama to the east and the state of Tennessee to the north. The county is situated in the hills of the Appalachian Mountains, and is part of the Black Belt region of the state. The county is mostly rural, with the majority of the land being used for agriculture. The county is drained by the Pearl River, which flows through the county from north to south. The county has a total area of 576 square miles, of which 574 square miles is land and 2 square miles is water.
History
Lawrence County was established in 1809, and was named for James Lawrence, a naval hero of the War of 1812. The county was originally part of the Choctaw Nation, and was later ceded to the United States in the Treaty of Dancing Rabbit Creek in 1830. The county was largely agricultural, with cotton being the main crop. The county was also home to several sawmills and gristmills, which provided lumber and grain for the local population.
During the Civil War, Lawrence County was a Confederate stronghold, and was the site of several battles. After the war, the county was largely agricultural, with cotton being the main crop. The county was also home to several sawmills and gristmills, which provided lumber and grain for the local population.
Economy
The economy of Lawrence County is largely based on agriculture, with cotton being the main crop. Other crops grown in the county include corn, soybeans, and wheat. The county is also home to several sawmills and gristmills, which provide lumber and grain for the local population.
The county is also home to several manufacturing companies, including a furniture factory, a paper mill, and a plastics plant. The county is also home to several retail stores, including a Walmart Supercenter, a Lowe’s Home Improvement store, and several other smaller stores.
Demographics
As of the 2010 census, the population of Lawrence County was 12,929, with a population density of 22.6 people per square mile. The racial makeup of the county was 79.2% White, 18.3% African American, 0.3% Native American, 0.2% Asian, 0.1% Pacific Islander, 0.7% from other races, and 1.4% from two or more races. Hispanic or Latino of any race were 1.7% of the population.
The median income for a household in the county was $30,945, and the median income for a family was $37,945. The per capita income for the county was $15,945. About 19.2% of the population was below the poverty line.
Conclusion
Lawrence County, Mississippi is located in the southeastern corner of the state, bordered by the state of Alabama to the east and the state of Tennessee to the north. The county was established in 1809, and was named for James Lawrence, a naval hero of the War of 1812. The county is mostly rural, with the majority of the land being used for agriculture. The economy of Lawrence County is largely based on agriculture, with cotton being the main crop. As of the 2010 census, the population of Lawrence County was 12,929, with a population density of 22.6 people per square mile. The racial makeup of the county was 79.2% White, 18.3% African American, 0.3% Native American, 0.2% Asian, 0.1% Pacific Islander, 0.7% from other races, and 1.4% from two or more races. The median income for a household in the county was $30,945, and the median income for a family was $37,945. Lawrence County is a rural county with a diverse economy and a rich history.
Common Questions
What is the Total Population of Lawrence County?
Total Population of Lawrence County is 11,933.
What is the Total Male Population of Lawrence County?
Total Male Population of Lawrence County is 5,840.
What is the Total Female Population of Lawrence County?
Total Female Population of Lawrence County is 6,093.
What is the Ratio of Males per 100 Females in Lawrence County?
There are 95.85 Males per 100 Females in Lawrence County.
What is the Ratio of Females per 100 Males in Lawrence County?
There are 104.33 Females per 100 Males in Lawrence County.
What is the Median Population Age in Lawrence County?
Median Population Age in Lawrence County is 41.1 Years.
What is the Average Family Size in Lawrence County
Average Family Size in Lawrence County is 3.4 People.
What is the Average Household Size in Lawrence County
Average Household Size in Lawrence County is 2.7 People.
What is Per Capita Income in Lawrence County?
Per Capita income in Lawrence County is $24,809.
What is the Median Family Income in Lawrence County?
Median Family Income in Lawrence County is $52,156.
What is the Median Household income in Lawrence County?
Median Household Income in Lawrence County is $41,096.
What is Income or Wage Gap in Lawrence County?
Income or Wage Gap in Lawrence County is 36.7%.
Women in Lawrence County earn 63.3 cents for every dollar earned by a man.
What is Inequality or Gini Index in Lawrence County?
Inequality or Gini Index in Lawrence County is 0.46.
How Large is the Labor Force in Lawrence County?
There are 4,616 People in the Labor Forcein in Lawrence County.
What is the Percentage of People in the Labor Force in Lawrence County?
50.0% of People are in the Labor Force in Lawrence County.
What is the Unemployment Rate in Lawrence County?
Unemployment Rate in Lawrence County is 12.0%.