Lamar County, MS
Lamar County Map
Lamar County Overview
64,425
TOTAL POPULATION
30,879
MALE POPULATION
33,546
FEMALE POPULATION
92.05
MALES / 100 FEMALES
108.64
FEMALES / 100 MALES
37.3
MEDIAN AGE
3.0
AVG FAMILY SIZE
2.6
AVG HOUSEHOLD SIZE
$37,681
PER CAPITA INCOME
$80,562
AVG FAMILY INCOME
$67,972
AVG HOUSEHOLD INCOME
38.5%
WAGE / INCOME GAP [ % ]
61.5¢/ $1
WAGE / INCOME GAP [ $ ]
$12,728
FAMILY INCOME DEFICIT
0.47
INEQUALITY / GINI INDEX
32,447
LABOR FORCE [ PEOPLE ]
64.0%
PERCENT IN LABOR FORCE
5.8%
UNEMPLOYMENT RATE
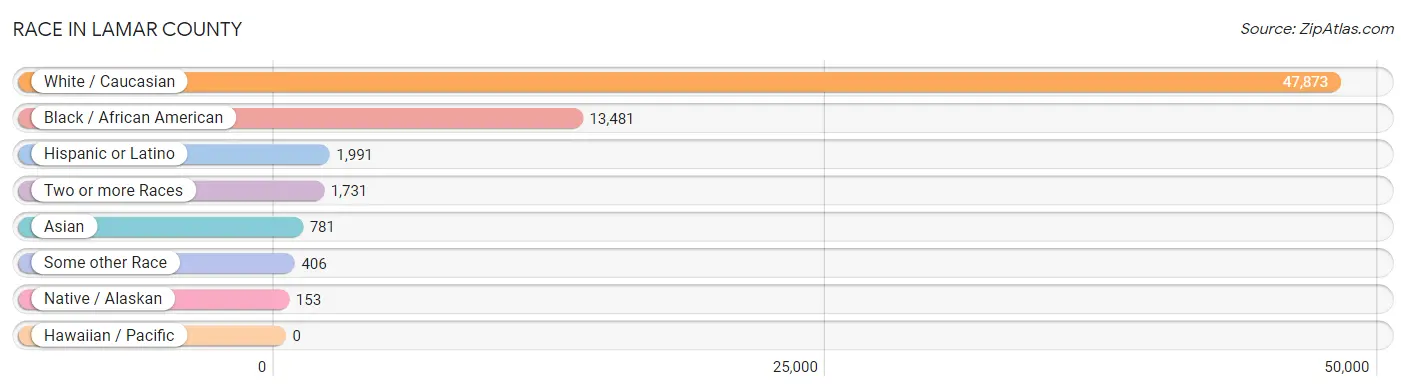
Race in Lamar County
The most populous races in Lamar County are White / Caucasian (47,873 | 74.3%), Black / African American (13,481 | 20.9%), and Hispanic or Latino (1,991 | 3.1%).
| Race | # Population | % Population |
| Asian | 781 | 1.2% |
| Black / African American | 13,481 | 20.9% |
| Hawaiian / Pacific | 0 | 0.0% |
| Hispanic or Latino | 1,991 | 3.1% |
| Native / Alaskan | 153 | 0.2% |
| White / Caucasian | 47,873 | 74.3% |
| Two or more Races | 1,731 | 2.7% |
| Some other Race | 406 | 0.6% |
| Total | 64,425 | 100.0% |
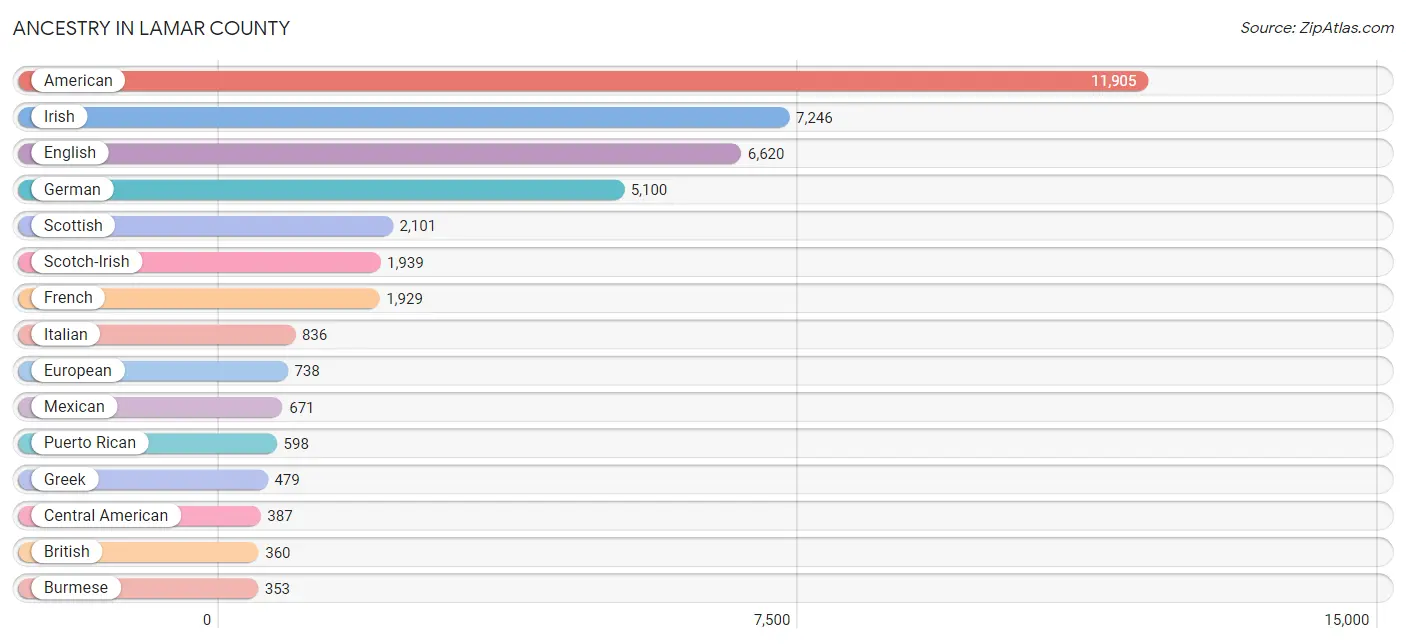
Ancestry in Lamar County
The most populous ancestries reported in Lamar County are American (11,905 | 18.5%), Irish (7,246 | 11.3%), English (6,620 | 10.3%), German (5,100 | 7.9%), and Scottish (2,101 | 3.3%), together accounting for 51.2% of all Lamar County residents.
| Ancestry | # Population | % Population |
| African | 183 | 0.3% |
| American | 11,905 | 18.5% |
| Arab | 271 | 0.4% |
| Armenian | 42 | 0.1% |
| Australian | 39 | 0.1% |
| Bhutanese | 90 | 0.1% |
| Blackfeet | 37 | 0.1% |
| Brazilian | 49 | 0.1% |
| British | 360 | 0.6% |
| Burmese | 353 | 0.5% |
| Cajun | 246 | 0.4% |
| Canadian | 25 | 0.0% |
| Central American | 387 | 0.6% |
| Cherokee | 221 | 0.3% |
| Cheyenne | 2 | 0.0% |
| Choctaw | 72 | 0.1% |
| Colombian | 18 | 0.0% |
| Costa Rican | 18 | 0.0% |
| Croatian | 39 | 0.1% |
| Cuban | 42 | 0.1% |
| Czech | 5 | 0.0% |
| Danish | 116 | 0.2% |
| Dutch | 257 | 0.4% |
| Dutch West Indian | 49 | 0.1% |
| Eastern European | 10 | 0.0% |
| English | 6,620 | 10.3% |
| European | 738 | 1.1% |
| French | 1,929 | 3.0% |
| French American Indian | 23 | 0.0% |
| French Canadian | 214 | 0.3% |
| German | 5,100 | 7.9% |
| Greek | 479 | 0.7% |
| Guatemalan | 328 | 0.5% |
| Hungarian | 92 | 0.1% |
| Icelander | 60 | 0.1% |
| Indian (Asian) | 104 | 0.2% |
| Iranian | 13 | 0.0% |
| Irish | 7,246 | 11.3% |
| Italian | 836 | 1.3% |
| Jamaican | 67 | 0.1% |
| Korean | 158 | 0.3% |
| Lebanese | 67 | 0.1% |
| Maltese | 18 | 0.0% |
| Mexican | 671 | 1.0% |
| Native Hawaiian | 52 | 0.1% |
| Nicaraguan | 35 | 0.1% |
| Northern European | 296 | 0.5% |
| Norwegian | 322 | 0.5% |
| Pennsylvania German | 6 | 0.0% |
| Polish | 219 | 0.3% |
| Pueblo | 3 | 0.0% |
| Puerto Rican | 598 | 0.9% |
| Romanian | 16 | 0.0% |
| Russian | 187 | 0.3% |
| Salvadoran | 6 | 0.0% |
| Scandinavian | 103 | 0.2% |
| Scotch-Irish | 1,939 | 3.0% |
| Scottish | 2,101 | 3.3% |
| Slavic | 10 | 0.0% |
| South American | 18 | 0.0% |
| Spaniard | 66 | 0.1% |
| Spanish | 128 | 0.2% |
| Sri Lankan | 288 | 0.4% |
| Subsaharan African | 183 | 0.3% |
| Swedish | 306 | 0.5% |
| Swiss | 24 | 0.0% |
| Thai | 231 | 0.4% |
| Ukrainian | 23 | 0.0% |
| Welsh | 320 | 0.5% | View All 69 Rows |
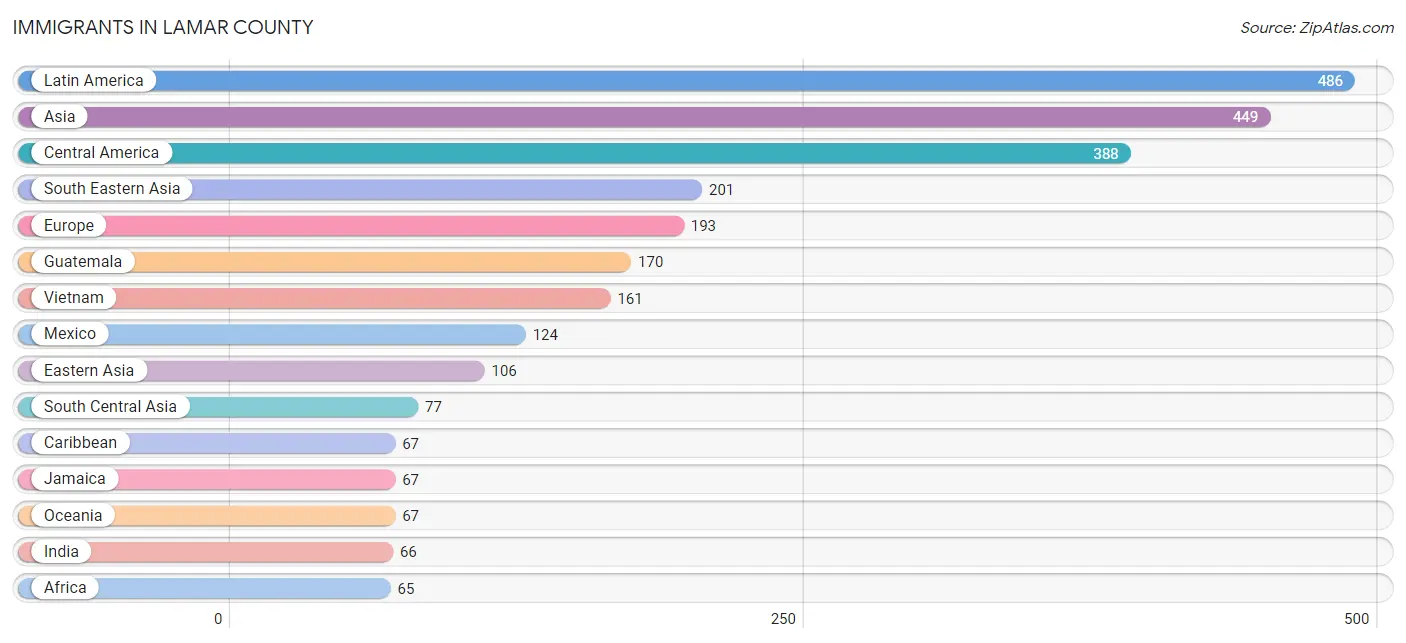
Immigrants in Lamar County
The most numerous immigrant groups reported in Lamar County came from Latin America (486 | 0.7%), Asia (449 | 0.7%), Central America (388 | 0.6%), South Eastern Asia (201 | 0.3%), and Europe (193 | 0.3%), together accounting for 2.7% of all Lamar County residents.
| Immigration Origin | # Population | % Population |
| Africa | 65 | 0.1% |
| Asia | 449 | 0.7% |
| Australia | 39 | 0.1% |
| Bangladesh | 5 | 0.0% |
| Brazil | 13 | 0.0% |
| Canada | 59 | 0.1% |
| Caribbean | 67 | 0.1% |
| Central America | 388 | 0.6% |
| China | 43 | 0.1% |
| Colombia | 18 | 0.0% |
| Costa Rica | 18 | 0.0% |
| Eastern Africa | 7 | 0.0% |
| Eastern Asia | 106 | 0.2% |
| Eastern Europe | 48 | 0.1% |
| Europe | 193 | 0.3% |
| France | 5 | 0.0% |
| Germany | 50 | 0.1% |
| Ghana | 46 | 0.1% |
| Guatemala | 170 | 0.3% |
| Honduras | 41 | 0.1% |
| Hungary | 25 | 0.0% |
| India | 66 | 0.1% |
| Italy | 39 | 0.1% |
| Jamaica | 67 | 0.1% |
| Japan | 31 | 0.1% |
| Korea | 32 | 0.1% |
| Latin America | 486 | 0.7% |
| Mexico | 124 | 0.2% |
| Nicaragua | 35 | 0.1% |
| Northern Europe | 51 | 0.1% |
| Oceania | 67 | 0.1% |
| Pakistan | 6 | 0.0% |
| Philippines | 40 | 0.1% |
| South Africa | 12 | 0.0% |
| South America | 31 | 0.1% |
| South Central Asia | 77 | 0.1% |
| South Eastern Asia | 201 | 0.3% |
| Southern Europe | 39 | 0.1% |
| Uganda | 7 | 0.0% |
| Ukraine | 23 | 0.0% |
| Vietnam | 161 | 0.3% |
| Western Africa | 46 | 0.1% |
| Western Asia | 60 | 0.1% |
| Western Europe | 55 | 0.1% |
| Yemen | 60 | 0.1% | View All 45 Rows |
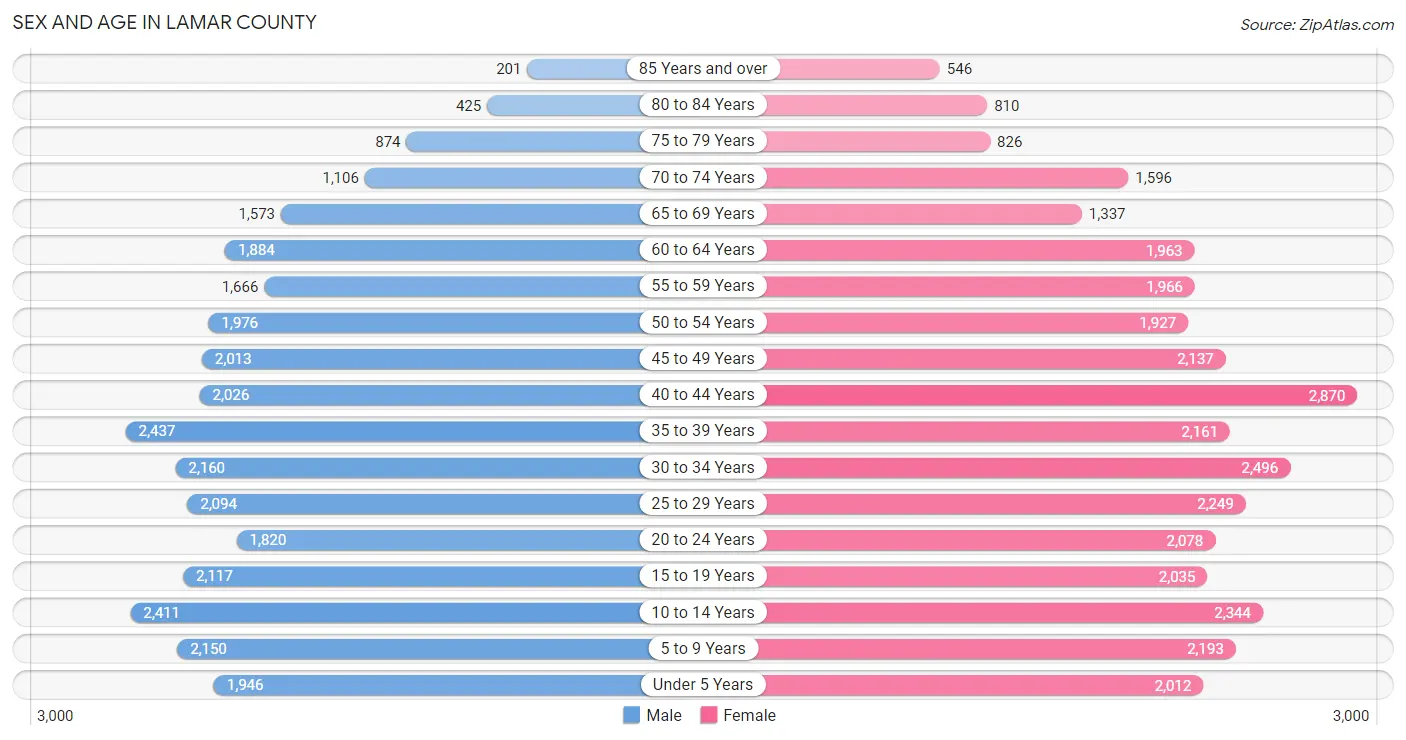
Sex and Age in Lamar County
Sex and Age in Lamar County
The most populous age groups in Lamar County are 35 to 39 Years (2,437 | 7.9%) for men and 40 to 44 Years (2,870 | 8.6%) for women.
| Age Bracket | Male | Female |
| Under 5 Years | 1,946 (6.3%) | 2,012 (6.0%) |
| 5 to 9 Years | 2,150 (7.0%) | 2,193 (6.5%) |
| 10 to 14 Years | 2,411 (7.8%) | 2,344 (7.0%) |
| 15 to 19 Years | 2,117 (6.9%) | 2,035 (6.1%) |
| 20 to 24 Years | 1,820 (5.9%) | 2,078 (6.2%) |
| 25 to 29 Years | 2,094 (6.8%) | 2,249 (6.7%) |
| 30 to 34 Years | 2,160 (7.0%) | 2,496 (7.4%) |
| 35 to 39 Years | 2,437 (7.9%) | 2,161 (6.4%) |
| 40 to 44 Years | 2,026 (6.6%) | 2,870 (8.6%) |
| 45 to 49 Years | 2,013 (6.5%) | 2,137 (6.4%) |
| 50 to 54 Years | 1,976 (6.4%) | 1,927 (5.7%) |
| 55 to 59 Years | 1,666 (5.4%) | 1,966 (5.9%) |
| 60 to 64 Years | 1,884 (6.1%) | 1,963 (5.9%) |
| 65 to 69 Years | 1,573 (5.1%) | 1,337 (4.0%) |
| 70 to 74 Years | 1,106 (3.6%) | 1,596 (4.8%) |
| 75 to 79 Years | 874 (2.8%) | 826 (2.5%) |
| 80 to 84 Years | 425 (1.4%) | 810 (2.4%) |
| 85 Years and over | 201 (0.6%) | 546 (1.6%) |
| Total | 30,879 (100.0%) | 33,546 (100.0%) |
Families and Households in Lamar County
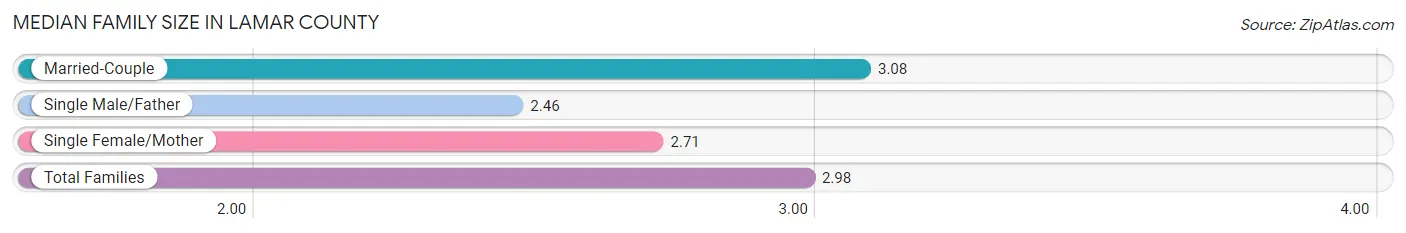
Median Family Size in Lamar County
The median family size in Lamar County is 2.98 persons per family, with married-couple families (13,638 | 76.3%) accounting for the largest median family size of 3.08 persons per family. On the other hand, single male/father families (773 | 4.3%) represent the smallest median family size with 2.46 persons per family.
| Family Type | # Families | Family Size |
| Married-Couple | 13,638 (76.3%) | 3.08 |
| Single Male/Father | 773 (4.3%) | 2.46 |
| Single Female/Mother | 3,466 (19.4%) | 2.71 |
| Total Families | 17,877 (100.0%) | 2.98 |
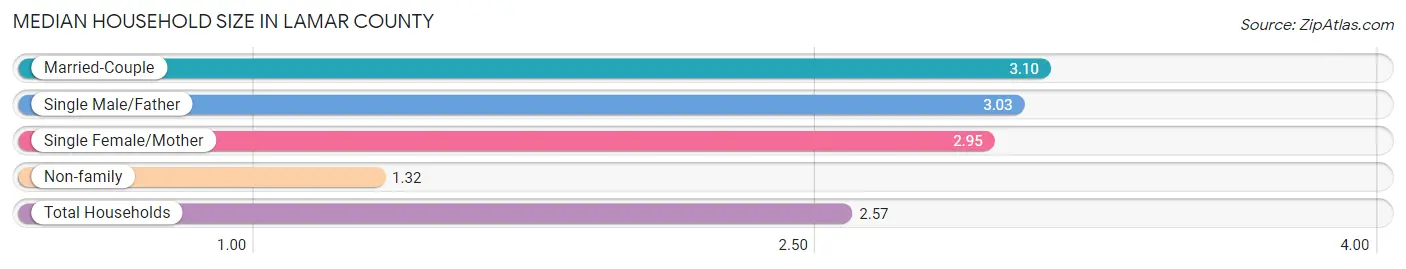
Median Household Size in Lamar County
The median household size in Lamar County is 2.57 persons per household, with married-couple households (13,638 | 54.8%) accounting for the largest median household size of 3.1 persons per household. non-family households (7,019 | 28.2%) represent the smallest median household size with 1.32 persons per household.
| Household Type | # Households | Household Size |
| Married-Couple | 13,638 (54.8%) | 3.10 |
| Single Male/Father | 773 (3.1%) | 3.03 |
| Single Female/Mother | 3,466 (13.9%) | 2.95 |
| Non-family | 7,019 (28.2%) | 1.32 |
| Total Households | 24,896 (100.0%) | 2.57 |
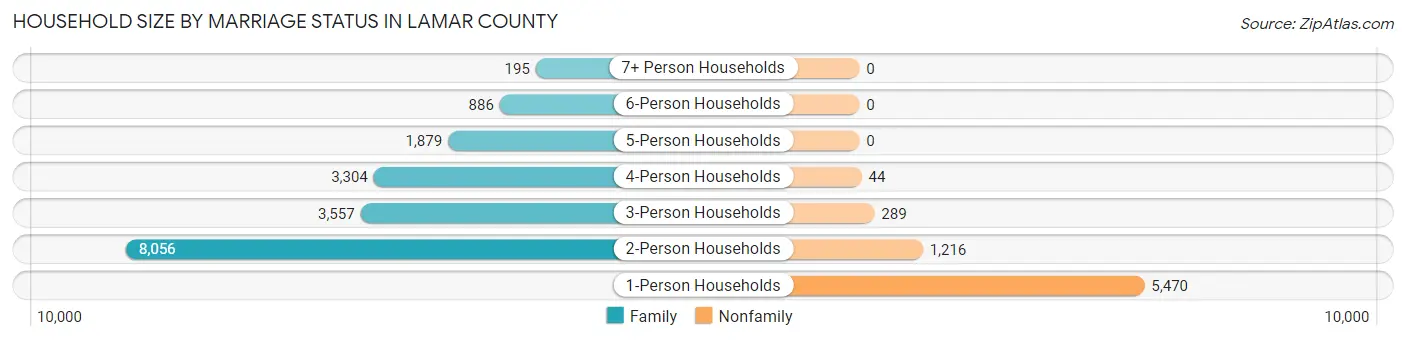
Household Size by Marriage Status in Lamar County
Out of a total of 24,896 households in Lamar County, 17,877 (71.8%) are family households, while 7,019 (28.2%) are nonfamily households. The most numerous type of family households are 2-person households, comprising 8,056, and the most common type of nonfamily households are 1-person households, comprising 5,470.
| Household Size | Family Households | Nonfamily Households |
| 1-Person Households | - | 5,470 (22.0%) |
| 2-Person Households | 8,056 (32.4%) | 1,216 (4.9%) |
| 3-Person Households | 3,557 (14.3%) | 289 (1.2%) |
| 4-Person Households | 3,304 (13.3%) | 44 (0.2%) |
| 5-Person Households | 1,879 (7.5%) | 0 (0.0%) |
| 6-Person Households | 886 (3.6%) | 0 (0.0%) |
| 7+ Person Households | 195 (0.8%) | 0 (0.0%) |
| Total | 17,877 (71.8%) | 7,019 (28.2%) |
Female Fertility in Lamar County
Fertility by Age in Lamar County
Average fertility rate in Lamar County is 46.0 births per 1,000 women. Women in the age bracket of 20 to 34 years have the highest fertility rate with 85.0 births per 1,000 women. Women in the age bracket of 20 to 34 years acount for 76.8% of all women with births.
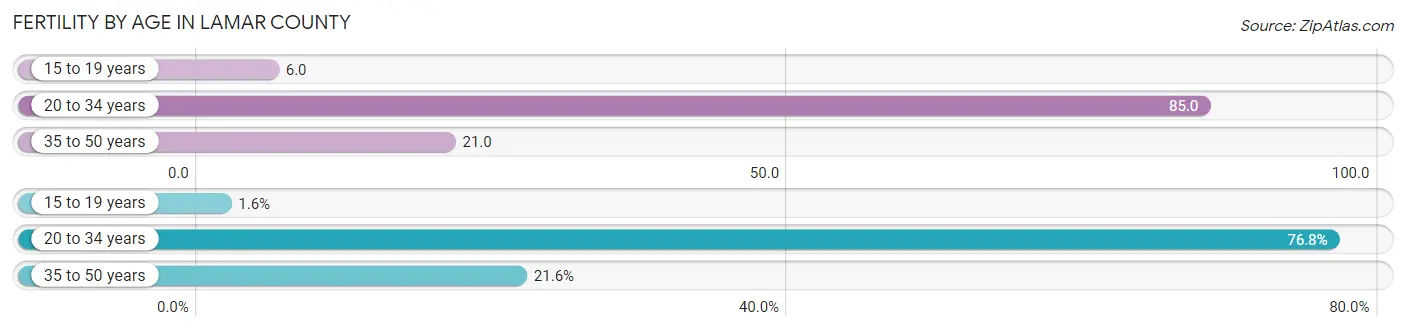
| Age Bracket | Women with Births | Births / 1,000 Women |
| 15 to 19 years | 12 (1.6%) | 6.0 |
| 20 to 34 years | 582 (76.8%) | 85.0 |
| 35 to 50 years | 164 (21.6%) | 21.0 |
| Total | 758 (100.0%) | 46.0 |
Fertility by Age by Marriage Status in Lamar County
92.2% of women with births (758) in Lamar County are married. The highest percentage of unmarried women with births falls into 15 to 19 years age bracket with 100.0% of them unmarried at the time of birth, while the lowest percentage of unmarried women with births belong to 35 to 50 years age bracket with 0.0% of them unmarried.
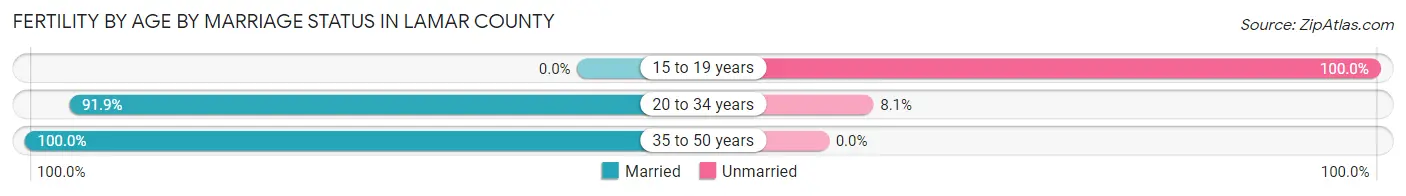
| Age Bracket | Married | Unmarried |
| 15 to 19 years | 0 (0.0%) | 12 (100.0%) |
| 20 to 34 years | 535 (91.9%) | 47 (8.1%) |
| 35 to 50 years | 164 (100.0%) | 0 (0.0%) |
| Total | 699 (92.2%) | 59 (7.8%) |
Fertility by Education in Lamar County
Average fertility rate in Lamar County is 46.0 births per 1,000 women. Women with the education attainment of college or associate's degree have the highest fertility rate of 62.0 births per 1,000 women, while women with the education attainment of less than high school have the lowest fertility at 13.0 births per 1,000 women. Women with the education attainment of college or associate's degree represent 46.3% of all women with births.
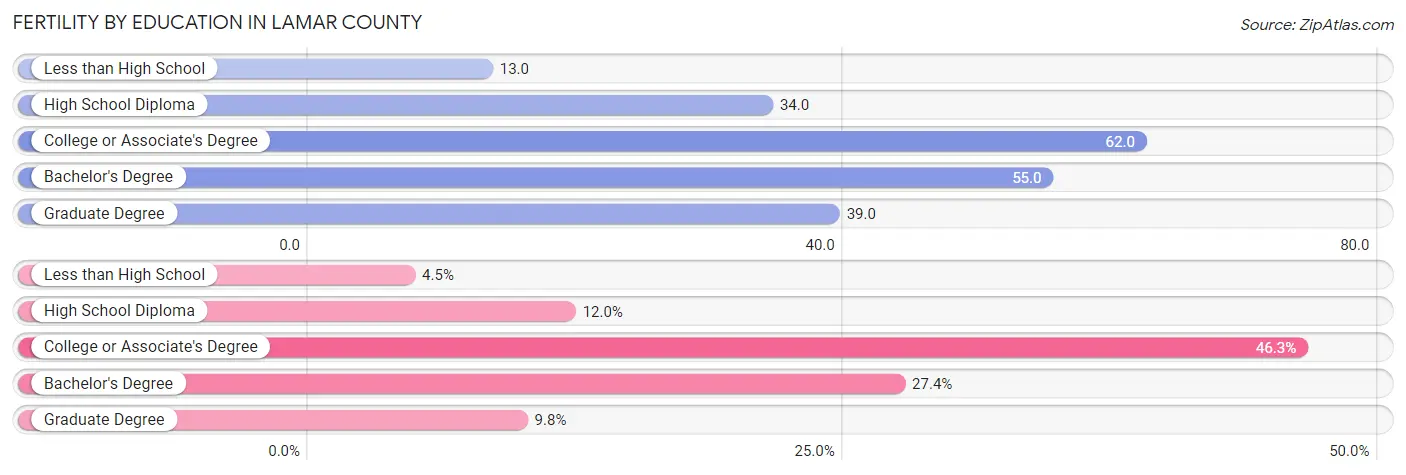
| Educational Attainment | Women with Births | Births / 1,000 Women |
| Less than High School | 34 (4.5%) | 13.0 |
| High School Diploma | 91 (12.0%) | 34.0 |
| College or Associate's Degree | 351 (46.3%) | 62.0 |
| Bachelor's Degree | 208 (27.4%) | 55.0 |
| Graduate Degree | 74 (9.8%) | 39.0 |
| Total | 758 (100.0%) | 46.0 |
Fertility by Education by Marriage Status in Lamar County
7.8% of women with births in Lamar County are unmarried. Women with the educational attainment of less than high school are most likely to be married with 100.0% of them married at childbirth, while women with the educational attainment of high school diploma are least likely to be married with 41.8% of them unmarried at childbirth.
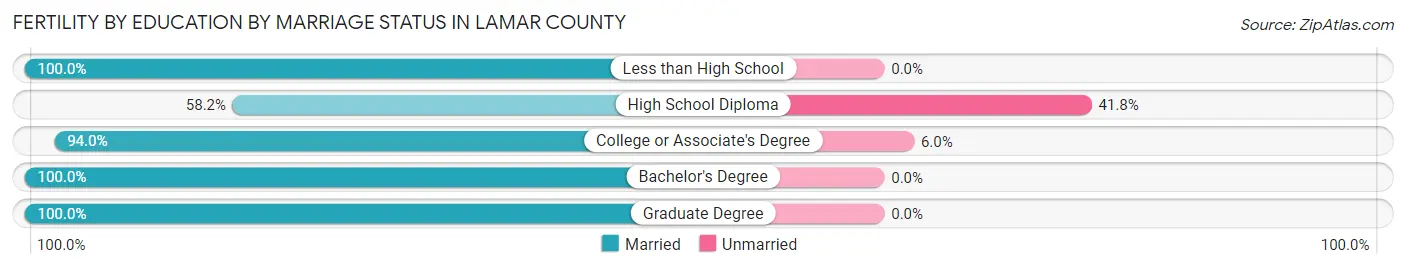
| Educational Attainment | Married | Unmarried |
| Less than High School | 34 (100.0%) | 0 (0.0%) |
| High School Diploma | 53 (58.2%) | 38 (41.8%) |
| College or Associate's Degree | 330 (94.0%) | 21 (6.0%) |
| Bachelor's Degree | 208 (100.0%) | 0 (0.0%) |
| Graduate Degree | 74 (100.0%) | 0 (0.0%) |
| Total | 699 (92.2%) | 59 (7.8%) |
Income in Lamar County
Income Overview in Lamar County
Per Capita Income in Lamar County is $37,681, while median incomes of families and households are $80,562 and $67,972 respectively.
| Characteristic | Number | Measure |
| Per Capita Income | 64,425 | $37,681 |
| Median Family Income | 17,877 | $80,562 |
| Mean Family Income | 17,877 | $110,487 |
| Median Household Income | 24,896 | $67,972 |
| Mean Household Income | 24,896 | $94,973 |
| Income Deficit | 17,877 | $12,728 |
| Wage / Income Gap (%) | 64,425 | 38.47% |
| Wage / Income Gap ($) | 64,425 | 61.53¢ per $1 |
| Gini / Inequality Index | 64,425 | 0.47 |
Earnings by Sex in Lamar County
Average Earnings in Lamar County are $41,238, $50,460 for men and $31,046 for women, a difference of 38.5%.
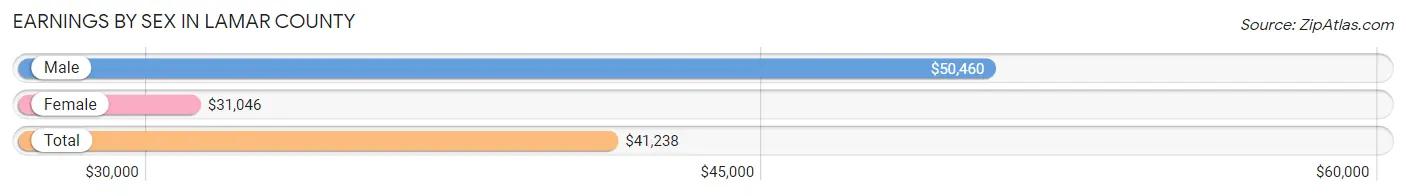
| Sex | Number | Average Earnings |
| Male | 17,173 (51.1%) | $50,460 |
| Female | 16,419 (48.9%) | $31,046 |
| Total | 33,592 (100.0%) | $41,238 |
Earnings by Sex by Income Bracket in Lamar County
The most common earnings brackets in Lamar County are $100,000+ for men (3,062 | 17.8%) and $25,000 to $29,999 for women (1,587 | 9.7%).
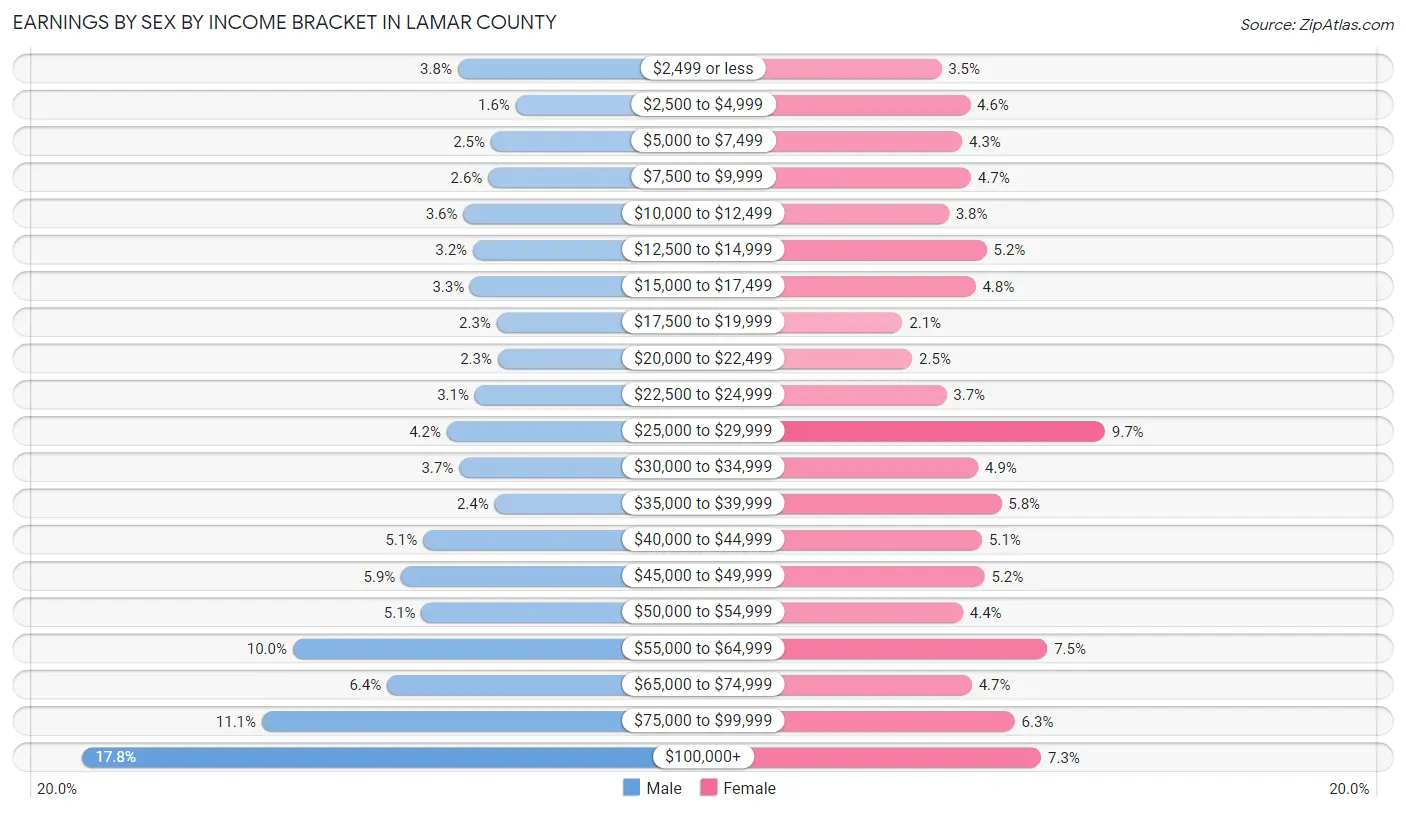
| Income | Male | Female |
| $2,499 or less | 647 (3.8%) | 582 (3.5%) |
| $2,500 to $4,999 | 275 (1.6%) | 758 (4.6%) |
| $5,000 to $7,499 | 435 (2.5%) | 710 (4.3%) |
| $7,500 to $9,999 | 452 (2.6%) | 763 (4.6%) |
| $10,000 to $12,499 | 611 (3.6%) | 628 (3.8%) |
| $12,500 to $14,999 | 549 (3.2%) | 861 (5.2%) |
| $15,000 to $17,499 | 569 (3.3%) | 792 (4.8%) |
| $17,500 to $19,999 | 396 (2.3%) | 342 (2.1%) |
| $20,000 to $22,499 | 389 (2.3%) | 402 (2.5%) |
| $22,500 to $24,999 | 538 (3.1%) | 613 (3.7%) |
| $25,000 to $29,999 | 718 (4.2%) | 1,587 (9.7%) |
| $30,000 to $34,999 | 639 (3.7%) | 808 (4.9%) |
| $35,000 to $39,999 | 411 (2.4%) | 950 (5.8%) |
| $40,000 to $44,999 | 870 (5.1%) | 833 (5.1%) |
| $45,000 to $49,999 | 1,012 (5.9%) | 848 (5.2%) |
| $50,000 to $54,999 | 881 (5.1%) | 714 (4.3%) |
| $55,000 to $64,999 | 1,709 (10.0%) | 1,233 (7.5%) |
| $65,000 to $74,999 | 1,102 (6.4%) | 768 (4.7%) |
| $75,000 to $99,999 | 1,908 (11.1%) | 1,032 (6.3%) |
| $100,000+ | 3,062 (17.8%) | 1,195 (7.3%) |
| Total | 17,173 (100.0%) | 16,419 (100.0%) |
Earnings by Sex by Educational Attainment in Lamar County
Average earnings in Lamar County are $55,310 for men and $36,637 for women, a difference of 33.8%. Men with an educational attainment of bachelor's degree enjoy the highest average annual earnings of $66,570, while those with less than high school education earn the least with $45,057. Women with an educational attainment of graduate degree earn the most with the average annual earnings of $58,569, while those with less than high school education have the smallest earnings of $8,862.
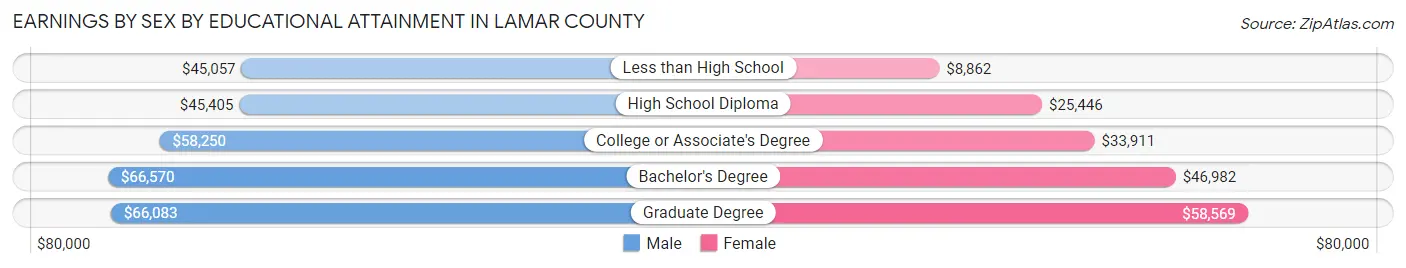
| Educational Attainment | Male Income | Female Income |
| Less than High School | $45,057 | $8,862 |
| High School Diploma | $45,405 | $25,446 |
| College or Associate's Degree | $58,250 | $33,911 |
| Bachelor's Degree | $66,570 | $46,982 |
| Graduate Degree | $66,083 | $58,569 |
| Total | $55,310 | $36,637 |
Family Income in Lamar County
Family Income Brackets in Lamar County
According to the Lamar County family income data, there are 3,486 families falling into the $100,000 to $149,999 income range, which is the most common income bracket and makes up 19.5% of all families. Conversely, the $10,000 to $14,999 income bracket is the least frequent group with only 340 families (1.9%) belonging to this category.
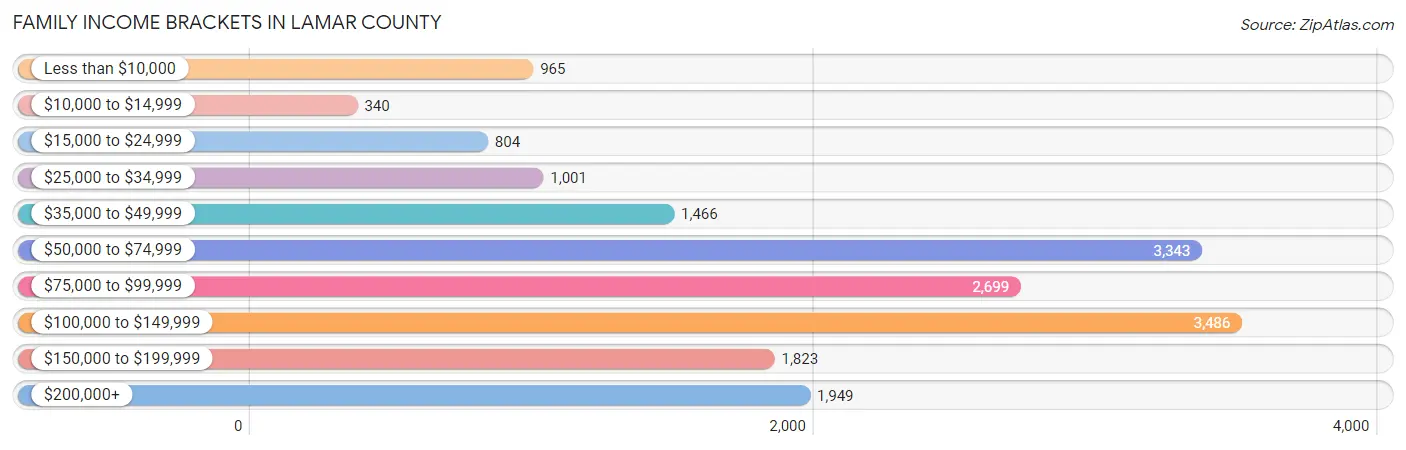
| Income Bracket | # Families | % Families |
| Less than $10,000 | 965 | 5.4% |
| $10,000 to $14,999 | 340 | 1.9% |
| $15,000 to $24,999 | 804 | 4.5% |
| $25,000 to $34,999 | 1,001 | 5.6% |
| $35,000 to $49,999 | 1,466 | 8.2% |
| $50,000 to $74,999 | 3,343 | 18.7% |
| $75,000 to $99,999 | 2,699 | 15.1% |
| $100,000 to $149,999 | 3,486 | 19.5% |
| $150,000 to $199,999 | 1,823 | 10.2% |
| $200,000+ | 1,949 | 10.9% |
Family Income by Famaliy Size in Lamar County
4-person families (3,110 | 17.4%) account for the highest median family income in Lamar County with $110,331 per family, while 2-person families (8,603 | 48.1%) have the highest median income of $39,432 per family member.
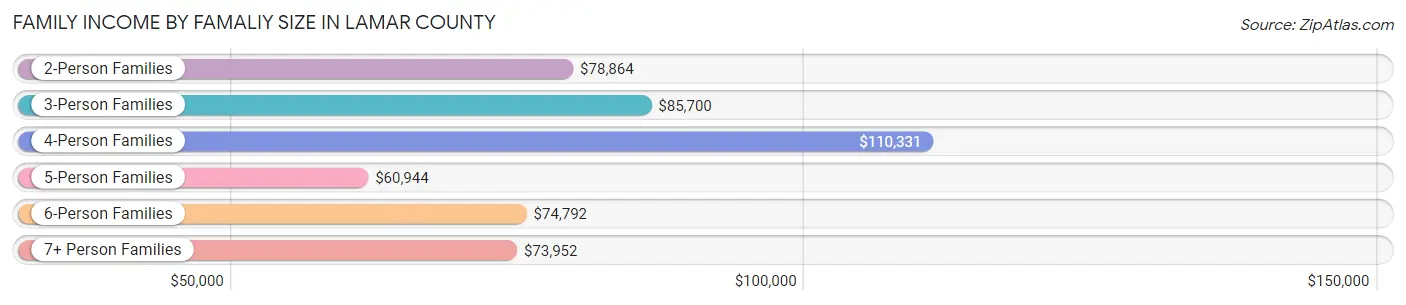
| Income Bracket | # Families | Median Income |
| 2-Person Families | 8,603 (48.1%) | $78,864 |
| 3-Person Families | 3,470 (19.4%) | $85,700 |
| 4-Person Families | 3,110 (17.4%) | $110,331 |
| 5-Person Families | 1,755 (9.8%) | $60,944 |
| 6-Person Families | 787 (4.4%) | $74,792 |
| 7+ Person Families | 152 (0.9%) | $73,952 |
| Total | 17,877 (100.0%) | $80,562 |
Family Income by Number of Earners in Lamar County
The median family income in Lamar County is $80,562, with families comprising 3+ earners (1,482) having the highest median family income of $123,714, while families with no earners (2,457) have the lowest median family income of $50,850, accounting for 8.3% and 13.7% of families, respectively.
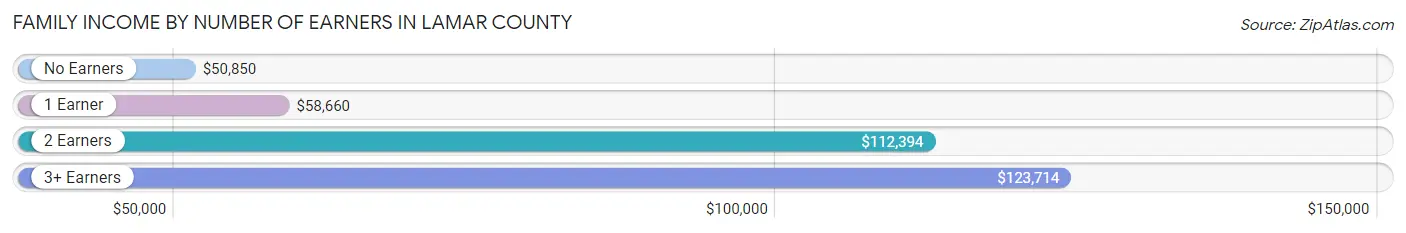
| Number of Earners | # Families | Median Income |
| No Earners | 2,457 (13.7%) | $50,850 |
| 1 Earner | 6,264 (35.0%) | $58,660 |
| 2 Earners | 7,674 (42.9%) | $112,394 |
| 3+ Earners | 1,482 (8.3%) | $123,714 |
| Total | 17,877 (100.0%) | $80,562 |
Household Income in Lamar County
Household Income Brackets in Lamar County
With 4,805 households falling in the category, the $50,000 to $74,999 income range is the most frequent in Lamar County, accounting for 19.3% of all households. In contrast, only 772 households (3.1%) fall into the $10,000 to $14,999 income bracket, making it the least populous group.
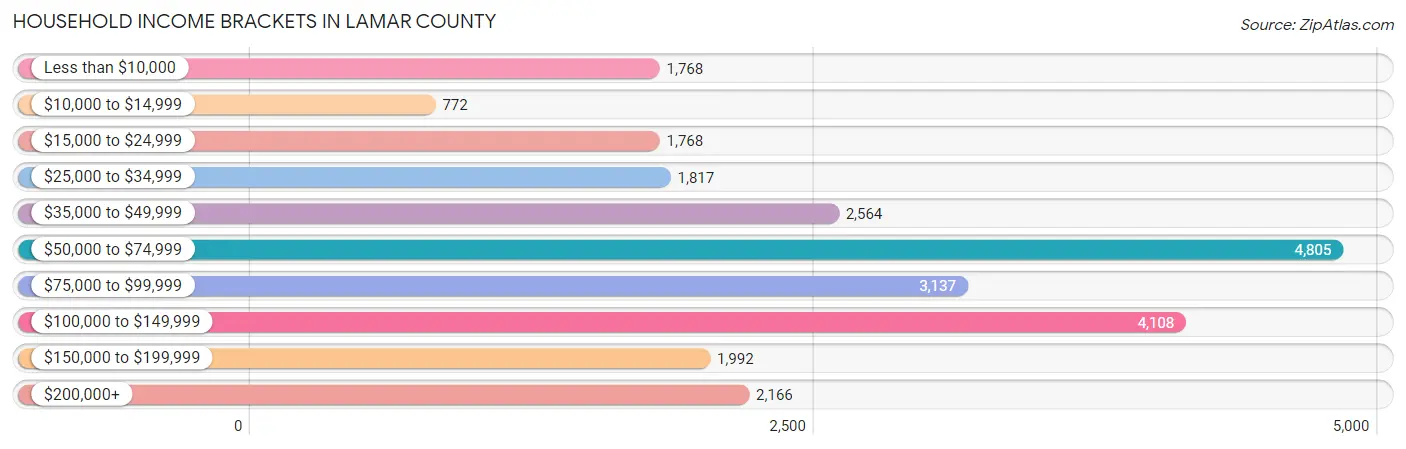
| Income Bracket | # Households | % Households |
| Less than $10,000 | 1,768 | 7.1% |
| $10,000 to $14,999 | 772 | 3.1% |
| $15,000 to $24,999 | 1,768 | 7.1% |
| $25,000 to $34,999 | 1,817 | 7.3% |
| $35,000 to $49,999 | 2,564 | 10.3% |
| $50,000 to $74,999 | 4,805 | 19.3% |
| $75,000 to $99,999 | 3,137 | 12.6% |
| $100,000 to $149,999 | 4,108 | 16.5% |
| $150,000 to $199,999 | 1,992 | 8.0% |
| $200,000+ | 2,166 | 8.7% |
Household Income by Householder Age in Lamar County
The median household income in Lamar County is $67,972, with the highest median household income of $85,897 found in the 45 to 64 years age bracket for the primary householder. A total of 8,516 households (34.2%) fall into this category. Meanwhile, the 15 to 24 years age bracket for the primary householder has the lowest median household income of $31,236, with 1,017 households (4.1%) in this group.
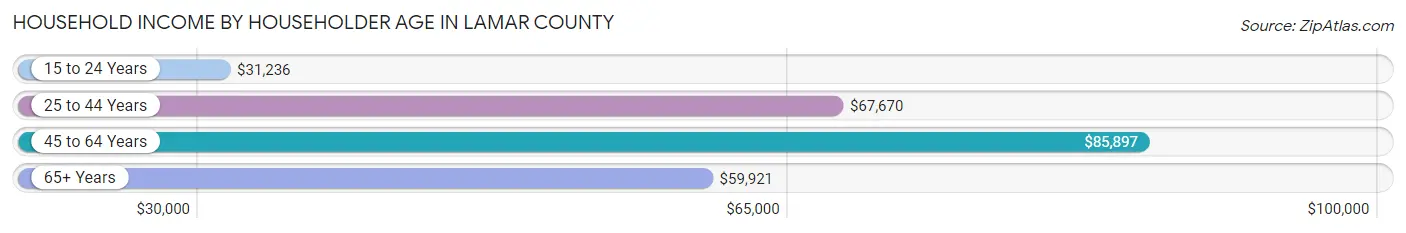
| Income Bracket | # Households | Median Income |
| 15 to 24 Years | 1,017 (4.1%) | $31,236 |
| 25 to 44 Years | 10,239 (41.1%) | $67,670 |
| 45 to 64 Years | 8,516 (34.2%) | $85,897 |
| 65+ Years | 5,124 (20.6%) | $59,921 |
| Total | 24,896 (100.0%) | $67,972 |
Poverty in Lamar County
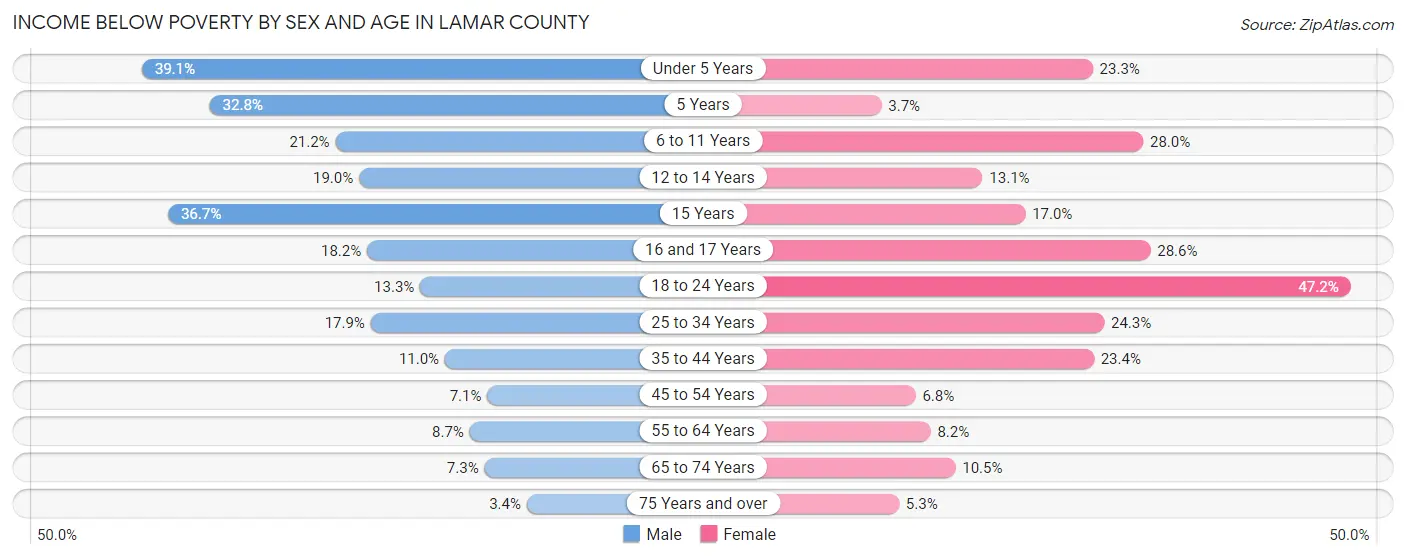
Income Below Poverty by Sex and Age in Lamar County
With 14.4% poverty level for males and 19.1% for females among the residents of Lamar County, under 5 year old males and 18 to 24 year old females are the most vulnerable to poverty, with 741 males (39.1%) and 1,307 females (47.2%) in their respective age groups living below the poverty level.
| Age Bracket | Male | Female |
| Under 5 Years | 741 (39.1%) | 443 (23.3%) |
| 5 Years | 129 (32.8%) | 19 (3.7%) |
| 6 to 11 Years | 579 (21.1%) | 681 (28.0%) |
| 12 to 14 Years | 262 (19.0%) | 203 (13.1%) |
| 15 Years | 102 (36.7%) | 65 (17.0%) |
| 16 and 17 Years | 193 (18.2%) | 272 (28.6%) |
| 18 to 24 Years | 343 (13.3%) | 1,307 (47.2%) |
| 25 to 34 Years | 756 (17.9%) | 1,155 (24.3%) |
| 35 to 44 Years | 487 (11.0%) | 1,171 (23.4%) |
| 45 to 54 Years | 281 (7.1%) | 278 (6.8%) |
| 55 to 64 Years | 308 (8.7%) | 322 (8.2%) |
| 65 to 74 Years | 195 (7.3%) | 308 (10.5%) |
| 75 Years and over | 50 (3.4%) | 109 (5.3%) |
| Total | 4,426 (14.4%) | 6,333 (19.1%) |
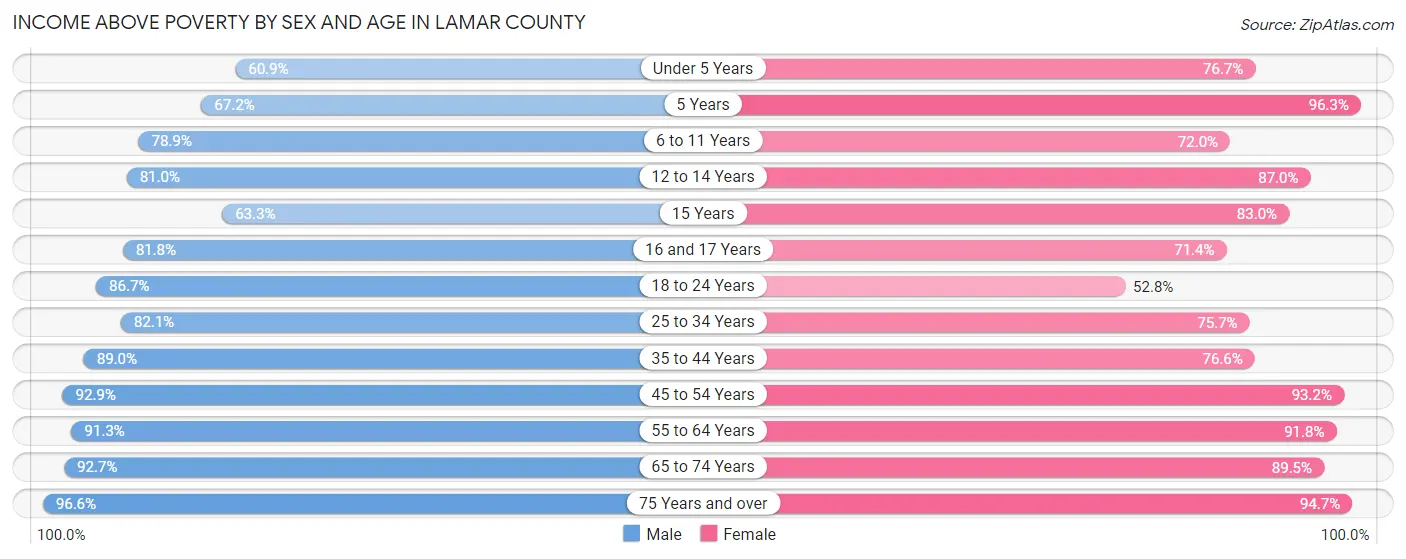
Income Above Poverty by Sex and Age in Lamar County
According to the poverty statistics in Lamar County, males aged 75 years and over and females aged 5 years are the age groups that are most secure financially, with 96.6% of males and 96.3% of females in these age groups living above the poverty line.
| Age Bracket | Male | Female |
| Under 5 Years | 1,153 (60.9%) | 1,460 (76.7%) |
| 5 Years | 264 (67.2%) | 499 (96.3%) |
| 6 to 11 Years | 2,159 (78.8%) | 1,755 (72.0%) |
| 12 to 14 Years | 1,120 (81.0%) | 1,352 (87.0%) |
| 15 Years | 176 (63.3%) | 317 (83.0%) |
| 16 and 17 Years | 866 (81.8%) | 678 (71.4%) |
| 18 to 24 Years | 2,238 (86.7%) | 1,461 (52.8%) |
| 25 to 34 Years | 3,472 (82.1%) | 3,590 (75.7%) |
| 35 to 44 Years | 3,945 (89.0%) | 3,837 (76.6%) |
| 45 to 54 Years | 3,697 (92.9%) | 3,786 (93.2%) |
| 55 to 64 Years | 3,238 (91.3%) | 3,590 (91.8%) |
| 65 to 74 Years | 2,470 (92.7%) | 2,616 (89.5%) |
| 75 Years and over | 1,423 (96.6%) | 1,948 (94.7%) |
| Total | 26,221 (85.6%) | 26,889 (80.9%) |
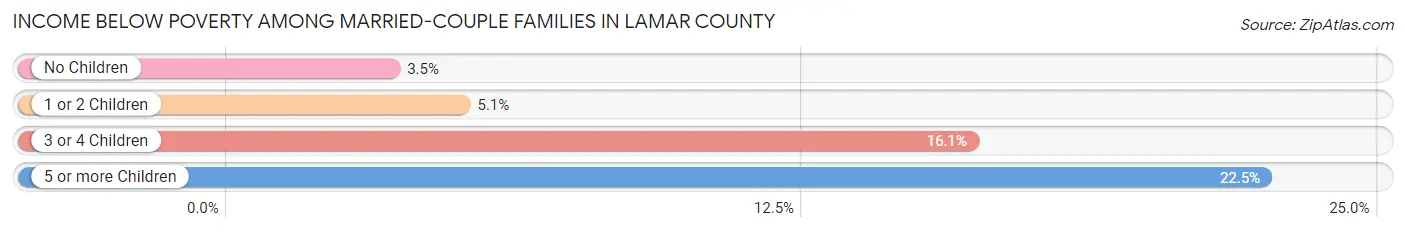
Income Below Poverty Among Married-Couple Families in Lamar County
The poverty statistics for married-couple families in Lamar County show that 5.6% or 761 of the total 13,638 families live below the poverty line. Families with 5 or more children have the highest poverty rate of 22.5%, comprising of 9 families. On the other hand, families with no children have the lowest poverty rate of 3.5%, which includes 264 families.
| Children | Above Poverty | Below Poverty |
| No Children | 7,225 (96.5%) | 264 (3.5%) |
| 1 or 2 Children | 4,263 (94.9%) | 227 (5.1%) |
| 3 or 4 Children | 1,358 (83.9%) | 261 (16.1%) |
| 5 or more Children | 31 (77.5%) | 9 (22.5%) |
| Total | 12,877 (94.4%) | 761 (5.6%) |
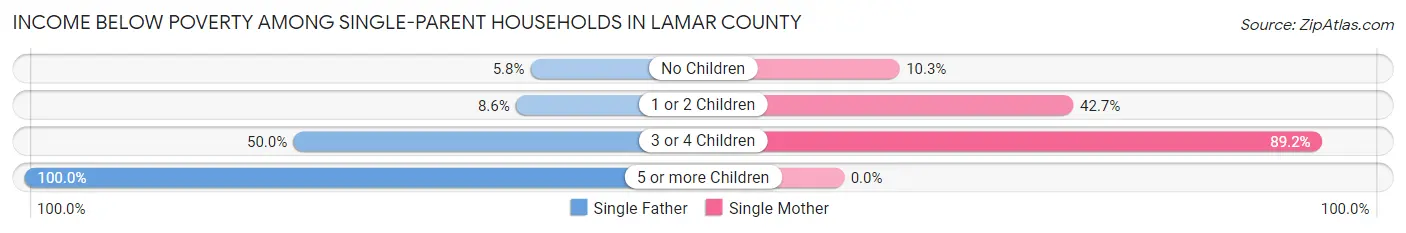
Income Below Poverty Among Single-Parent Households in Lamar County
According to the poverty data in Lamar County, 10.5% or 81 single-father households and 38.0% or 1,317 single-mother households are living below the poverty line. Among single-father households, those with 5 or more children have the highest poverty rate, with 5 households (100.0%) experiencing poverty. Likewise, among single-mother households, those with 3 or 4 children have the highest poverty rate, with 370 households (89.2%) falling below the poverty line.
| Children | Single Father | Single Mother |
| No Children | 15 (5.8%) | 114 (10.3%) |
| 1 or 2 Children | 40 (8.6%) | 833 (42.7%) |
| 3 or 4 Children | 21 (50.0%) | 370 (89.2%) |
| 5 or more Children | 5 (100.0%) | 0 (0.0%) |
| Total | 81 (10.5%) | 1,317 (38.0%) |
Income Below Poverty Among Married-Couple vs Single-Parent Households in Lamar County
The poverty data for Lamar County shows that 761 of the married-couple family households (5.6%) and 1,398 of the single-parent households (33.0%) are living below the poverty level. Within the married-couple family households, those with 5 or more children have the highest poverty rate, with 9 households (22.5%) falling below the poverty line. Among the single-parent households, those with 5 or more children have the highest poverty rate, with 5 household (100.0%) living below poverty.
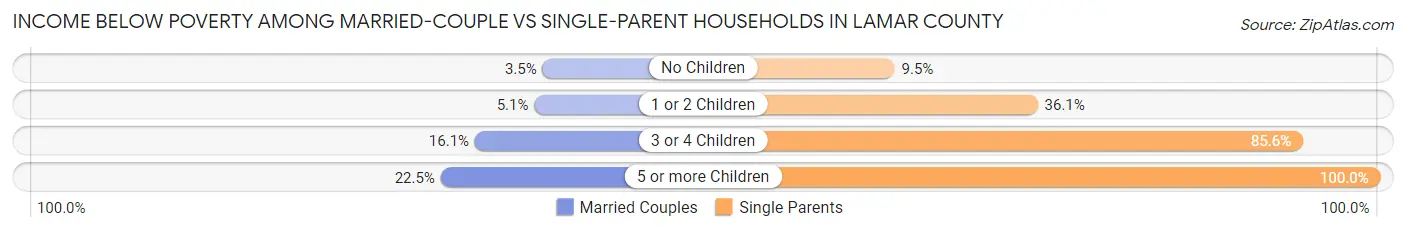
| Children | Married-Couple Families | Single-Parent Households |
| No Children | 264 (3.5%) | 129 (9.5%) |
| 1 or 2 Children | 227 (5.1%) | 873 (36.1%) |
| 3 or 4 Children | 261 (16.1%) | 391 (85.6%) |
| 5 or more Children | 9 (22.5%) | 5 (100.0%) |
| Total | 761 (5.6%) | 1,398 (33.0%) |
Employment Characteristics in Lamar County
Employment by Class of Employer in Lamar County
Among the 29,912 employed individuals in Lamar County, private company employees (19,596 | 65.5%), state government employees (2,451 | 8.2%), and local government employees (2,395 | 8.0%) make up the most common classes of employment.
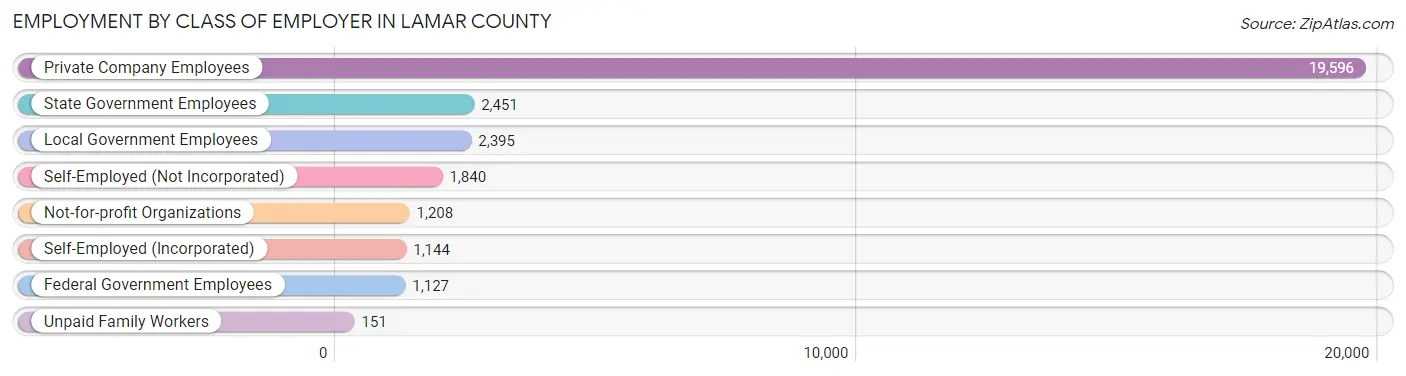
| Employer Class | # Employees | % Employees |
| Private Company Employees | 19,596 | 65.5% |
| Self-Employed (Incorporated) | 1,144 | 3.8% |
| Self-Employed (Not Incorporated) | 1,840 | 6.1% |
| Not-for-profit Organizations | 1,208 | 4.0% |
| Local Government Employees | 2,395 | 8.0% |
| State Government Employees | 2,451 | 8.2% |
| Federal Government Employees | 1,127 | 3.8% |
| Unpaid Family Workers | 151 | 0.5% |
| Total | 29,912 | 100.0% |
Employment Status by Age in Lamar County
According to the labor force statistics for Lamar County, out of the total population over 16 years of age (50,698), 64.0% or 32,447 individuals are in the labor force, with 5.8% or 1,882 of them unemployed. The age group with the highest labor force participation rate is 45 to 54 years, with 84.1% or 6,773 individuals in the labor force. Within the labor force, the 16 to 19 years age range has the highest percentage of unemployed individuals, with 24.2% or 225 of them being unemployed.
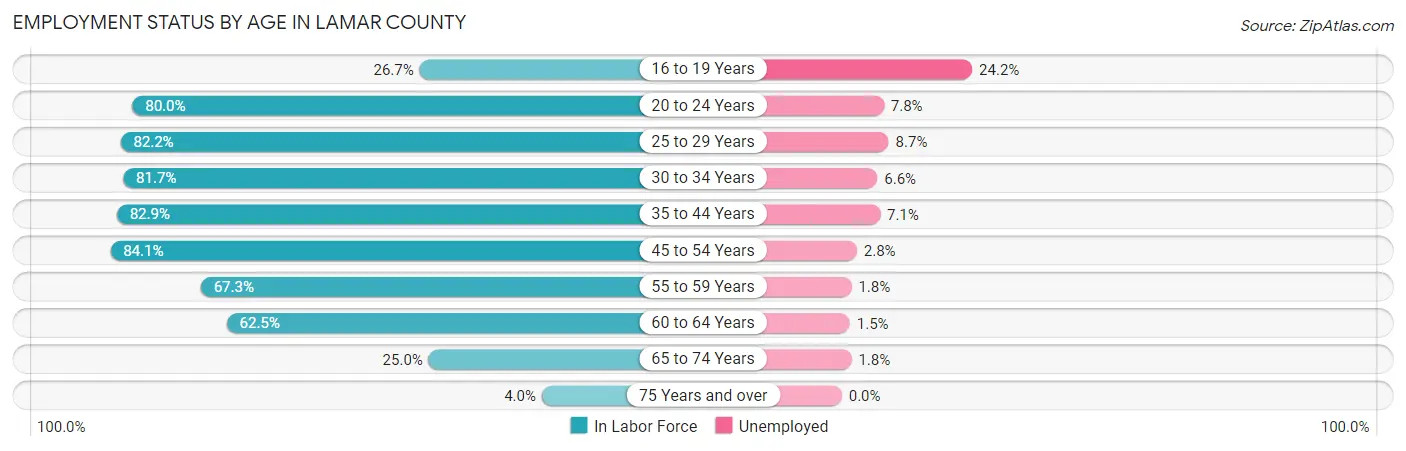
| Age Bracket | In Labor Force | Unemployed |
| 16 to 19 Years | 929 (26.7%) | 225 (24.2%) |
| 20 to 24 Years | 3,118 (80.0%) | 243 (7.8%) |
| 25 to 29 Years | 3,570 (82.2%) | 311 (8.7%) |
| 30 to 34 Years | 3,804 (81.7%) | 251 (6.6%) |
| 35 to 44 Years | 7,871 (82.9%) | 559 (7.1%) |
| 45 to 54 Years | 6,773 (84.1%) | 190 (2.8%) |
| 55 to 59 Years | 2,444 (67.3%) | 44 (1.8%) |
| 60 to 64 Years | 2,404 (62.5%) | 36 (1.5%) |
| 65 to 74 Years | 1,403 (25.0%) | 25 (1.8%) |
| 75 Years and over | 147 (4.0%) | 0 (0.0%) |
| Total | 32,447 (64.0%) | 1,882 (5.8%) |
Employment Status by Educational Attainment in Lamar County
According to labor force statistics for Lamar County, 79.0% of individuals (26,880) out of the total population between 25 and 64 years of age (34,025) are in the labor force, with 5.2% or 1,398 of them being unemployed. The group with the highest labor force participation rate are those with the educational attainment of bachelor's degree or higher, with 86.9% or 10,212 individuals in the labor force. Within the labor force, individuals with high school diploma education have the highest percentage of unemployment, with 11.3% or 680 of them being unemployed.
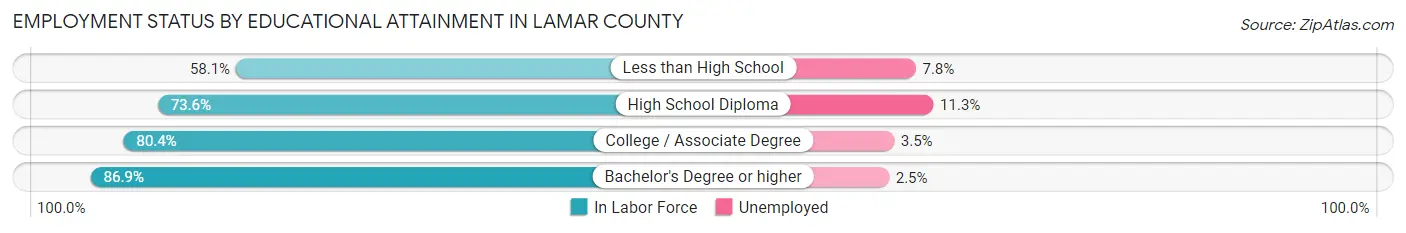
| Educational Attainment | In Labor Force | Unemployed |
| Less than High School | 1,816 (58.1%) | 244 (7.8%) |
| High School Diploma | 6,015 (73.6%) | 923 (11.3%) |
| College / Associate Degree | 8,825 (80.4%) | 384 (3.5%) |
| Bachelor's Degree or higher | 10,212 (86.9%) | 294 (2.5%) |
| Total | 26,880 (79.0%) | 1,769 (5.2%) |
Employment Occupations by Sex in Lamar County
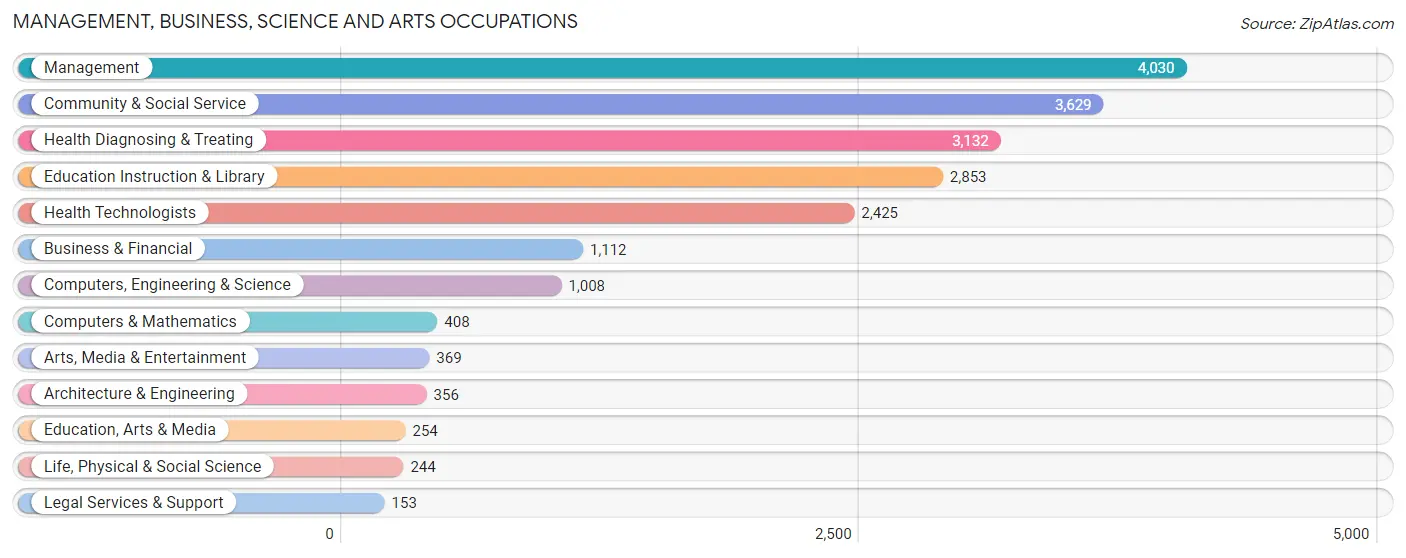
Management, Business, Science and Arts Occupations
The most common Management, Business, Science and Arts occupations in Lamar County are Management (4,030 | 13.4%), Community & Social Service (3,629 | 12.1%), Health Diagnosing & Treating (3,132 | 10.4%), Education Instruction & Library (2,853 | 9.5%), and Health Technologists (2,425 | 8.1%).
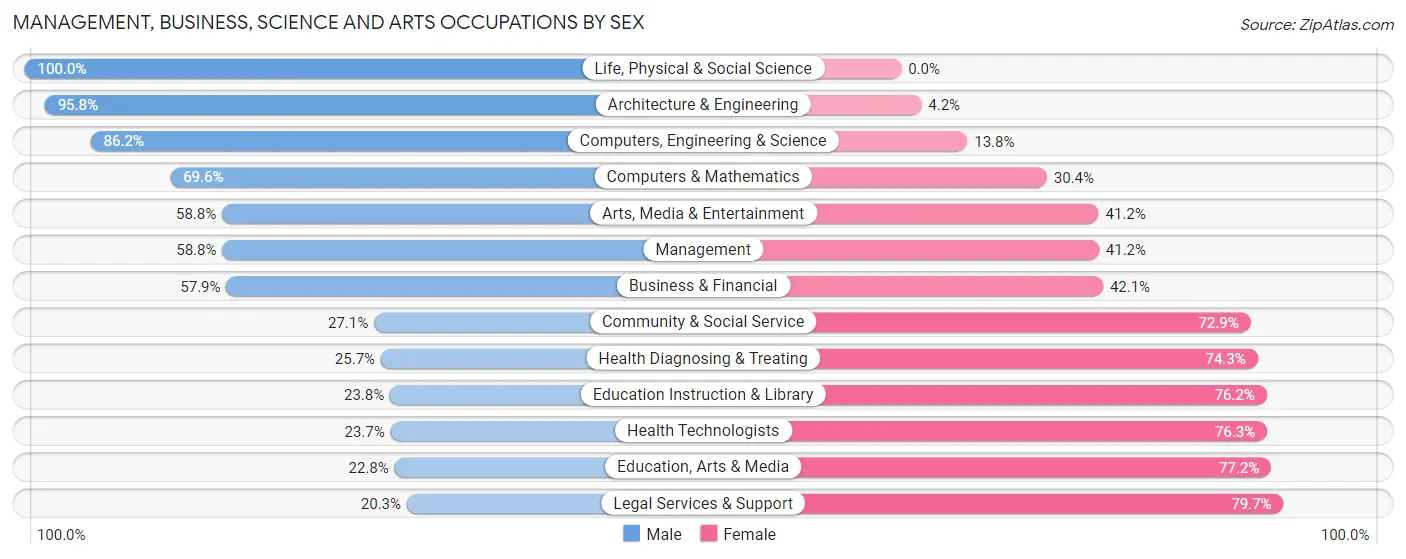
Management, Business, Science and Arts Occupations by Sex
Within the Management, Business, Science and Arts occupations in Lamar County, the most male-oriented occupations are Life, Physical & Social Science (100.0%), Architecture & Engineering (95.8%), and Computers, Engineering & Science (86.2%), while the most female-oriented occupations are Legal Services & Support (79.7%), Education, Arts & Media (77.2%), and Health Technologists (76.3%).
| Occupation | Male | Female |
| Management | 2,368 (58.8%) | 1,662 (41.2%) |
| Business & Financial | 644 (57.9%) | 468 (42.1%) |
| Computers, Engineering & Science | 869 (86.2%) | 139 (13.8%) |
| Computers & Mathematics | 284 (69.6%) | 124 (30.4%) |
| Architecture & Engineering | 341 (95.8%) | 15 (4.2%) |
| Life, Physical & Social Science | 244 (100.0%) | 0 (0.0%) |
| Community & Social Service | 984 (27.1%) | 2,645 (72.9%) |
| Education, Arts & Media | 58 (22.8%) | 196 (77.2%) |
| Legal Services & Support | 31 (20.3%) | 122 (79.7%) |
| Education Instruction & Library | 678 (23.8%) | 2,175 (76.2%) |
| Arts, Media & Entertainment | 217 (58.8%) | 152 (41.2%) |
| Health Diagnosing & Treating | 804 (25.7%) | 2,328 (74.3%) |
| Health Technologists | 574 (23.7%) | 1,851 (76.3%) |
| Total (Category) | 5,669 (43.9%) | 7,242 (56.1%) |
| Total (Overall) | 15,134 (50.3%) | 14,926 (49.6%) |
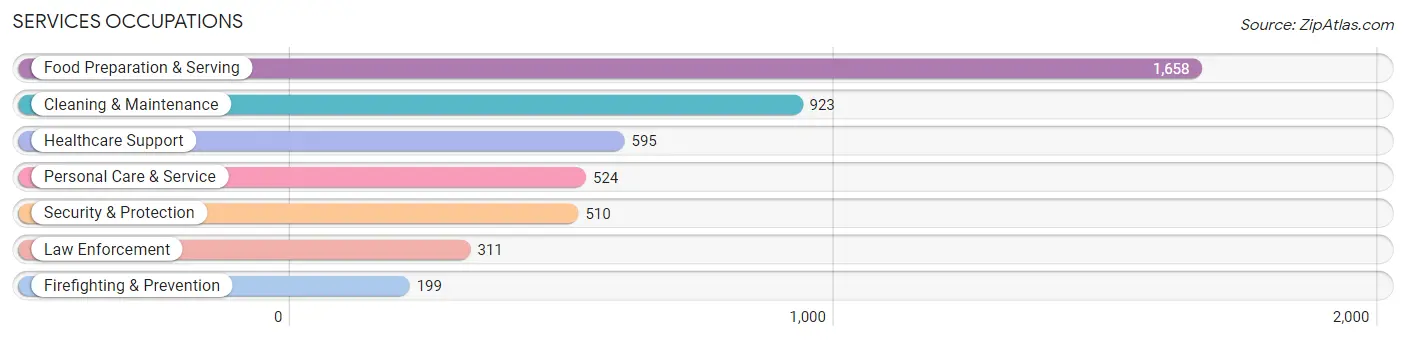
Services Occupations
The most common Services occupations in Lamar County are Food Preparation & Serving (1,658 | 5.5%), Cleaning & Maintenance (923 | 3.1%), Healthcare Support (595 | 2.0%), Personal Care & Service (524 | 1.7%), and Security & Protection (510 | 1.7%).
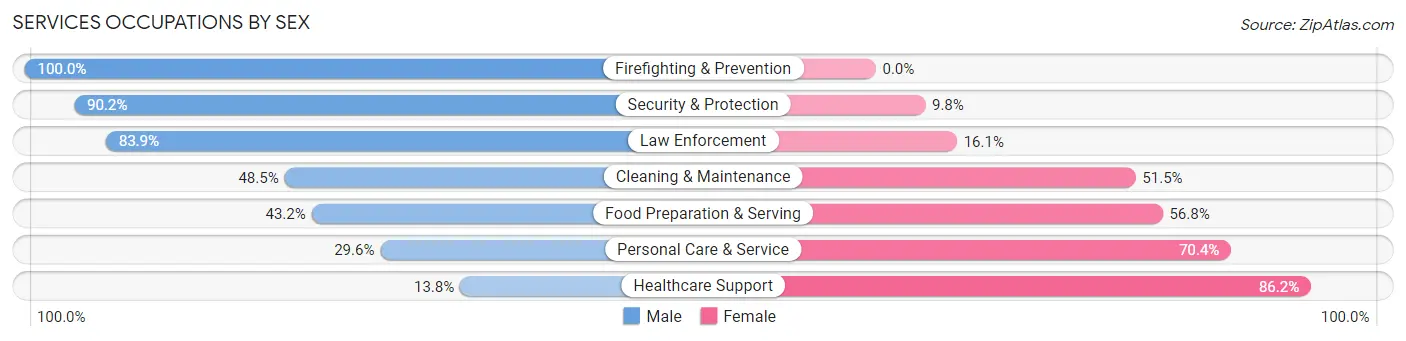
Services Occupations by Sex
Within the Services occupations in Lamar County, the most male-oriented occupations are Firefighting & Prevention (100.0%), Security & Protection (90.2%), and Law Enforcement (83.9%), while the most female-oriented occupations are Healthcare Support (86.2%), Personal Care & Service (70.4%), and Food Preparation & Serving (56.8%).
| Occupation | Male | Female |
| Healthcare Support | 82 (13.8%) | 513 (86.2%) |
| Security & Protection | 460 (90.2%) | 50 (9.8%) |
| Firefighting & Prevention | 199 (100.0%) | 0 (0.0%) |
| Law Enforcement | 261 (83.9%) | 50 (16.1%) |
| Food Preparation & Serving | 716 (43.2%) | 942 (56.8%) |
| Cleaning & Maintenance | 448 (48.5%) | 475 (51.5%) |
| Personal Care & Service | 155 (29.6%) | 369 (70.4%) |
| Total (Category) | 1,861 (44.2%) | 2,349 (55.8%) |
| Total (Overall) | 15,134 (50.3%) | 14,926 (49.6%) |
Sales and Office Occupations
The most common Sales and Office occupations in Lamar County are Office & Administration (3,210 | 10.7%), and Sales & Related (3,189 | 10.6%).

Sales and Office Occupations by Sex

| Occupation | Male | Female |
| Sales & Related | 1,205 (37.8%) | 1,984 (62.2%) |
| Office & Administration | 624 (19.4%) | 2,586 (80.6%) |
| Total (Category) | 1,829 (28.6%) | 4,570 (71.4%) |
| Total (Overall) | 15,134 (50.3%) | 14,926 (49.6%) |
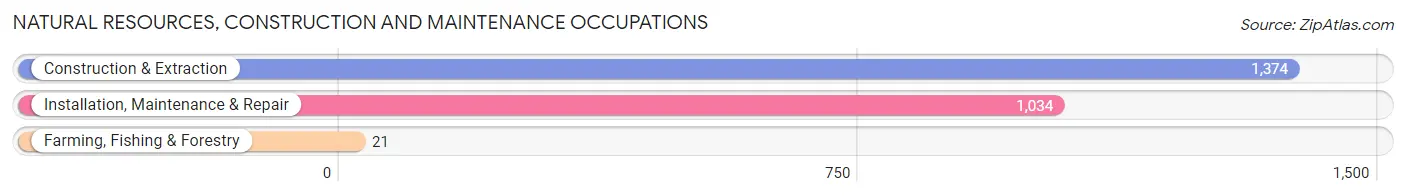
Natural Resources, Construction and Maintenance Occupations
The most common Natural Resources, Construction and Maintenance occupations in Lamar County are Construction & Extraction (1,374 | 4.6%), Installation, Maintenance & Repair (1,034 | 3.4%), and Farming, Fishing & Forestry (21 | 0.1%).
Natural Resources, Construction and Maintenance Occupations by Sex
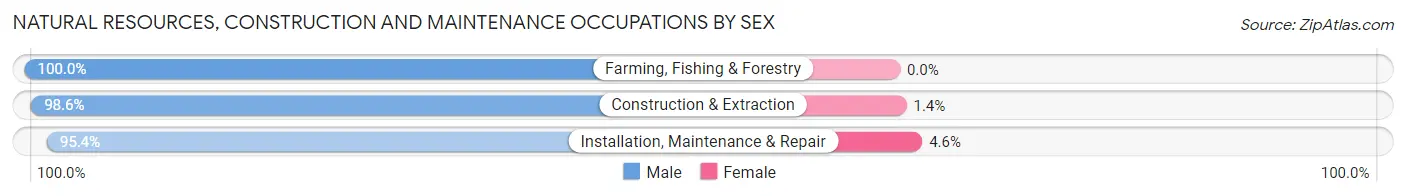
| Occupation | Male | Female |
| Farming, Fishing & Forestry | 21 (100.0%) | 0 (0.0%) |
| Construction & Extraction | 1,355 (98.6%) | 19 (1.4%) |
| Installation, Maintenance & Repair | 986 (95.4%) | 48 (4.6%) |
| Total (Category) | 2,362 (97.2%) | 67 (2.8%) |
| Total (Overall) | 15,134 (50.3%) | 14,926 (49.6%) |
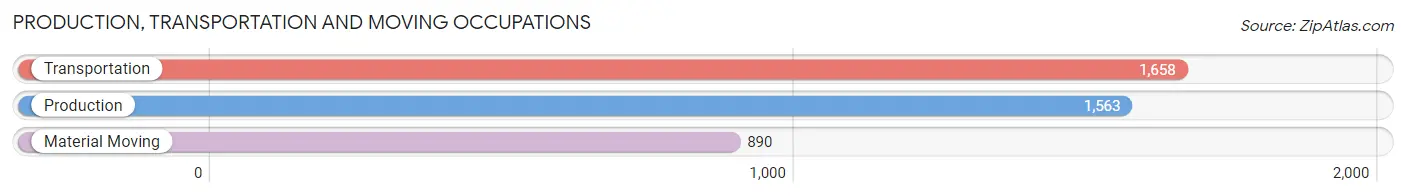
Production, Transportation and Moving Occupations
The most common Production, Transportation and Moving occupations in Lamar County are Transportation (1,658 | 5.5%), Production (1,563 | 5.2%), and Material Moving (890 | 3.0%).
Production, Transportation and Moving Occupations by Sex
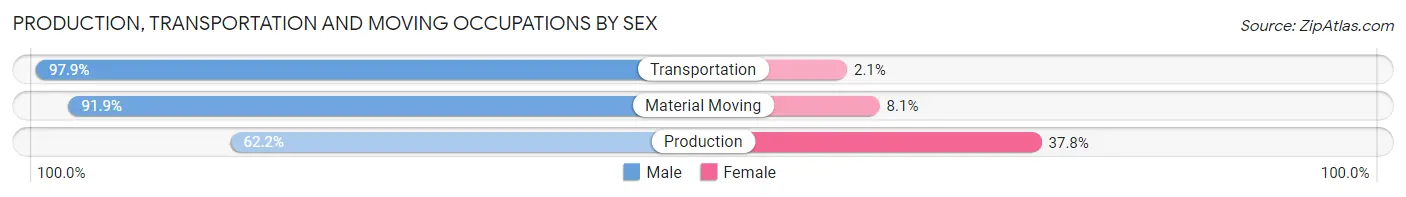
| Occupation | Male | Female |
| Production | 972 (62.2%) | 591 (37.8%) |
| Transportation | 1,623 (97.9%) | 35 (2.1%) |
| Material Moving | 818 (91.9%) | 72 (8.1%) |
| Total (Category) | 3,413 (83.0%) | 698 (17.0%) |
| Total (Overall) | 15,134 (50.3%) | 14,926 (49.6%) |
Employment Industries by Sex in Lamar County
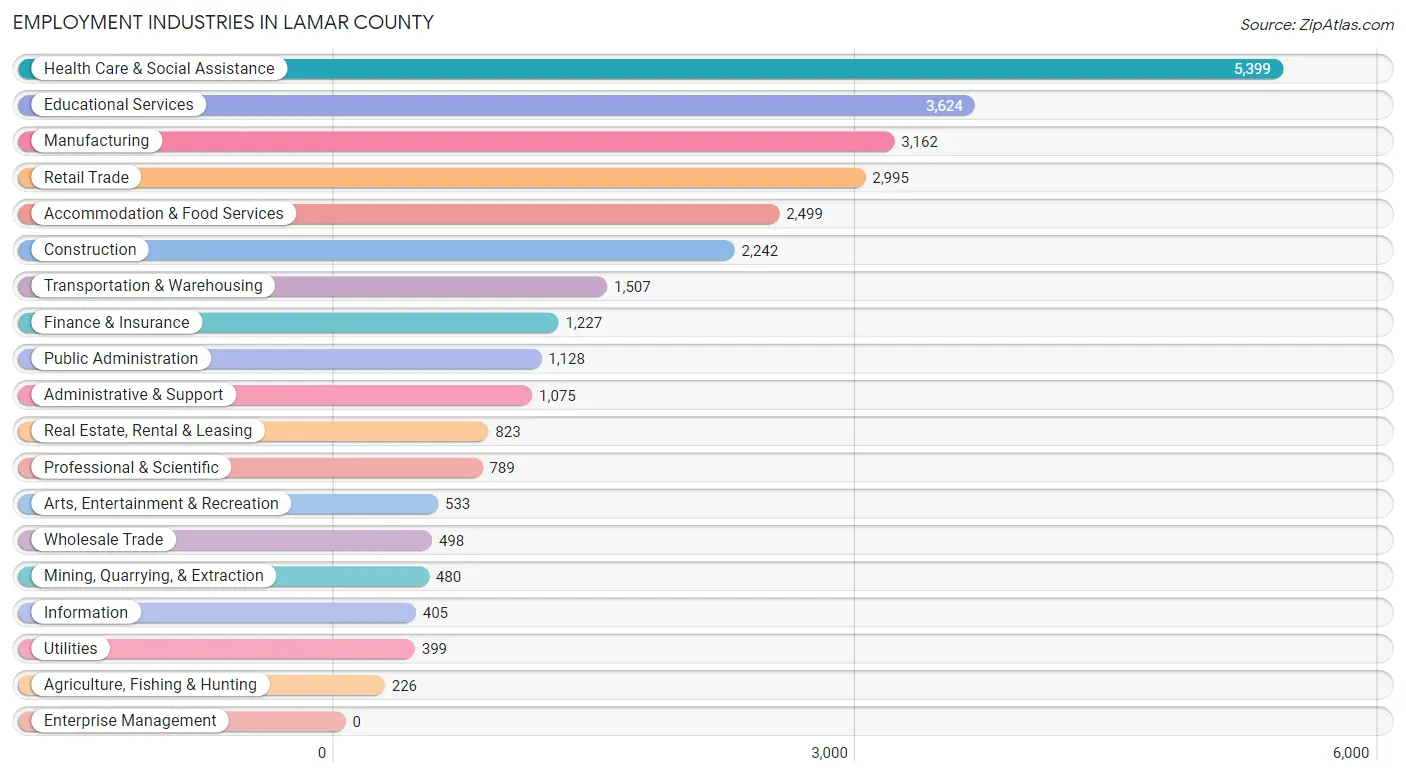
Employment Industries in Lamar County
The major employment industries in Lamar County include Health Care & Social Assistance (5,399 | 18.0%), Educational Services (3,624 | 12.1%), Manufacturing (3,162 | 10.5%), Retail Trade (2,995 | 10.0%), and Accommodation & Food Services (2,499 | 8.3%).
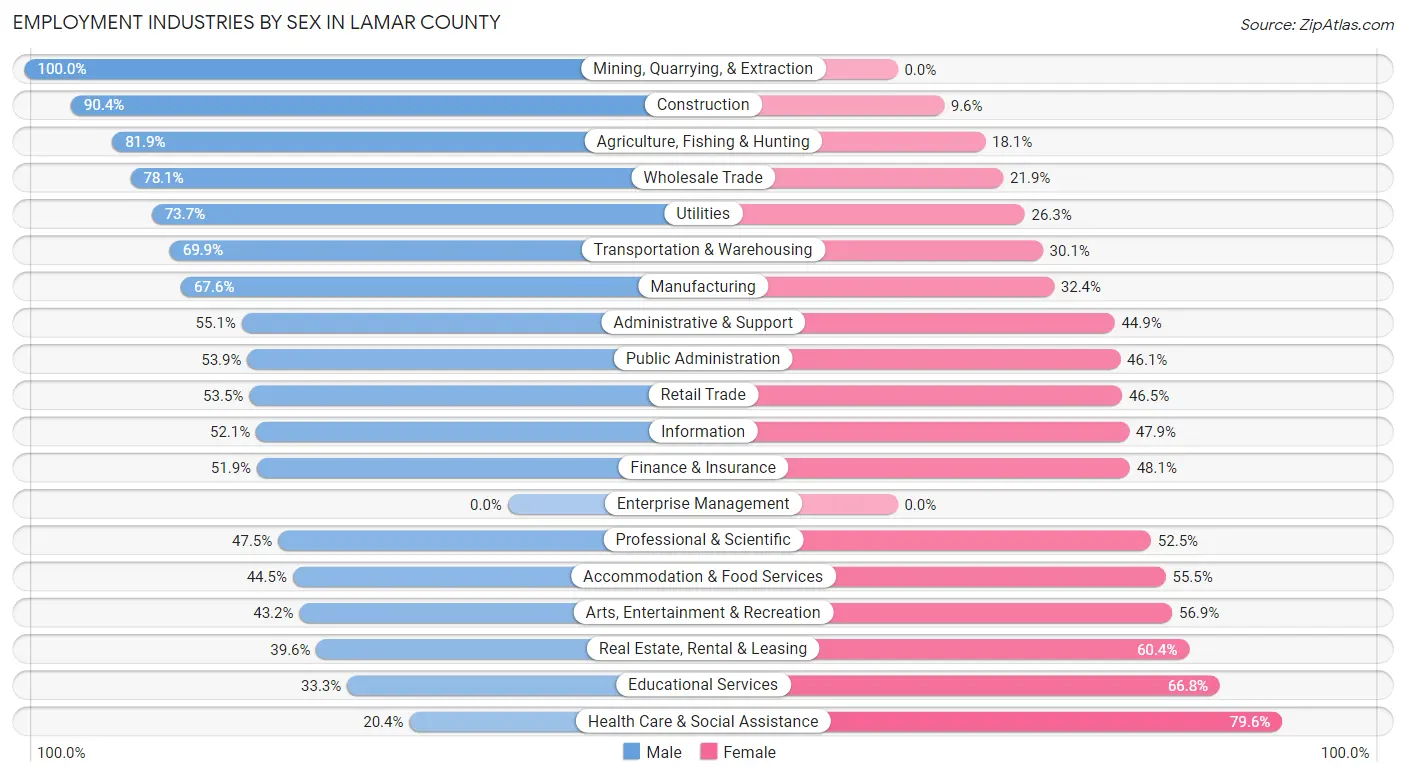
Employment Industries by Sex in Lamar County
The Lamar County industries that see more men than women are Mining, Quarrying, & Extraction (100.0%), Construction (90.4%), and Agriculture, Fishing & Hunting (81.9%), whereas the industries that tend to have a higher number of women are Health Care & Social Assistance (79.6%), Educational Services (66.7%), and Real Estate, Rental & Leasing (60.4%).
| Industry | Male | Female |
| Agriculture, Fishing & Hunting | 185 (81.9%) | 41 (18.1%) |
| Mining, Quarrying, & Extraction | 480 (100.0%) | 0 (0.0%) |
| Construction | 2,027 (90.4%) | 215 (9.6%) |
| Manufacturing | 2,138 (67.6%) | 1,024 (32.4%) |
| Wholesale Trade | 389 (78.1%) | 109 (21.9%) |
| Retail Trade | 1,603 (53.5%) | 1,392 (46.5%) |
| Transportation & Warehousing | 1,054 (69.9%) | 453 (30.1%) |
| Utilities | 294 (73.7%) | 105 (26.3%) |
| Information | 211 (52.1%) | 194 (47.9%) |
| Finance & Insurance | 637 (51.9%) | 590 (48.1%) |
| Real Estate, Rental & Leasing | 326 (39.6%) | 497 (60.4%) |
| Professional & Scientific | 375 (47.5%) | 414 (52.5%) |
| Enterprise Management | 0 (0.0%) | 0 (0.0%) |
| Administrative & Support | 592 (55.1%) | 483 (44.9%) |
| Educational Services | 1,205 (33.3%) | 2,419 (66.7%) |
| Health Care & Social Assistance | 1,100 (20.4%) | 4,299 (79.6%) |
| Arts, Entertainment & Recreation | 230 (43.1%) | 303 (56.9%) |
| Accommodation & Food Services | 1,112 (44.5%) | 1,387 (55.5%) |
| Public Administration | 608 (53.9%) | 520 (46.1%) |
| Total | 15,134 (50.3%) | 14,926 (49.6%) |
Education in Lamar County
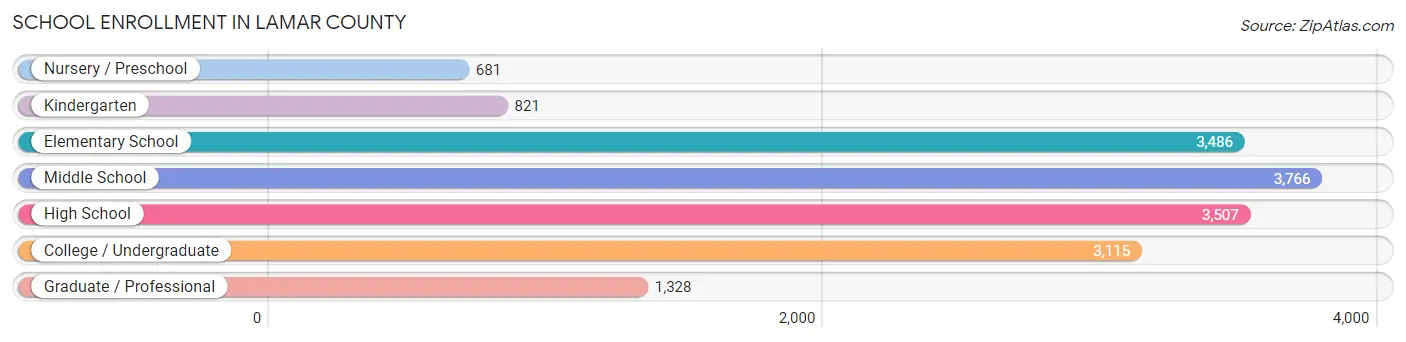
School Enrollment in Lamar County
The most common levels of schooling among the 16,704 students in Lamar County are middle school (3,766 | 22.6%), high school (3,507 | 21.0%), and elementary school (3,486 | 20.9%).
| School Level | # Students | % Students |
| Nursery / Preschool | 681 | 4.1% |
| Kindergarten | 821 | 4.9% |
| Elementary School | 3,486 | 20.9% |
| Middle School | 3,766 | 22.6% |
| High School | 3,507 | 21.0% |
| College / Undergraduate | 3,115 | 18.6% |
| Graduate / Professional | 1,328 | 8.0% |
| Total | 16,704 | 100.0% |
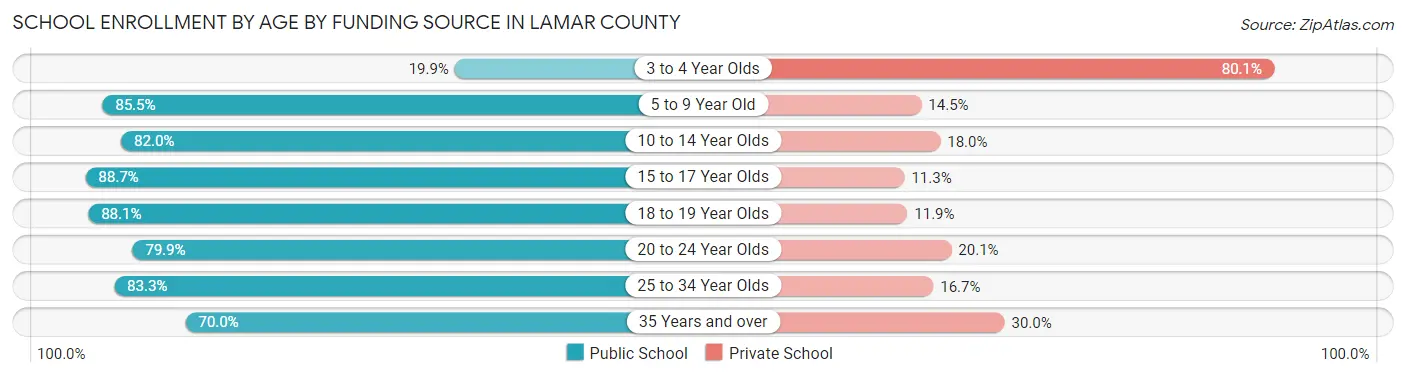
School Enrollment by Age by Funding Source in Lamar County
Out of a total of 16,704 students who are enrolled in schools in Lamar County, 3,040 (18.2%) attend a private institution, while the remaining 13,664 (81.8%) are enrolled in public schools. The age group of 3 to 4 year olds has the highest likelihood of being enrolled in private schools, with 419 (80.1% in the age bracket) enrolled. Conversely, the age group of 15 to 17 year olds has the lowest likelihood of being enrolled in a private school, with 2,136 (88.7% in the age bracket) attending a public institution.
| Age Bracket | Public School | Private School |
| 3 to 4 Year Olds | 104 (19.9%) | 419 (80.1%) |
| 5 to 9 Year Old | 3,391 (85.5%) | 574 (14.5%) |
| 10 to 14 Year Olds | 3,866 (82.0%) | 848 (18.0%) |
| 15 to 17 Year Olds | 2,136 (88.7%) | 273 (11.3%) |
| 18 to 19 Year Olds | 1,026 (88.1%) | 138 (11.9%) |
| 20 to 24 Year Olds | 1,697 (79.9%) | 426 (20.1%) |
| 25 to 34 Year Olds | 1,093 (83.3%) | 219 (16.7%) |
| 35 Years and over | 346 (70.0%) | 148 (30.0%) |
| Total | 13,664 (81.8%) | 3,040 (18.2%) |
Educational Attainment by Field of Study in Lamar County
Business (3,545 | 22.6%), science & technology (2,230 | 14.2%), education (2,176 | 13.9%), arts & humanities (1,285 | 8.2%), and bio, nature & agricultural (1,079 | 6.9%) are the most common fields of study among 15,663 individuals in Lamar County who have obtained a bachelor's degree or higher.
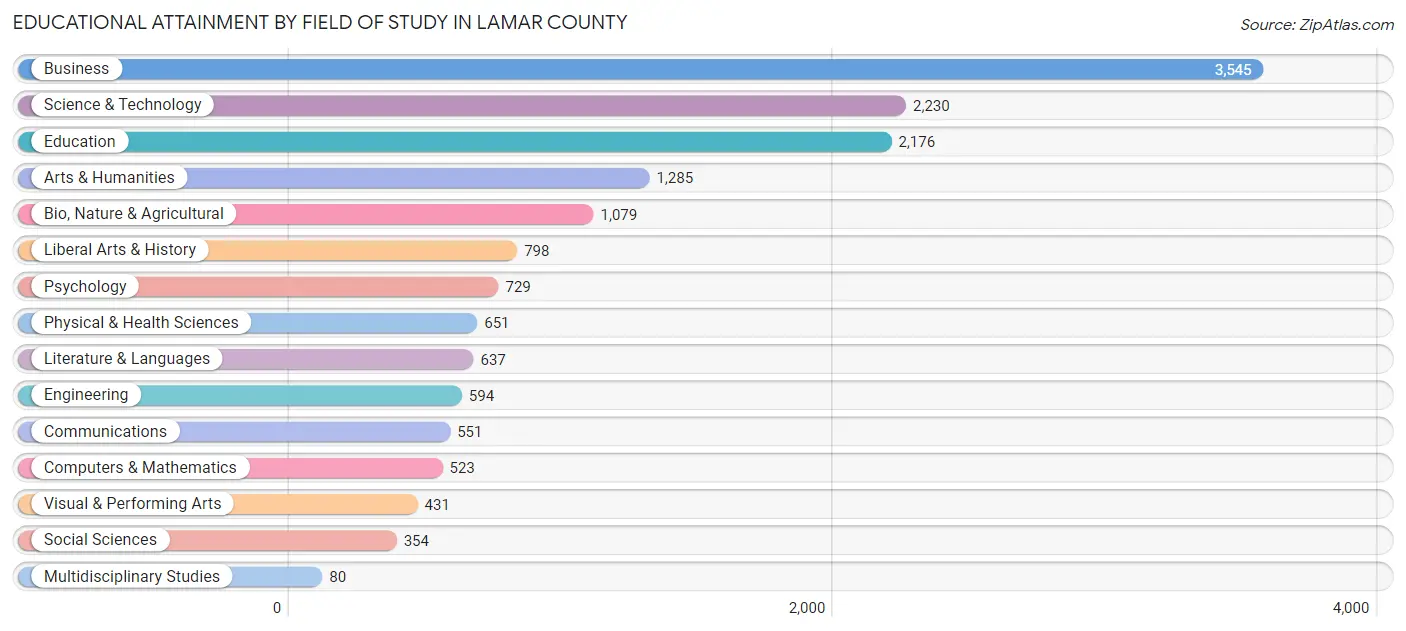
| Field of Study | # Graduates | % Graduates |
| Computers & Mathematics | 523 | 3.3% |
| Bio, Nature & Agricultural | 1,079 | 6.9% |
| Physical & Health Sciences | 651 | 4.2% |
| Psychology | 729 | 4.6% |
| Social Sciences | 354 | 2.3% |
| Engineering | 594 | 3.8% |
| Multidisciplinary Studies | 80 | 0.5% |
| Science & Technology | 2,230 | 14.2% |
| Business | 3,545 | 22.6% |
| Education | 2,176 | 13.9% |
| Literature & Languages | 637 | 4.1% |
| Liberal Arts & History | 798 | 5.1% |
| Visual & Performing Arts | 431 | 2.8% |
| Communications | 551 | 3.5% |
| Arts & Humanities | 1,285 | 8.2% |
| Total | 15,663 | 100.0% |
Transportation & Commute in Lamar County
Vehicle Availability by Sex in Lamar County
The most prevalent vehicle ownership categories in Lamar County are males with 2 vehicles (6,733, accounting for 44.0%) and females with 2 vehicles (6,388, making up 46.1%).
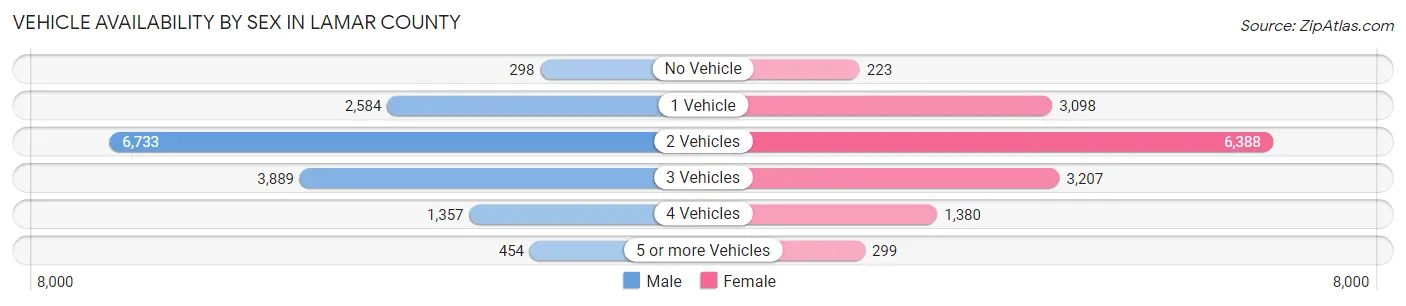
| Vehicles Available | Male | Female |
| No Vehicle | 298 (1.9%) | 223 (1.5%) |
| 1 Vehicle | 2,584 (16.9%) | 3,098 (21.2%) |
| 2 Vehicles | 6,733 (44.0%) | 6,388 (43.8%) |
| 3 Vehicles | 3,889 (25.4%) | 3,207 (22.0%) |
| 4 Vehicles | 1,357 (8.9%) | 1,380 (9.5%) |
| 5 or more Vehicles | 454 (3.0%) | 299 (2.1%) |
| Total | 15,315 (100.0%) | 14,595 (100.0%) |
Commute Time in Lamar County
The most frequently occuring commute durations in Lamar County are 15 to 19 minutes (5,094 commuters, 17.5%), 20 to 24 minutes (4,592 commuters, 15.8%), and 30 to 34 minutes (4,288 commuters, 14.8%).
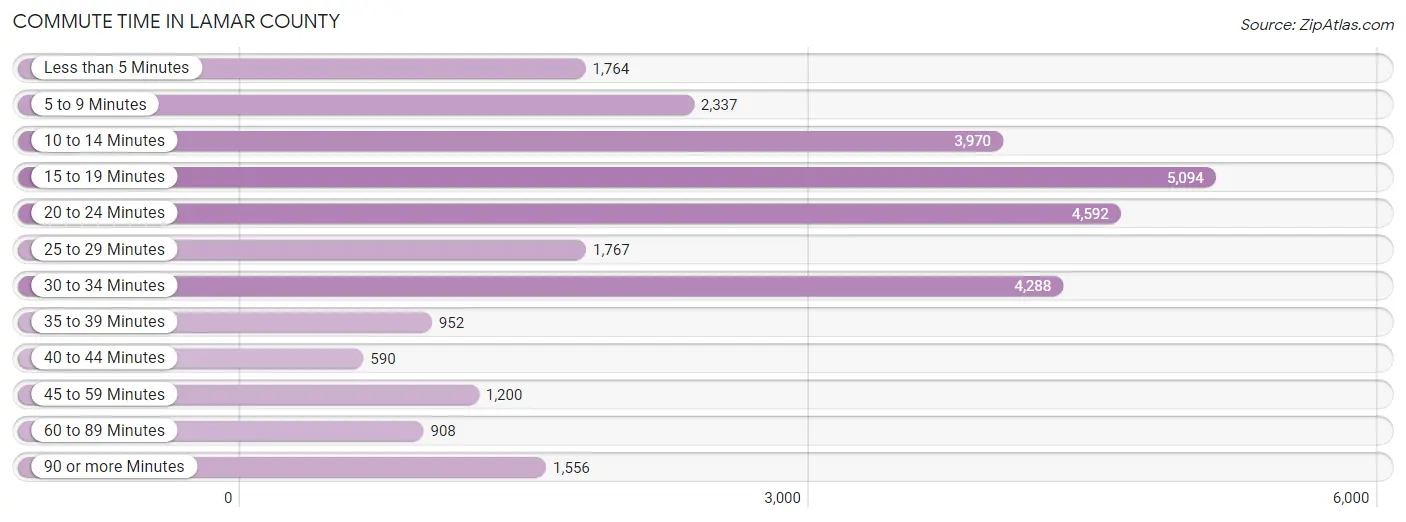
| Commute Time | # Commuters | % Commuters |
| Less than 5 Minutes | 1,764 | 6.1% |
| 5 to 9 Minutes | 2,337 | 8.1% |
| 10 to 14 Minutes | 3,970 | 13.7% |
| 15 to 19 Minutes | 5,094 | 17.5% |
| 20 to 24 Minutes | 4,592 | 15.8% |
| 25 to 29 Minutes | 1,767 | 6.1% |
| 30 to 34 Minutes | 4,288 | 14.8% |
| 35 to 39 Minutes | 952 | 3.3% |
| 40 to 44 Minutes | 590 | 2.0% |
| 45 to 59 Minutes | 1,200 | 4.1% |
| 60 to 89 Minutes | 908 | 3.1% |
| 90 or more Minutes | 1,556 | 5.4% |
Commute Time by Sex in Lamar County
The most common commute times in Lamar County are 15 to 19 minutes (2,442 commuters, 16.4%) for males and 15 to 19 minutes (2,652 commuters, 18.8%) for females.
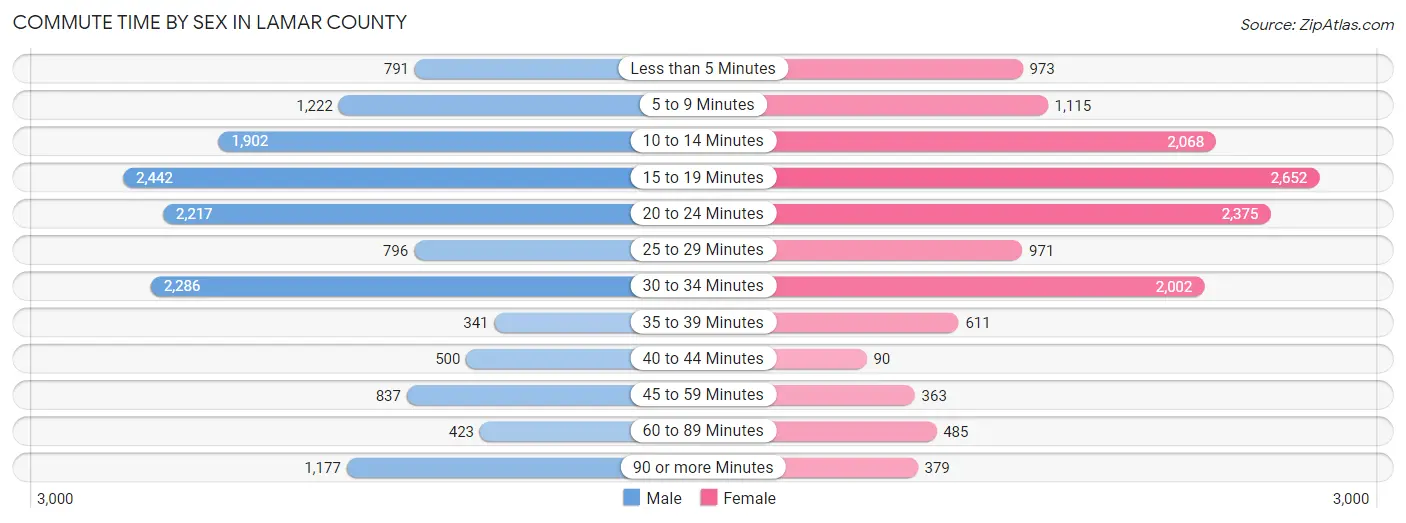
| Commute Time | Male | Female |
| Less than 5 Minutes | 791 (5.3%) | 973 (6.9%) |
| 5 to 9 Minutes | 1,222 (8.2%) | 1,115 (7.9%) |
| 10 to 14 Minutes | 1,902 (12.7%) | 2,068 (14.7%) |
| 15 to 19 Minutes | 2,442 (16.4%) | 2,652 (18.8%) |
| 20 to 24 Minutes | 2,217 (14.8%) | 2,375 (16.9%) |
| 25 to 29 Minutes | 796 (5.3%) | 971 (6.9%) |
| 30 to 34 Minutes | 2,286 (15.3%) | 2,002 (14.2%) |
| 35 to 39 Minutes | 341 (2.3%) | 611 (4.3%) |
| 40 to 44 Minutes | 500 (3.4%) | 90 (0.6%) |
| 45 to 59 Minutes | 837 (5.6%) | 363 (2.6%) |
| 60 to 89 Minutes | 423 (2.8%) | 485 (3.4%) |
| 90 or more Minutes | 1,177 (7.9%) | 379 (2.7%) |
Time of Departure to Work by Sex in Lamar County
The most frequent times of departure to work in Lamar County are 7:00 AM to 7:29 AM (2,202, 14.7%) for males and 7:30 AM to 7:59 AM (2,799, 19.9%) for females.
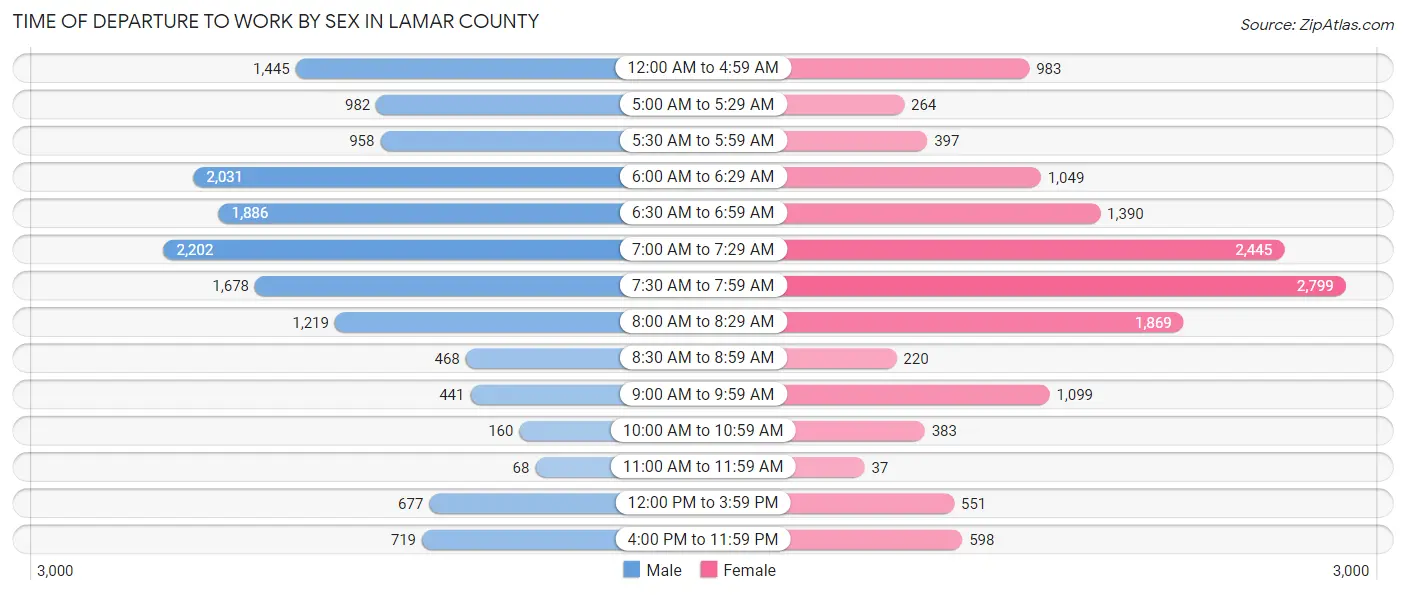
| Time of Departure | Male | Female |
| 12:00 AM to 4:59 AM | 1,445 (9.7%) | 983 (7.0%) |
| 5:00 AM to 5:29 AM | 982 (6.6%) | 264 (1.9%) |
| 5:30 AM to 5:59 AM | 958 (6.4%) | 397 (2.8%) |
| 6:00 AM to 6:29 AM | 2,031 (13.6%) | 1,049 (7.4%) |
| 6:30 AM to 6:59 AM | 1,886 (12.6%) | 1,390 (9.9%) |
| 7:00 AM to 7:29 AM | 2,202 (14.7%) | 2,445 (17.4%) |
| 7:30 AM to 7:59 AM | 1,678 (11.2%) | 2,799 (19.9%) |
| 8:00 AM to 8:29 AM | 1,219 (8.2%) | 1,869 (13.3%) |
| 8:30 AM to 8:59 AM | 468 (3.1%) | 220 (1.6%) |
| 9:00 AM to 9:59 AM | 441 (2.9%) | 1,099 (7.8%) |
| 10:00 AM to 10:59 AM | 160 (1.1%) | 383 (2.7%) |
| 11:00 AM to 11:59 AM | 68 (0.5%) | 37 (0.3%) |
| 12:00 PM to 3:59 PM | 677 (4.5%) | 551 (3.9%) |
| 4:00 PM to 11:59 PM | 719 (4.8%) | 598 (4.3%) |
| Total | 14,934 (100.0%) | 14,084 (100.0%) |
Housing Occupancy in Lamar County
Occupancy by Ownership in Lamar County
Of the total 24,896 dwellings in Lamar County, owner-occupied units account for 16,717 (67.1%), while renter-occupied units make up 8,179 (32.9%).
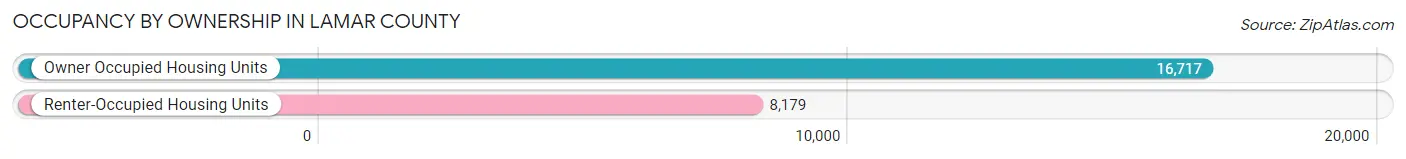
| Occupancy | # Housing Units | % Housing Units |
| Owner Occupied Housing Units | 16,717 | 67.1% |
| Renter-Occupied Housing Units | 8,179 | 32.9% |
| Total Occupied Housing Units | 24,896 | 100.0% |
Occupancy by Household Size in Lamar County
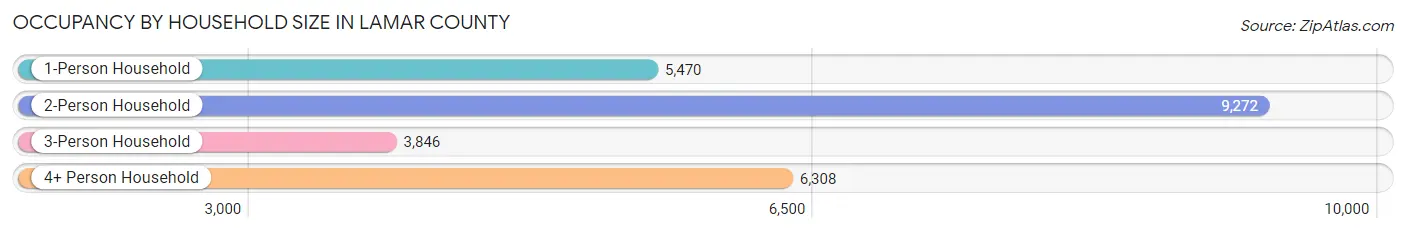
| Household Size | # Housing Units | % Housing Units |
| 1-Person Household | 5,470 | 22.0% |
| 2-Person Household | 9,272 | 37.2% |
| 3-Person Household | 3,846 | 15.4% |
| 4+ Person Household | 6,308 | 25.3% |
| Total Housing Units | 24,896 | 100.0% |
Occupancy by Ownership by Household Size in Lamar County
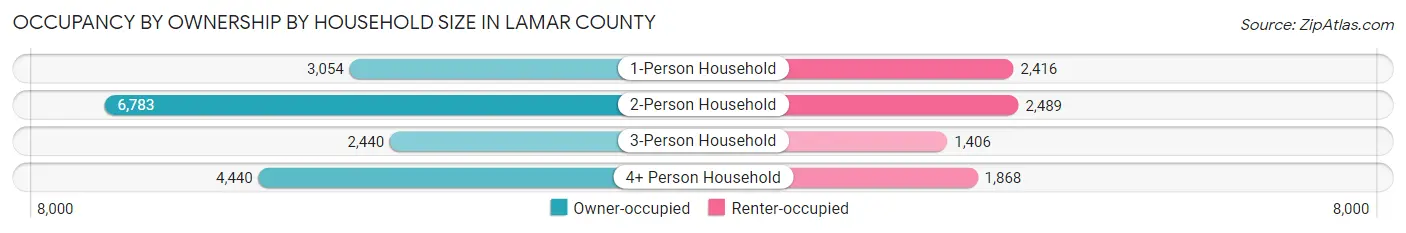
| Household Size | Owner-occupied | Renter-occupied |
| 1-Person Household | 3,054 (55.8%) | 2,416 (44.2%) |
| 2-Person Household | 6,783 (73.2%) | 2,489 (26.8%) |
| 3-Person Household | 2,440 (63.4%) | 1,406 (36.6%) |
| 4+ Person Household | 4,440 (70.4%) | 1,868 (29.6%) |
| Total Housing Units | 16,717 (67.1%) | 8,179 (32.9%) |
Occupancy by Educational Attainment in Lamar County
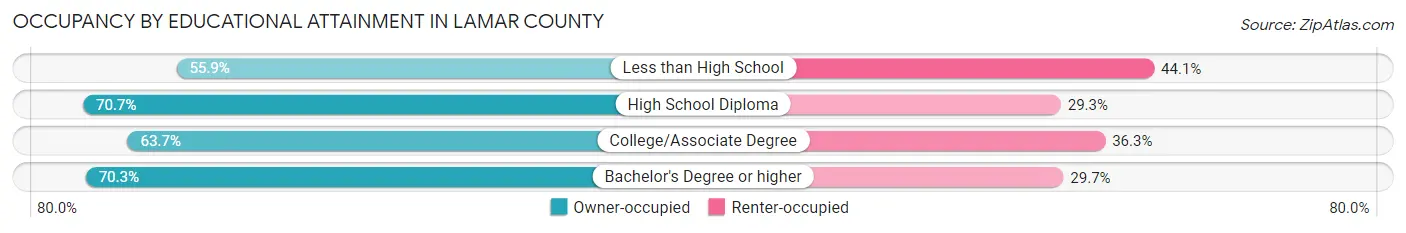
| Household Size | Owner-occupied | Renter-occupied |
| Less than High School | 851 (55.9%) | 671 (44.1%) |
| High School Diploma | 4,289 (70.7%) | 1,776 (29.3%) |
| College/Associate Degree | 5,674 (63.7%) | 3,238 (36.3%) |
| Bachelor's Degree or higher | 5,903 (70.3%) | 2,494 (29.7%) |
Occupancy by Age of Householder in Lamar County
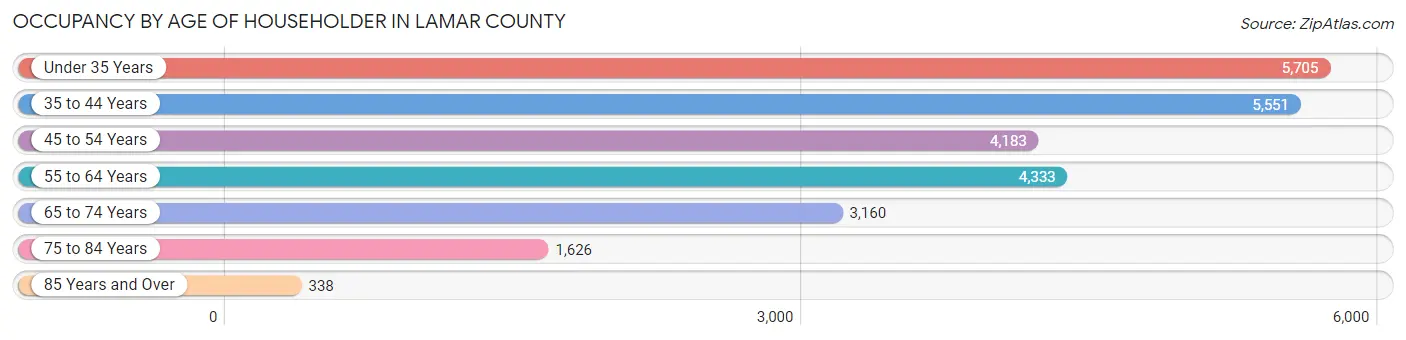
| Age Bracket | # Households | % Households |
| Under 35 Years | 5,705 | 22.9% |
| 35 to 44 Years | 5,551 | 22.3% |
| 45 to 54 Years | 4,183 | 16.8% |
| 55 to 64 Years | 4,333 | 17.4% |
| 65 to 74 Years | 3,160 | 12.7% |
| 75 to 84 Years | 1,626 | 6.5% |
| 85 Years and Over | 338 | 1.4% |
| Total | 24,896 | 100.0% |
Housing Finances in Lamar County
Median Income by Occupancy in Lamar County
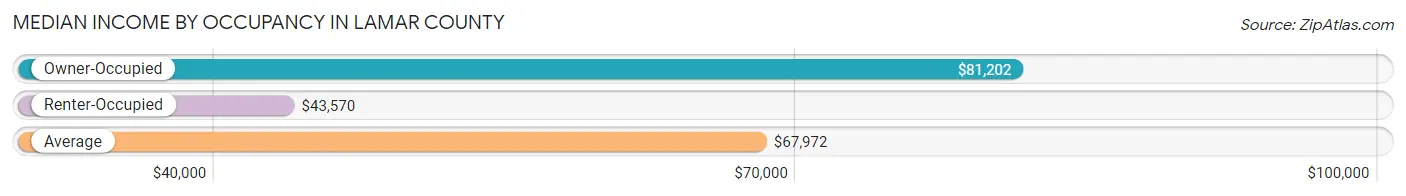
| Occupancy Type | # Households | Median Income |
| Owner-Occupied | 16,717 (67.1%) | $81,202 |
| Renter-Occupied | 8,179 (32.9%) | $43,570 |
| Average | 24,896 (100.0%) | $67,972 |
Occupancy by Householder Income Bracket in Lamar County
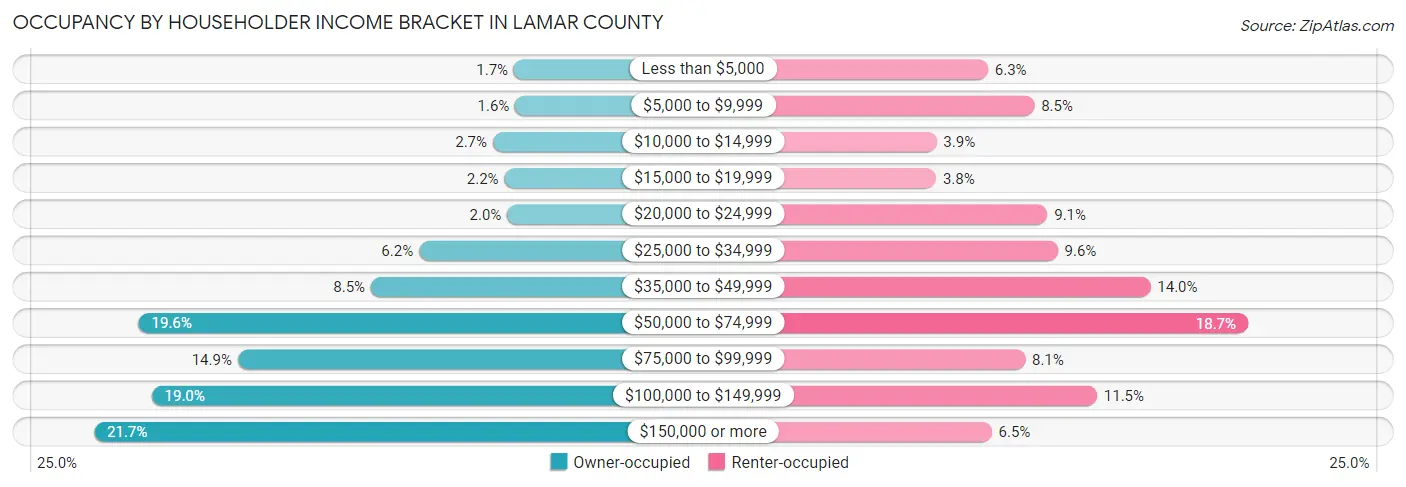
| Income Bracket | Owner-occupied | Renter-occupied |
| Less than $5,000 | 285 (1.7%) | 515 (6.3%) |
| $5,000 to $9,999 | 274 (1.6%) | 696 (8.5%) |
| $10,000 to $14,999 | 451 (2.7%) | 315 (3.8%) |
| $15,000 to $19,999 | 360 (2.1%) | 313 (3.8%) |
| $20,000 to $24,999 | 337 (2.0%) | 747 (9.1%) |
| $25,000 to $34,999 | 1,039 (6.2%) | 787 (9.6%) |
| $35,000 to $49,999 | 1,422 (8.5%) | 1,148 (14.0%) |
| $50,000 to $74,999 | 3,272 (19.6%) | 1,528 (18.7%) |
| $75,000 to $99,999 | 2,483 (14.8%) | 660 (8.1%) |
| $100,000 to $149,999 | 3,168 (19.0%) | 940 (11.5%) |
| $150,000 or more | 3,626 (21.7%) | 530 (6.5%) |
| Total | 16,717 (100.0%) | 8,179 (100.0%) |
Monthly Housing Cost Tiers in Lamar County
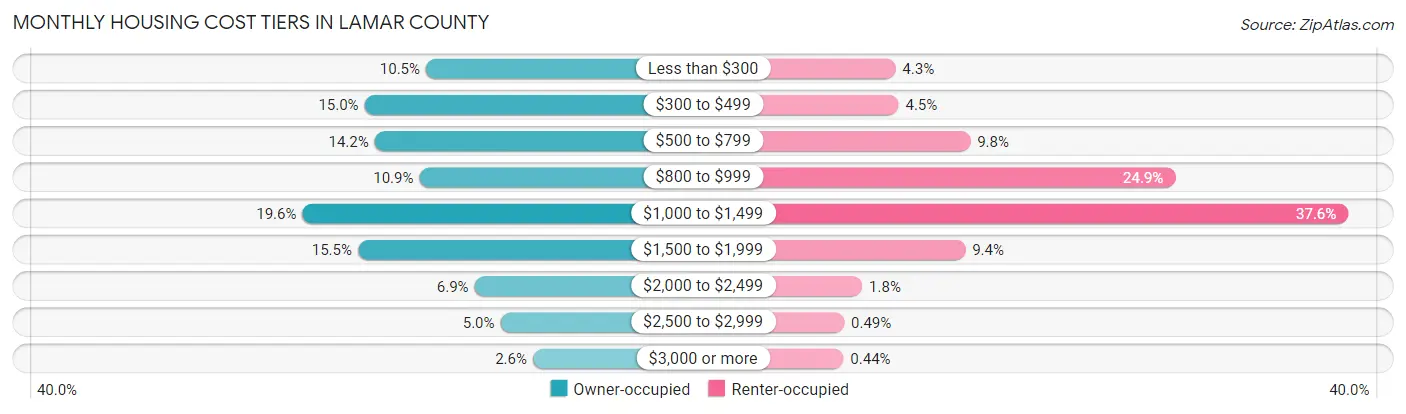
| Monthly Cost | Owner-occupied | Renter-occupied |
| Less than $300 | 1,747 (10.4%) | 349 (4.3%) |
| $300 to $499 | 2,502 (15.0%) | 368 (4.5%) |
| $500 to $799 | 2,379 (14.2%) | 800 (9.8%) |
| $800 to $999 | 1,828 (10.9%) | 2,034 (24.9%) |
| $1,000 to $1,499 | 3,269 (19.6%) | 3,076 (37.6%) |
| $1,500 to $1,999 | 2,585 (15.5%) | 770 (9.4%) |
| $2,000 to $2,499 | 1,149 (6.9%) | 149 (1.8%) |
| $2,500 to $2,999 | 829 (5.0%) | 40 (0.5%) |
| $3,000 or more | 429 (2.6%) | 36 (0.4%) |
| Total | 16,717 (100.0%) | 8,179 (100.0%) |
Physical Housing Characteristics in Lamar County
Housing Structures in Lamar County
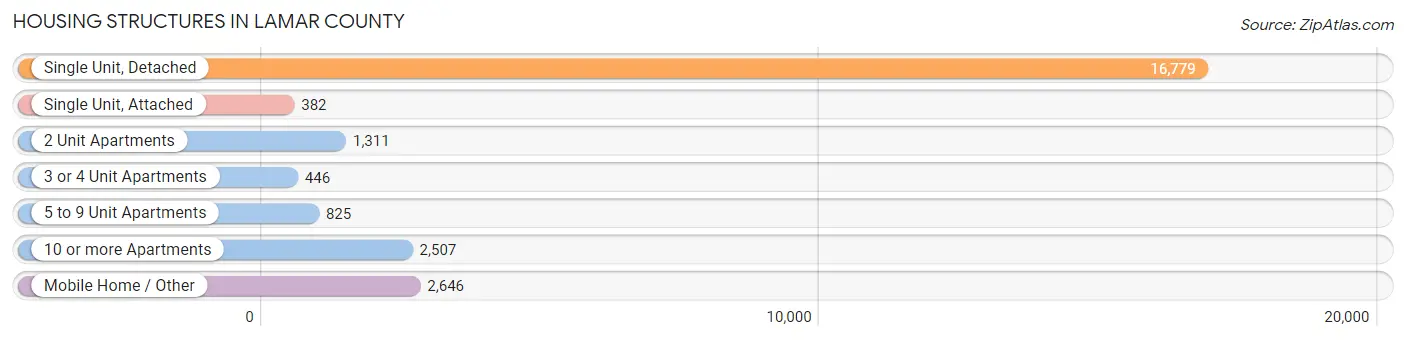
| Structure Type | # Housing Units | % Housing Units |
| Single Unit, Detached | 16,779 | 67.4% |
| Single Unit, Attached | 382 | 1.5% |
| 2 Unit Apartments | 1,311 | 5.3% |
| 3 or 4 Unit Apartments | 446 | 1.8% |
| 5 to 9 Unit Apartments | 825 | 3.3% |
| 10 or more Apartments | 2,507 | 10.1% |
| Mobile Home / Other | 2,646 | 10.6% |
| Total | 24,896 | 100.0% |
Housing Structures by Occupancy in Lamar County
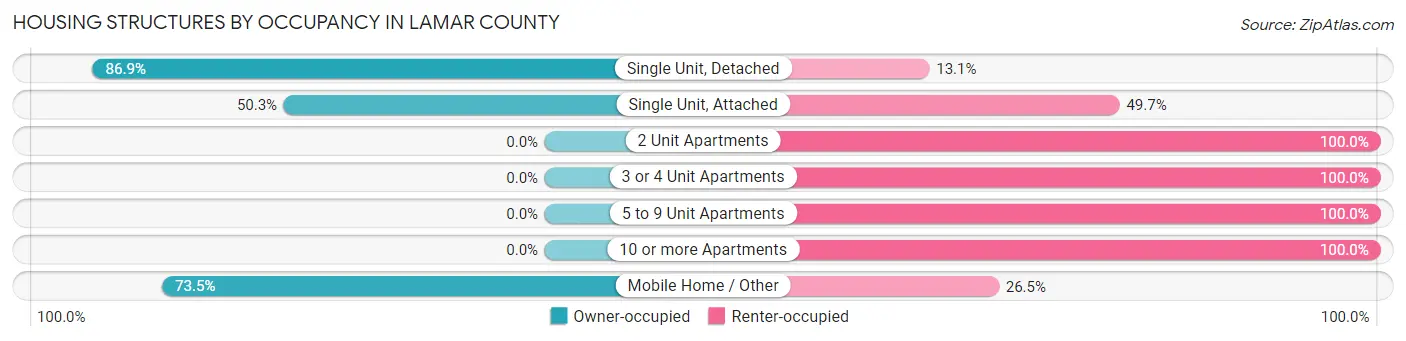
| Structure Type | Owner-occupied | Renter-occupied |
| Single Unit, Detached | 14,580 (86.9%) | 2,199 (13.1%) |
| Single Unit, Attached | 192 (50.3%) | 190 (49.7%) |
| 2 Unit Apartments | 0 (0.0%) | 1,311 (100.0%) |
| 3 or 4 Unit Apartments | 0 (0.0%) | 446 (100.0%) |
| 5 to 9 Unit Apartments | 0 (0.0%) | 825 (100.0%) |
| 10 or more Apartments | 0 (0.0%) | 2,507 (100.0%) |
| Mobile Home / Other | 1,945 (73.5%) | 701 (26.5%) |
| Total | 16,717 (67.1%) | 8,179 (32.9%) |
Housing Structures by Number of Rooms in Lamar County
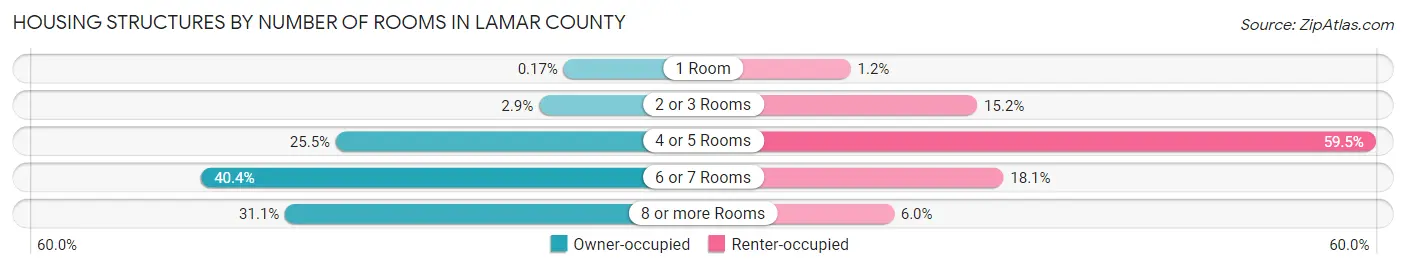
| Number of Rooms | Owner-occupied | Renter-occupied |
| 1 Room | 29 (0.2%) | 97 (1.2%) |
| 2 or 3 Rooms | 486 (2.9%) | 1,246 (15.2%) |
| 4 or 5 Rooms | 4,255 (25.5%) | 4,863 (59.5%) |
| 6 or 7 Rooms | 6,752 (40.4%) | 1,484 (18.1%) |
| 8 or more Rooms | 5,195 (31.1%) | 489 (6.0%) |
| Total | 16,717 (100.0%) | 8,179 (100.0%) |
Housing Structure by Heating Type in Lamar County
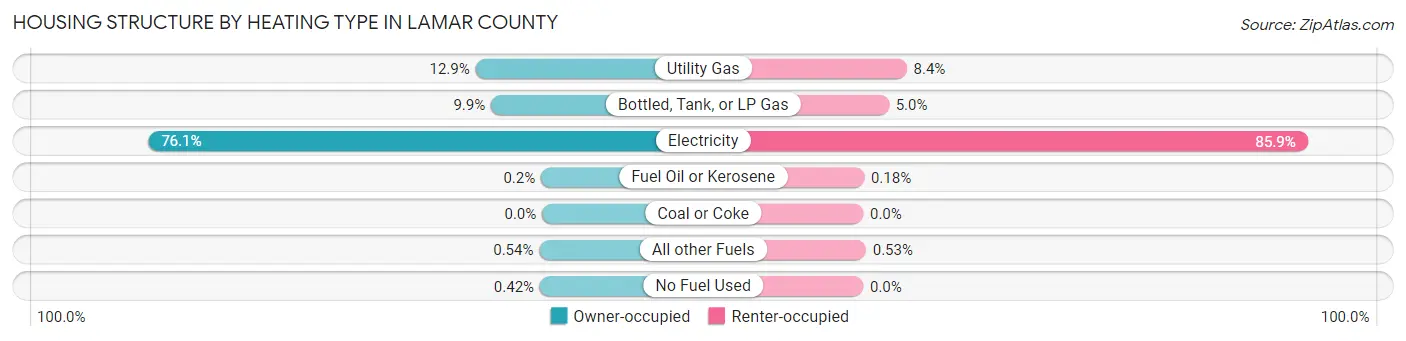
| Heating Type | Owner-occupied | Renter-occupied |
| Utility Gas | 2,150 (12.9%) | 689 (8.4%) |
| Bottled, Tank, or LP Gas | 1,649 (9.9%) | 406 (5.0%) |
| Electricity | 12,722 (76.1%) | 7,026 (85.9%) |
| Fuel Oil or Kerosene | 34 (0.2%) | 15 (0.2%) |
| Coal or Coke | 0 (0.0%) | 0 (0.0%) |
| All other Fuels | 91 (0.5%) | 43 (0.5%) |
| No Fuel Used | 71 (0.4%) | 0 (0.0%) |
| Total | 16,717 (100.0%) | 8,179 (100.0%) |
Household Vehicle Usage in Lamar County
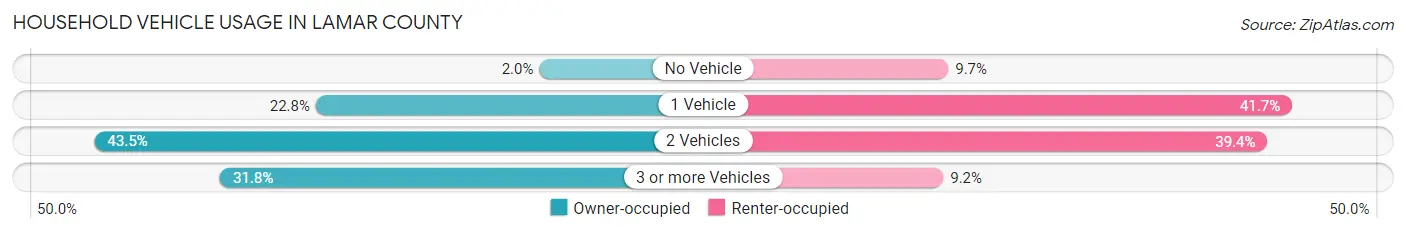
| Vehicles per Household | Owner-occupied | Renter-occupied |
| No Vehicle | 326 (1.9%) | 789 (9.7%) |
| 1 Vehicle | 3,815 (22.8%) | 3,414 (41.7%) |
| 2 Vehicles | 7,268 (43.5%) | 3,225 (39.4%) |
| 3 or more Vehicles | 5,308 (31.8%) | 751 (9.2%) |
| Total | 16,717 (100.0%) | 8,179 (100.0%) |
Real Estate & Mortgages in Lamar County
Real Estate and Mortgage Overview in Lamar County
| Characteristic | Without Mortgage | With Mortgage |
| Housing Units | 6,828 | 9,889 |
| Median Property Value | $174,300 | $221,600 |
| Median Household Income | $61,031 | $2,763 |
| Monthly Housing Costs | $443 | $424 |
| Real Estate Taxes | $1,116 | $806 |
Property Value by Mortgage Status in Lamar County
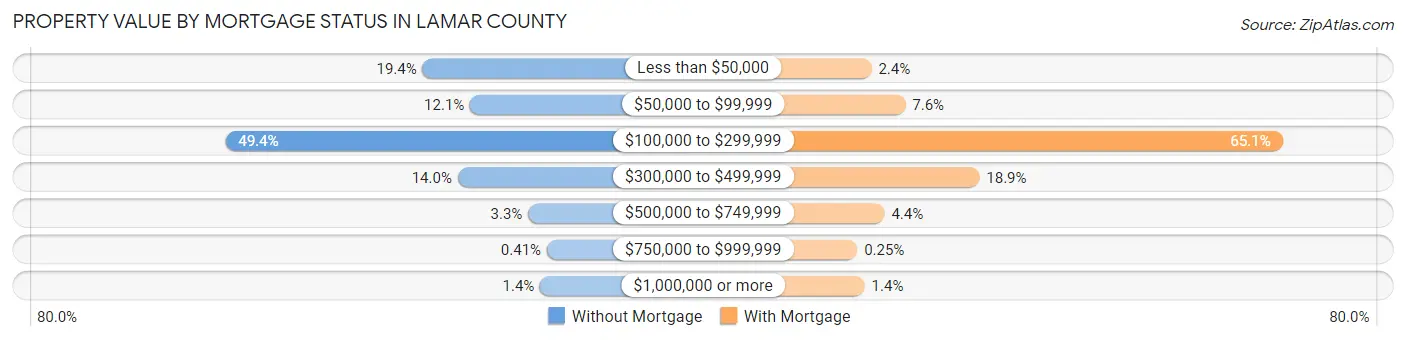
| Property Value | Without Mortgage | With Mortgage |
| Less than $50,000 | 1,322 (19.4%) | 240 (2.4%) |
| $50,000 to $99,999 | 827 (12.1%) | 751 (7.6%) |
| $100,000 to $299,999 | 3,374 (49.4%) | 6,434 (65.1%) |
| $300,000 to $499,999 | 956 (14.0%) | 1,866 (18.9%) |
| $500,000 to $749,999 | 223 (3.3%) | 436 (4.4%) |
| $750,000 to $999,999 | 28 (0.4%) | 25 (0.3%) |
| $1,000,000 or more | 98 (1.4%) | 137 (1.4%) |
| Total | 6,828 (100.0%) | 9,889 (100.0%) |
Household Income by Mortgage Status in Lamar County
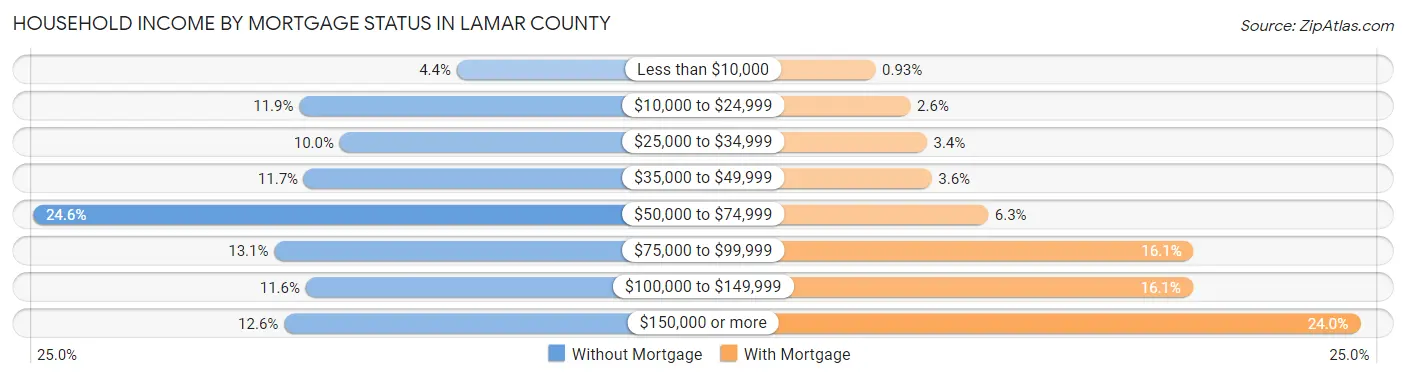
| Household Income | Without Mortgage | With Mortgage |
| Less than $10,000 | 302 (4.4%) | 92 (0.9%) |
| $10,000 to $24,999 | 814 (11.9%) | 257 (2.6%) |
| $25,000 to $34,999 | 682 (10.0%) | 334 (3.4%) |
| $35,000 to $49,999 | 799 (11.7%) | 357 (3.6%) |
| $50,000 to $74,999 | 1,680 (24.6%) | 623 (6.3%) |
| $75,000 to $99,999 | 895 (13.1%) | 1,592 (16.1%) |
| $100,000 to $149,999 | 793 (11.6%) | 1,588 (16.1%) |
| $150,000 or more | 863 (12.6%) | 2,375 (24.0%) |
| Total | 6,828 (100.0%) | 9,889 (100.0%) |
Property Value to Household Income Ratio in Lamar County
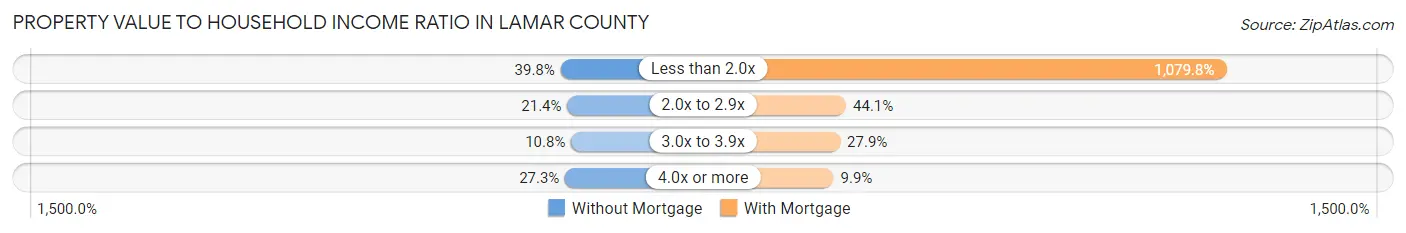
| Value-to-Income Ratio | Without Mortgage | With Mortgage |
| Less than 2.0x | 2,715 (39.8%) | 106,777 (1,079.8%) |
| 2.0x to 2.9x | 1,463 (21.4%) | 4,364 (44.1%) |
| 3.0x to 3.9x | 738 (10.8%) | 2,760 (27.9%) |
| 4.0x or more | 1,866 (27.3%) | 981 (9.9%) |
| Total | 6,828 (100.0%) | 9,889 (100.0%) |
Real Estate Taxes by Mortgage Status in Lamar County
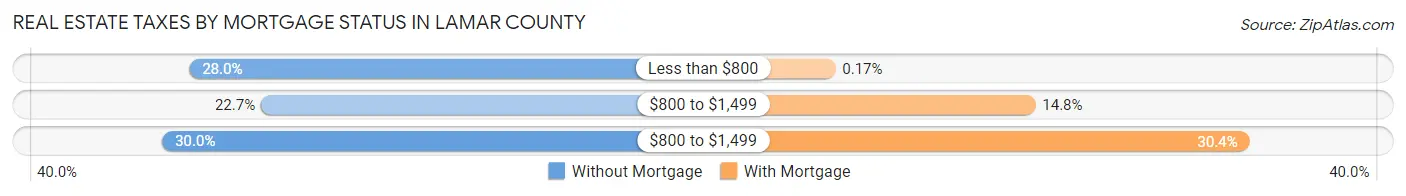
| Property Taxes | Without Mortgage | With Mortgage |
| Less than $800 | 1,910 (28.0%) | 17 (0.2%) |
| $800 to $1,499 | 1,552 (22.7%) | 1,462 (14.8%) |
| $800 to $1,499 | 2,046 (30.0%) | 3,009 (30.4%) |
| Total | 6,828 (100.0%) | 9,889 (100.0%) |
Health & Disability in Lamar County
Health Insurance Coverage by Age in Lamar County
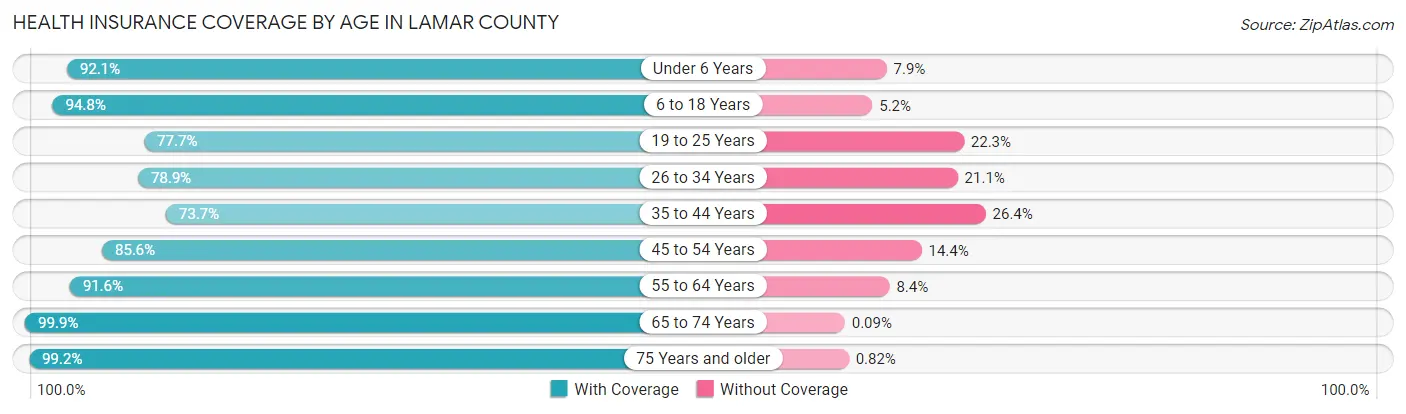
| Age Bracket | With Coverage | Without Coverage |
| Under 6 Years | 4,539 (92.1%) | 389 (7.9%) |
| 6 to 18 Years | 11,049 (94.8%) | 609 (5.2%) |
| 19 to 25 Years | 3,992 (77.7%) | 1,146 (22.3%) |
| 26 to 34 Years | 6,369 (78.9%) | 1,707 (21.1%) |
| 35 to 44 Years | 6,836 (73.7%) | 2,446 (26.4%) |
| 45 to 54 Years | 6,767 (85.6%) | 1,139 (14.4%) |
| 55 to 64 Years | 6,829 (91.6%) | 629 (8.4%) |
| 65 to 74 Years | 5,584 (99.9%) | 5 (0.1%) |
| 75 Years and older | 3,501 (99.2%) | 29 (0.8%) |
| Total | 55,466 (87.3%) | 8,099 (12.7%) |
Health Insurance Coverage by Citizenship Status in Lamar County
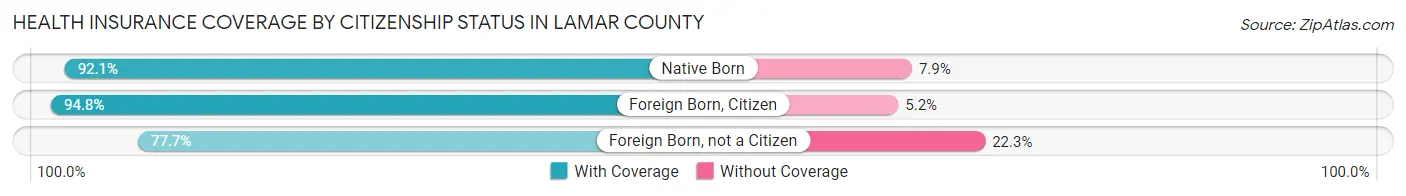
| Citizenship Status | With Coverage | Without Coverage |
| Native Born | 4,539 (92.1%) | 389 (7.9%) |
| Foreign Born, Citizen | 11,049 (94.8%) | 609 (5.2%) |
| Foreign Born, not a Citizen | 3,992 (77.7%) | 1,146 (22.3%) |
Health Insurance Coverage by Household Income in Lamar County
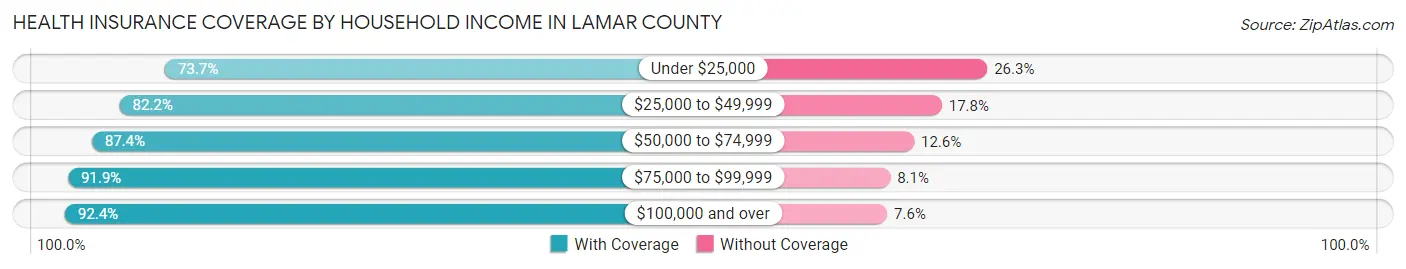
| Household Income | With Coverage | Without Coverage |
| Under $25,000 | 6,023 (73.7%) | 2,150 (26.3%) |
| $25,000 to $49,999 | 8,732 (82.2%) | 1,891 (17.8%) |
| $50,000 to $74,999 | 10,867 (87.4%) | 1,567 (12.6%) |
| $75,000 to $99,999 | 7,591 (91.9%) | 672 (8.1%) |
| $100,000 and over | 22,228 (92.4%) | 1,819 (7.6%) |
Public vs Private Health Insurance Coverage by Age in Lamar County
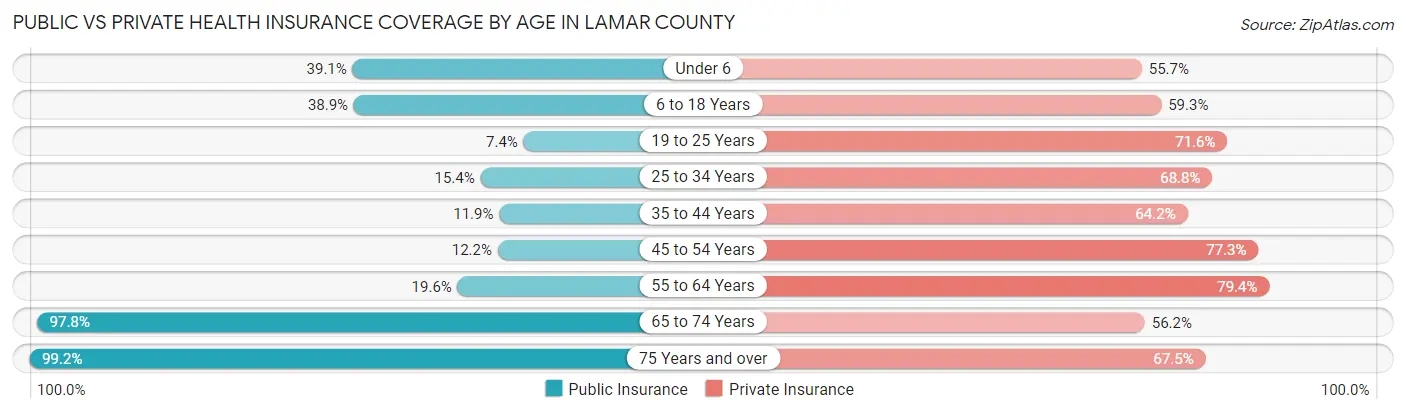
| Age Bracket | Public Insurance | Private Insurance |
| Under 6 | 1,928 (39.1%) | 2,744 (55.7%) |
| 6 to 18 Years | 4,532 (38.9%) | 6,912 (59.3%) |
| 19 to 25 Years | 378 (7.4%) | 3,676 (71.6%) |
| 25 to 34 Years | 1,241 (15.4%) | 5,553 (68.8%) |
| 35 to 44 Years | 1,104 (11.9%) | 5,955 (64.2%) |
| 45 to 54 Years | 961 (12.2%) | 6,111 (77.3%) |
| 55 to 64 Years | 1,463 (19.6%) | 5,918 (79.3%) |
| 65 to 74 Years | 5,464 (97.8%) | 3,143 (56.2%) |
| 75 Years and over | 3,501 (99.2%) | 2,383 (67.5%) |
| Total | 20,572 (32.4%) | 42,395 (66.7%) |
Disability Status by Sex by Age in Lamar County
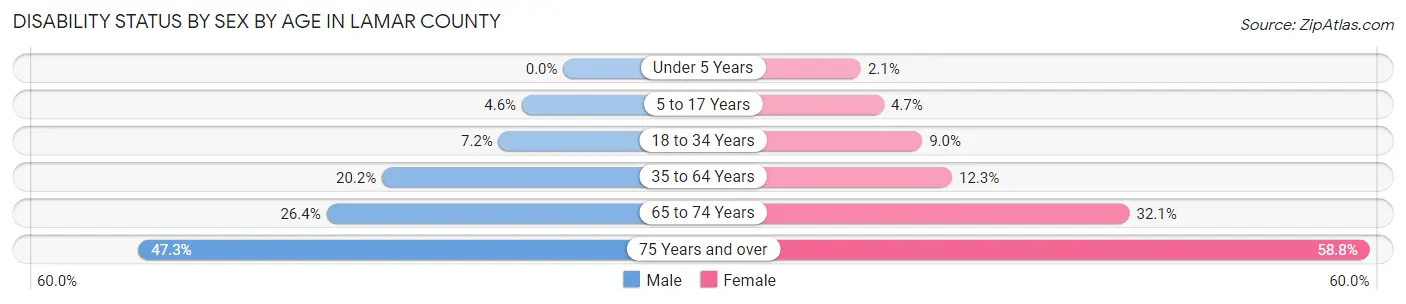
| Age Bracket | Male | Female |
| Under 5 Years | 0 (0.0%) | 43 (2.1%) |
| 5 to 17 Years | 272 (4.6%) | 276 (4.7%) |
| 18 to 34 Years | 480 (7.2%) | 664 (9.0%) |
| 35 to 64 Years | 2,361 (20.2%) | 1,591 (12.3%) |
| 65 to 74 Years | 703 (26.4%) | 937 (32.1%) |
| 75 Years and over | 697 (47.3%) | 1,209 (58.8%) |
Disability Class by Sex by Age in Lamar County
Disability Class: Hearing Difficulty
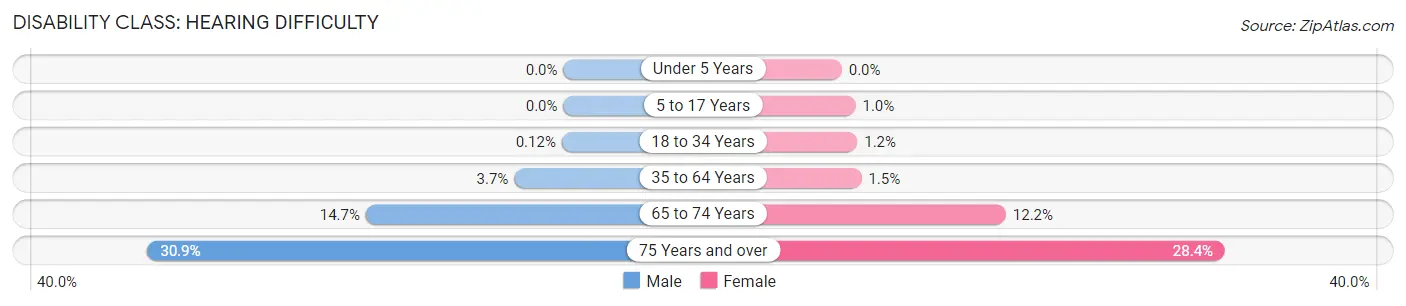
| Age Bracket | Male | Female |
| Under 5 Years | 0 (0.0%) | 0 (0.0%) |
| 5 to 17 Years | 0 (0.0%) | 60 (1.0%) |
| 18 to 34 Years | 8 (0.1%) | 85 (1.1%) |
| 35 to 64 Years | 427 (3.6%) | 189 (1.5%) |
| 65 to 74 Years | 391 (14.7%) | 356 (12.2%) |
| 75 Years and over | 455 (30.9%) | 585 (28.4%) |
Disability Class: Vision Difficulty
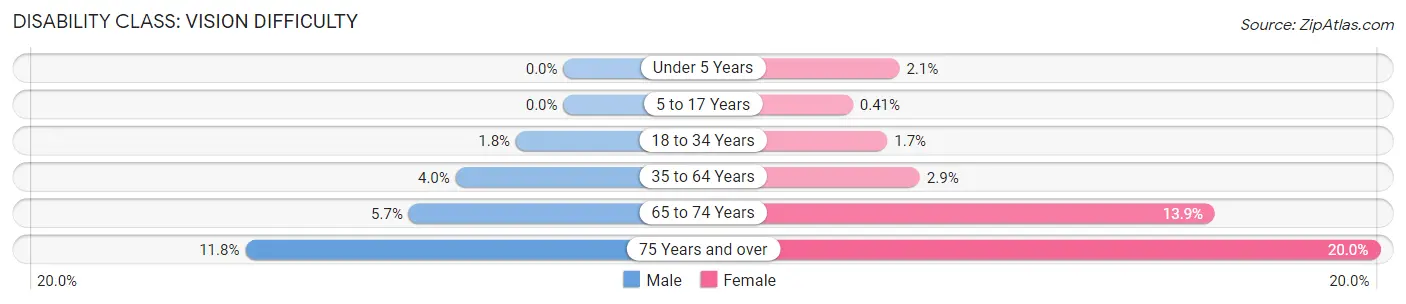
| Age Bracket | Male | Female |
| Under 5 Years | 0 (0.0%) | 43 (2.1%) |
| 5 to 17 Years | 0 (0.0%) | 24 (0.4%) |
| 18 to 34 Years | 117 (1.8%) | 125 (1.7%) |
| 35 to 64 Years | 468 (4.0%) | 375 (2.9%) |
| 65 to 74 Years | 153 (5.7%) | 405 (13.9%) |
| 75 Years and over | 174 (11.8%) | 411 (20.0%) |
Disability Class: Cognitive Difficulty
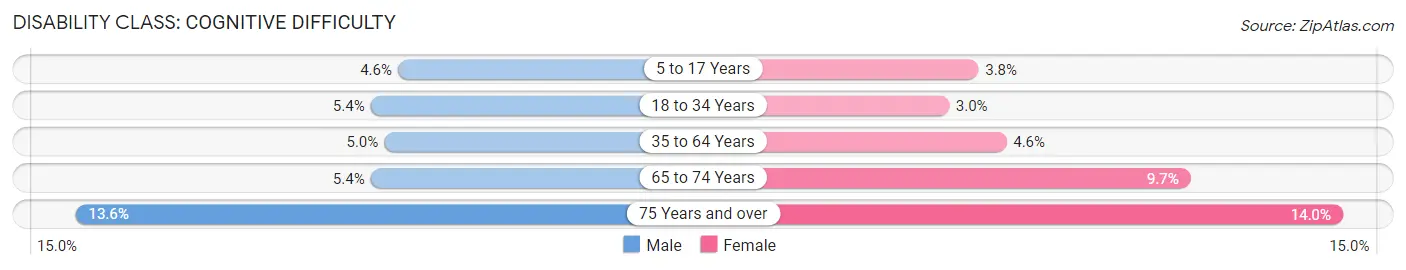
| Age Bracket | Male | Female |
| 5 to 17 Years | 272 (4.6%) | 223 (3.8%) |
| 18 to 34 Years | 358 (5.4%) | 221 (3.0%) |
| 35 to 64 Years | 583 (5.0%) | 593 (4.6%) |
| 65 to 74 Years | 143 (5.4%) | 284 (9.7%) |
| 75 Years and over | 200 (13.6%) | 287 (14.0%) |
Disability Class: Ambulatory Difficulty
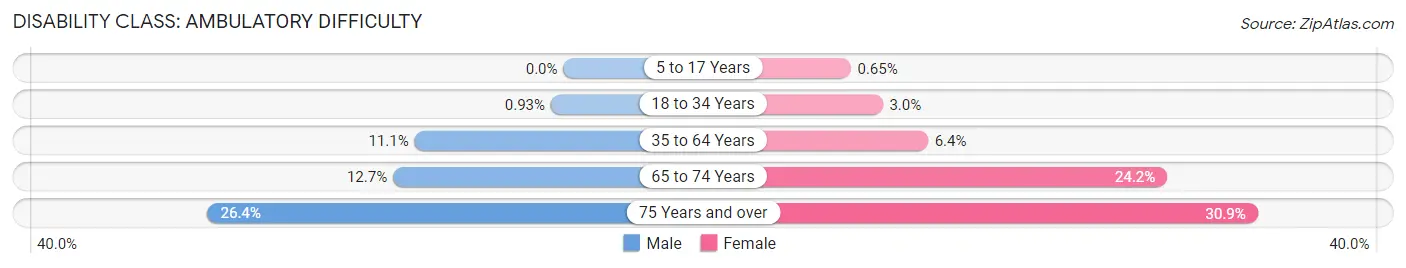
| Age Bracket | Male | Female |
| 5 to 17 Years | 0 (0.0%) | 38 (0.6%) |
| 18 to 34 Years | 62 (0.9%) | 224 (3.0%) |
| 35 to 64 Years | 1,292 (11.1%) | 826 (6.4%) |
| 65 to 74 Years | 337 (12.7%) | 706 (24.1%) |
| 75 Years and over | 389 (26.4%) | 635 (30.9%) |
Disability Class: Self-Care Difficulty
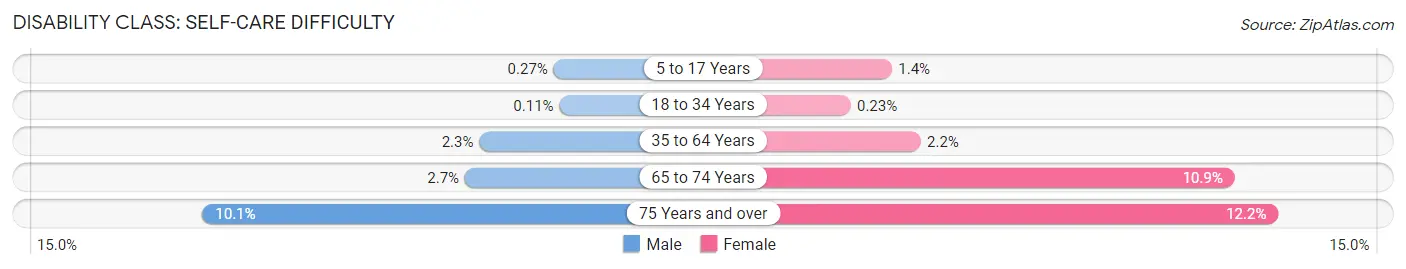
| Age Bracket | Male | Female |
| 5 to 17 Years | 16 (0.3%) | 81 (1.4%) |
| 18 to 34 Years | 7 (0.1%) | 17 (0.2%) |
| 35 to 64 Years | 274 (2.3%) | 283 (2.2%) |
| 65 to 74 Years | 73 (2.7%) | 320 (10.9%) |
| 75 Years and over | 148 (10.1%) | 250 (12.1%) |
Technology Access in Lamar County
Computing Device Access in Lamar County
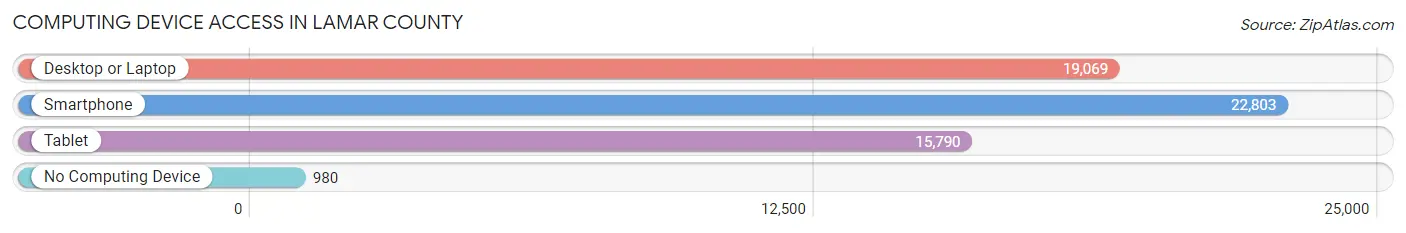
| Device Type | # Households | % Households |
| Desktop or Laptop | 19,069 | 76.6% |
| Smartphone | 22,803 | 91.6% |
| Tablet | 15,790 | 63.4% |
| No Computing Device | 980 | 3.9% |
| Total | 24,896 | 100.0% |
Internet Access in Lamar County
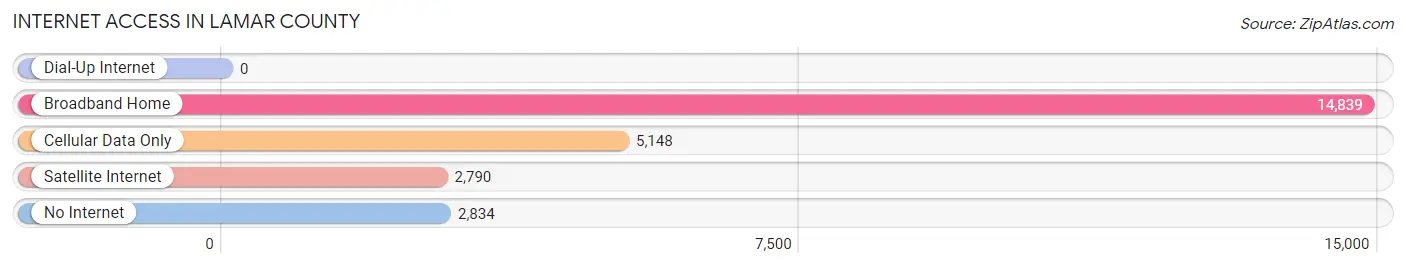
| Internet Type | # Households | % Households |
| Dial-Up Internet | 0 | 0.0% |
| Broadband Home | 14,839 | 59.6% |
| Cellular Data Only | 5,148 | 20.7% |
| Satellite Internet | 2,790 | 11.2% |
| No Internet | 2,834 | 11.4% |
| Total | 24,896 | 100.0% |
Lamar County Summary
Lamar County, Mississippi is located in the southeastern corner of the state, and is bordered by Marion County to the north, Forrest County to the east, Perry County to the south, and Jones County to the west. The county seat is Purvis, and the county is part of the Hattiesburg, MS Metropolitan Statistical Area. As of the 2010 census, the population of Lamar County was 55,658, making it the fourth most populous county in Mississippi.
Geography
Lamar County covers an area of 545 square miles, and is mostly rural. The terrain is mostly flat, with some rolling hills in the northern part of the county. The county is drained by the Leaf River, which flows through the center of the county. The county is also home to several small lakes, including Lake Serene, Lake Lamar, and Lake Bonhomme.
The climate of Lamar County is humid subtropical, with hot, humid summers and mild winters. The average annual temperature is around 68°F, and the average annual precipitation is around 50 inches.
Economy
The economy of Lamar County is largely based on agriculture and forestry. The county is home to several large timber companies, and the timber industry is the largest employer in the county. Other major industries in the county include manufacturing, healthcare, and retail.
The median household income in Lamar County is $41,845, and the median family income is $50,945. The unemployment rate in the county is 5.2%, which is slightly lower than the national average.
Demographics
As of the 2010 census, there were 55,658 people, 20,845 households, and 14,945 families living in Lamar County. The population density was 102.3 people per square mile. The racial makeup of the county was 79.2% White, 17.7% African American, 0.4% Native American, 0.7% Asian, 0.1% Pacific Islander, 0.7% from other races, and 1.2% from two or more races. Hispanic or Latino of any race were 2.2% of the population.
The median age in Lamar County was 37.3 years, and the gender makeup of the county was 48.7% male and 51.3% female. The median income for a household in the county was $41,845, and the median income for a family was $50,945.
Conclusion
Lamar County, Mississippi is a rural county located in the southeastern corner of the state. The county is home to several large timber companies, and the timber industry is the largest employer in the county. Other major industries in the county include manufacturing, healthcare, and retail. The population of Lamar County is 55,658, and the median household income is $41,845. The county is mostly rural, with a humid subtropical climate and hot, humid summers.
Common Questions
What is the Total Population of Lamar County?
Total Population of Lamar County is 64,425.
What is the Total Male Population of Lamar County?
Total Male Population of Lamar County is 30,879.
What is the Total Female Population of Lamar County?
Total Female Population of Lamar County is 33,546.
What is the Ratio of Males per 100 Females in Lamar County?
There are 92.05 Males per 100 Females in Lamar County.
What is the Ratio of Females per 100 Males in Lamar County?
There are 108.64 Females per 100 Males in Lamar County.
What is the Median Population Age in Lamar County?
Median Population Age in Lamar County is 37.3 Years.
What is the Average Family Size in Lamar County
Average Family Size in Lamar County is 3.0 People.
What is the Average Household Size in Lamar County
Average Household Size in Lamar County is 2.6 People.
What is Per Capita Income in Lamar County?
Per Capita income in Lamar County is $37,681.
What is the Median Family Income in Lamar County?
Median Family Income in Lamar County is $80,562.
What is the Median Household income in Lamar County?
Median Household Income in Lamar County is $67,972.
What is Income or Wage Gap in Lamar County?
Income or Wage Gap in Lamar County is 38.5%.
Women in Lamar County earn 61.5 cents for every dollar earned by a man.
What is Family Income Deficit in Lamar County?
Family Income Deficit in Lamar County is $12,728.
Families that are below poverty line in Lamar County earn $12,728 less on average than the poverty threshold level.
What is Inequality or Gini Index in Lamar County?
Inequality or Gini Index in Lamar County is 0.47.
How Large is the Labor Force in Lamar County?
There are 32,447 People in the Labor Forcein in Lamar County.
What is the Percentage of People in the Labor Force in Lamar County?
64.0% of People are in the Labor Force in Lamar County.
What is the Unemployment Rate in Lamar County?
Unemployment Rate in Lamar County is 5.8%.