Lafayette County, MS
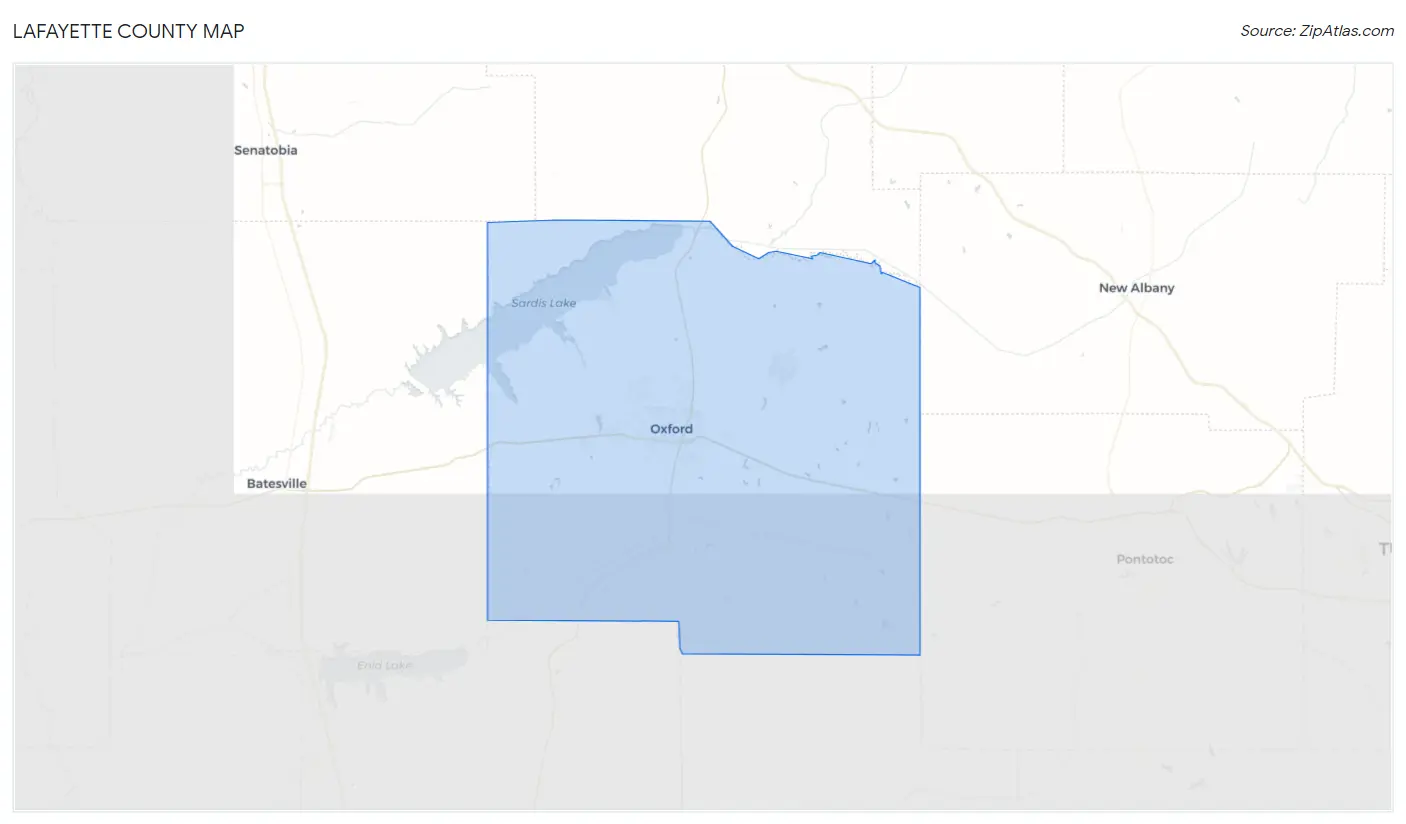
Lafayette County Map
Lafayette County Overview
56,172
TOTAL POPULATION
27,066
MALE POPULATION
29,106
FEMALE POPULATION
92.99
MALES / 100 FEMALES
107.54
FEMALES / 100 MALES
30.7
MEDIAN AGE
3.3
AVG FAMILY SIZE
2.7
AVG HOUSEHOLD SIZE
$32,536
PER CAPITA INCOME
$78,799
AVG FAMILY INCOME
$59,748
AVG HOUSEHOLD INCOME
37.1%
WAGE / INCOME GAP [ % ]
62.9¢/ $1
WAGE / INCOME GAP [ $ ]
$10,091
FAMILY INCOME DEFICIT
0.52
INEQUALITY / GINI INDEX
26,237
LABOR FORCE [ PEOPLE ]
55.9%
PERCENT IN LABOR FORCE
2.8%
UNEMPLOYMENT RATE
Lafayette County Area Codes
Race in Lafayette County
The most populous races in Lafayette County are White / Caucasian (39,722 | 70.7%), Black / African American (13,142 | 23.4%), and Hispanic or Latino (1,469 | 2.6%).
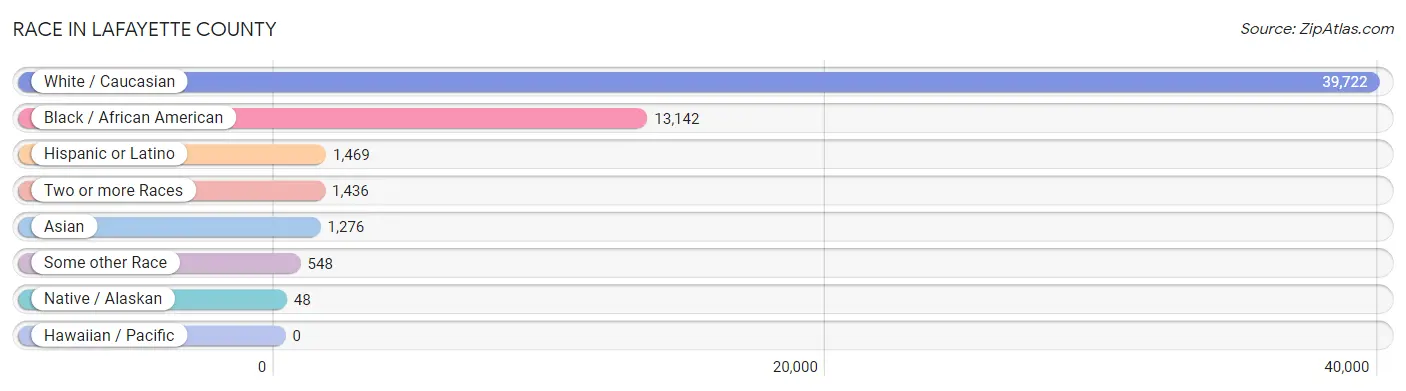
| Race | # Population | % Population |
| Asian | 1,276 | 2.3% |
| Black / African American | 13,142 | 23.4% |
| Hawaiian / Pacific | 0 | 0.0% |
| Hispanic or Latino | 1,469 | 2.6% |
| Native / Alaskan | 48 | 0.1% |
| White / Caucasian | 39,722 | 70.7% |
| Two or more Races | 1,436 | 2.6% |
| Some other Race | 548 | 1.0% |
| Total | 56,172 | 100.0% |
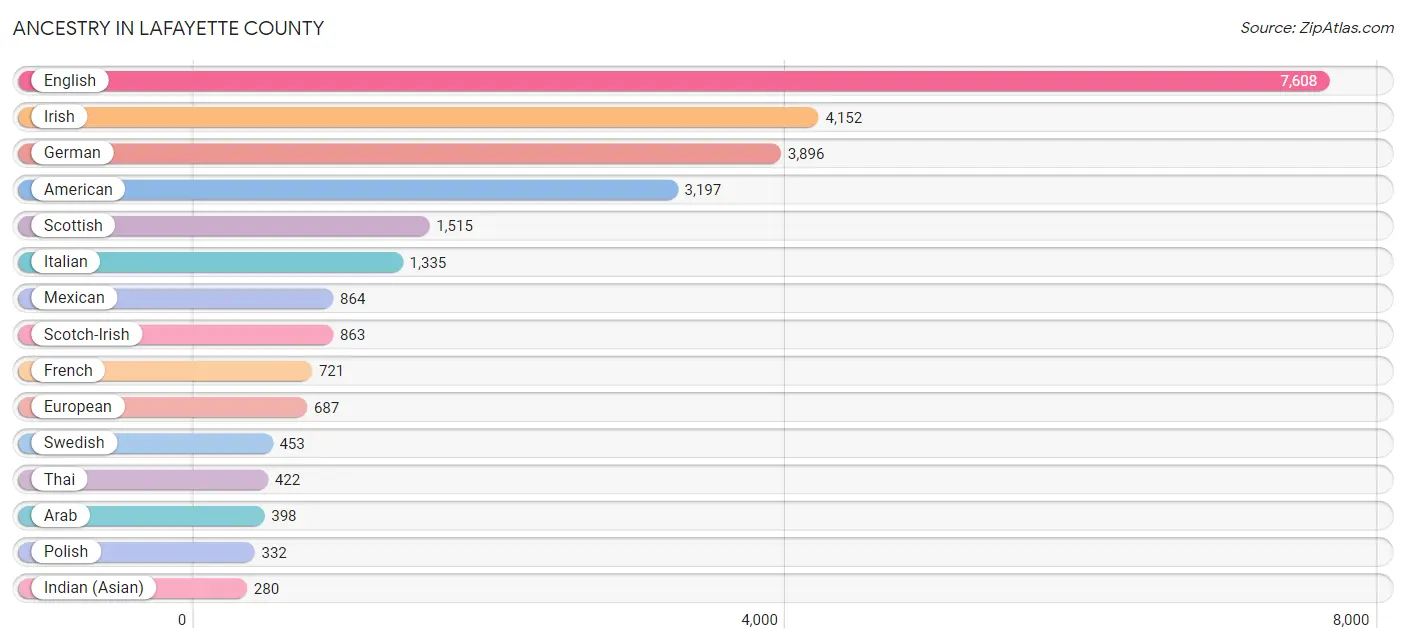
Ancestry in Lafayette County
The most populous ancestries reported in Lafayette County are English (7,608 | 13.5%), Irish (4,152 | 7.4%), German (3,896 | 6.9%), American (3,197 | 5.7%), and Scottish (1,515 | 2.7%), together accounting for 36.3% of all Lafayette County residents.
| Ancestry | # Population | % Population |
| Afghan | 28 | 0.1% |
| African | 29 | 0.1% |
| American | 3,197 | 5.7% |
| Arab | 398 | 0.7% |
| Armenian | 200 | 0.4% |
| Austrian | 36 | 0.1% |
| Bahamian | 112 | 0.2% |
| Belgian | 65 | 0.1% |
| Belizean | 27 | 0.1% |
| Bhutanese | 137 | 0.2% |
| Bolivian | 81 | 0.1% |
| Brazilian | 61 | 0.1% |
| British | 200 | 0.4% |
| Bulgarian | 8 | 0.0% |
| Burmese | 18 | 0.0% |
| Cajun | 11 | 0.0% |
| Canadian | 10 | 0.0% |
| Celtic | 51 | 0.1% |
| Central American | 27 | 0.1% |
| Cherokee | 56 | 0.1% |
| Choctaw | 33 | 0.1% |
| Colombian | 16 | 0.0% |
| Costa Rican | 2 | 0.0% |
| Croatian | 19 | 0.0% |
| Cuban | 201 | 0.4% |
| Czech | 61 | 0.1% |
| Czechoslovakian | 2 | 0.0% |
| Danish | 48 | 0.1% |
| Dominican | 58 | 0.1% |
| Dutch | 212 | 0.4% |
| Eastern European | 14 | 0.0% |
| English | 7,608 | 13.5% |
| Ethiopian | 42 | 0.1% |
| European | 687 | 1.2% |
| Finnish | 48 | 0.1% |
| French | 721 | 1.3% |
| French Canadian | 15 | 0.0% |
| German | 3,896 | 6.9% |
| Greek | 48 | 0.1% |
| Haitian | 9 | 0.0% |
| Honduran | 4 | 0.0% |
| Hungarian | 6 | 0.0% |
| Icelander | 4 | 0.0% |
| Indian (Asian) | 280 | 0.5% |
| Iranian | 42 | 0.1% |
| Irish | 4,152 | 7.4% |
| Italian | 1,335 | 2.4% |
| Jamaican | 15 | 0.0% |
| Jordanian | 162 | 0.3% |
| Kenyan | 11 | 0.0% |
| Korean | 152 | 0.3% |
| Lebanese | 92 | 0.2% |
| Lithuanian | 10 | 0.0% |
| Mexican | 864 | 1.5% |
| Nicaraguan | 7 | 0.0% |
| Nigerian | 17 | 0.0% |
| Northern European | 37 | 0.1% |
| Norwegian | 278 | 0.5% |
| Okinawan | 6 | 0.0% |
| Pakistani | 52 | 0.1% |
| Panamanian | 9 | 0.0% |
| Polish | 332 | 0.6% |
| Portuguese | 13 | 0.0% |
| Puerto Rican | 45 | 0.1% |
| Romanian | 26 | 0.1% |
| Russian | 108 | 0.2% |
| Salvadoran | 5 | 0.0% |
| Scandinavian | 51 | 0.1% |
| Scotch-Irish | 863 | 1.5% |
| Scottish | 1,515 | 2.7% |
| Slovak | 39 | 0.1% |
| South American | 122 | 0.2% |
| Spaniard | 114 | 0.2% |
| Spanish | 10 | 0.0% |
| Sri Lankan | 166 | 0.3% |
| Subsaharan African | 138 | 0.3% |
| Swedish | 453 | 0.8% |
| Swiss | 24 | 0.0% |
| Syrian | 26 | 0.1% |
| Thai | 422 | 0.7% |
| Turkish | 35 | 0.1% |
| Ukrainian | 13 | 0.0% |
| Venezuelan | 25 | 0.0% |
| Welsh | 173 | 0.3% | View All 84 Rows |
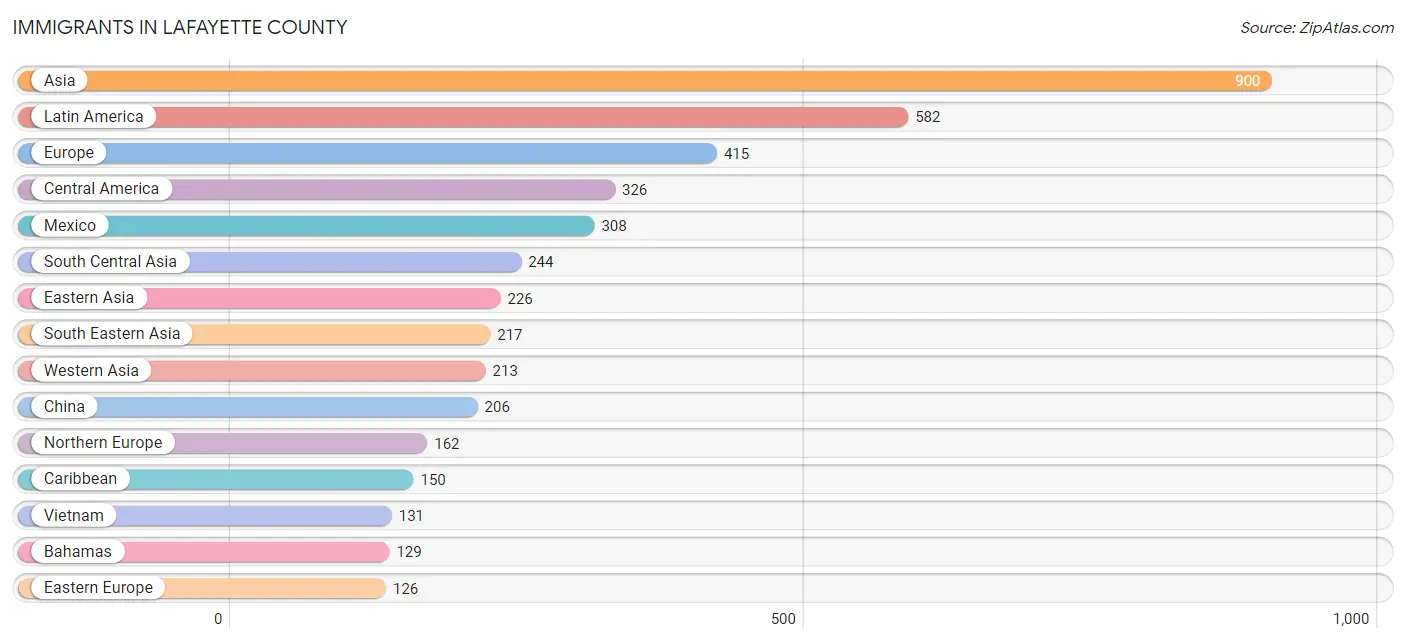
Immigrants in Lafayette County
The most numerous immigrant groups reported in Lafayette County came from Asia (900 | 1.6%), Latin America (582 | 1.0%), Europe (415 | 0.7%), Central America (326 | 0.6%), and Mexico (308 | 0.5%), together accounting for 4.5% of all Lafayette County residents.
| Immigration Origin | # Population | % Population |
| Africa | 72 | 0.1% |
| Asia | 900 | 1.6% |
| Bahamas | 129 | 0.2% |
| Bangladesh | 58 | 0.1% |
| Belize | 10 | 0.0% |
| Brazil | 81 | 0.1% |
| Bulgaria | 8 | 0.0% |
| Cameroon | 2 | 0.0% |
| Caribbean | 150 | 0.3% |
| Central America | 326 | 0.6% |
| China | 206 | 0.4% |
| Czechoslovakia | 7 | 0.0% |
| Eastern Africa | 53 | 0.1% |
| Eastern Asia | 226 | 0.4% |
| Eastern Europe | 126 | 0.2% |
| El Salvador | 5 | 0.0% |
| England | 99 | 0.2% |
| Ethiopia | 42 | 0.1% |
| Europe | 415 | 0.7% |
| France | 37 | 0.1% |
| Germany | 64 | 0.1% |
| Guatemala | 3 | 0.0% |
| India | 56 | 0.1% |
| Israel | 38 | 0.1% |
| Italy | 11 | 0.0% |
| Japan | 15 | 0.0% |
| Jordan | 122 | 0.2% |
| Kenya | 11 | 0.0% |
| Korea | 5 | 0.0% |
| Latin America | 582 | 1.0% |
| Mexico | 308 | 0.5% |
| Middle Africa | 2 | 0.0% |
| Nepal | 66 | 0.1% |
| Netherlands | 15 | 0.0% |
| Nigeria | 17 | 0.0% |
| Northern Europe | 162 | 0.3% |
| Philippines | 21 | 0.0% |
| Romania | 10 | 0.0% |
| Russia | 67 | 0.1% |
| Saudi Arabia | 39 | 0.1% |
| Scotland | 21 | 0.0% |
| Singapore | 6 | 0.0% |
| South America | 106 | 0.2% |
| South Central Asia | 244 | 0.4% |
| South Eastern Asia | 217 | 0.4% |
| Southern Europe | 11 | 0.0% |
| Taiwan | 4 | 0.0% |
| Thailand | 59 | 0.1% |
| Trinidad and Tobago | 21 | 0.0% |
| Ukraine | 34 | 0.1% |
| Uzbekistan | 64 | 0.1% |
| Venezuela | 25 | 0.0% |
| Vietnam | 131 | 0.2% |
| Western Africa | 17 | 0.0% |
| Western Asia | 213 | 0.4% |
| Western Europe | 116 | 0.2% | View All 56 Rows |
Sex and Age in Lafayette County
Sex and Age in Lafayette County
The most populous age groups in Lafayette County are 20 to 24 Years (4,423 | 16.3%) for men and 15 to 19 Years (3,880 | 13.3%) for women.
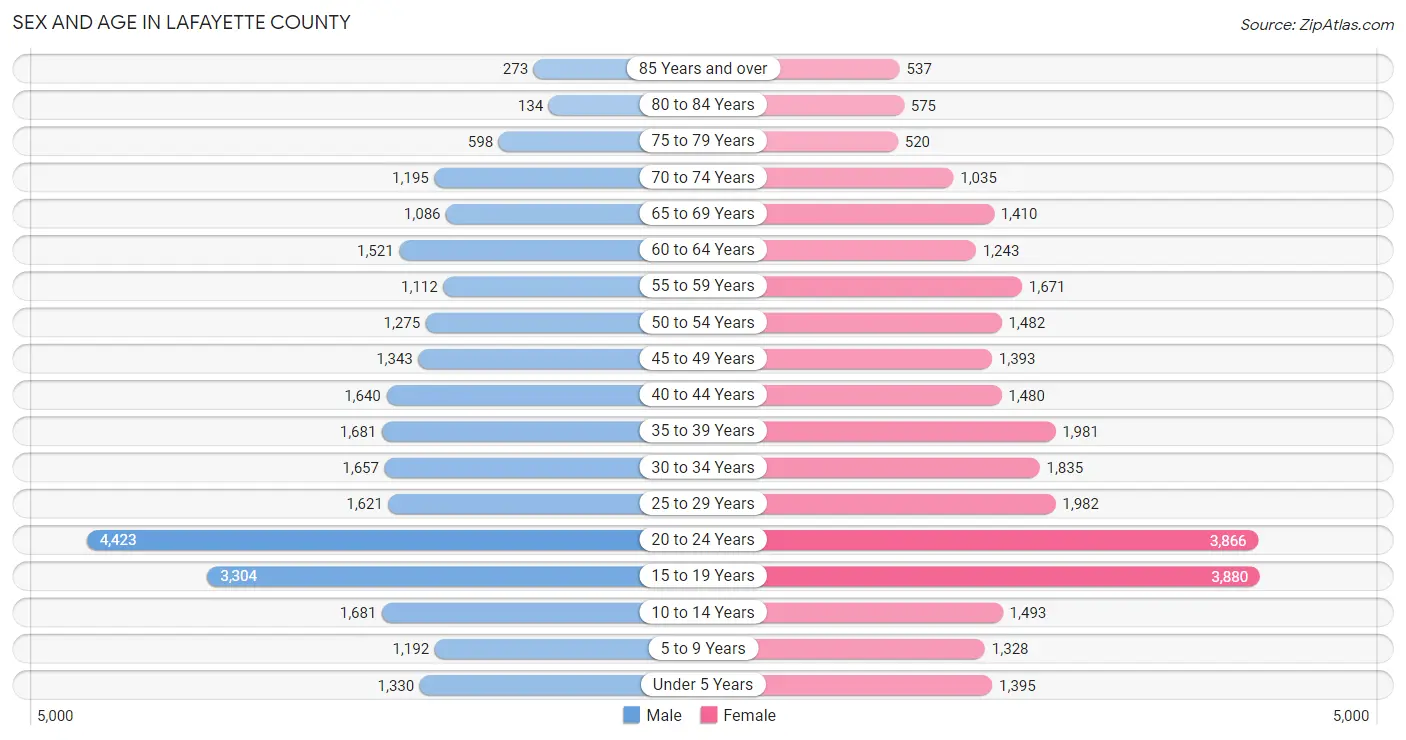
| Age Bracket | Male | Female |
| Under 5 Years | 1,330 (4.9%) | 1,395 (4.8%) |
| 5 to 9 Years | 1,192 (4.4%) | 1,328 (4.6%) |
| 10 to 14 Years | 1,681 (6.2%) | 1,493 (5.1%) |
| 15 to 19 Years | 3,304 (12.2%) | 3,880 (13.3%) |
| 20 to 24 Years | 4,423 (16.3%) | 3,866 (13.3%) |
| 25 to 29 Years | 1,621 (6.0%) | 1,982 (6.8%) |
| 30 to 34 Years | 1,657 (6.1%) | 1,835 (6.3%) |
| 35 to 39 Years | 1,681 (6.2%) | 1,981 (6.8%) |
| 40 to 44 Years | 1,640 (6.1%) | 1,480 (5.1%) |
| 45 to 49 Years | 1,343 (5.0%) | 1,393 (4.8%) |
| 50 to 54 Years | 1,275 (4.7%) | 1,482 (5.1%) |
| 55 to 59 Years | 1,112 (4.1%) | 1,671 (5.7%) |
| 60 to 64 Years | 1,521 (5.6%) | 1,243 (4.3%) |
| 65 to 69 Years | 1,086 (4.0%) | 1,410 (4.8%) |
| 70 to 74 Years | 1,195 (4.4%) | 1,035 (3.6%) |
| 75 to 79 Years | 598 (2.2%) | 520 (1.8%) |
| 80 to 84 Years | 134 (0.5%) | 575 (2.0%) |
| 85 Years and over | 273 (1.0%) | 537 (1.8%) |
| Total | 27,066 (100.0%) | 29,106 (100.0%) |
Families and Households in Lafayette County
Median Family Size in Lafayette County
The median family size in Lafayette County is 3.31 persons per family, with single female/mother families (2,279 | 20.6%) accounting for the largest median family size of 3.4 persons per family. On the other hand, single male/father families (329 | 3.0%) represent the smallest median family size with 3.19 persons per family.
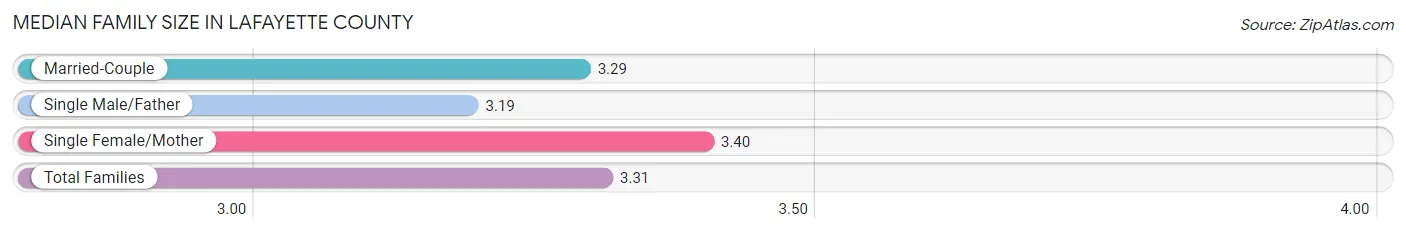
| Family Type | # Families | Family Size |
| Married-Couple | 8,427 (76.4%) | 3.29 |
| Single Male/Father | 329 (3.0%) | 3.19 |
| Single Female/Mother | 2,279 (20.6%) | 3.40 |
| Total Families | 11,035 (100.0%) | 3.31 |
Median Household Size in Lafayette County
The median household size in Lafayette County is 2.72 persons per household, with single female/mother households (2,279 | 12.2%) accounting for the largest median household size of 3.69 persons per household. non-family households (7,667 | 41.0%) represent the smallest median household size with 1.75 persons per household.
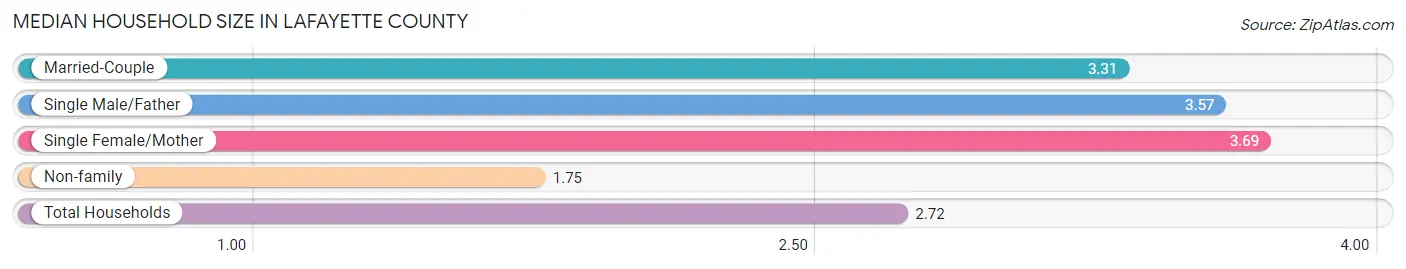
| Household Type | # Households | Household Size |
| Married-Couple | 8,427 (45.1%) | 3.31 |
| Single Male/Father | 329 (1.8%) | 3.57 |
| Single Female/Mother | 2,279 (12.2%) | 3.69 |
| Non-family | 7,667 (41.0%) | 1.75 |
| Total Households | 18,702 (100.0%) | 2.72 |
Household Size by Marriage Status in Lafayette County
Out of a total of 18,702 households in Lafayette County, 11,035 (59.0%) are family households, while 7,667 (41.0%) are nonfamily households. The most numerous type of family households are 2-person households, comprising 5,442, and the most common type of nonfamily households are 1-person households, comprising 5,722.
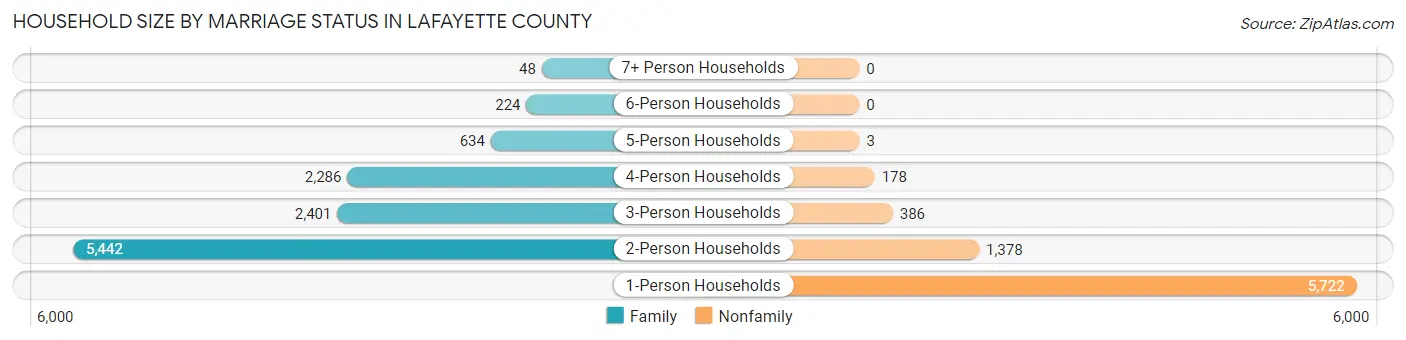
| Household Size | Family Households | Nonfamily Households |
| 1-Person Households | - | 5,722 (30.6%) |
| 2-Person Households | 5,442 (29.1%) | 1,378 (7.4%) |
| 3-Person Households | 2,401 (12.8%) | 386 (2.1%) |
| 4-Person Households | 2,286 (12.2%) | 178 (0.9%) |
| 5-Person Households | 634 (3.4%) | 3 (0.0%) |
| 6-Person Households | 224 (1.2%) | 0 (0.0%) |
| 7+ Person Households | 48 (0.3%) | 0 (0.0%) |
| Total | 11,035 (59.0%) | 7,667 (41.0%) |
Female Fertility in Lafayette County
Fertility by Age in Lafayette County
Average fertility rate in Lafayette County is 33.0 births per 1,000 women. Women in the age bracket of 20 to 34 years have the highest fertility rate with 46.0 births per 1,000 women. Women in the age bracket of 20 to 34 years acount for 63.5% of all women with births.
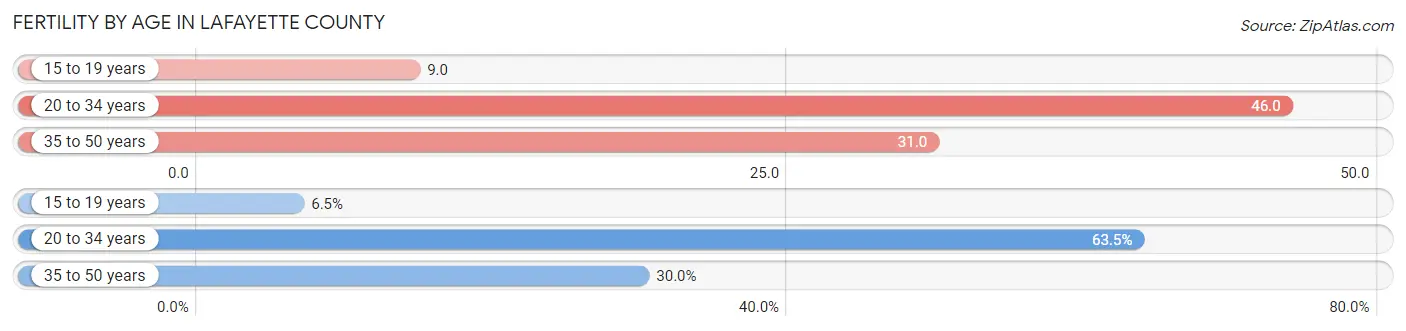
| Age Bracket | Women with Births | Births / 1,000 Women |
| 15 to 19 years | 36 (6.5%) | 9.0 |
| 20 to 34 years | 350 (63.5%) | 46.0 |
| 35 to 50 years | 165 (29.9%) | 31.0 |
| Total | 551 (100.0%) | 33.0 |
Fertility by Age by Marriage Status in Lafayette County
34.7% of women with births (551) in Lafayette County are married. The highest percentage of unmarried women with births falls into 15 to 19 years age bracket with 100.0% of them unmarried at the time of birth, while the lowest percentage of unmarried women with births belong to 20 to 34 years age bracket with 58.3% of them unmarried.
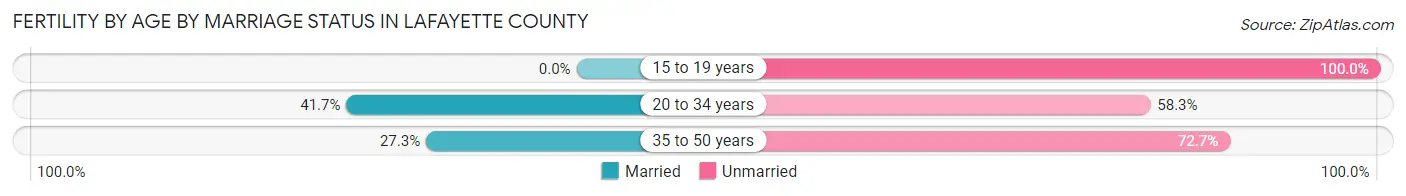
| Age Bracket | Married | Unmarried |
| 15 to 19 years | 0 (0.0%) | 36 (100.0%) |
| 20 to 34 years | 146 (41.7%) | 204 (58.3%) |
| 35 to 50 years | 45 (27.3%) | 120 (72.7%) |
| Total | 191 (34.7%) | 360 (65.3%) |
Fertility by Education in Lafayette County
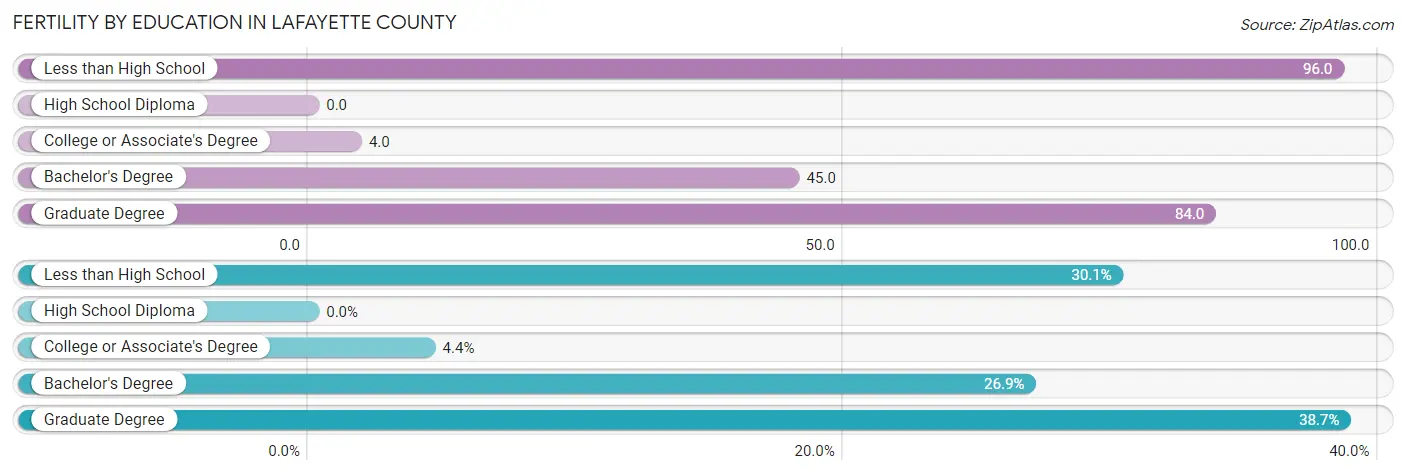
| Educational Attainment | Women with Births | Births / 1,000 Women |
| Less than High School | 166 (30.1%) | 96.0 |
| High School Diploma | 0 (0.0%) | 0.0 |
| College or Associate's Degree | 24 (4.4%) | 4.0 |
| Bachelor's Degree | 148 (26.9%) | 45.0 |
| Graduate Degree | 213 (38.7%) | 84.0 |
| Total | 551 (100.0%) | 33.0 |
Fertility by Education by Marriage Status in Lafayette County
65.3% of women with births in Lafayette County are unmarried. Women with the educational attainment of college or associate's degree are most likely to be married with 100.0% of them married at childbirth, while women with the educational attainment of less than high school are least likely to be married with 94.0% of them unmarried at childbirth.
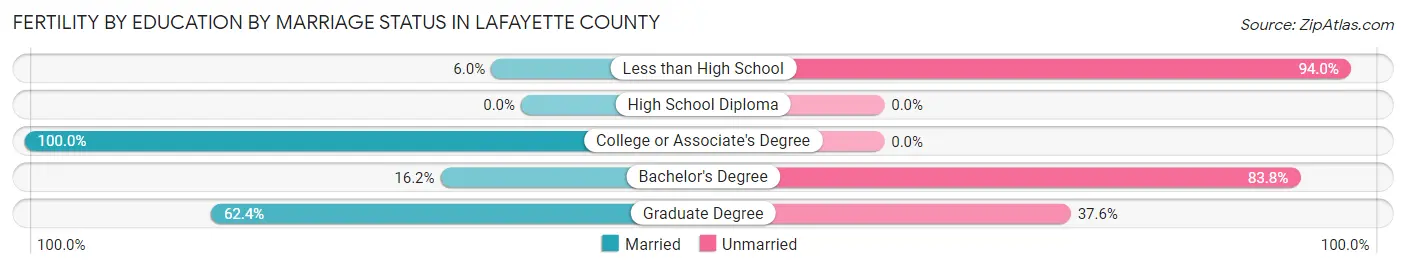
| Educational Attainment | Married | Unmarried |
| Less than High School | 10 (6.0%) | 156 (94.0%) |
| High School Diploma | 0 (0.0%) | 0 (0.0%) |
| College or Associate's Degree | 24 (100.0%) | 0 (0.0%) |
| Bachelor's Degree | 24 (16.2%) | 124 (83.8%) |
| Graduate Degree | 133 (62.4%) | 80 (37.6%) |
| Total | 191 (34.7%) | 360 (65.3%) |
Income in Lafayette County
Income Overview in Lafayette County
Per Capita Income in Lafayette County is $32,536, while median incomes of families and households are $78,799 and $59,748 respectively.
| Characteristic | Number | Measure |
| Per Capita Income | 56,172 | $32,536 |
| Median Family Income | 11,035 | $78,799 |
| Mean Family Income | 11,035 | $116,795 |
| Median Household Income | 18,702 | $59,748 |
| Mean Household Income | 18,702 | $91,629 |
| Income Deficit | 11,035 | $10,091 |
| Wage / Income Gap (%) | 56,172 | 37.13% |
| Wage / Income Gap ($) | 56,172 | 62.87¢ per $1 |
| Gini / Inequality Index | 56,172 | 0.52 |
Earnings by Sex in Lafayette County
Average Earnings in Lafayette County are $29,232, $36,657 for men and $23,047 for women, a difference of 37.1%.
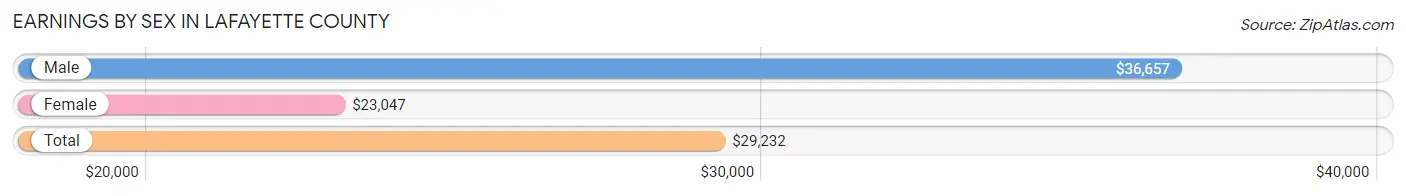
| Sex | Number | Average Earnings |
| Male | 14,444 (47.6%) | $36,657 |
| Female | 15,925 (52.4%) | $23,047 |
| Total | 30,369 (100.0%) | $29,232 |
Earnings by Sex by Income Bracket in Lafayette County
The most common earnings brackets in Lafayette County are $100,000+ for men (2,291 | 15.9%) and $2,499 or less for women (1,983 | 12.4%).
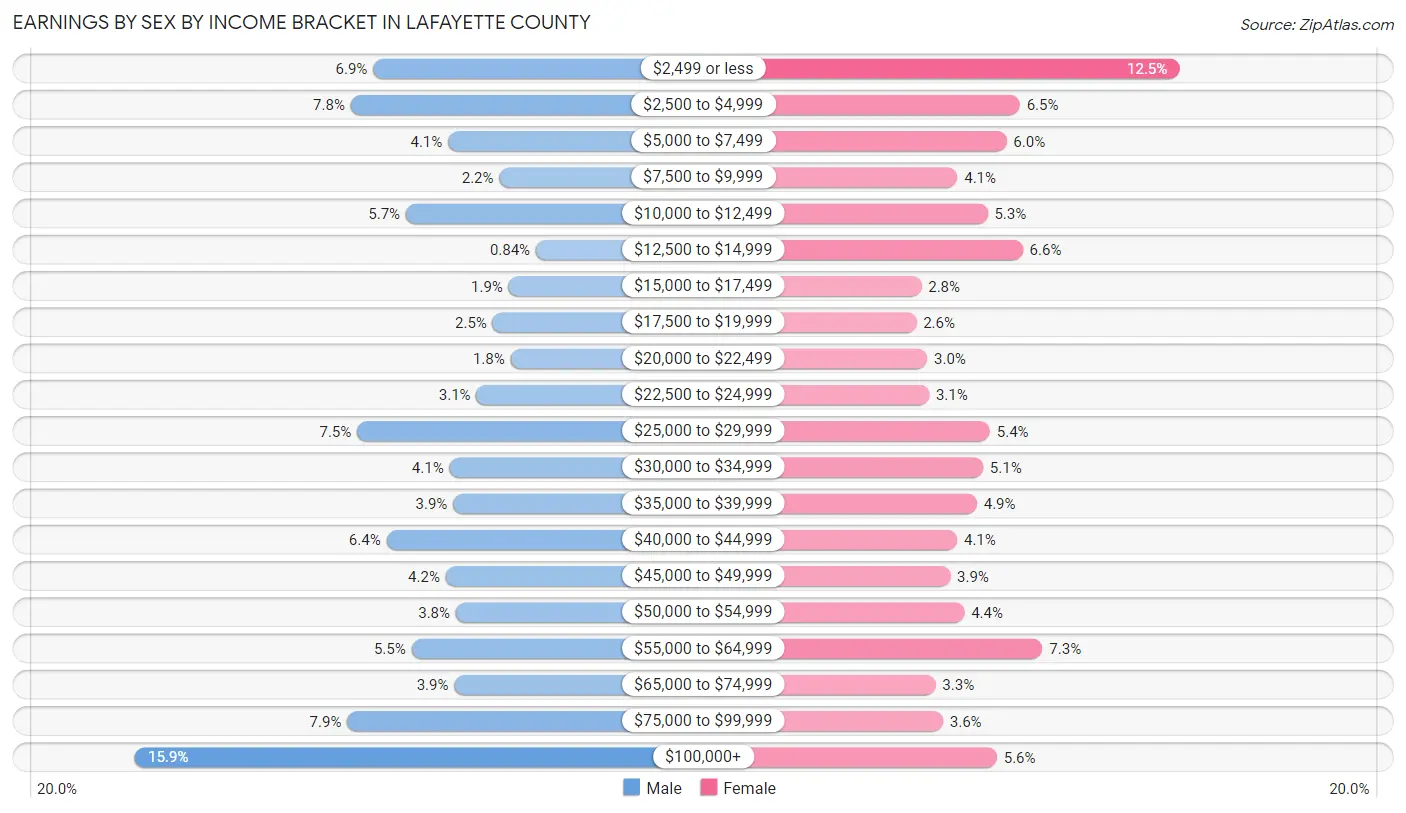
| Income | Male | Female |
| $2,499 or less | 1,002 (6.9%) | 1,983 (12.4%) |
| $2,500 to $4,999 | 1,124 (7.8%) | 1,032 (6.5%) |
| $5,000 to $7,499 | 596 (4.1%) | 953 (6.0%) |
| $7,500 to $9,999 | 319 (2.2%) | 660 (4.1%) |
| $10,000 to $12,499 | 825 (5.7%) | 840 (5.3%) |
| $12,500 to $14,999 | 122 (0.8%) | 1,049 (6.6%) |
| $15,000 to $17,499 | 268 (1.9%) | 444 (2.8%) |
| $17,500 to $19,999 | 355 (2.5%) | 414 (2.6%) |
| $20,000 to $22,499 | 259 (1.8%) | 480 (3.0%) |
| $22,500 to $24,999 | 444 (3.1%) | 491 (3.1%) |
| $25,000 to $29,999 | 1,089 (7.5%) | 854 (5.4%) |
| $30,000 to $34,999 | 589 (4.1%) | 812 (5.1%) |
| $35,000 to $39,999 | 569 (3.9%) | 775 (4.9%) |
| $40,000 to $44,999 | 930 (6.4%) | 658 (4.1%) |
| $45,000 to $49,999 | 609 (4.2%) | 617 (3.9%) |
| $50,000 to $54,999 | 554 (3.8%) | 700 (4.4%) |
| $55,000 to $64,999 | 794 (5.5%) | 1,167 (7.3%) |
| $65,000 to $74,999 | 563 (3.9%) | 528 (3.3%) |
| $75,000 to $99,999 | 1,142 (7.9%) | 573 (3.6%) |
| $100,000+ | 2,291 (15.9%) | 895 (5.6%) |
| Total | 14,444 (100.0%) | 15,925 (100.0%) |
Earnings by Sex by Educational Attainment in Lafayette County
Average earnings in Lafayette County are $49,213 for men and $35,443 for women, a difference of 28.0%. Men with an educational attainment of graduate degree enjoy the highest average annual earnings of $82,917, while those with less than high school education earn the least with $23,400. Women with an educational attainment of graduate degree earn the most with the average annual earnings of $59,254, while those with high school diploma education have the smallest earnings of $23,973.
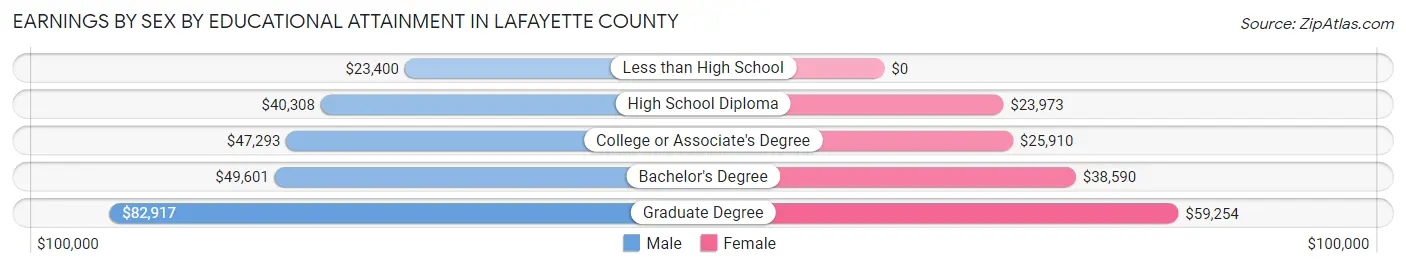
| Educational Attainment | Male Income | Female Income |
| Less than High School | $23,400 | $0 |
| High School Diploma | $40,308 | $23,973 |
| College or Associate's Degree | $47,293 | $25,910 |
| Bachelor's Degree | $49,601 | $38,590 |
| Graduate Degree | $82,917 | $59,254 |
| Total | $49,213 | $35,443 |
Family Income in Lafayette County
Family Income Brackets in Lafayette County
According to the Lafayette County family income data, there are 1,997 families falling into the $50,000 to $74,999 income range, which is the most common income bracket and makes up 18.1% of all families. Conversely, the less than $10,000 income bracket is the least frequent group with only 419 families (3.8%) belonging to this category.
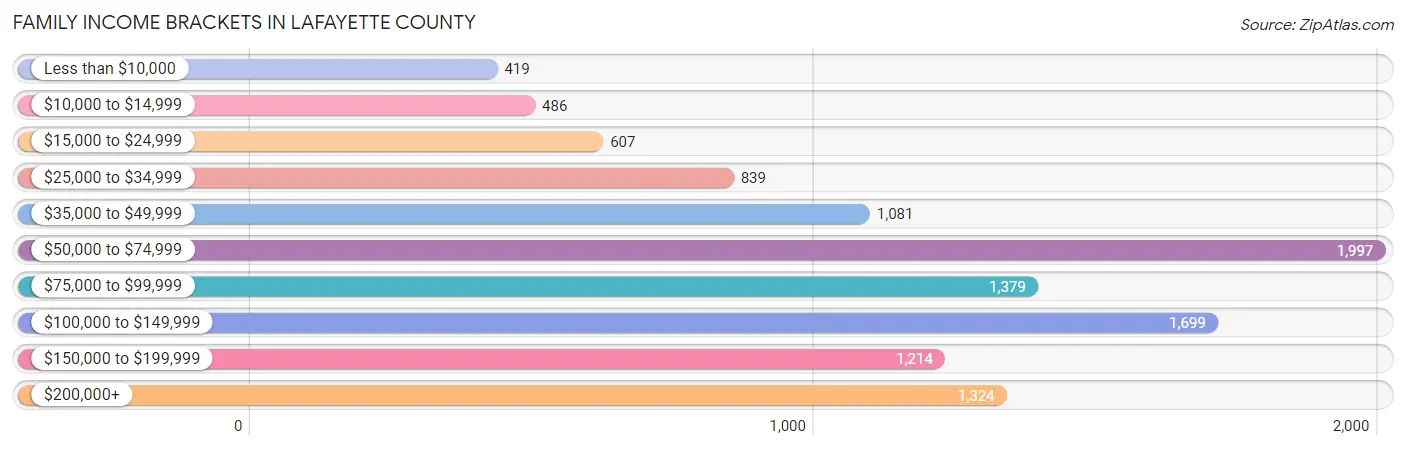
| Income Bracket | # Families | % Families |
| Less than $10,000 | 419 | 3.8% |
| $10,000 to $14,999 | 486 | 4.4% |
| $15,000 to $24,999 | 607 | 5.5% |
| $25,000 to $34,999 | 839 | 7.6% |
| $35,000 to $49,999 | 1,081 | 9.8% |
| $50,000 to $74,999 | 1,997 | 18.1% |
| $75,000 to $99,999 | 1,379 | 12.5% |
| $100,000 to $149,999 | 1,699 | 15.4% |
| $150,000 to $199,999 | 1,214 | 11.0% |
| $200,000+ | 1,324 | 12.0% |
Family Income by Famaliy Size in Lafayette County
7+ person families (48 | 0.4%) account for the highest median family income in Lafayette County with $250,001 per family, while 2-person families (5,799 | 52.5%) have the highest median income of $36,782 per family member.
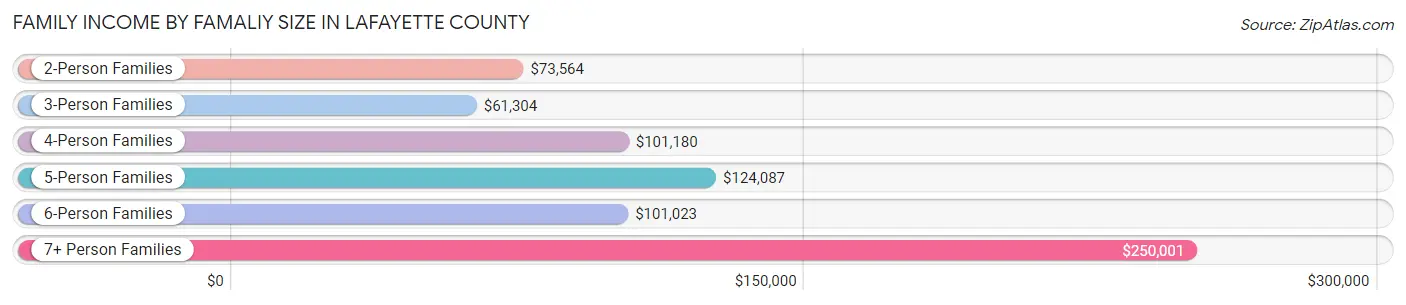
| Income Bracket | # Families | Median Income |
| 2-Person Families | 5,799 (52.5%) | $73,564 |
| 3-Person Families | 2,474 (22.4%) | $61,304 |
| 4-Person Families | 1,856 (16.8%) | $101,180 |
| 5-Person Families | 653 (5.9%) | $124,087 |
| 6-Person Families | 205 (1.9%) | $101,023 |
| 7+ Person Families | 48 (0.4%) | $250,001 |
| Total | 11,035 (100.0%) | $78,799 |
Family Income by Number of Earners in Lafayette County
The median family income in Lafayette County is $78,799, with families comprising 3+ earners (529) having the highest median family income of $179,306, while families with no earners (1,651) have the lowest median family income of $46,543, accounting for 4.8% and 15.0% of families, respectively.
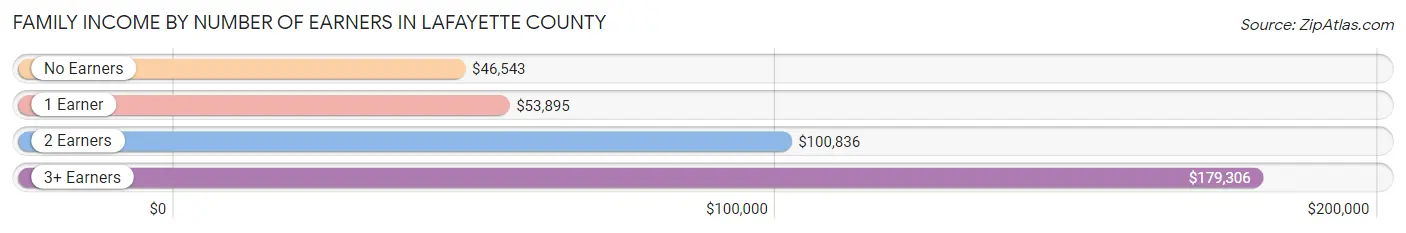
| Number of Earners | # Families | Median Income |
| No Earners | 1,651 (15.0%) | $46,543 |
| 1 Earner | 3,756 (34.0%) | $53,895 |
| 2 Earners | 5,099 (46.2%) | $100,836 |
| 3+ Earners | 529 (4.8%) | $179,306 |
| Total | 11,035 (100.0%) | $78,799 |
Household Income in Lafayette County
Household Income Brackets in Lafayette County
With 3,348 households falling in the category, the $50,000 to $74,999 income range is the most frequent in Lafayette County, accounting for 17.9% of all households. In contrast, only 1,029 households (5.5%) fall into the $10,000 to $14,999 income bracket, making it the least populous group.
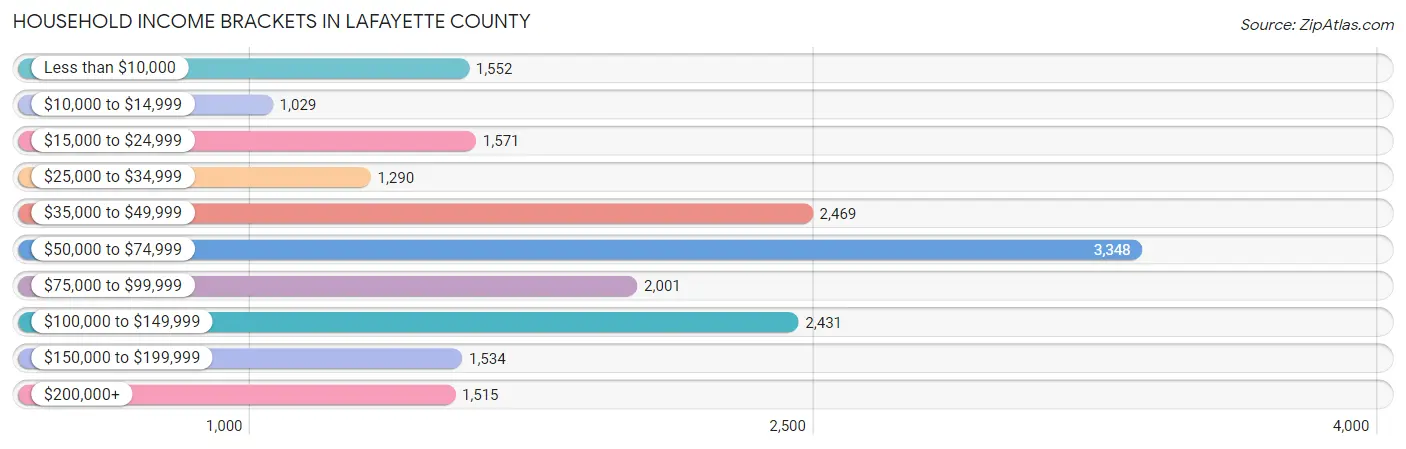
| Income Bracket | # Households | % Households |
| Less than $10,000 | 1,552 | 8.3% |
| $10,000 to $14,999 | 1,029 | 5.5% |
| $15,000 to $24,999 | 1,571 | 8.4% |
| $25,000 to $34,999 | 1,290 | 6.9% |
| $35,000 to $49,999 | 2,469 | 13.2% |
| $50,000 to $74,999 | 3,348 | 17.9% |
| $75,000 to $99,999 | 2,001 | 10.7% |
| $100,000 to $149,999 | 2,431 | 13.0% |
| $150,000 to $199,999 | 1,534 | 8.2% |
| $200,000+ | 1,515 | 8.1% |
Household Income by Householder Age in Lafayette County
The median household income in Lafayette County is $59,748, with the highest median household income of $86,439 found in the 45 to 64 years age bracket for the primary householder. A total of 5,491 households (29.4%) fall into this category. Meanwhile, the 15 to 24 years age bracket for the primary householder has the lowest median household income of $10,427, with 1,808 households (9.7%) in this group.
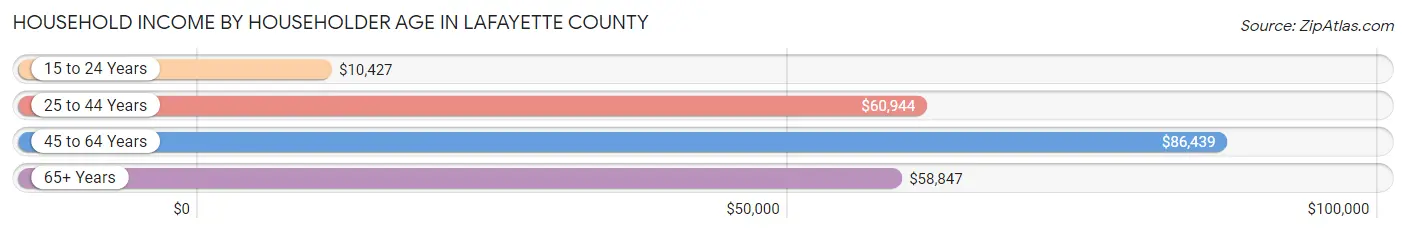
| Income Bracket | # Households | Median Income |
| 15 to 24 Years | 1,808 (9.7%) | $10,427 |
| 25 to 44 Years | 6,845 (36.6%) | $60,944 |
| 45 to 64 Years | 5,491 (29.4%) | $86,439 |
| 65+ Years | 4,558 (24.4%) | $58,847 |
| Total | 18,702 (100.0%) | $59,748 |
Poverty in Lafayette County
Income Below Poverty by Sex and Age in Lafayette County
With 18.3% poverty level for males and 20.9% for females among the residents of Lafayette County, 18 to 24 year old males and 18 to 24 year old females are the most vulnerable to poverty, with 2,724 males (54.7%) and 2,395 females (56.8%) in their respective age groups living below the poverty level.
| Age Bracket | Male | Female |
| Under 5 Years | 173 (13.2%) | 117 (8.7%) |
| 5 Years | 68 (44.2%) | 12 (3.7%) |
| 6 to 11 Years | 268 (15.3%) | 232 (17.7%) |
| 12 to 14 Years | 171 (19.6%) | 282 (23.9%) |
| 15 Years | 8 (1.6%) | 182 (55.3%) |
| 16 and 17 Years | 25 (8.2%) | 49 (9.1%) |
| 18 to 24 Years | 2,724 (54.7%) | 2,395 (56.8%) |
| 25 to 34 Years | 361 (11.3%) | 533 (14.0%) |
| 35 to 44 Years | 242 (7.3%) | 714 (20.7%) |
| 45 to 54 Years | 104 (4.0%) | 298 (10.4%) |
| 55 to 64 Years | 196 (7.6%) | 412 (14.3%) |
| 65 to 74 Years | 143 (6.6%) | 108 (4.5%) |
| 75 Years and over | 23 (2.6%) | 127 (8.6%) |
| Total | 4,506 (18.3%) | 5,461 (20.9%) |
Income Above Poverty by Sex and Age in Lafayette County
According to the poverty statistics in Lafayette County, males aged 15 years and females aged 5 years are the age groups that are most secure financially, with 98.4% of males and 96.3% of females in these age groups living above the poverty line.
| Age Bracket | Male | Female |
| Under 5 Years | 1,137 (86.8%) | 1,230 (91.3%) |
| 5 Years | 86 (55.8%) | 316 (96.3%) |
| 6 to 11 Years | 1,487 (84.7%) | 1,080 (82.3%) |
| 12 to 14 Years | 703 (80.4%) | 899 (76.1%) |
| 15 Years | 481 (98.4%) | 147 (44.7%) |
| 16 and 17 Years | 280 (91.8%) | 487 (90.9%) |
| 18 to 24 Years | 2,258 (45.3%) | 1,824 (43.2%) |
| 25 to 34 Years | 2,845 (88.7%) | 3,280 (86.0%) |
| 35 to 44 Years | 3,056 (92.7%) | 2,740 (79.3%) |
| 45 to 54 Years | 2,493 (96.0%) | 2,577 (89.6%) |
| 55 to 64 Years | 2,386 (92.4%) | 2,466 (85.7%) |
| 65 to 74 Years | 2,010 (93.4%) | 2,310 (95.5%) |
| 75 Years and over | 860 (97.4%) | 1,346 (91.4%) |
| Total | 20,082 (81.7%) | 20,702 (79.1%) |
Income Below Poverty Among Married-Couple Families in Lafayette County
The poverty statistics for married-couple families in Lafayette County show that 4.3% or 364 of the total 8,427 families live below the poverty line. Families with 3 or 4 children have the highest poverty rate of 7.6%, comprising of 45 families. On the other hand, families with no children have the lowest poverty rate of 3.8%, which includes 193 families.
| Children | Above Poverty | Below Poverty |
| No Children | 4,849 (96.2%) | 193 (3.8%) |
| 1 or 2 Children | 2,671 (95.5%) | 126 (4.5%) |
| 3 or 4 Children | 543 (92.3%) | 45 (7.6%) |
| 5 or more Children | 0 (0.0%) | 0 (0.0%) |
| Total | 8,063 (95.7%) | 364 (4.3%) |
Income Below Poverty Among Single-Parent Households in Lafayette County
According to the poverty data in Lafayette County, 47.1% or 155 single-father households and 30.4% or 692 single-mother households are living below the poverty line. Among single-father households, those with 1 or 2 children have the highest poverty rate, with 75 households (62.5%) experiencing poverty. Likewise, among single-mother households, those with 1 or 2 children have the highest poverty rate, with 459 households (38.1%) falling below the poverty line.
| Children | Single Father | Single Mother |
| No Children | 80 (38.3%) | 204 (22.5%) |
| 1 or 2 Children | 75 (62.5%) | 459 (38.1%) |
| 3 or 4 Children | 0 (0.0%) | 29 (17.6%) |
| 5 or more Children | 0 (0.0%) | 0 (0.0%) |
| Total | 155 (47.1%) | 692 (30.4%) |
Income Below Poverty Among Married-Couple vs Single-Parent Households in Lafayette County
The poverty data for Lafayette County shows that 364 of the married-couple family households (4.3%) and 847 of the single-parent households (32.5%) are living below the poverty level. Within the married-couple family households, those with 3 or 4 children have the highest poverty rate, with 45 households (7.6%) falling below the poverty line. Among the single-parent households, those with 1 or 2 children have the highest poverty rate, with 534 household (40.3%) living below poverty.
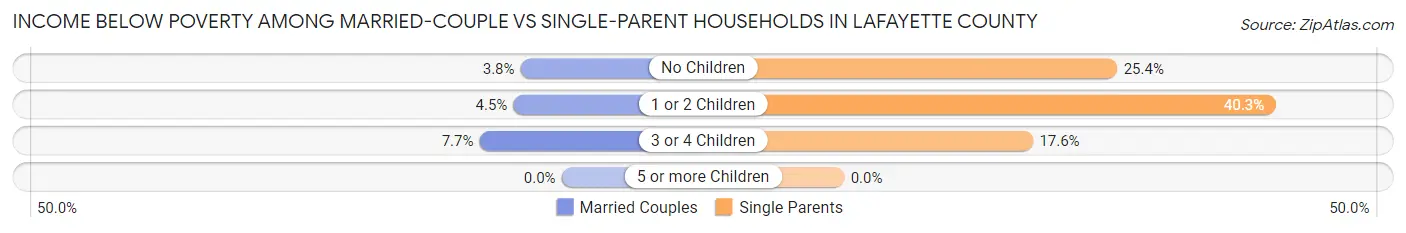
| Children | Married-Couple Families | Single-Parent Households |
| No Children | 193 (3.8%) | 284 (25.4%) |
| 1 or 2 Children | 126 (4.5%) | 534 (40.3%) |
| 3 or 4 Children | 45 (7.6%) | 29 (17.6%) |
| 5 or more Children | 0 (0.0%) | 0 (0.0%) |
| Total | 364 (4.3%) | 847 (32.5%) |
Employment Characteristics in Lafayette County
Employment by Class of Employer in Lafayette County
Among the 24,693 employed individuals in Lafayette County, private company employees (13,322 | 53.9%), state government employees (4,705 | 19.1%), and not-for-profit organizations (1,927 | 7.8%) make up the most common classes of employment.
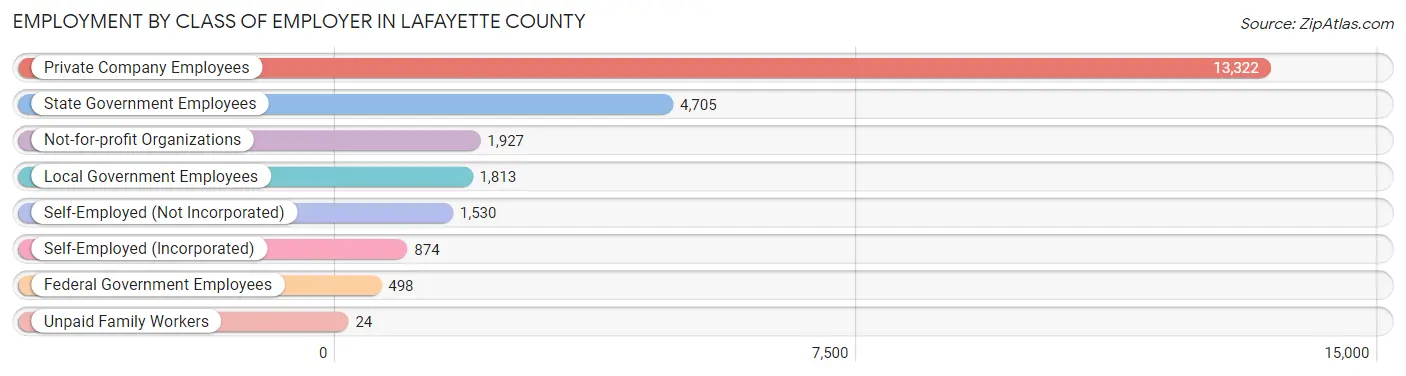
| Employer Class | # Employees | % Employees |
| Private Company Employees | 13,322 | 53.9% |
| Self-Employed (Incorporated) | 874 | 3.5% |
| Self-Employed (Not Incorporated) | 1,530 | 6.2% |
| Not-for-profit Organizations | 1,927 | 7.8% |
| Local Government Employees | 1,813 | 7.3% |
| State Government Employees | 4,705 | 19.1% |
| Federal Government Employees | 498 | 2.0% |
| Unpaid Family Workers | 24 | 0.1% |
| Total | 24,693 | 100.0% |
Employment Status by Age in Lafayette County
According to the labor force statistics for Lafayette County, out of the total population over 16 years of age (46,935), 55.9% or 26,237 individuals are in the labor force, with 2.8% or 735 of them unemployed. The age group with the highest labor force participation rate is 35 to 44 years, with 87.6% or 5,941 individuals in the labor force. Within the labor force, the 25 to 29 years age range has the highest percentage of unemployed individuals, with 6.0% or 189 of them being unemployed.
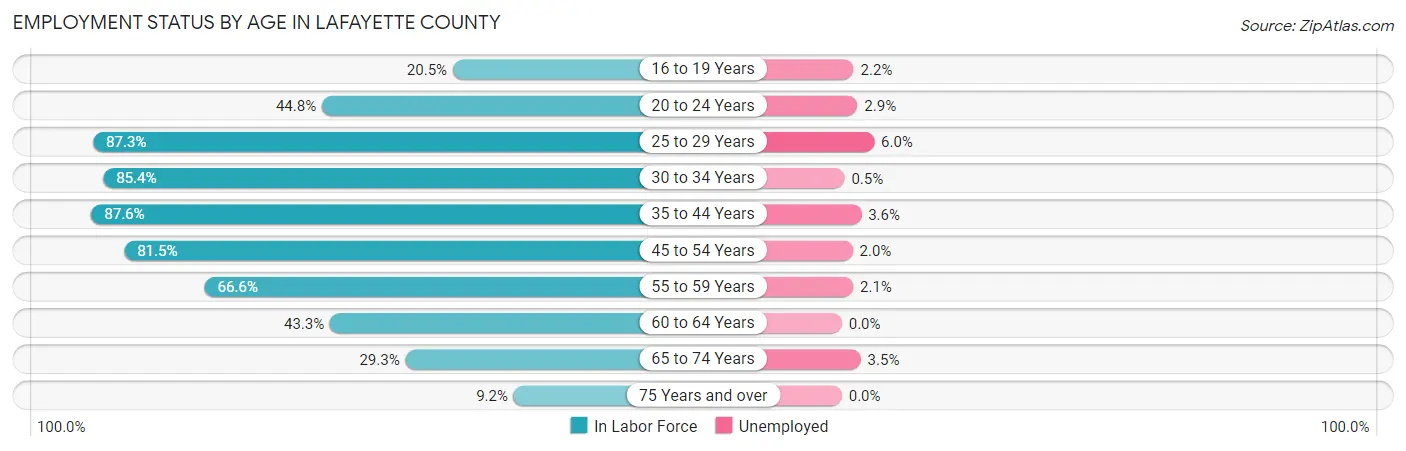
| Age Bracket | In Labor Force | Unemployed |
| 16 to 19 Years | 1,305 (20.5%) | 29 (2.2%) |
| 20 to 24 Years | 3,713 (44.8%) | 108 (2.9%) |
| 25 to 29 Years | 3,145 (87.3%) | 189 (6.0%) |
| 30 to 34 Years | 2,982 (85.4%) | 15 (0.5%) |
| 35 to 44 Years | 5,941 (87.6%) | 214 (3.6%) |
| 45 to 54 Years | 4,477 (81.5%) | 90 (2.0%) |
| 55 to 59 Years | 1,853 (66.6%) | 39 (2.1%) |
| 60 to 64 Years | 1,197 (43.3%) | 0 (0.0%) |
| 65 to 74 Years | 1,385 (29.3%) | 48 (3.5%) |
| 75 Years and over | 243 (9.2%) | 0 (0.0%) |
| Total | 26,237 (55.9%) | 735 (2.8%) |
Employment Status by Educational Attainment in Lafayette County
According to labor force statistics for Lafayette County, 78.6% of individuals (19,585) out of the total population between 25 and 64 years of age (24,917) are in the labor force, with 2.8% or 548 of them being unemployed. The group with the highest labor force participation rate are those with the educational attainment of bachelor's degree or higher, with 88.5% or 10,190 individuals in the labor force. Within the labor force, individuals with high school diploma education have the highest percentage of unemployment, with 4.8% or 161 of them being unemployed.
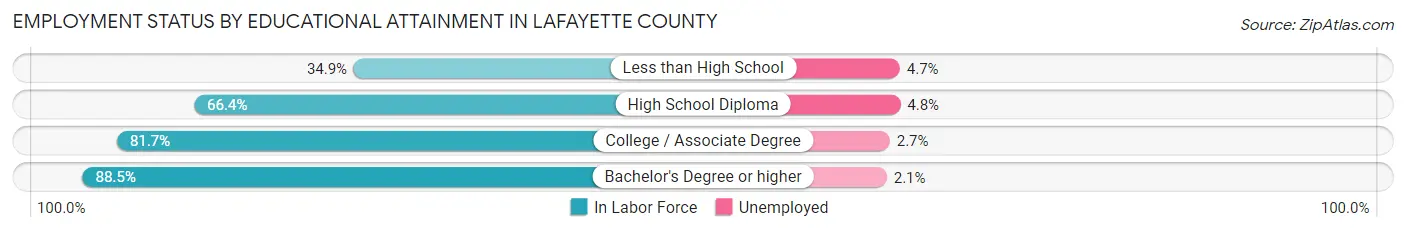
| Educational Attainment | In Labor Force | Unemployed |
| Less than High School | 574 (34.9%) | 77 (4.7%) |
| High School Diploma | 3,361 (66.4%) | 243 (4.8%) |
| College / Associate Degree | 5,471 (81.7%) | 181 (2.7%) |
| Bachelor's Degree or higher | 10,190 (88.5%) | 242 (2.1%) |
| Total | 19,585 (78.6%) | 698 (2.8%) |
Employment Occupations by Sex in Lafayette County
Management, Business, Science and Arts Occupations
The most common Management, Business, Science and Arts occupations in Lafayette County are Community & Social Service (4,440 | 17.4%), Education Instruction & Library (3,133 | 12.3%), Management (2,200 | 8.6%), Health Diagnosing & Treating (2,104 | 8.3%), and Health Technologists (1,502 | 5.9%).
Management, Business, Science and Arts Occupations by Sex
Within the Management, Business, Science and Arts occupations in Lafayette County, the most male-oriented occupations are Computers & Mathematics (80.7%), Computers, Engineering & Science (65.1%), and Arts, Media & Entertainment (61.4%), while the most female-oriented occupations are Health Diagnosing & Treating (72.2%), Health Technologists (68.8%), and Education Instruction & Library (68.5%).
| Occupation | Male | Female |
| Management | 1,082 (49.2%) | 1,118 (50.8%) |
| Business & Financial | 562 (46.2%) | 654 (53.8%) |
| Computers, Engineering & Science | 503 (65.1%) | 270 (34.9%) |
| Computers & Mathematics | 176 (80.7%) | 42 (19.3%) |
| Architecture & Engineering | 61 (53.0%) | 54 (47.0%) |
| Life, Physical & Social Science | 266 (60.5%) | 174 (39.6%) |
| Community & Social Service | 1,743 (39.3%) | 2,697 (60.7%) |
| Education, Arts & Media | 291 (54.6%) | 242 (45.4%) |
| Legal Services & Support | 167 (58.2%) | 120 (41.8%) |
| Education Instruction & Library | 986 (31.5%) | 2,147 (68.5%) |
| Arts, Media & Entertainment | 299 (61.4%) | 188 (38.6%) |
| Health Diagnosing & Treating | 586 (27.9%) | 1,518 (72.2%) |
| Health Technologists | 468 (31.2%) | 1,034 (68.8%) |
| Total (Category) | 4,476 (41.7%) | 6,257 (58.3%) |
| Total (Overall) | 12,172 (47.7%) | 13,325 (52.3%) |
Services Occupations
The most common Services occupations in Lafayette County are Food Preparation & Serving (1,670 | 6.6%), Healthcare Support (789 | 3.1%), Cleaning & Maintenance (775 | 3.0%), Personal Care & Service (684 | 2.7%), and Security & Protection (446 | 1.8%).
Services Occupations by Sex
Within the Services occupations in Lafayette County, the most male-oriented occupations are Law Enforcement (95.2%), Security & Protection (83.9%), and Firefighting & Prevention (74.0%), while the most female-oriented occupations are Healthcare Support (95.4%), Personal Care & Service (81.9%), and Food Preparation & Serving (58.7%).
| Occupation | Male | Female |
| Healthcare Support | 36 (4.6%) | 753 (95.4%) |
| Security & Protection | 374 (83.9%) | 72 (16.1%) |
| Firefighting & Prevention | 176 (74.0%) | 62 (26.1%) |
| Law Enforcement | 198 (95.2%) | 10 (4.8%) |
| Food Preparation & Serving | 689 (41.3%) | 981 (58.7%) |
| Cleaning & Maintenance | 384 (49.5%) | 391 (50.4%) |
| Personal Care & Service | 124 (18.1%) | 560 (81.9%) |
| Total (Category) | 1,607 (36.8%) | 2,757 (63.2%) |
| Total (Overall) | 12,172 (47.7%) | 13,325 (52.3%) |
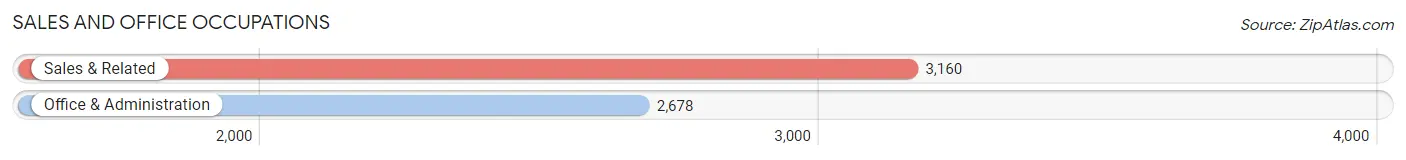
Sales and Office Occupations
The most common Sales and Office occupations in Lafayette County are Sales & Related (3,160 | 12.4%), and Office & Administration (2,678 | 10.5%).
Sales and Office Occupations by Sex
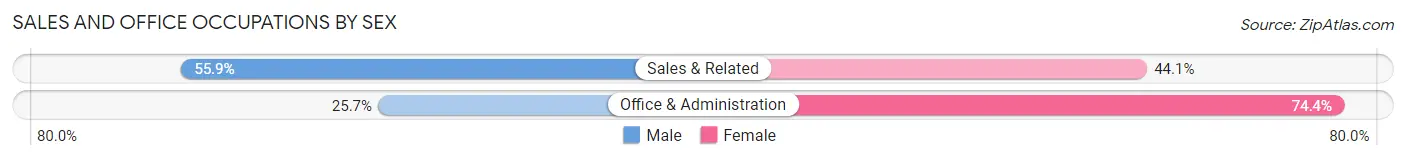
| Occupation | Male | Female |
| Sales & Related | 1,766 (55.9%) | 1,394 (44.1%) |
| Office & Administration | 687 (25.7%) | 1,991 (74.4%) |
| Total (Category) | 2,453 (42.0%) | 3,385 (58.0%) |
| Total (Overall) | 12,172 (47.7%) | 13,325 (52.3%) |
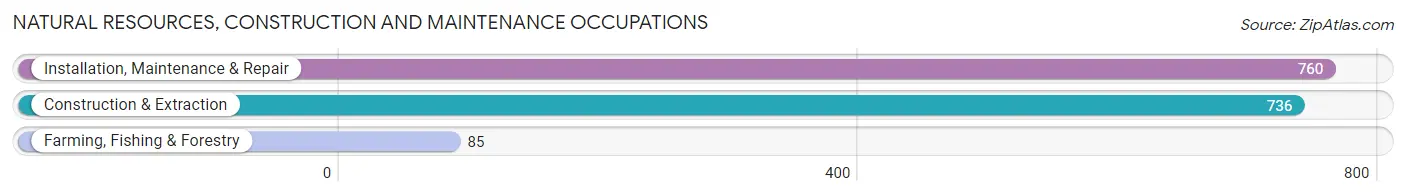
Natural Resources, Construction and Maintenance Occupations
The most common Natural Resources, Construction and Maintenance occupations in Lafayette County are Installation, Maintenance & Repair (760 | 3.0%), Construction & Extraction (736 | 2.9%), and Farming, Fishing & Forestry (85 | 0.3%).
Natural Resources, Construction and Maintenance Occupations by Sex
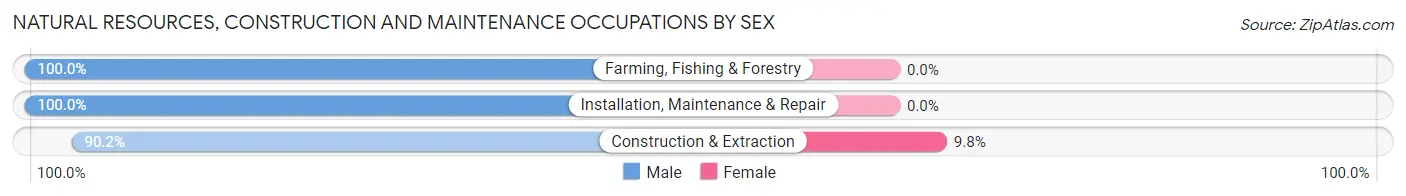
| Occupation | Male | Female |
| Farming, Fishing & Forestry | 85 (100.0%) | 0 (0.0%) |
| Construction & Extraction | 664 (90.2%) | 72 (9.8%) |
| Installation, Maintenance & Repair | 760 (100.0%) | 0 (0.0%) |
| Total (Category) | 1,509 (95.5%) | 72 (4.5%) |
| Total (Overall) | 12,172 (47.7%) | 13,325 (52.3%) |
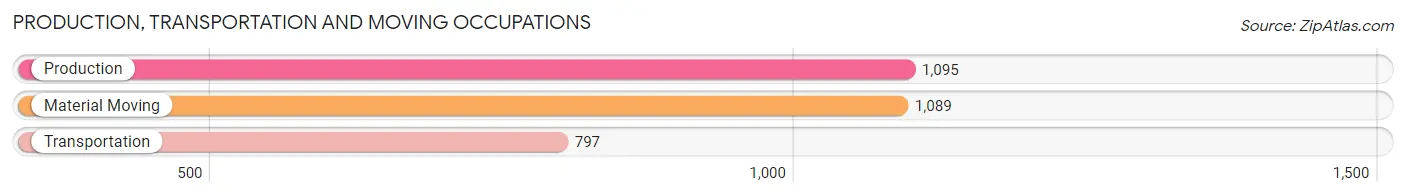
Production, Transportation and Moving Occupations
The most common Production, Transportation and Moving occupations in Lafayette County are Production (1,095 | 4.3%), Material Moving (1,089 | 4.3%), and Transportation (797 | 3.1%).
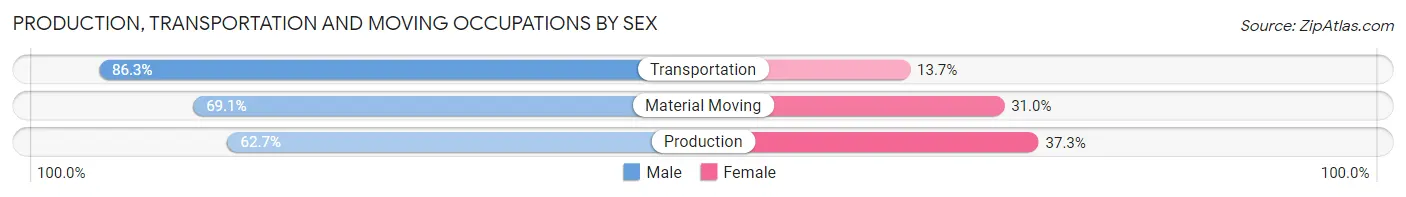
Production, Transportation and Moving Occupations by Sex
| Occupation | Male | Female |
| Production | 687 (62.7%) | 408 (37.3%) |
| Transportation | 688 (86.3%) | 109 (13.7%) |
| Material Moving | 752 (69.1%) | 337 (30.9%) |
| Total (Category) | 2,127 (71.4%) | 854 (28.6%) |
| Total (Overall) | 12,172 (47.7%) | 13,325 (52.3%) |
Employment Industries by Sex in Lafayette County
Employment Industries in Lafayette County
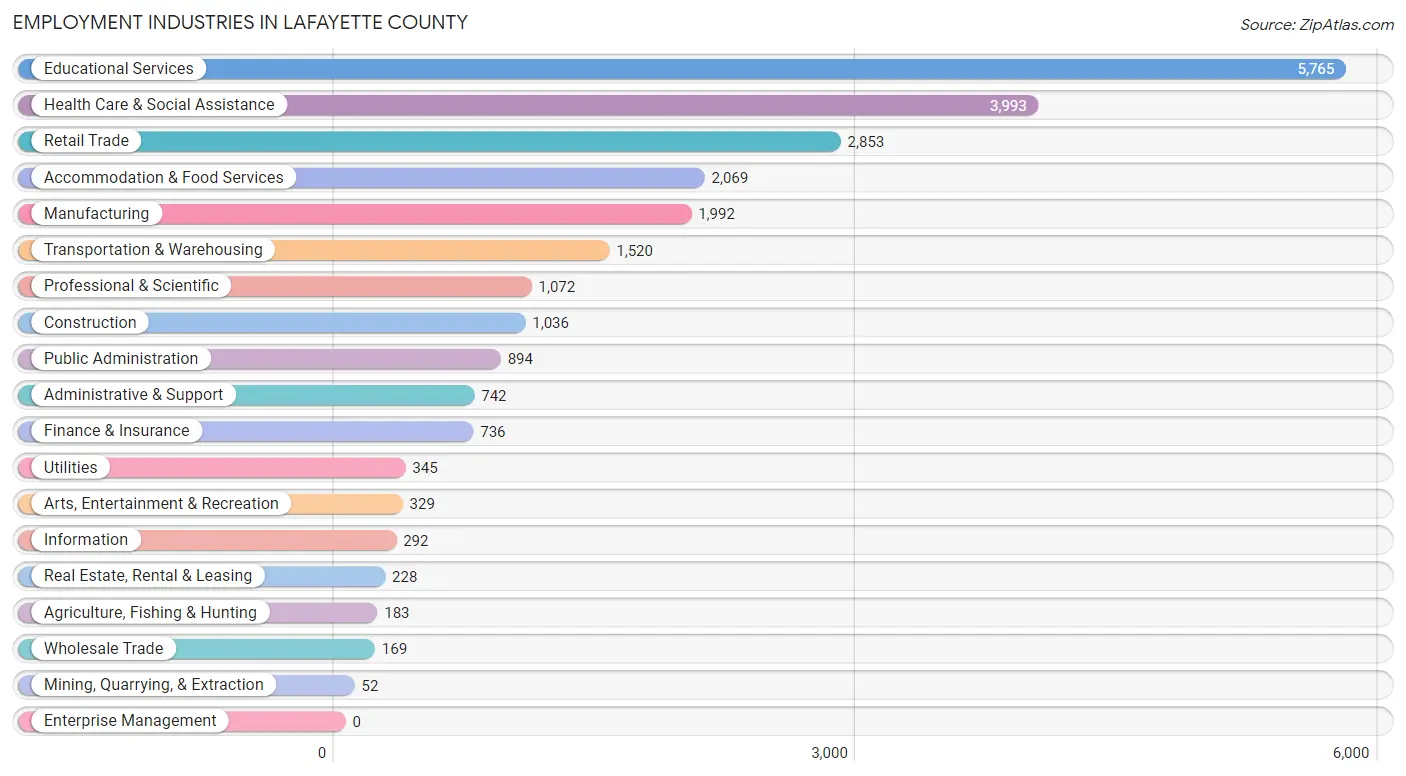
The major employment industries in Lafayette County include Educational Services (5,765 | 22.6%), Health Care & Social Assistance (3,993 | 15.7%), Retail Trade (2,853 | 11.2%), Accommodation & Food Services (2,069 | 8.1%), and Manufacturing (1,992 | 7.8%).
Employment Industries by Sex in Lafayette County
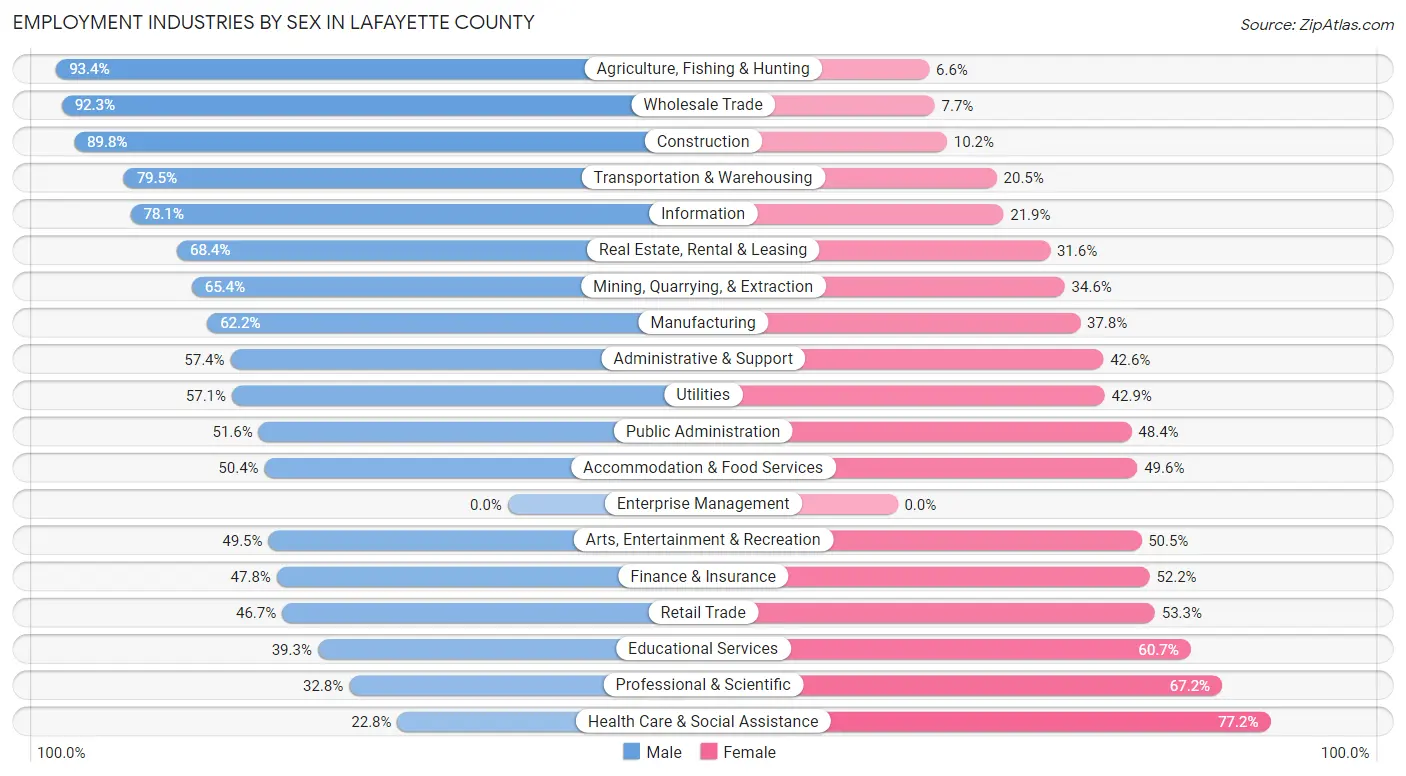
The Lafayette County industries that see more men than women are Agriculture, Fishing & Hunting (93.4%), Wholesale Trade (92.3%), and Construction (89.8%), whereas the industries that tend to have a higher number of women are Health Care & Social Assistance (77.2%), Professional & Scientific (67.2%), and Educational Services (60.7%).
| Industry | Male | Female |
| Agriculture, Fishing & Hunting | 171 (93.4%) | 12 (6.6%) |
| Mining, Quarrying, & Extraction | 34 (65.4%) | 18 (34.6%) |
| Construction | 930 (89.8%) | 106 (10.2%) |
| Manufacturing | 1,239 (62.2%) | 753 (37.8%) |
| Wholesale Trade | 156 (92.3%) | 13 (7.7%) |
| Retail Trade | 1,333 (46.7%) | 1,520 (53.3%) |
| Transportation & Warehousing | 1,208 (79.5%) | 312 (20.5%) |
| Utilities | 197 (57.1%) | 148 (42.9%) |
| Information | 228 (78.1%) | 64 (21.9%) |
| Finance & Insurance | 352 (47.8%) | 384 (52.2%) |
| Real Estate, Rental & Leasing | 156 (68.4%) | 72 (31.6%) |
| Professional & Scientific | 352 (32.8%) | 720 (67.2%) |
| Enterprise Management | 0 (0.0%) | 0 (0.0%) |
| Administrative & Support | 426 (57.4%) | 316 (42.6%) |
| Educational Services | 2,267 (39.3%) | 3,498 (60.7%) |
| Health Care & Social Assistance | 912 (22.8%) | 3,081 (77.2%) |
| Arts, Entertainment & Recreation | 163 (49.5%) | 166 (50.5%) |
| Accommodation & Food Services | 1,042 (50.4%) | 1,027 (49.6%) |
| Public Administration | 461 (51.6%) | 433 (48.4%) |
| Total | 12,172 (47.7%) | 13,325 (52.3%) |
Education in Lafayette County
School Enrollment in Lafayette County
The most common levels of schooling among the 20,949 students in Lafayette County are college / undergraduate (10,919 | 52.1%), middle school (2,676 | 12.8%), and high school (2,275 | 10.9%).
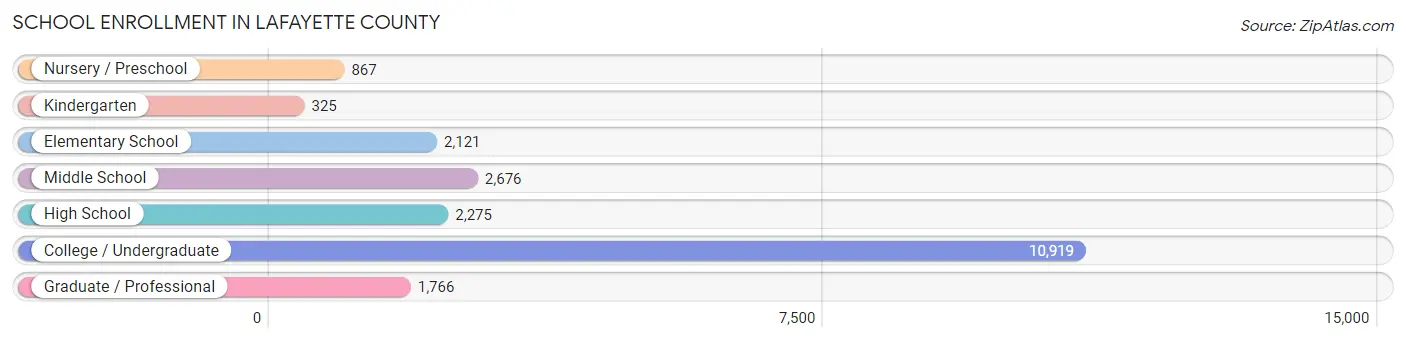
| School Level | # Students | % Students |
| Nursery / Preschool | 867 | 4.1% |
| Kindergarten | 325 | 1.5% |
| Elementary School | 2,121 | 10.1% |
| Middle School | 2,676 | 12.8% |
| High School | 2,275 | 10.9% |
| College / Undergraduate | 10,919 | 52.1% |
| Graduate / Professional | 1,766 | 8.4% |
| Total | 20,949 | 100.0% |
School Enrollment by Age by Funding Source in Lafayette County
Out of a total of 20,949 students who are enrolled in schools in Lafayette County, 1,634 (7.8%) attend a private institution, while the remaining 19,315 (92.2%) are enrolled in public schools. The age group of 3 to 4 year olds has the highest likelihood of being enrolled in private schools, with 243 (37.4% in the age bracket) enrolled. Conversely, the age group of 18 to 19 year olds has the lowest likelihood of being enrolled in a private school, with 5,041 (99.8% in the age bracket) attending a public institution.
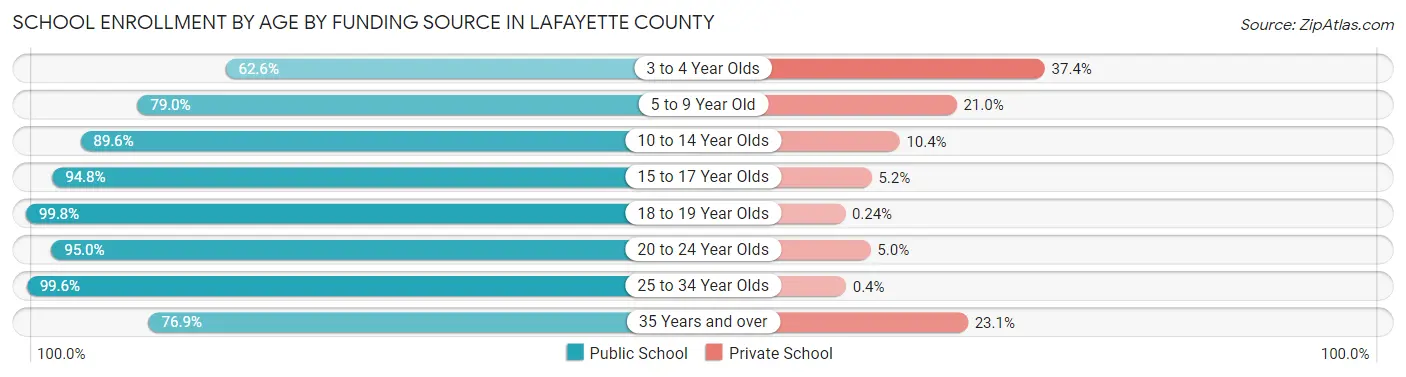
| Age Bracket | Public School | Private School |
| 3 to 4 Year Olds | 406 (62.6%) | 243 (37.4%) |
| 5 to 9 Year Old | 1,917 (79.0%) | 510 (21.0%) |
| 10 to 14 Year Olds | 2,664 (89.6%) | 309 (10.4%) |
| 15 to 17 Year Olds | 1,558 (94.8%) | 85 (5.2%) |
| 18 to 19 Year Olds | 5,041 (99.8%) | 12 (0.2%) |
| 20 to 24 Year Olds | 6,505 (95.0%) | 341 (5.0%) |
| 25 to 34 Year Olds | 745 (99.6%) | 3 (0.4%) |
| 35 Years and over | 469 (76.9%) | 141 (23.1%) |
| Total | 19,315 (92.2%) | 1,634 (7.8%) |
Educational Attainment by Field of Study in Lafayette County
Business (3,068 | 19.7%), education (1,884 | 12.1%), arts & humanities (1,644 | 10.5%), liberal arts & history (1,103 | 7.1%), and social sciences (1,055 | 6.8%) are the most common fields of study among 15,587 individuals in Lafayette County who have obtained a bachelor's degree or higher.
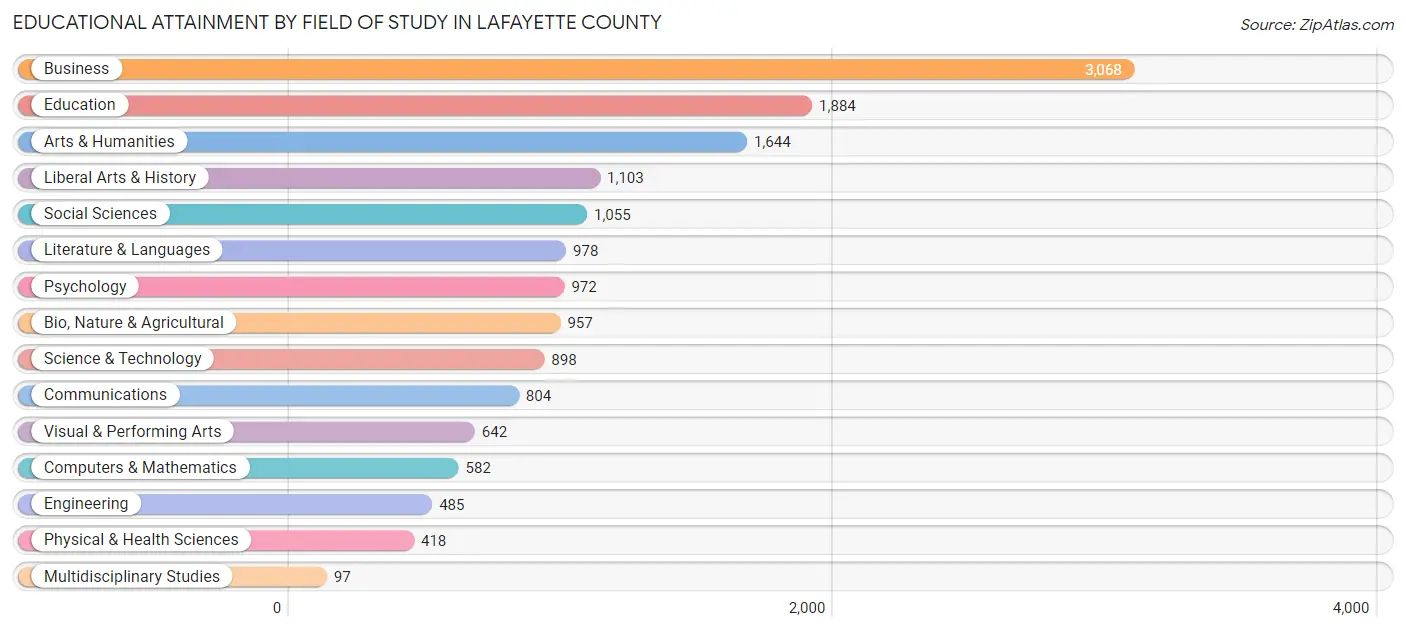
| Field of Study | # Graduates | % Graduates |
| Computers & Mathematics | 582 | 3.7% |
| Bio, Nature & Agricultural | 957 | 6.1% |
| Physical & Health Sciences | 418 | 2.7% |
| Psychology | 972 | 6.2% |
| Social Sciences | 1,055 | 6.8% |
| Engineering | 485 | 3.1% |
| Multidisciplinary Studies | 97 | 0.6% |
| Science & Technology | 898 | 5.8% |
| Business | 3,068 | 19.7% |
| Education | 1,884 | 12.1% |
| Literature & Languages | 978 | 6.3% |
| Liberal Arts & History | 1,103 | 7.1% |
| Visual & Performing Arts | 642 | 4.1% |
| Communications | 804 | 5.2% |
| Arts & Humanities | 1,644 | 10.5% |
| Total | 15,587 | 100.0% |
Transportation & Commute in Lafayette County
Vehicle Availability by Sex in Lafayette County
The most prevalent vehicle ownership categories in Lafayette County are males with 2 vehicles (4,659, accounting for 41.4%) and females with 2 vehicles (5,212, making up 37.0%).
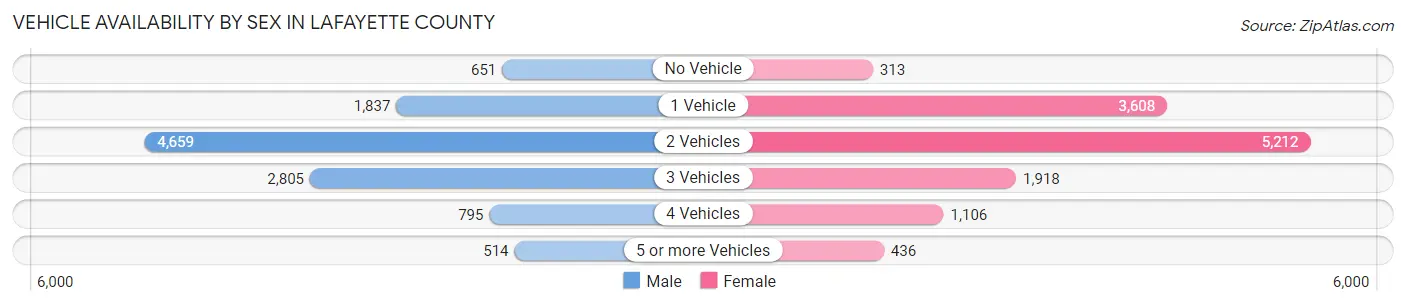
| Vehicles Available | Male | Female |
| No Vehicle | 651 (5.8%) | 313 (2.5%) |
| 1 Vehicle | 1,837 (16.3%) | 3,608 (28.6%) |
| 2 Vehicles | 4,659 (41.4%) | 5,212 (41.4%) |
| 3 Vehicles | 2,805 (24.9%) | 1,918 (15.2%) |
| 4 Vehicles | 795 (7.1%) | 1,106 (8.8%) |
| 5 or more Vehicles | 514 (4.6%) | 436 (3.5%) |
| Total | 11,261 (100.0%) | 12,593 (100.0%) |
Commute Time in Lafayette County
The most frequently occuring commute durations in Lafayette County are 10 to 14 minutes (5,883 commuters, 25.2%), 15 to 19 minutes (4,873 commuters, 20.9%), and 5 to 9 minutes (3,935 commuters, 16.9%).
| Commute Time | # Commuters | % Commuters |
| Less than 5 Minutes | 737 | 3.2% |
| 5 to 9 Minutes | 3,935 | 16.9% |
| 10 to 14 Minutes | 5,883 | 25.2% |
| 15 to 19 Minutes | 4,873 | 20.9% |
| 20 to 24 Minutes | 1,971 | 8.5% |
| 25 to 29 Minutes | 835 | 3.6% |
| 30 to 34 Minutes | 1,853 | 7.9% |
| 35 to 39 Minutes | 224 | 1.0% |
| 40 to 44 Minutes | 215 | 0.9% |
| 45 to 59 Minutes | 746 | 3.2% |
| 60 to 89 Minutes | 1,571 | 6.7% |
| 90 or more Minutes | 496 | 2.1% |
Commute Time by Sex in Lafayette County
The most common commute times in Lafayette County are 10 to 14 minutes (2,880 commuters, 26.3%) for males and 10 to 14 minutes (3,003 commuters, 24.2%) for females.
| Commute Time | Male | Female |
| Less than 5 Minutes | 256 (2.3%) | 481 (3.9%) |
| 5 to 9 Minutes | 1,632 (14.9%) | 2,303 (18.6%) |
| 10 to 14 Minutes | 2,880 (26.3%) | 3,003 (24.2%) |
| 15 to 19 Minutes | 2,016 (18.4%) | 2,857 (23.1%) |
| 20 to 24 Minutes | 862 (7.9%) | 1,109 (8.9%) |
| 25 to 29 Minutes | 404 (3.7%) | 431 (3.5%) |
| 30 to 34 Minutes | 1,017 (9.3%) | 836 (6.7%) |
| 35 to 39 Minutes | 103 (0.9%) | 121 (1.0%) |
| 40 to 44 Minutes | 111 (1.0%) | 104 (0.8%) |
| 45 to 59 Minutes | 503 (4.6%) | 243 (2.0%) |
| 60 to 89 Minutes | 750 (6.9%) | 821 (6.6%) |
| 90 or more Minutes | 409 (3.7%) | 87 (0.7%) |
Time of Departure to Work by Sex in Lafayette County
The most frequent times of departure to work in Lafayette County are 7:00 AM to 7:29 AM (1,837, 16.8%) for males and 7:30 AM to 7:59 AM (2,686, 21.7%) for females.
| Time of Departure | Male | Female |
| 12:00 AM to 4:59 AM | 298 (2.7%) | 426 (3.4%) |
| 5:00 AM to 5:29 AM | 329 (3.0%) | 247 (2.0%) |
| 5:30 AM to 5:59 AM | 180 (1.6%) | 438 (3.5%) |
| 6:00 AM to 6:29 AM | 716 (6.5%) | 1,037 (8.4%) |
| 6:30 AM to 6:59 AM | 792 (7.2%) | 1,273 (10.3%) |
| 7:00 AM to 7:29 AM | 1,837 (16.8%) | 1,638 (13.2%) |
| 7:30 AM to 7:59 AM | 1,502 (13.7%) | 2,686 (21.7%) |
| 8:00 AM to 8:29 AM | 1,422 (13.0%) | 1,195 (9.6%) |
| 8:30 AM to 8:59 AM | 713 (6.5%) | 985 (8.0%) |
| 9:00 AM to 9:59 AM | 520 (4.8%) | 715 (5.8%) |
| 10:00 AM to 10:59 AM | 263 (2.4%) | 321 (2.6%) |
| 11:00 AM to 11:59 AM | 176 (1.6%) | 48 (0.4%) |
| 12:00 PM to 3:59 PM | 725 (6.6%) | 724 (5.8%) |
| 4:00 PM to 11:59 PM | 1,470 (13.4%) | 663 (5.3%) |
| Total | 10,943 (100.0%) | 12,396 (100.0%) |
Housing Occupancy in Lafayette County
Occupancy by Ownership in Lafayette County
Of the total 18,702 dwellings in Lafayette County, owner-occupied units account for 12,041 (64.4%), while renter-occupied units make up 6,661 (35.6%).
| Occupancy | # Housing Units | % Housing Units |
| Owner Occupied Housing Units | 12,041 | 64.4% |
| Renter-Occupied Housing Units | 6,661 | 35.6% |
| Total Occupied Housing Units | 18,702 | 100.0% |
Occupancy by Household Size in Lafayette County
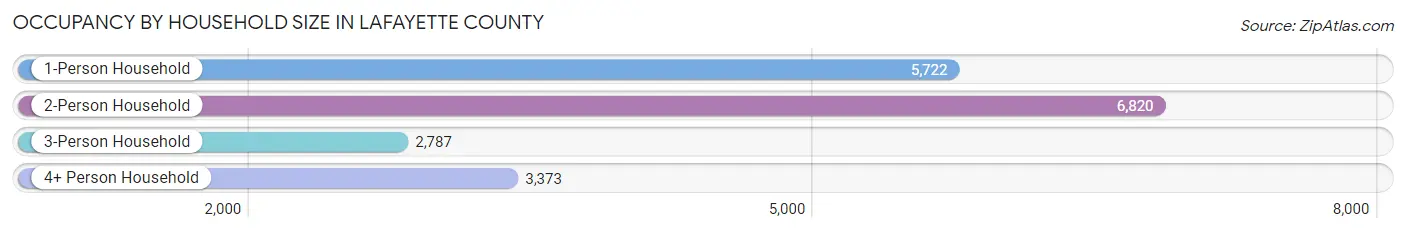
| Household Size | # Housing Units | % Housing Units |
| 1-Person Household | 5,722 | 30.6% |
| 2-Person Household | 6,820 | 36.5% |
| 3-Person Household | 2,787 | 14.9% |
| 4+ Person Household | 3,373 | 18.0% |
| Total Housing Units | 18,702 | 100.0% |
Occupancy by Ownership by Household Size in Lafayette County
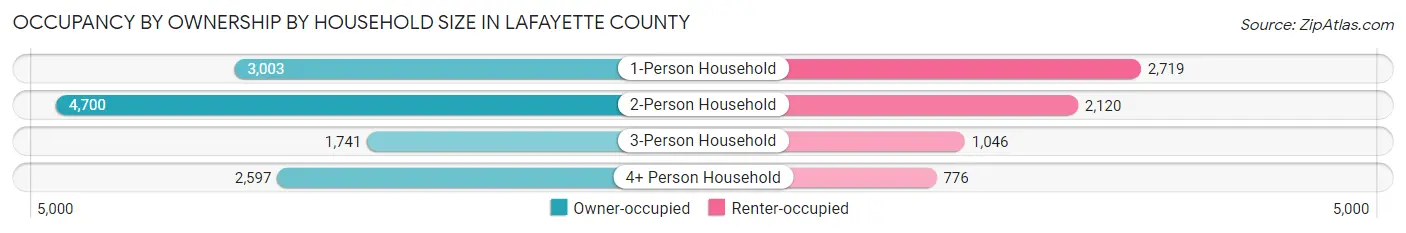
| Household Size | Owner-occupied | Renter-occupied |
| 1-Person Household | 3,003 (52.5%) | 2,719 (47.5%) |
| 2-Person Household | 4,700 (68.9%) | 2,120 (31.1%) |
| 3-Person Household | 1,741 (62.5%) | 1,046 (37.5%) |
| 4+ Person Household | 2,597 (77.0%) | 776 (23.0%) |
| Total Housing Units | 12,041 (64.4%) | 6,661 (35.6%) |
Occupancy by Educational Attainment in Lafayette County
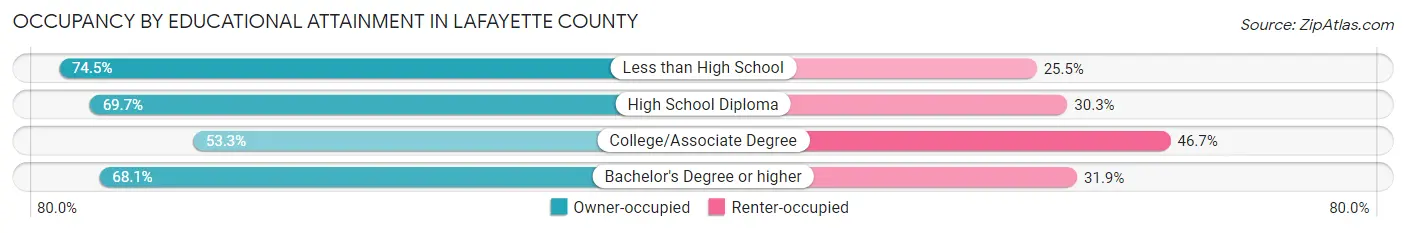
| Household Size | Owner-occupied | Renter-occupied |
| Less than High School | 858 (74.5%) | 293 (25.5%) |
| High School Diploma | 1,971 (69.7%) | 858 (30.3%) |
| College/Associate Degree | 2,944 (53.3%) | 2,578 (46.7%) |
| Bachelor's Degree or higher | 6,268 (68.1%) | 2,932 (31.9%) |
Occupancy by Age of Householder in Lafayette County
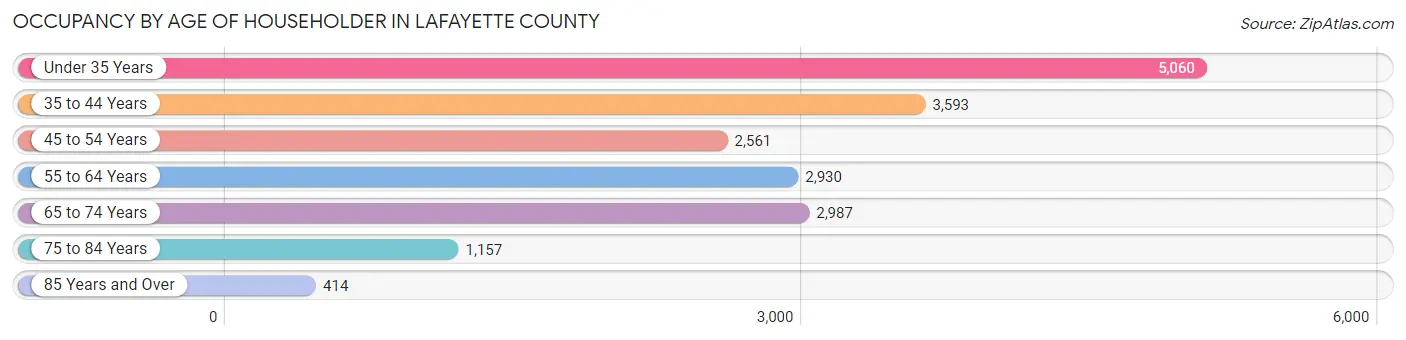
| Age Bracket | # Households | % Households |
| Under 35 Years | 5,060 | 27.1% |
| 35 to 44 Years | 3,593 | 19.2% |
| 45 to 54 Years | 2,561 | 13.7% |
| 55 to 64 Years | 2,930 | 15.7% |
| 65 to 74 Years | 2,987 | 16.0% |
| 75 to 84 Years | 1,157 | 6.2% |
| 85 Years and Over | 414 | 2.2% |
| Total | 18,702 | 100.0% |
Housing Finances in Lafayette County
Median Income by Occupancy in Lafayette County
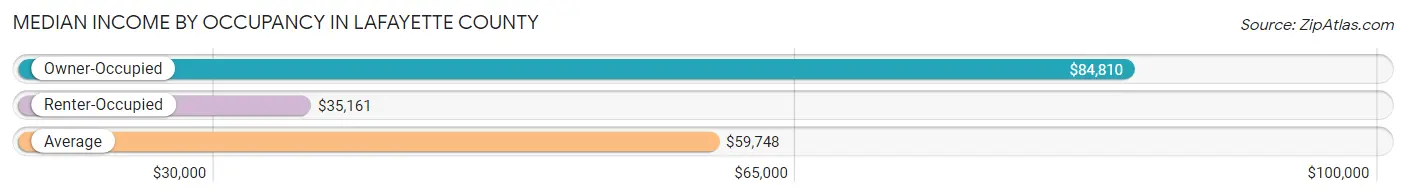
| Occupancy Type | # Households | Median Income |
| Owner-Occupied | 12,041 (64.4%) | $84,810 |
| Renter-Occupied | 6,661 (35.6%) | $35,161 |
| Average | 18,702 (100.0%) | $59,748 |
Occupancy by Householder Income Bracket in Lafayette County
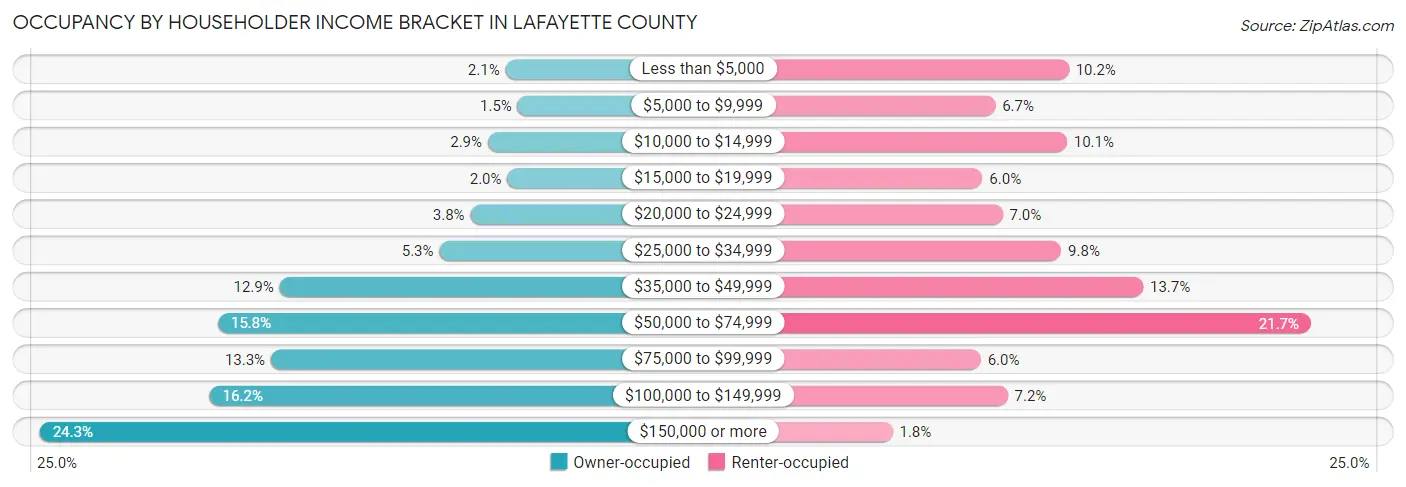
| Income Bracket | Owner-occupied | Renter-occupied |
| Less than $5,000 | 253 (2.1%) | 676 (10.2%) |
| $5,000 to $9,999 | 183 (1.5%) | 443 (6.7%) |
| $10,000 to $14,999 | 354 (2.9%) | 670 (10.1%) |
| $15,000 to $19,999 | 242 (2.0%) | 402 (6.0%) |
| $20,000 to $24,999 | 454 (3.8%) | 466 (7.0%) |
| $25,000 to $34,999 | 632 (5.2%) | 652 (9.8%) |
| $35,000 to $49,999 | 1,549 (12.9%) | 912 (13.7%) |
| $50,000 to $74,999 | 1,903 (15.8%) | 1,444 (21.7%) |
| $75,000 to $99,999 | 1,598 (13.3%) | 397 (6.0%) |
| $100,000 to $149,999 | 1,950 (16.2%) | 482 (7.2%) |
| $150,000 or more | 2,923 (24.3%) | 117 (1.8%) |
| Total | 12,041 (100.0%) | 6,661 (100.0%) |
Monthly Housing Cost Tiers in Lafayette County
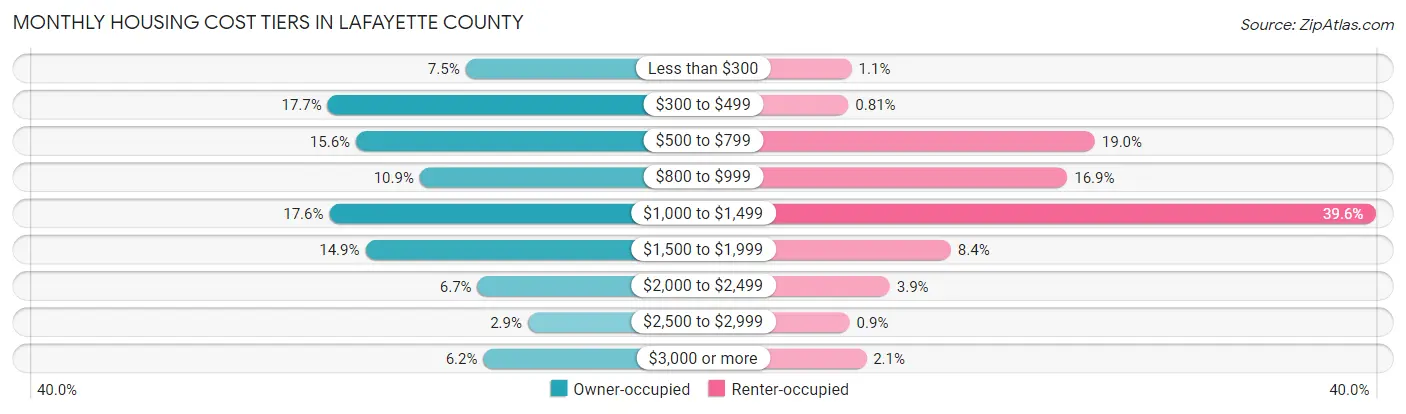
| Monthly Cost | Owner-occupied | Renter-occupied |
| Less than $300 | 907 (7.5%) | 70 (1.1%) |
| $300 to $499 | 2,130 (17.7%) | 54 (0.8%) |
| $500 to $799 | 1,878 (15.6%) | 1,263 (19.0%) |
| $800 to $999 | 1,313 (10.9%) | 1,128 (16.9%) |
| $1,000 to $1,499 | 2,114 (17.6%) | 2,638 (39.6%) |
| $1,500 to $1,999 | 1,795 (14.9%) | 557 (8.4%) |
| $2,000 to $2,499 | 801 (6.7%) | 257 (3.9%) |
| $2,500 to $2,999 | 354 (2.9%) | 60 (0.9%) |
| $3,000 or more | 749 (6.2%) | 141 (2.1%) |
| Total | 12,041 (100.0%) | 6,661 (100.0%) |
Physical Housing Characteristics in Lafayette County
Housing Structures in Lafayette County
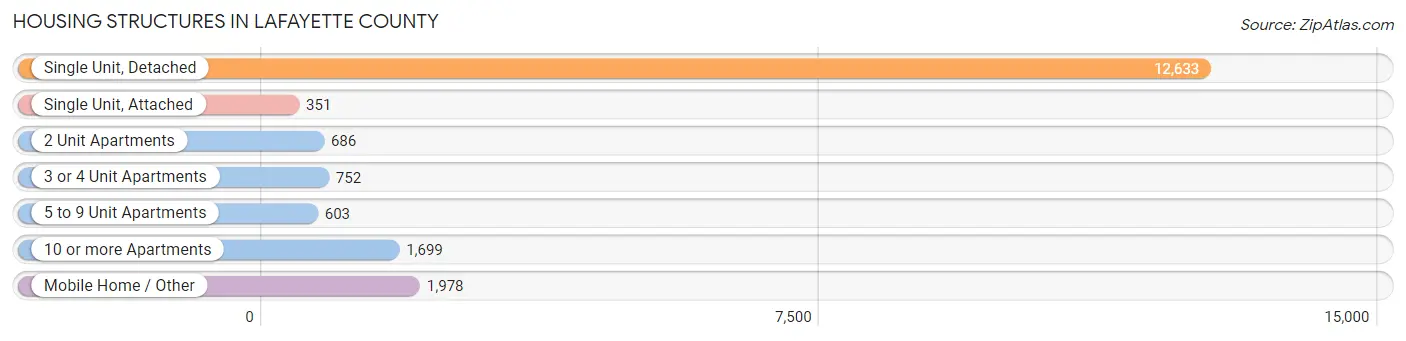
| Structure Type | # Housing Units | % Housing Units |
| Single Unit, Detached | 12,633 | 67.5% |
| Single Unit, Attached | 351 | 1.9% |
| 2 Unit Apartments | 686 | 3.7% |
| 3 or 4 Unit Apartments | 752 | 4.0% |
| 5 to 9 Unit Apartments | 603 | 3.2% |
| 10 or more Apartments | 1,699 | 9.1% |
| Mobile Home / Other | 1,978 | 10.6% |
| Total | 18,702 | 100.0% |
Housing Structures by Occupancy in Lafayette County
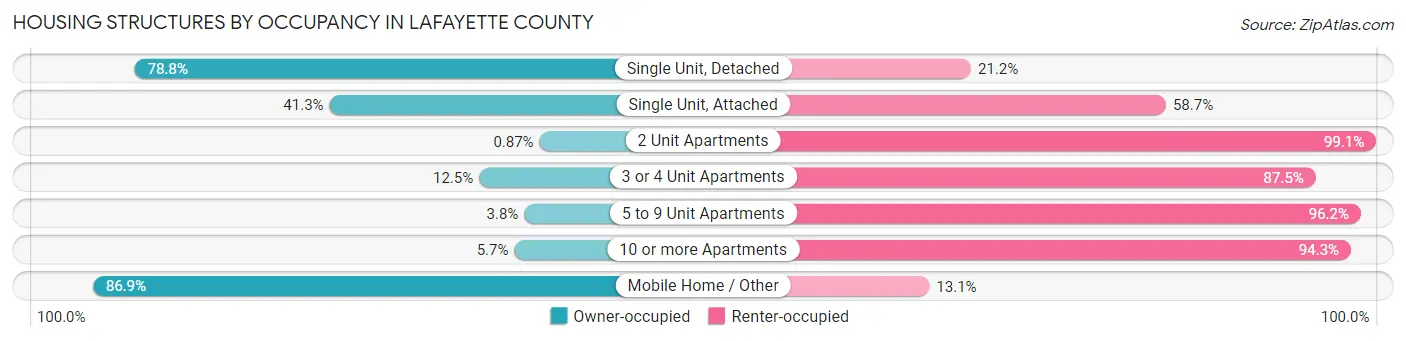
| Structure Type | Owner-occupied | Renter-occupied |
| Single Unit, Detached | 9,958 (78.8%) | 2,675 (21.2%) |
| Single Unit, Attached | 145 (41.3%) | 206 (58.7%) |
| 2 Unit Apartments | 6 (0.9%) | 680 (99.1%) |
| 3 or 4 Unit Apartments | 94 (12.5%) | 658 (87.5%) |
| 5 to 9 Unit Apartments | 23 (3.8%) | 580 (96.2%) |
| 10 or more Apartments | 97 (5.7%) | 1,602 (94.3%) |
| Mobile Home / Other | 1,718 (86.9%) | 260 (13.1%) |
| Total | 12,041 (64.4%) | 6,661 (35.6%) |
Housing Structures by Number of Rooms in Lafayette County
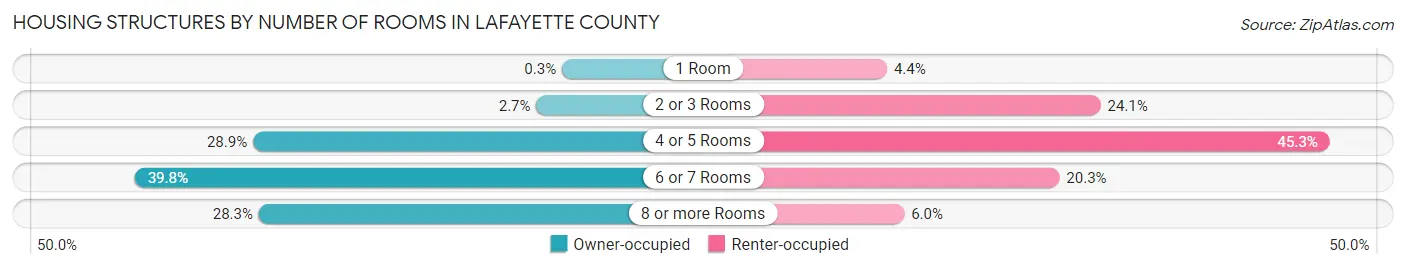
| Number of Rooms | Owner-occupied | Renter-occupied |
| 1 Room | 36 (0.3%) | 290 (4.3%) |
| 2 or 3 Rooms | 321 (2.7%) | 1,606 (24.1%) |
| 4 or 5 Rooms | 3,478 (28.9%) | 3,017 (45.3%) |
| 6 or 7 Rooms | 4,793 (39.8%) | 1,352 (20.3%) |
| 8 or more Rooms | 3,413 (28.3%) | 396 (5.9%) |
| Total | 12,041 (100.0%) | 6,661 (100.0%) |
Housing Structure by Heating Type in Lafayette County
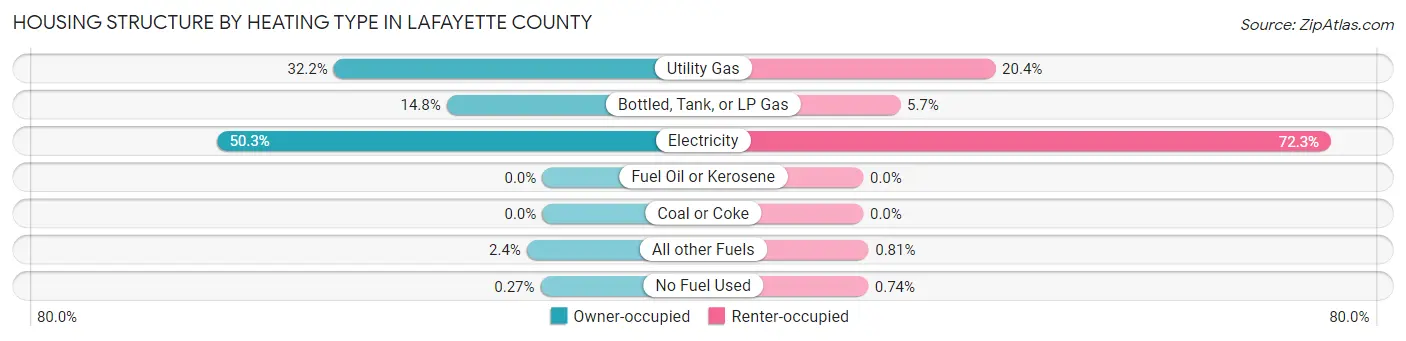
| Heating Type | Owner-occupied | Renter-occupied |
| Utility Gas | 3,882 (32.2%) | 1,360 (20.4%) |
| Bottled, Tank, or LP Gas | 1,779 (14.8%) | 381 (5.7%) |
| Electricity | 6,061 (50.3%) | 4,817 (72.3%) |
| Fuel Oil or Kerosene | 0 (0.0%) | 0 (0.0%) |
| Coal or Coke | 0 (0.0%) | 0 (0.0%) |
| All other Fuels | 287 (2.4%) | 54 (0.8%) |
| No Fuel Used | 32 (0.3%) | 49 (0.7%) |
| Total | 12,041 (100.0%) | 6,661 (100.0%) |
Household Vehicle Usage in Lafayette County
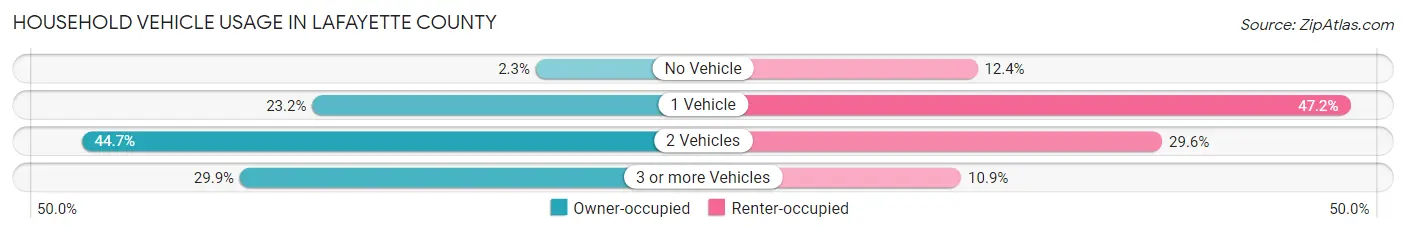
| Vehicles per Household | Owner-occupied | Renter-occupied |
| No Vehicle | 275 (2.3%) | 824 (12.4%) |
| 1 Vehicle | 2,787 (23.2%) | 3,142 (47.2%) |
| 2 Vehicles | 5,379 (44.7%) | 1,972 (29.6%) |
| 3 or more Vehicles | 3,600 (29.9%) | 723 (10.8%) |
| Total | 12,041 (100.0%) | 6,661 (100.0%) |
Real Estate & Mortgages in Lafayette County
Real Estate and Mortgage Overview in Lafayette County
| Characteristic | Without Mortgage | With Mortgage |
| Housing Units | 5,371 | 6,670 |
| Median Property Value | $214,600 | $270,100 |
| Median Household Income | $65,827 | $1,843 |
| Monthly Housing Costs | $481 | $734 |
| Real Estate Taxes | $1,177 | $516 |
Property Value by Mortgage Status in Lafayette County
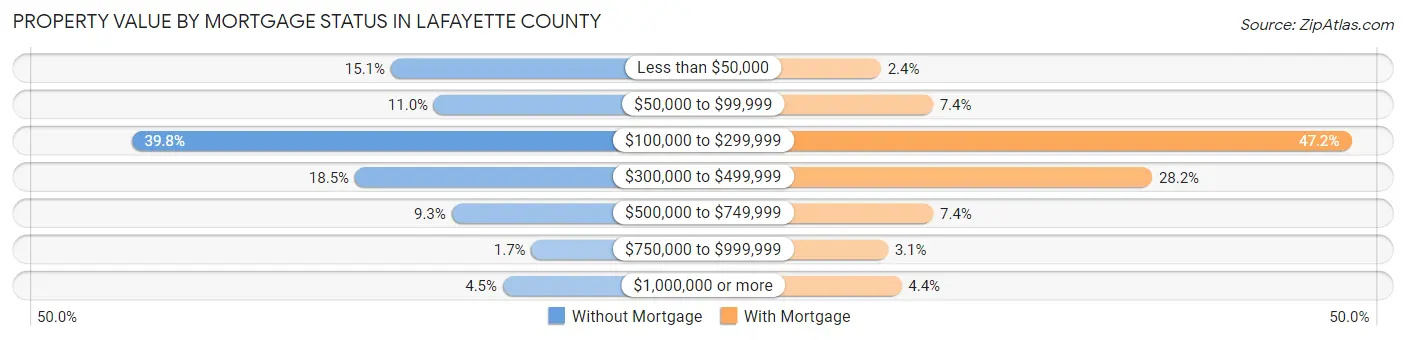
| Property Value | Without Mortgage | With Mortgage |
| Less than $50,000 | 812 (15.1%) | 160 (2.4%) |
| $50,000 to $99,999 | 592 (11.0%) | 490 (7.3%) |
| $100,000 to $299,999 | 2,138 (39.8%) | 3,149 (47.2%) |
| $300,000 to $499,999 | 996 (18.5%) | 1,883 (28.2%) |
| $500,000 to $749,999 | 501 (9.3%) | 493 (7.4%) |
| $750,000 to $999,999 | 93 (1.7%) | 204 (3.1%) |
| $1,000,000 or more | 239 (4.4%) | 291 (4.4%) |
| Total | 5,371 (100.0%) | 6,670 (100.0%) |
Household Income by Mortgage Status in Lafayette County
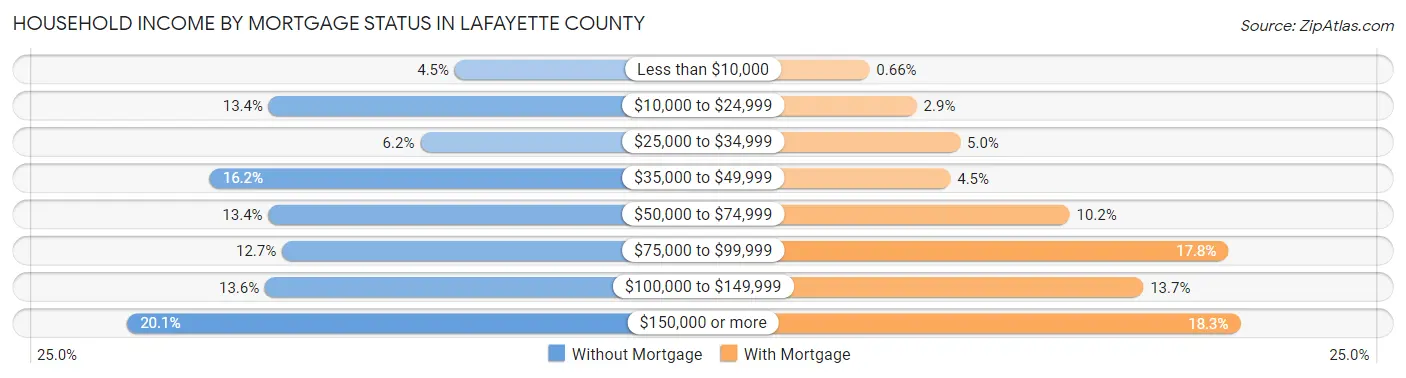
| Household Income | Without Mortgage | With Mortgage |
| Less than $10,000 | 242 (4.5%) | 44 (0.7%) |
| $10,000 to $24,999 | 718 (13.4%) | 194 (2.9%) |
| $25,000 to $34,999 | 331 (6.2%) | 332 (5.0%) |
| $35,000 to $49,999 | 869 (16.2%) | 301 (4.5%) |
| $50,000 to $74,999 | 719 (13.4%) | 680 (10.2%) |
| $75,000 to $99,999 | 684 (12.7%) | 1,184 (17.7%) |
| $100,000 to $149,999 | 728 (13.6%) | 914 (13.7%) |
| $150,000 or more | 1,080 (20.1%) | 1,222 (18.3%) |
| Total | 5,371 (100.0%) | 6,670 (100.0%) |
Property Value to Household Income Ratio in Lafayette County
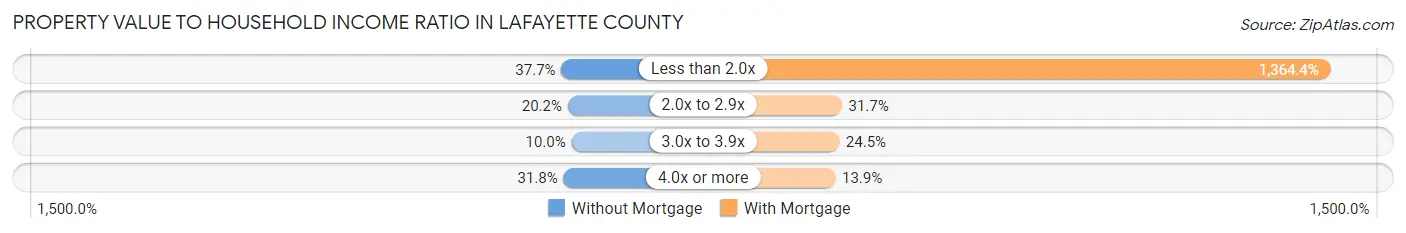
| Value-to-Income Ratio | Without Mortgage | With Mortgage |
| Less than 2.0x | 2,022 (37.7%) | 91,004 (1,364.4%) |
| 2.0x to 2.9x | 1,082 (20.2%) | 2,111 (31.7%) |
| 3.0x to 3.9x | 535 (10.0%) | 1,634 (24.5%) |
| 4.0x or more | 1,709 (31.8%) | 929 (13.9%) |
| Total | 5,371 (100.0%) | 6,670 (100.0%) |
Real Estate Taxes by Mortgage Status in Lafayette County
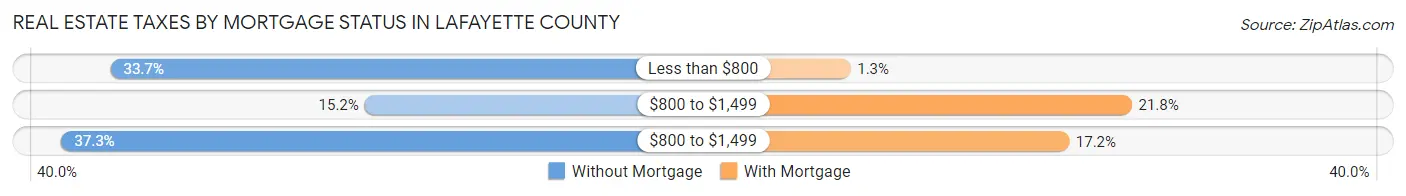
| Property Taxes | Without Mortgage | With Mortgage |
| Less than $800 | 1,811 (33.7%) | 84 (1.3%) |
| $800 to $1,499 | 814 (15.2%) | 1,455 (21.8%) |
| $800 to $1,499 | 2,004 (37.3%) | 1,149 (17.2%) |
| Total | 5,371 (100.0%) | 6,670 (100.0%) |
Health & Disability in Lafayette County
Health Insurance Coverage by Age in Lafayette County
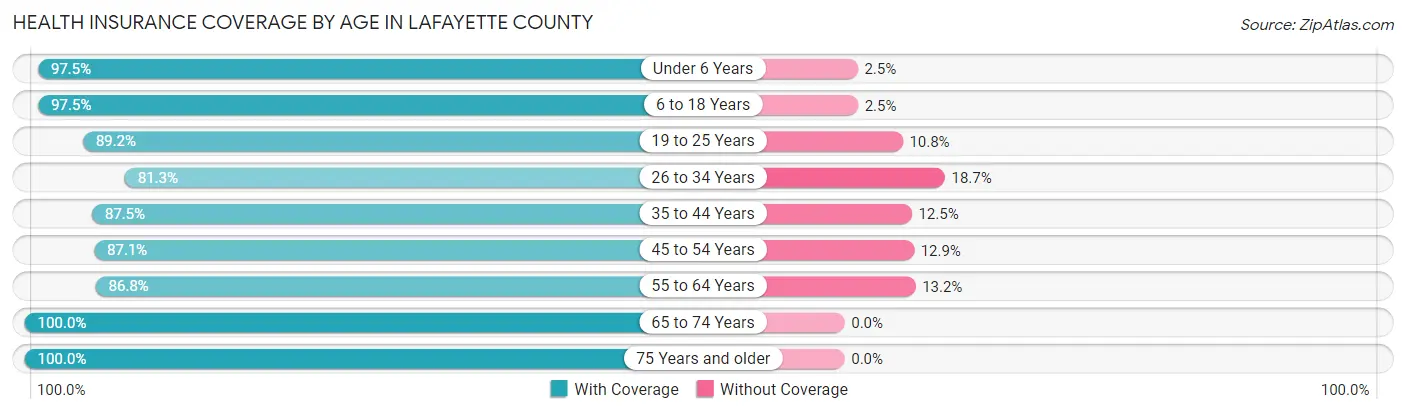
| Age Bracket | With Coverage | Without Coverage |
| Under 6 Years | 3,128 (97.5%) | 79 (2.5%) |
| 6 to 18 Years | 9,171 (97.5%) | 235 (2.5%) |
| 19 to 25 Years | 10,753 (89.2%) | 1,307 (10.8%) |
| 26 to 34 Years | 5,045 (81.3%) | 1,160 (18.7%) |
| 35 to 44 Years | 5,906 (87.5%) | 846 (12.5%) |
| 45 to 54 Years | 4,764 (87.1%) | 708 (12.9%) |
| 55 to 64 Years | 4,738 (86.8%) | 722 (13.2%) |
| 65 to 74 Years | 4,571 (100.0%) | 0 (0.0%) |
| 75 Years and older | 2,356 (100.0%) | 0 (0.0%) |
| Total | 50,432 (90.9%) | 5,057 (9.1%) |
Health Insurance Coverage by Citizenship Status in Lafayette County
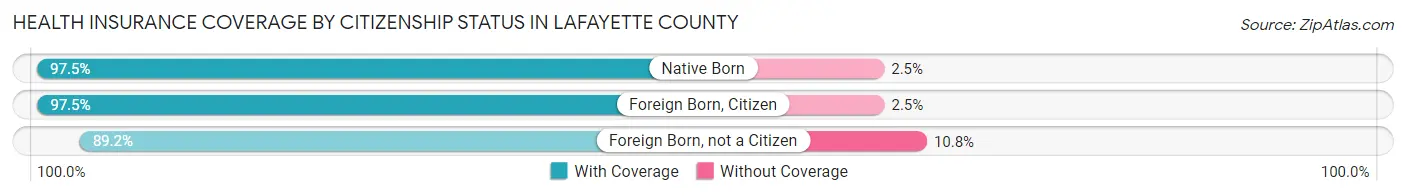
| Citizenship Status | With Coverage | Without Coverage |
| Native Born | 3,128 (97.5%) | 79 (2.5%) |
| Foreign Born, Citizen | 9,171 (97.5%) | 235 (2.5%) |
| Foreign Born, not a Citizen | 10,753 (89.2%) | 1,307 (10.8%) |
Health Insurance Coverage by Household Income in Lafayette County
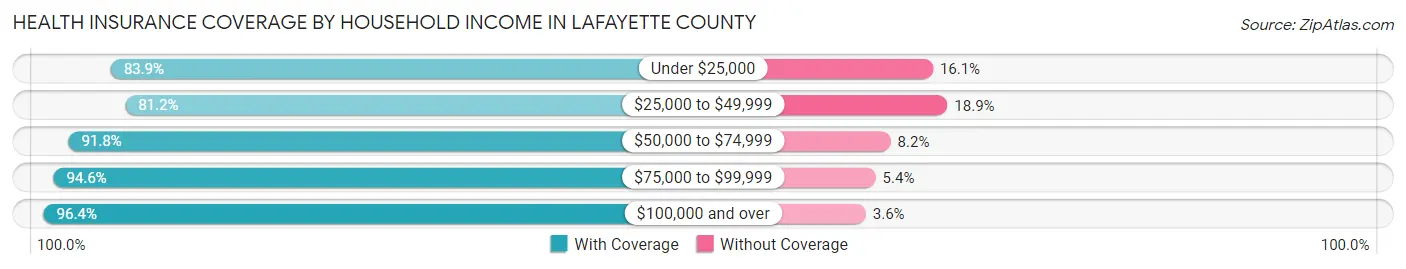
| Household Income | With Coverage | Without Coverage |
| Under $25,000 | 7,696 (83.9%) | 1,481 (16.1%) |
| $25,000 to $49,999 | 7,593 (81.1%) | 1,764 (18.9%) |
| $50,000 to $74,999 | 7,604 (91.8%) | 681 (8.2%) |
| $75,000 to $99,999 | 5,530 (94.6%) | 316 (5.4%) |
| $100,000 and over | 17,551 (96.4%) | 649 (3.6%) |
Public vs Private Health Insurance Coverage by Age in Lafayette County
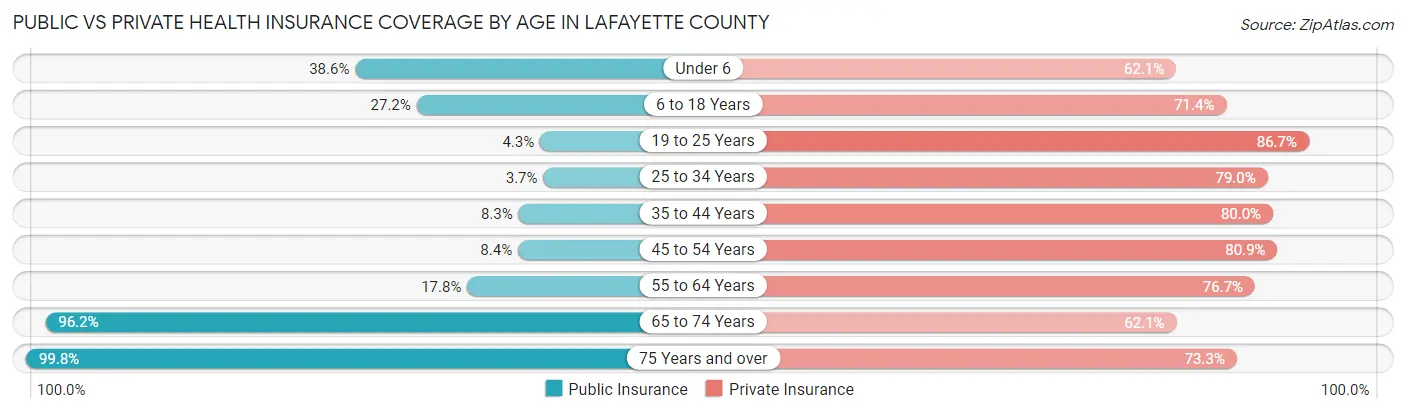
| Age Bracket | Public Insurance | Private Insurance |
| Under 6 | 1,239 (38.6%) | 1,990 (62.1%) |
| 6 to 18 Years | 2,562 (27.2%) | 6,711 (71.4%) |
| 19 to 25 Years | 522 (4.3%) | 10,453 (86.7%) |
| 25 to 34 Years | 230 (3.7%) | 4,903 (79.0%) |
| 35 to 44 Years | 561 (8.3%) | 5,403 (80.0%) |
| 45 to 54 Years | 461 (8.4%) | 4,424 (80.8%) |
| 55 to 64 Years | 974 (17.8%) | 4,186 (76.7%) |
| 65 to 74 Years | 4,395 (96.2%) | 2,839 (62.1%) |
| 75 Years and over | 2,350 (99.8%) | 1,727 (73.3%) |
| Total | 13,294 (24.0%) | 42,636 (76.8%) |
Disability Status by Sex by Age in Lafayette County
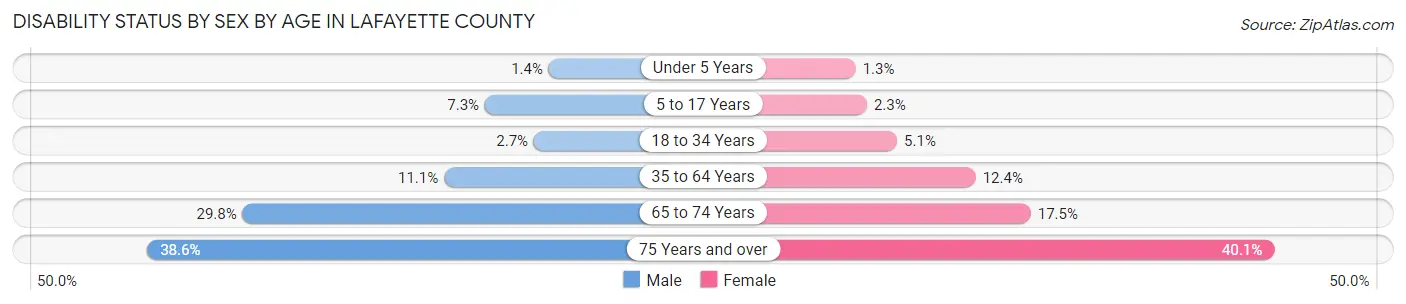
| Age Bracket | Male | Female |
| Under 5 Years | 18 (1.3%) | 18 (1.3%) |
| 5 to 17 Years | 267 (7.3%) | 87 (2.3%) |
| 18 to 34 Years | 276 (2.7%) | 548 (5.1%) |
| 35 to 64 Years | 938 (11.1%) | 1,144 (12.4%) |
| 65 to 74 Years | 641 (29.8%) | 424 (17.5%) |
| 75 Years and over | 341 (38.6%) | 591 (40.1%) |
Disability Class by Sex by Age in Lafayette County
Disability Class: Hearing Difficulty
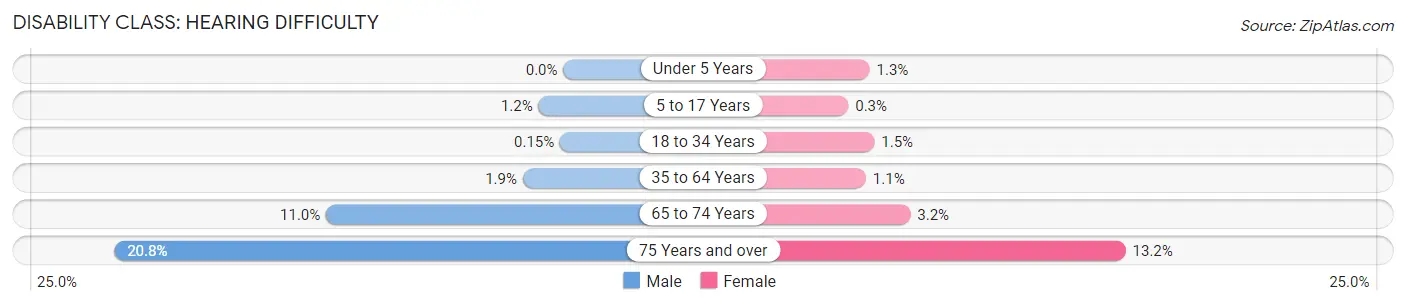
| Age Bracket | Male | Female |
| Under 5 Years | 0 (0.0%) | 18 (1.3%) |
| 5 to 17 Years | 42 (1.1%) | 11 (0.3%) |
| 18 to 34 Years | 15 (0.2%) | 161 (1.5%) |
| 35 to 64 Years | 159 (1.9%) | 103 (1.1%) |
| 65 to 74 Years | 237 (11.0%) | 77 (3.2%) |
| 75 Years and over | 184 (20.8%) | 194 (13.2%) |
Disability Class: Vision Difficulty
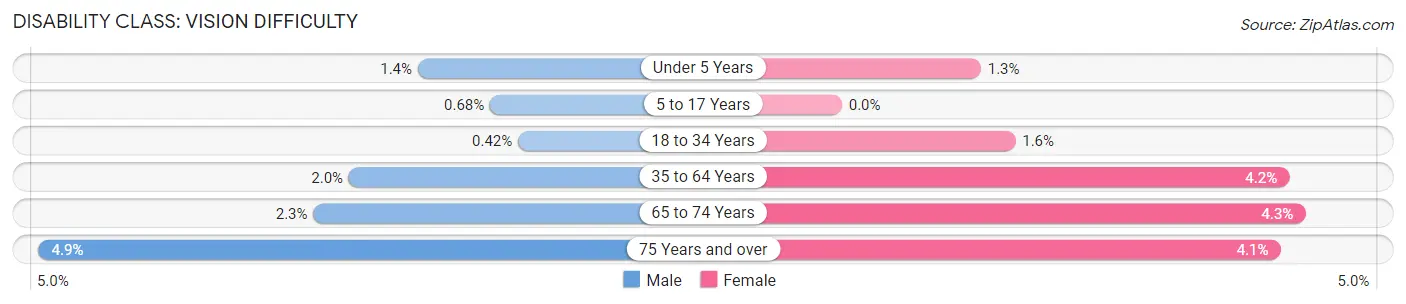
| Age Bracket | Male | Female |
| Under 5 Years | 18 (1.3%) | 18 (1.3%) |
| 5 to 17 Years | 25 (0.7%) | 0 (0.0%) |
| 18 to 34 Years | 43 (0.4%) | 171 (1.6%) |
| 35 to 64 Years | 169 (2.0%) | 382 (4.2%) |
| 65 to 74 Years | 50 (2.3%) | 104 (4.3%) |
| 75 Years and over | 43 (4.9%) | 60 (4.1%) |
Disability Class: Cognitive Difficulty
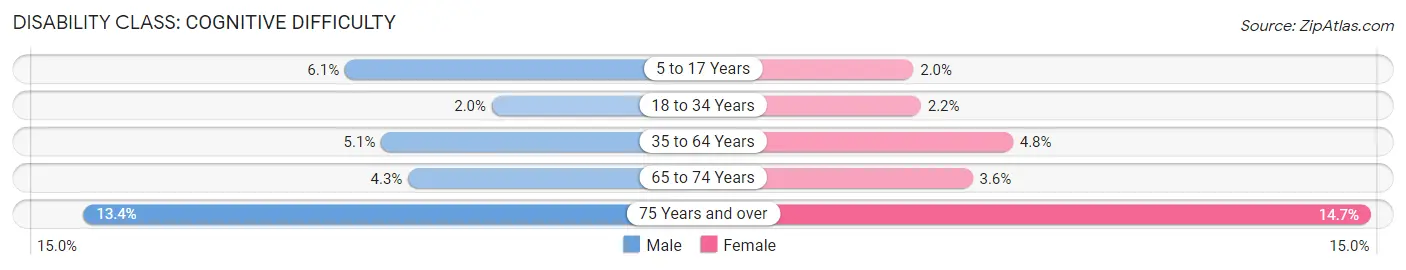
| Age Bracket | Male | Female |
| 5 to 17 Years | 223 (6.1%) | 74 (2.0%) |
| 18 to 34 Years | 201 (2.0%) | 234 (2.2%) |
| 35 to 64 Years | 430 (5.1%) | 438 (4.8%) |
| 65 to 74 Years | 93 (4.3%) | 88 (3.6%) |
| 75 Years and over | 118 (13.4%) | 217 (14.7%) |
Disability Class: Ambulatory Difficulty
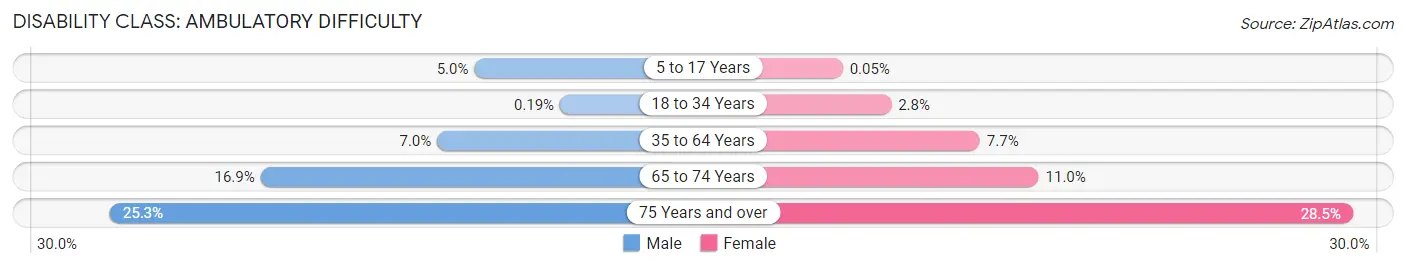
| Age Bracket | Male | Female |
| 5 to 17 Years | 182 (5.0%) | 2 (0.1%) |
| 18 to 34 Years | 19 (0.2%) | 293 (2.8%) |
| 35 to 64 Years | 596 (7.0%) | 708 (7.7%) |
| 65 to 74 Years | 363 (16.9%) | 265 (11.0%) |
| 75 Years and over | 223 (25.3%) | 419 (28.4%) |
Disability Class: Self-Care Difficulty
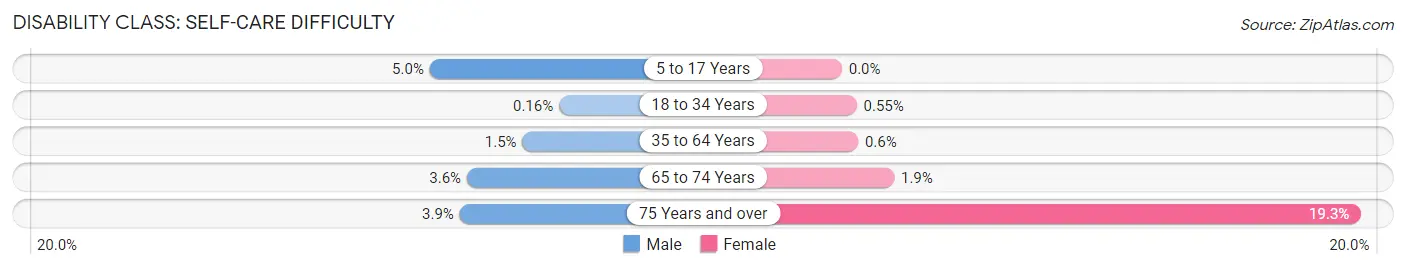
| Age Bracket | Male | Female |
| 5 to 17 Years | 182 (5.0%) | 0 (0.0%) |
| 18 to 34 Years | 16 (0.2%) | 59 (0.5%) |
| 35 to 64 Years | 129 (1.5%) | 55 (0.6%) |
| 65 to 74 Years | 77 (3.6%) | 47 (1.9%) |
| 75 Years and over | 34 (3.8%) | 284 (19.3%) |
Technology Access in Lafayette County
Computing Device Access in Lafayette County
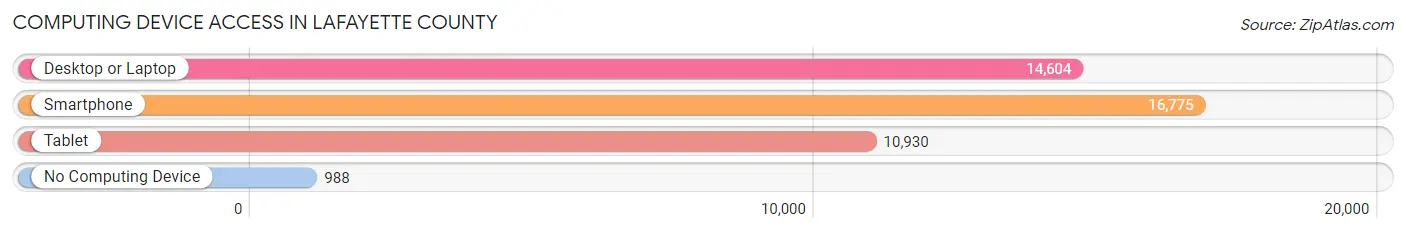
| Device Type | # Households | % Households |
| Desktop or Laptop | 14,604 | 78.1% |
| Smartphone | 16,775 | 89.7% |
| Tablet | 10,930 | 58.4% |
| No Computing Device | 988 | 5.3% |
| Total | 18,702 | 100.0% |
Internet Access in Lafayette County
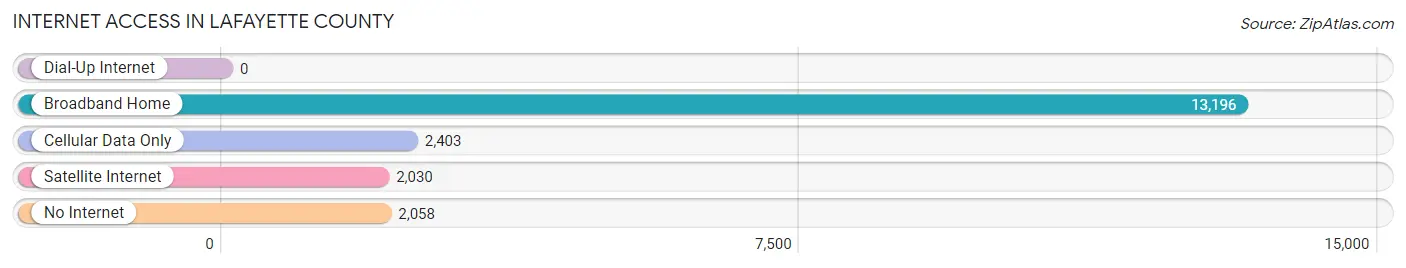
| Internet Type | # Households | % Households |
| Dial-Up Internet | 0 | 0.0% |
| Broadband Home | 13,196 | 70.6% |
| Cellular Data Only | 2,403 | 12.9% |
| Satellite Internet | 2,030 | 10.8% |
| No Internet | 2,058 | 11.0% |
| Total | 18,702 | 100.0% |
Lafayette County Summary
Lafayette County is located in the north-central region of Mississippi, and is bordered by Marshall, Union, Pontotoc, Yalobusha, and Tallahatchie counties. The county seat is Oxford, and the county is named after the Marquis de Lafayette, a French military hero who fought in the American Revolutionary War. The county has a total area of 576 square miles, and a population of 48,664 as of the 2010 census.
Geography
Lafayette County is located in the North Central Hills region of Mississippi, and is characterized by rolling hills and valleys. The county is drained by the Yocona River, which flows through the county from north to south. The county is also home to several small lakes, including Sardis Lake, which is located in the northern part of the county. The county is mostly rural, with the majority of the population living in small towns and villages.
Economy
Lafayette County is largely agricultural, with the majority of the population employed in farming and related industries. The county is home to several large farms, including the Oxford-Lafayette County Farm Bureau, which is the largest farm in the county. The county is also home to several manufacturing companies, including the Oxford-Lafayette County Industrial Park, which is home to several large companies, including the Oxford-Lafayette County Chamber of Commerce.
The county is also home to several educational institutions, including the University of Mississippi, which is located in Oxford. The university is the largest employer in the county, and is home to several research centers and institutes. The county is also home to several other colleges and universities, including the University of Mississippi Medical Center, which is located in Oxford.
Demographics
As of the 2010 census, the population of Lafayette County was 48,664, with a population density of 84.7 people per square mile. The racial makeup of the county was 79.2% White, 18.2% African American, 0.4% Native American, 0.7% Asian, 0.1% Pacific Islander, 0.5% from other races, and 1.0% from two or more races. Hispanic or Latino of any race were 1.7% of the population.
The median income for a household in the county was $37,945, and the median income for a family was $45,945. The per capita income for the county was $20,945. About 17.2% of families and 22.2% of the population were below the poverty line, including 28.2% of those under age 18 and 16.2% of those age 65 or over.
Conclusion
Lafayette County is a rural county located in the North Central Hills region of Mississippi. The county is largely agricultural, with the majority of the population employed in farming and related industries. The county is also home to several educational institutions, including the University of Mississippi, which is the largest employer in the county. The population of the county is 48,664, with a median income of $37,945. The county is diverse, with 79.2% of the population being White, 18.2% African American, 0.4% Native American, 0.7% Asian, and 0.1% Pacific Islander.
Common Questions
What is the Total Population of Lafayette County?
Total Population of Lafayette County is 56,172.
What is the Total Male Population of Lafayette County?
Total Male Population of Lafayette County is 27,066.
What is the Total Female Population of Lafayette County?
Total Female Population of Lafayette County is 29,106.
What is the Ratio of Males per 100 Females in Lafayette County?
There are 92.99 Males per 100 Females in Lafayette County.
What is the Ratio of Females per 100 Males in Lafayette County?
There are 107.54 Females per 100 Males in Lafayette County.
What is the Median Population Age in Lafayette County?
Median Population Age in Lafayette County is 30.7 Years.
What is the Average Family Size in Lafayette County
Average Family Size in Lafayette County is 3.3 People.
What is the Average Household Size in Lafayette County
Average Household Size in Lafayette County is 2.7 People.
What is Per Capita Income in Lafayette County?
Per Capita income in Lafayette County is $32,536.
What is the Median Family Income in Lafayette County?
Median Family Income in Lafayette County is $78,799.
What is the Median Household income in Lafayette County?
Median Household Income in Lafayette County is $59,748.
What is Income or Wage Gap in Lafayette County?
Income or Wage Gap in Lafayette County is 37.1%.
Women in Lafayette County earn 62.9 cents for every dollar earned by a man.
What is Family Income Deficit in Lafayette County?
Family Income Deficit in Lafayette County is $10,091.
Families that are below poverty line in Lafayette County earn $10,091 less on average than the poverty threshold level.
What is Inequality or Gini Index in Lafayette County?
Inequality or Gini Index in Lafayette County is 0.52.
How Large is the Labor Force in Lafayette County?
There are 26,237 People in the Labor Forcein in Lafayette County.
What is the Percentage of People in the Labor Force in Lafayette County?
55.9% of People are in the Labor Force in Lafayette County.
What is the Unemployment Rate in Lafayette County?
Unemployment Rate in Lafayette County is 2.8%.