Kemper County, MS
Kemper County Map

Kemper County Overview
8,980
TOTAL POPULATION
4,614
MALE POPULATION
4,366
FEMALE POPULATION
105.68
MALES / 100 FEMALES
94.63
FEMALES / 100 MALES
39.7
MEDIAN AGE
3.1
AVG FAMILY SIZE
2.5
AVG HOUSEHOLD SIZE
$22,046
PER CAPITA INCOME
$51,650
AVG FAMILY INCOME
$42,947
AVG HOUSEHOLD INCOME
23.3%
WAGE / INCOME GAP [ % ]
76.7¢/ $1
WAGE / INCOME GAP [ $ ]
0.46
INEQUALITY / GINI INDEX
3,826
LABOR FORCE [ PEOPLE ]
50.7%
PERCENT IN LABOR FORCE
14.1%
UNEMPLOYMENT RATE
Race in Kemper County
The most populous races in Kemper County are Black / African American (5,552 | 61.8%), White / Caucasian (3,023 | 33.7%), and Native / Alaskan (341 | 3.8%).

| Race | # Population | % Population |
| Asian | 3 | 0.0% |
| Black / African American | 5,552 | 61.8% |
| Hawaiian / Pacific | 0 | 0.0% |
| Hispanic or Latino | 68 | 0.8% |
| Native / Alaskan | 341 | 3.8% |
| White / Caucasian | 3,023 | 33.7% |
| Two or more Races | 33 | 0.4% |
| Some other Race | 28 | 0.3% |
| Total | 8,980 | 100.0% |
Ancestry in Kemper County
The most populous ancestries reported in Kemper County are American (506 | 5.6%), Choctaw (351 | 3.9%), Irish (320 | 3.6%), English (278 | 3.1%), and German (176 | 2.0%), together accounting for 18.2% of all Kemper County residents.

| Ancestry | # Population | % Population |
| African | 54 | 0.6% |
| American | 506 | 5.6% |
| British | 43 | 0.5% |
| Cajun | 14 | 0.2% |
| Central American | 7 | 0.1% |
| Chickasaw | 5 | 0.1% |
| Choctaw | 351 | 3.9% |
| English | 278 | 3.1% |
| European | 154 | 1.7% |
| French | 9 | 0.1% |
| German | 176 | 2.0% |
| Haitian | 15 | 0.2% |
| Irish | 320 | 3.6% |
| Italian | 63 | 0.7% |
| Mexican | 25 | 0.3% |
| Nicaraguan | 7 | 0.1% |
| Nigerian | 26 | 0.3% |
| Portuguese | 6 | 0.1% |
| Scotch-Irish | 83 | 0.9% |
| Scottish | 110 | 1.2% |
| Spanish | 14 | 0.2% |
| Subsaharan African | 80 | 0.9% |
| Thai | 3 | 0.0% |
| Welsh | 3 | 0.0% | View All 24 Rows |
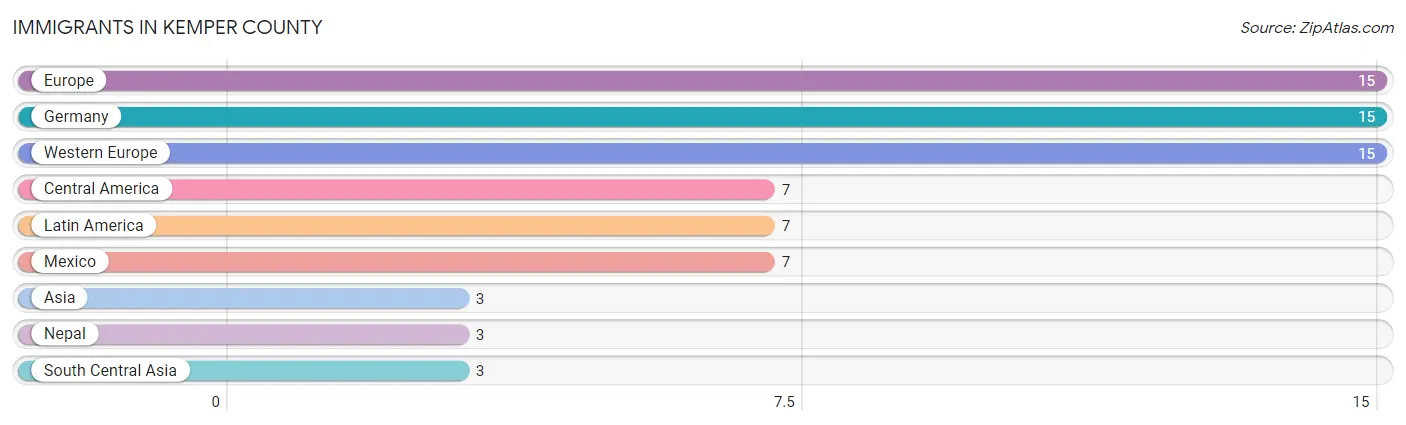
Immigrants in Kemper County
The most numerous immigrant groups reported in Kemper County came from Europe (15 | 0.2%), Germany (15 | 0.2%), Western Europe (15 | 0.2%), Central America (7 | 0.1%), and Latin America (7 | 0.1%), together accounting for 0.7% of all Kemper County residents.
| Immigration Origin | # Population | % Population |
| Asia | 3 | 0.0% |
| Central America | 7 | 0.1% |
| Europe | 15 | 0.2% |
| Germany | 15 | 0.2% |
| Latin America | 7 | 0.1% |
| Mexico | 7 | 0.1% |
| Nepal | 3 | 0.0% |
| South Central Asia | 3 | 0.0% |
| Western Europe | 15 | 0.2% | View All 9 Rows |
Sex and Age in Kemper County
Sex and Age in Kemper County
The most populous age groups in Kemper County are 20 to 24 Years (643 | 13.9%) for men and 15 to 19 Years (508 | 11.6%) for women.

| Age Bracket | Male | Female |
| Under 5 Years | 408 (8.8%) | 94 (2.1%) |
| 5 to 9 Years | 314 (6.8%) | 70 (1.6%) |
| 10 to 14 Years | 149 (3.2%) | 336 (7.7%) |
| 15 to 19 Years | 272 (5.9%) | 508 (11.6%) |
| 20 to 24 Years | 643 (13.9%) | 256 (5.9%) |
| 25 to 29 Years | 200 (4.3%) | 273 (6.2%) |
| 30 to 34 Years | 167 (3.6%) | 329 (7.5%) |
| 35 to 39 Years | 329 (7.1%) | 186 (4.3%) |
| 40 to 44 Years | 172 (3.7%) | 163 (3.7%) |
| 45 to 49 Years | 412 (8.9%) | 203 (4.6%) |
| 50 to 54 Years | 190 (4.1%) | 332 (7.6%) |
| 55 to 59 Years | 400 (8.7%) | 228 (5.2%) |
| 60 to 64 Years | 120 (2.6%) | 373 (8.5%) |
| 65 to 69 Years | 261 (5.7%) | 294 (6.7%) |
| 70 to 74 Years | 203 (4.4%) | 215 (4.9%) |
| 75 to 79 Years | 222 (4.8%) | 135 (3.1%) |
| 80 to 84 Years | 142 (3.1%) | 250 (5.7%) |
| 85 Years and over | 10 (0.2%) | 121 (2.8%) |
| Total | 4,614 (100.0%) | 4,366 (100.0%) |
Families and Households in Kemper County
Median Family Size in Kemper County
The median family size in Kemper County is 3.08 persons per family, with single female/mother families (524 | 24.6%) accounting for the largest median family size of 3.44 persons per family. On the other hand, single male/father families (275 | 12.9%) represent the smallest median family size with 2.31 persons per family.

| Family Type | # Families | Family Size |
| Married-Couple | 1,334 (62.5%) | 3.10 |
| Single Male/Father | 275 (12.9%) | 2.31 |
| Single Female/Mother | 524 (24.6%) | 3.44 |
| Total Families | 2,133 (100.0%) | 3.08 |
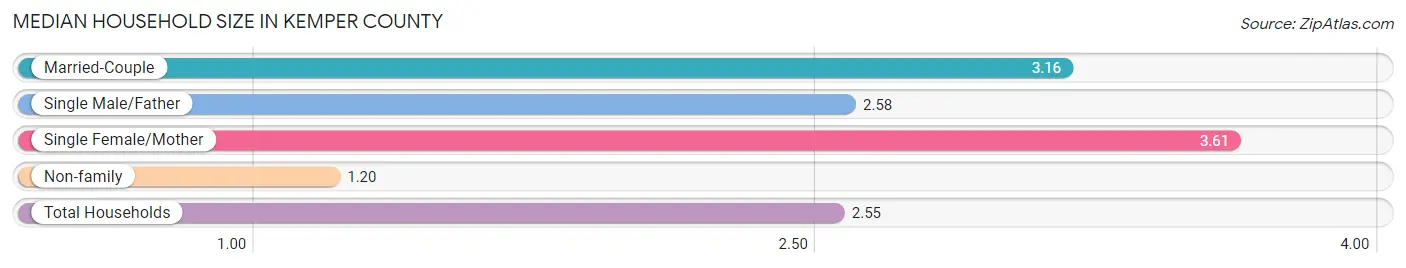
Median Household Size in Kemper County
The median household size in Kemper County is 2.55 persons per household, with single female/mother households (524 | 16.7%) accounting for the largest median household size of 3.61 persons per household. non-family households (1,010 | 32.1%) represent the smallest median household size with 1.20 persons per household.
| Household Type | # Households | Household Size |
| Married-Couple | 1,334 (42.4%) | 3.16 |
| Single Male/Father | 275 (8.7%) | 2.58 |
| Single Female/Mother | 524 (16.7%) | 3.61 |
| Non-family | 1,010 (32.1%) | 1.20 |
| Total Households | 3,143 (100.0%) | 2.55 |
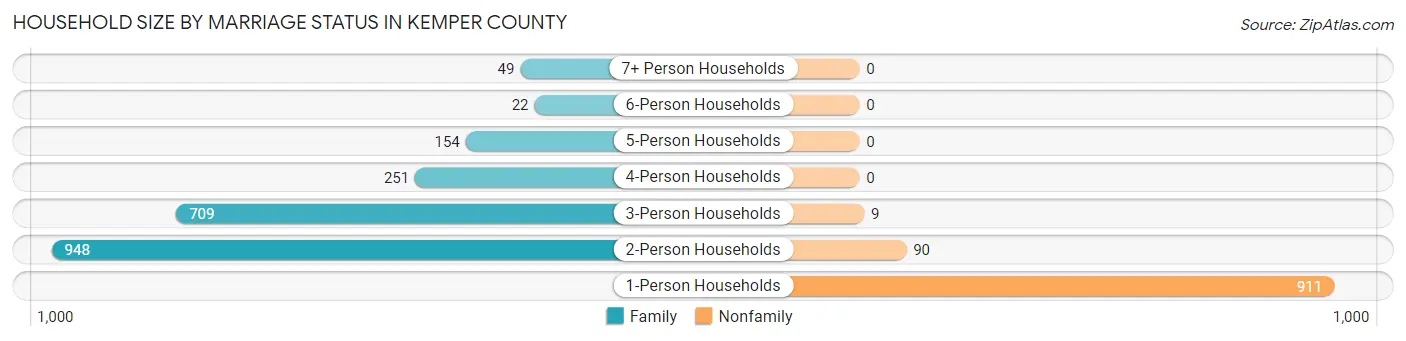
Household Size by Marriage Status in Kemper County
Out of a total of 3,143 households in Kemper County, 2,133 (67.9%) are family households, while 1,010 (32.1%) are nonfamily households. The most numerous type of family households are 2-person households, comprising 948, and the most common type of nonfamily households are 1-person households, comprising 911.
| Household Size | Family Households | Nonfamily Households |
| 1-Person Households | - | 911 (29.0%) |
| 2-Person Households | 948 (30.2%) | 90 (2.9%) |
| 3-Person Households | 709 (22.6%) | 9 (0.3%) |
| 4-Person Households | 251 (8.0%) | 0 (0.0%) |
| 5-Person Households | 154 (4.9%) | 0 (0.0%) |
| 6-Person Households | 22 (0.7%) | 0 (0.0%) |
| 7+ Person Households | 49 (1.6%) | 0 (0.0%) |
| Total | 2,133 (67.9%) | 1,010 (32.1%) |
Female Fertility in Kemper County
Fertility by Age in Kemper County
Average fertility rate in Kemper County is 127.0 births per 1,000 women. Women in the age bracket of 20 to 34 years have the highest fertility rate with 281.0 births per 1,000 women. Women in the age bracket of 20 to 34 years acount for 98.4% of all women with births.

| Age Bracket | Women with Births | Births / 1,000 Women |
| 15 to 19 years | 0 (0.0%) | 0.0 |
| 20 to 34 years | 241 (98.4%) | 281.0 |
| 35 to 50 years | 4 (1.6%) | 7.0 |
| Total | 245 (100.0%) | 127.0 |
Fertility by Age by Marriage Status in Kemper County
38.0% of women with births (245) in Kemper County are married. The highest percentage of unmarried women with births falls into 35 to 50 years age bracket with 100.0% of them unmarried at the time of birth, while the lowest percentage of unmarried women with births belong to 20 to 34 years age bracket with 61.4% of them unmarried.

| Age Bracket | Married | Unmarried |
| 15 to 19 years | 0 (0.0%) | 0 (0.0%) |
| 20 to 34 years | 93 (38.6%) | 148 (61.4%) |
| 35 to 50 years | 0 (0.0%) | 4 (100.0%) |
| Total | 93 (38.0%) | 152 (62.0%) |
Fertility by Education in Kemper County
Average fertility rate in Kemper County is 127.0 births per 1,000 women. Women with the education attainment of college or associate's degree have the highest fertility rate of 252.0 births per 1,000 women, while women with the education attainment of high school diploma have the lowest fertility at 9.0 births per 1,000 women. Women with the education attainment of college or associate's degree represent 84.1% of all women with births.

| Educational Attainment | Women with Births | Births / 1,000 Women |
| Less than High School | 29 (11.8%) | 101.0 |
| High School Diploma | 5 (2.0%) | 9.0 |
| College or Associate's Degree | 206 (84.1%) | 252.0 |
| Bachelor's Degree | 4 (1.6%) | 22.0 |
| Graduate Degree | 1 (0.4%) | 9.0 |
| Total | 245 (100.0%) | 127.0 |
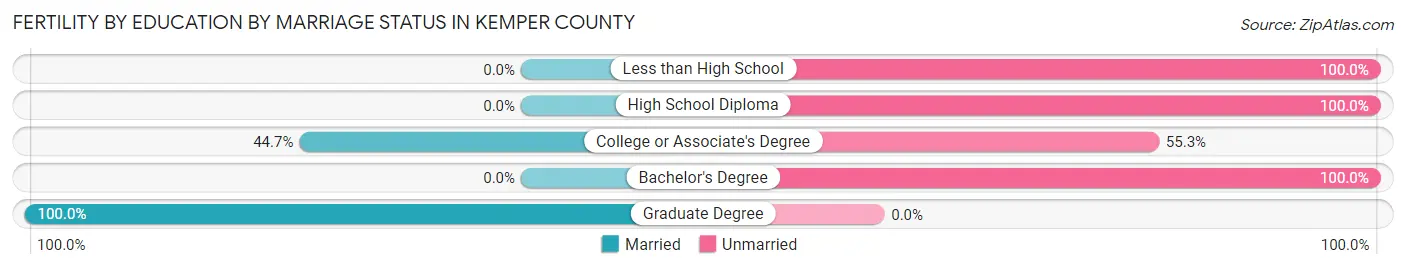
Fertility by Education by Marriage Status in Kemper County
62.0% of women with births in Kemper County are unmarried. Women with the educational attainment of graduate degree are most likely to be married with 100.0% of them married at childbirth, while women with the educational attainment of less than high school are least likely to be married with 100.0% of them unmarried at childbirth.
| Educational Attainment | Married | Unmarried |
| Less than High School | 0 (0.0%) | 29 (100.0%) |
| High School Diploma | 0 (0.0%) | 5 (100.0%) |
| College or Associate's Degree | 92 (44.7%) | 114 (55.3%) |
| Bachelor's Degree | 0 (0.0%) | 4 (100.0%) |
| Graduate Degree | 1 (100.0%) | 0 (0.0%) |
| Total | 93 (38.0%) | 152 (62.0%) |
Income in Kemper County
Income Overview in Kemper County
Per Capita Income in Kemper County is $22,046, while median incomes of families and households are $51,650 and $42,947 respectively.
| Characteristic | Number | Measure |
| Per Capita Income | 8,980 | $22,046 |
| Median Family Income | 2,133 | $51,650 |
| Mean Family Income | 2,133 | $65,351 |
| Median Household Income | 3,143 | $42,947 |
| Mean Household Income | 3,143 | $55,545 |
| Income Deficit | 2,133 | $0 |
| Wage / Income Gap (%) | 8,980 | 23.28% |
| Wage / Income Gap ($) | 8,980 | 76.72¢ per $1 |
| Gini / Inequality Index | 8,980 | 0.46 |
Earnings by Sex in Kemper County
Average Earnings in Kemper County are $27,795, $29,520 for men and $22,648 for women, a difference of 23.3%.
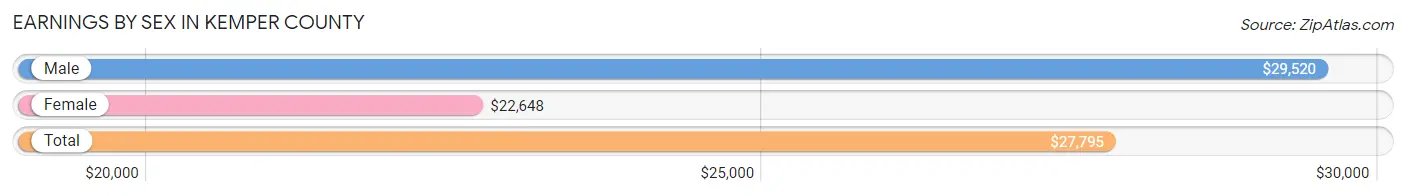
| Sex | Number | Average Earnings |
| Male | 1,952 (47.7%) | $29,520 |
| Female | 2,138 (52.3%) | $22,648 |
| Total | 4,090 (100.0%) | $27,795 |
Earnings by Sex by Income Bracket in Kemper County
The most common earnings brackets in Kemper County are $25,000 to $29,999 for men (302 | 15.5%) and $15,000 to $17,499 for women (285 | 13.3%).
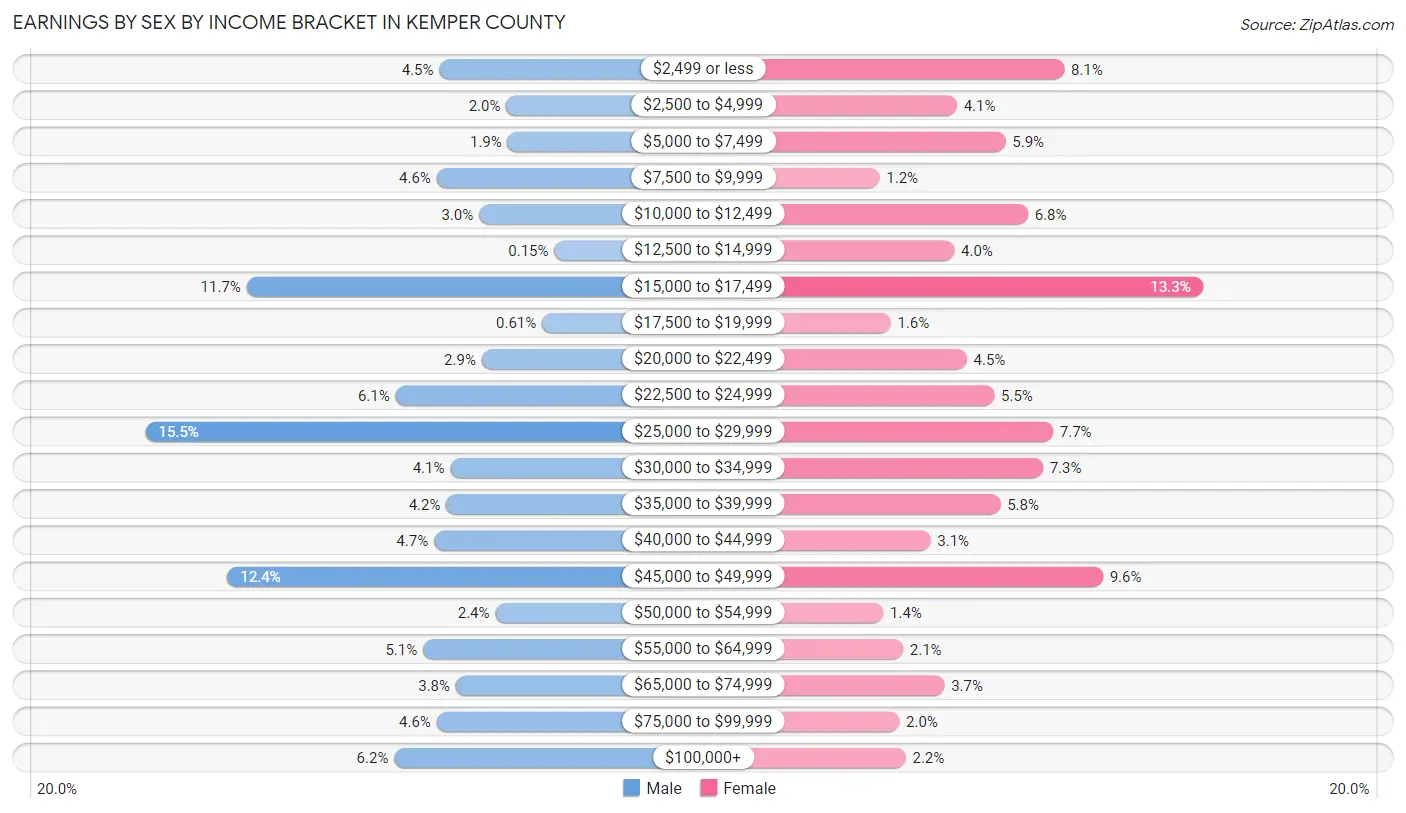
| Income | Male | Female |
| $2,499 or less | 87 (4.5%) | 174 (8.1%) |
| $2,500 to $4,999 | 38 (1.9%) | 88 (4.1%) |
| $5,000 to $7,499 | 37 (1.9%) | 127 (5.9%) |
| $7,500 to $9,999 | 89 (4.6%) | 26 (1.2%) |
| $10,000 to $12,499 | 58 (3.0%) | 145 (6.8%) |
| $12,500 to $14,999 | 3 (0.2%) | 86 (4.0%) |
| $15,000 to $17,499 | 228 (11.7%) | 285 (13.3%) |
| $17,500 to $19,999 | 12 (0.6%) | 35 (1.6%) |
| $20,000 to $22,499 | 56 (2.9%) | 96 (4.5%) |
| $22,500 to $24,999 | 119 (6.1%) | 118 (5.5%) |
| $25,000 to $29,999 | 302 (15.5%) | 165 (7.7%) |
| $30,000 to $34,999 | 79 (4.1%) | 157 (7.3%) |
| $35,000 to $39,999 | 82 (4.2%) | 123 (5.8%) |
| $40,000 to $44,999 | 91 (4.7%) | 67 (3.1%) |
| $45,000 to $49,999 | 242 (12.4%) | 205 (9.6%) |
| $50,000 to $54,999 | 46 (2.4%) | 29 (1.4%) |
| $55,000 to $64,999 | 99 (5.1%) | 45 (2.1%) |
| $65,000 to $74,999 | 75 (3.8%) | 78 (3.6%) |
| $75,000 to $99,999 | 89 (4.6%) | 42 (2.0%) |
| $100,000+ | 120 (6.1%) | 47 (2.2%) |
| Total | 1,952 (100.0%) | 2,138 (100.0%) |
Earnings by Sex by Educational Attainment in Kemper County
Average earnings in Kemper County are $40,434 for men and $25,460 for women, a difference of 37.0%. Men with an educational attainment of graduate degree enjoy the highest average annual earnings of $74,235, while those with less than high school education earn the least with $26,458. Women with an educational attainment of bachelor's degree earn the most with the average annual earnings of $46,250, while those with less than high school education have the smallest earnings of $12,277.

| Educational Attainment | Male Income | Female Income |
| Less than High School | $26,458 | $12,277 |
| High School Diploma | $30,994 | $21,726 |
| College or Associate's Degree | $40,506 | $24,877 |
| Bachelor's Degree | - | - |
| Graduate Degree | $74,235 | $0 |
| Total | $40,434 | $25,460 |
Family Income in Kemper County
Family Income Brackets in Kemper County
According to the Kemper County family income data, there are 495 families falling into the $50,000 to $74,999 income range, which is the most common income bracket and makes up 23.2% of all families. Conversely, the $200,000+ income bracket is the least frequent group with only 68 families (3.2%) belonging to this category.

| Income Bracket | # Families | % Families |
| Less than $10,000 | 147 | 6.9% |
| $10,000 to $14,999 | 113 | 5.3% |
| $15,000 to $24,999 | 305 | 14.3% |
| $25,000 to $34,999 | 79 | 3.7% |
| $35,000 to $49,999 | 371 | 17.4% |
| $50,000 to $74,999 | 495 | 23.2% |
| $75,000 to $99,999 | 273 | 12.8% |
| $100,000 to $149,999 | 132 | 6.2% |
| $150,000 to $199,999 | 149 | 7.0% |
| $200,000+ | 68 | 3.2% |
Family Income by Famaliy Size in Kemper County
5-person families (122 | 5.7%) account for the highest median family income in Kemper County with $63,611 per family, while 3-person families (713 | 33.4%) have the highest median income of $20,943 per family member.

| Income Bracket | # Families | Median Income |
| 2-Person Families | 1,026 (48.1%) | $40,114 |
| 3-Person Families | 713 (33.4%) | $62,830 |
| 4-Person Families | 201 (9.4%) | $0 |
| 5-Person Families | 122 (5.7%) | $63,611 |
| 6-Person Families | 43 (2.0%) | $0 |
| 7+ Person Families | 28 (1.3%) | $0 |
| Total | 2,133 (100.0%) | $51,650 |
Family Income by Number of Earners in Kemper County
The median family income in Kemper County is $51,650, with families comprising 3+ earners (140) having the highest median family income of $91,719, while families with no earners (622) have the lowest median family income of $21,375, accounting for 6.6% and 29.2% of families, respectively.

| Number of Earners | # Families | Median Income |
| No Earners | 622 (29.2%) | $21,375 |
| 1 Earner | 606 (28.4%) | $45,445 |
| 2 Earners | 765 (35.9%) | $64,968 |
| 3+ Earners | 140 (6.6%) | $91,719 |
| Total | 2,133 (100.0%) | $51,650 |
Household Income in Kemper County
Household Income Brackets in Kemper County
With 663 households falling in the category, the $35,000 to $49,999 income range is the most frequent in Kemper County, accounting for 21.1% of all households. In contrast, only 94 households (3.0%) fall into the $200,000+ income bracket, making it the least populous group.
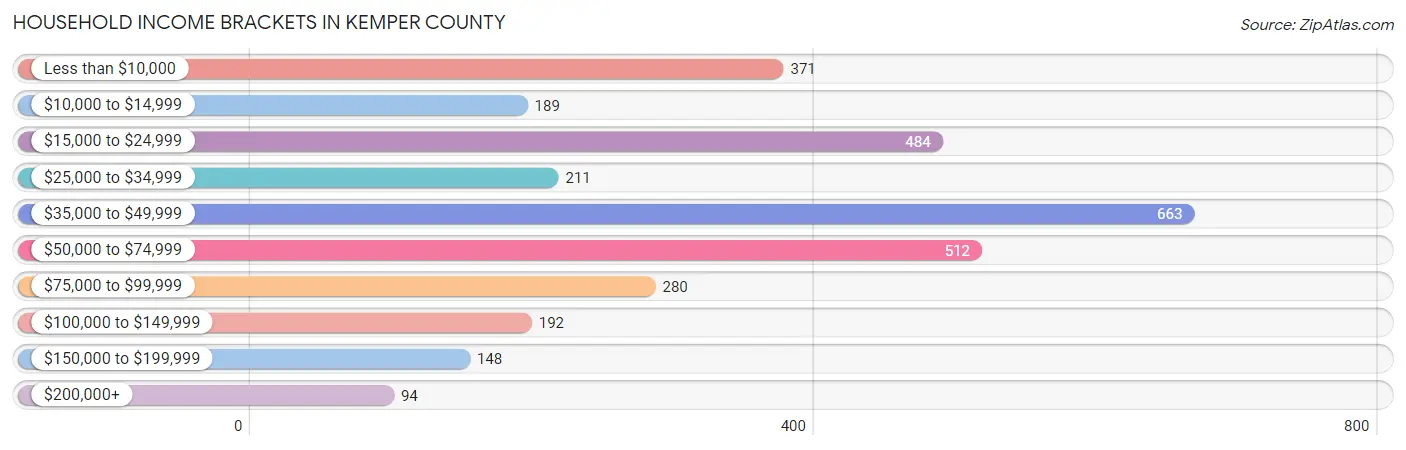
| Income Bracket | # Households | % Households |
| Less than $10,000 | 371 | 11.8% |
| $10,000 to $14,999 | 189 | 6.0% |
| $15,000 to $24,999 | 484 | 15.4% |
| $25,000 to $34,999 | 211 | 6.7% |
| $35,000 to $49,999 | 663 | 21.1% |
| $50,000 to $74,999 | 512 | 16.3% |
| $75,000 to $99,999 | 280 | 8.9% |
| $100,000 to $149,999 | 192 | 6.1% |
| $150,000 to $199,999 | 148 | 4.7% |
| $200,000+ | 94 | 3.0% |
Household Income by Householder Age in Kemper County
The median household income in Kemper County is $42,947, with the highest median household income of $46,875 found in the 25 to 44 years age bracket for the primary householder. A total of 609 households (19.4%) fall into this category. Meanwhile, the 15 to 24 years age bracket for the primary householder has the lowest median household income of $0, with 50 households (1.6%) in this group.

| Income Bracket | # Households | Median Income |
| 15 to 24 Years | 50 (1.6%) | $0 |
| 25 to 44 Years | 609 (19.4%) | $46,875 |
| 45 to 64 Years | 1,386 (44.1%) | $46,301 |
| 65+ Years | 1,098 (34.9%) | $37,763 |
| Total | 3,143 (100.0%) | $42,947 |
Poverty in Kemper County
Income Below Poverty by Sex and Age in Kemper County
With 21.1% poverty level for males and 22.9% for females among the residents of Kemper County, 5 year old males and 5 year old females are the most vulnerable to poverty, with 19 males (100.0%) and 40 females (100.0%) in their respective age groups living below the poverty level.
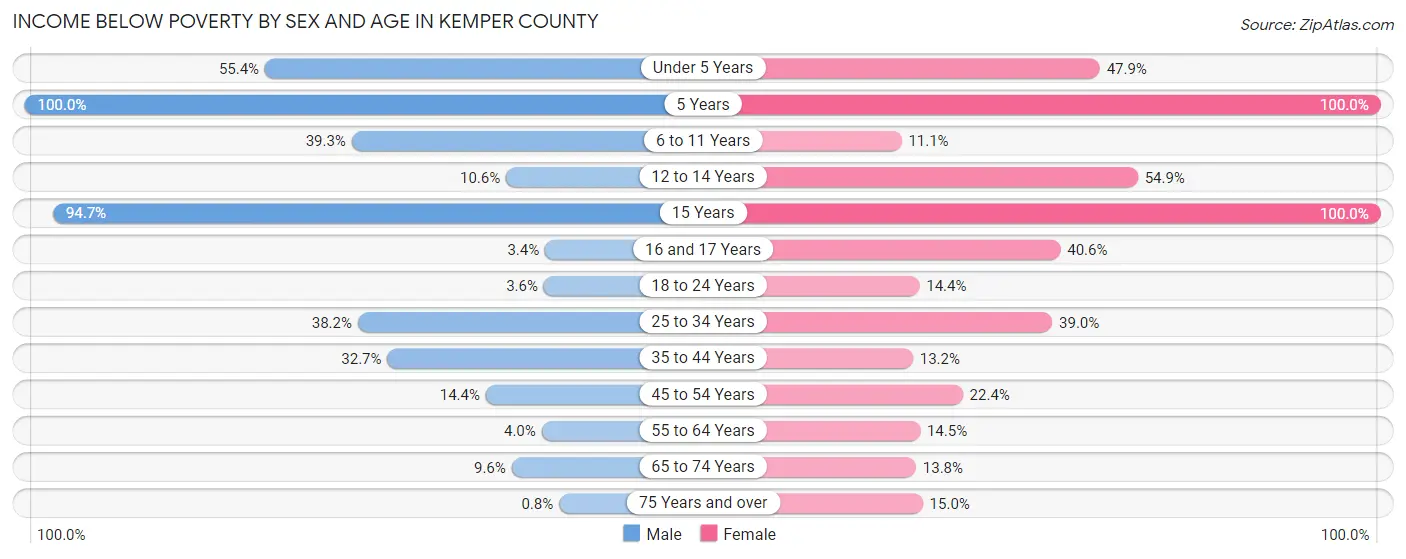
| Age Bracket | Male | Female |
| Under 5 Years | 226 (55.4%) | 45 (47.9%) |
| 5 Years | 19 (100.0%) | 40 (100.0%) |
| 6 to 11 Years | 156 (39.3%) | 27 (11.1%) |
| 12 to 14 Years | 5 (10.6%) | 67 (54.9%) |
| 15 Years | 36 (94.7%) | 24 (100.0%) |
| 16 and 17 Years | 2 (3.4%) | 58 (40.6%) |
| 18 to 24 Years | 17 (3.6%) | 61 (14.4%) |
| 25 to 34 Years | 95 (38.2%) | 235 (39.0%) |
| 35 to 44 Years | 132 (32.7%) | 46 (13.2%) |
| 45 to 54 Years | 75 (14.4%) | 120 (22.4%) |
| 55 to 64 Years | 20 (4.0%) | 85 (14.5%) |
| 65 to 74 Years | 43 (9.6%) | 70 (13.8%) |
| 75 Years and over | 3 (0.8%) | 71 (15.0%) |
| Total | 829 (21.1%) | 949 (22.9%) |
Income Above Poverty by Sex and Age in Kemper County
According to the poverty statistics in Kemper County, males aged 75 years and over and females aged 6 to 11 years are the age groups that are most secure financially, with 99.2% of males and 88.9% of females in these age groups living above the poverty line.
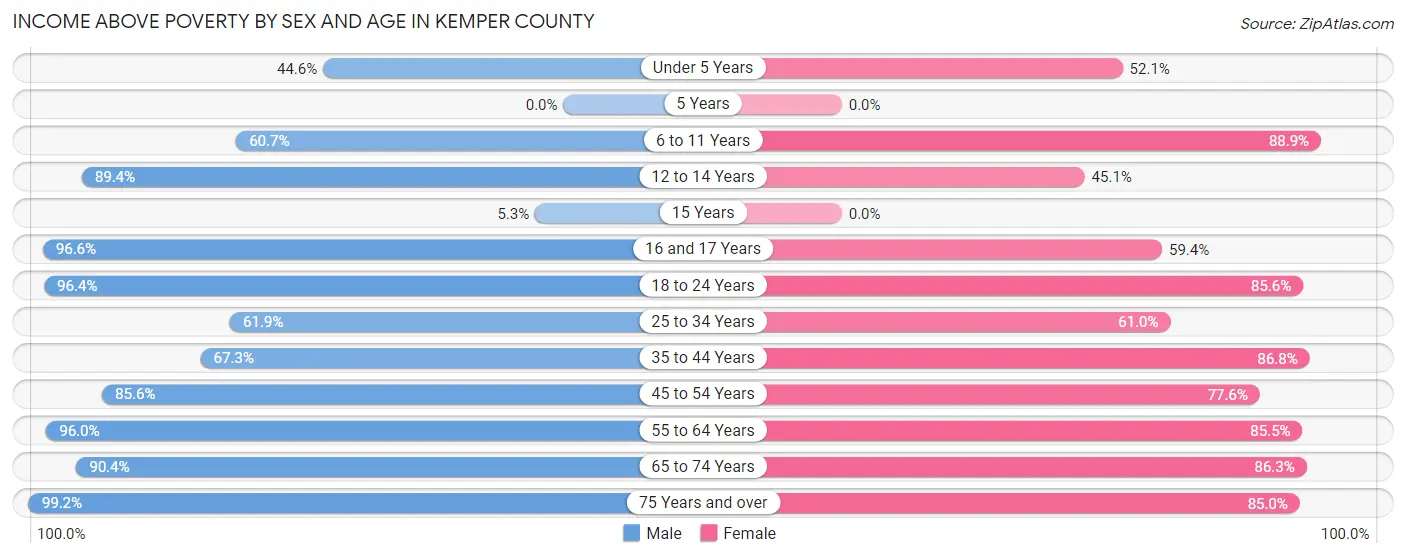
| Age Bracket | Male | Female |
| Under 5 Years | 182 (44.6%) | 49 (52.1%) |
| 5 Years | 0 (0.0%) | 0 (0.0%) |
| 6 to 11 Years | 241 (60.7%) | 217 (88.9%) |
| 12 to 14 Years | 42 (89.4%) | 55 (45.1%) |
| 15 Years | 2 (5.3%) | 0 (0.0%) |
| 16 and 17 Years | 57 (96.6%) | 85 (59.4%) |
| 18 to 24 Years | 451 (96.4%) | 363 (85.6%) |
| 25 to 34 Years | 154 (61.9%) | 367 (61.0%) |
| 35 to 44 Years | 272 (67.3%) | 303 (86.8%) |
| 45 to 54 Years | 446 (85.6%) | 415 (77.6%) |
| 55 to 64 Years | 476 (96.0%) | 501 (85.5%) |
| 65 to 74 Years | 405 (90.4%) | 439 (86.3%) |
| 75 Years and over | 371 (99.2%) | 402 (85.0%) |
| Total | 3,099 (78.9%) | 3,196 (77.1%) |
Income Below Poverty Among Married-Couple Families in Kemper County
The poverty statistics for married-couple families in Kemper County show that 0.7% or 9 of the total 1,334 families live below the poverty line. Families with no children have the highest poverty rate of 0.9%, comprising of 9 families. On the other hand, families with 1 or 2 children have the lowest poverty rate of 0.0%, which includes 0 families.

| Children | Above Poverty | Below Poverty |
| No Children | 1,036 (99.1%) | 9 (0.9%) |
| 1 or 2 Children | 169 (100.0%) | 0 (0.0%) |
| 3 or 4 Children | 116 (100.0%) | 0 (0.0%) |
| 5 or more Children | 4 (100.0%) | 0 (0.0%) |
| Total | 1,325 (99.3%) | 9 (0.7%) |
Income Below Poverty Among Single-Parent Households in Kemper County
According to the poverty data in Kemper County, 46.2% or 127 single-father households and 50.9% or 267 single-mother households are living below the poverty line. Among single-father households, those with 1 or 2 children have the highest poverty rate, with 121 households (48.6%) experiencing poverty. Likewise, among single-mother households, those with 3 or 4 children have the highest poverty rate, with 54 households (100.0%) falling below the poverty line.

| Children | Single Father | Single Mother |
| No Children | 6 (23.1%) | 53 (39.9%) |
| 1 or 2 Children | 121 (48.6%) | 109 (38.1%) |
| 3 or 4 Children | 0 (0.0%) | 54 (100.0%) |
| 5 or more Children | 0 (0.0%) | 51 (100.0%) |
| Total | 127 (46.2%) | 267 (50.9%) |
Income Below Poverty Among Married-Couple vs Single-Parent Households in Kemper County
The poverty data for Kemper County shows that 9 of the married-couple family households (0.7%) and 394 of the single-parent households (49.3%) are living below the poverty level. Within the married-couple family households, those with no children have the highest poverty rate, with 9 households (0.9%) falling below the poverty line. Among the single-parent households, those with 3 or 4 children have the highest poverty rate, with 54 household (100.0%) living below poverty.

| Children | Married-Couple Families | Single-Parent Households |
| No Children | 9 (0.9%) | 59 (37.1%) |
| 1 or 2 Children | 0 (0.0%) | 230 (43.0%) |
| 3 or 4 Children | 0 (0.0%) | 54 (100.0%) |
| 5 or more Children | 0 (0.0%) | 51 (100.0%) |
| Total | 9 (0.7%) | 394 (49.3%) |
Employment Characteristics in Kemper County
Employment by Class of Employer in Kemper County
Among the 3,192 employed individuals in Kemper County, private company employees (2,123 | 66.5%), local government employees (307 | 9.6%), and federal government employees (282 | 8.8%) make up the most common classes of employment.

| Employer Class | # Employees | % Employees |
| Private Company Employees | 2,123 | 66.5% |
| Self-Employed (Incorporated) | 15 | 0.5% |
| Self-Employed (Not Incorporated) | 96 | 3.0% |
| Not-for-profit Organizations | 173 | 5.4% |
| Local Government Employees | 307 | 9.6% |
| State Government Employees | 196 | 6.1% |
| Federal Government Employees | 282 | 8.8% |
| Unpaid Family Workers | 0 | 0.0% |
| Total | 3,192 | 100.0% |
Employment Status by Age in Kemper County
According to the labor force statistics for Kemper County, out of the total population over 16 years of age (7,547), 50.7% or 3,826 individuals are in the labor force, with 14.1% or 539 of them unemployed. The age group with the highest labor force participation rate is 55 to 59 years, with 80.9% or 508 individuals in the labor force. Within the labor force, the 25 to 29 years age range has the highest percentage of unemployed individuals, with 61.3% or 146 of them being unemployed.
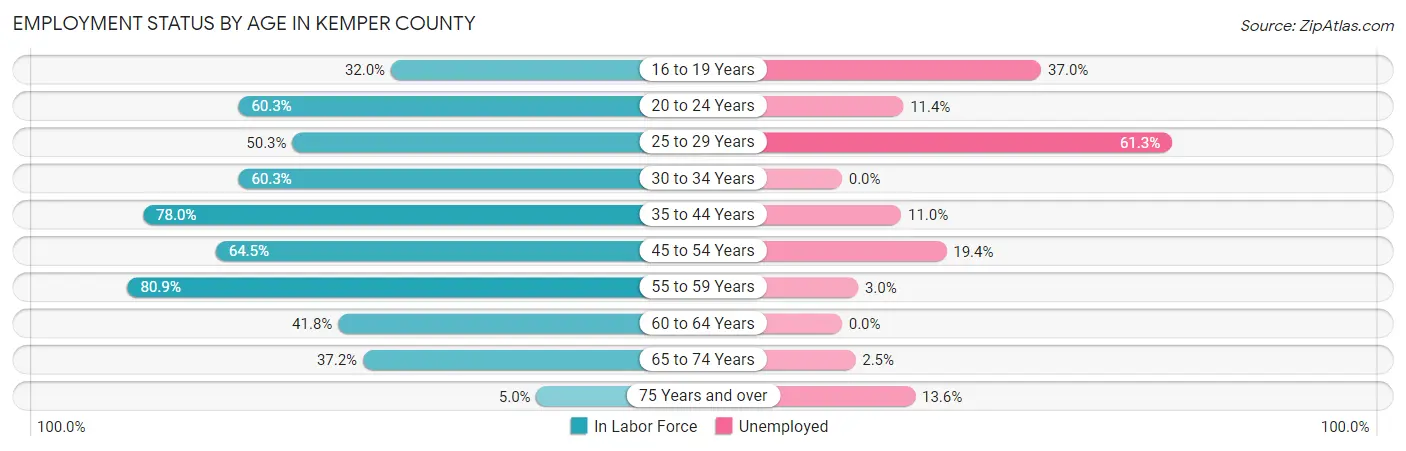
| Age Bracket | In Labor Force | Unemployed |
| 16 to 19 Years | 230 (32.0%) | 85 (37.0%) |
| 20 to 24 Years | 542 (60.3%) | 62 (11.4%) |
| 25 to 29 Years | 238 (50.3%) | 146 (61.3%) |
| 30 to 34 Years | 299 (60.3%) | 0 (0.0%) |
| 35 to 44 Years | 663 (78.0%) | 73 (11.0%) |
| 45 to 54 Years | 733 (64.5%) | 142 (19.4%) |
| 55 to 59 Years | 508 (80.9%) | 15 (3.0%) |
| 60 to 64 Years | 206 (41.8%) | 0 (0.0%) |
| 65 to 74 Years | 362 (37.2%) | 9 (2.5%) |
| 75 Years and over | 44 (5.0%) | 6 (13.6%) |
| Total | 3,826 (50.7%) | 539 (14.1%) |
Employment Status by Educational Attainment in Kemper County
According to labor force statistics for Kemper County, 64.9% of individuals (2,646) out of the total population between 25 and 64 years of age (4,077) are in the labor force, with 14.2% or 376 of them being unemployed. The group with the highest labor force participation rate are those with the educational attainment of bachelor's degree or higher, with 82.8% or 475 individuals in the labor force. Within the labor force, individuals with less than high school education have the highest percentage of unemployment, with 23.4% or 58 of them being unemployed.
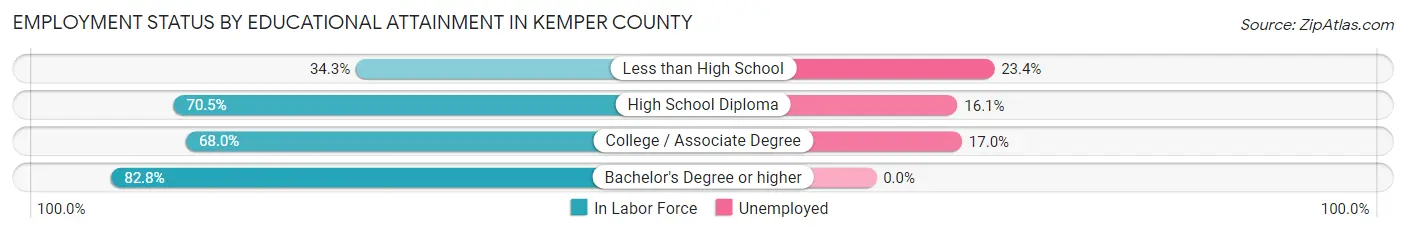
| Educational Attainment | In Labor Force | Unemployed |
| Less than High School | 248 (34.3%) | 169 (23.4%) |
| High School Diploma | 939 (70.5%) | 214 (16.1%) |
| College / Associate Degree | 985 (68.0%) | 246 (17.0%) |
| Bachelor's Degree or higher | 475 (82.8%) | 0 (0.0%) |
| Total | 2,646 (64.9%) | 579 (14.2%) |
Employment Occupations by Sex in Kemper County
Management, Business, Science and Arts Occupations
The most common Management, Business, Science and Arts occupations in Kemper County are Business & Financial (309 | 9.4%), Community & Social Service (295 | 9.0%), Education Instruction & Library (250 | 7.6%), Management (179 | 5.4%), and Health Diagnosing & Treating (175 | 5.3%).

Management, Business, Science and Arts Occupations by Sex
Within the Management, Business, Science and Arts occupations in Kemper County, the most male-oriented occupations are Business & Financial (100.0%), Computers & Mathematics (100.0%), and Arts, Media & Entertainment (100.0%), while the most female-oriented occupations are Architecture & Engineering (100.0%), Legal Services & Support (100.0%), and Health Diagnosing & Treating (89.1%).

| Occupation | Male | Female |
| Management | 50 (27.9%) | 129 (72.1%) |
| Business & Financial | 309 (100.0%) | 0 (0.0%) |
| Computers, Engineering & Science | 19 (79.2%) | 5 (20.8%) |
| Computers & Mathematics | 19 (100.0%) | 0 (0.0%) |
| Architecture & Engineering | 0 (0.0%) | 5 (100.0%) |
| Life, Physical & Social Science | 0 (0.0%) | 0 (0.0%) |
| Community & Social Service | 129 (43.7%) | 166 (56.3%) |
| Education, Arts & Media | 38 (90.5%) | 4 (9.5%) |
| Legal Services & Support | 0 (0.0%) | 2 (100.0%) |
| Education Instruction & Library | 90 (36.0%) | 160 (64.0%) |
| Arts, Media & Entertainment | 1 (100.0%) | 0 (0.0%) |
| Health Diagnosing & Treating | 19 (10.9%) | 156 (89.1%) |
| Health Technologists | 19 (15.0%) | 108 (85.0%) |
| Total (Category) | 526 (53.6%) | 456 (46.4%) |
| Total (Overall) | 1,598 (48.6%) | 1,689 (51.4%) |
Services Occupations
The most common Services occupations in Kemper County are Food Preparation & Serving (224 | 6.8%), Personal Care & Service (148 | 4.5%), Cleaning & Maintenance (134 | 4.1%), Healthcare Support (74 | 2.2%), and Security & Protection (57 | 1.7%).

Services Occupations by Sex
Within the Services occupations in Kemper County, the most male-oriented occupations are Cleaning & Maintenance (83.6%), Firefighting & Prevention (46.7%), and Food Preparation & Serving (39.3%), while the most female-oriented occupations are Healthcare Support (100.0%), Personal Care & Service (96.0%), and Law Enforcement (66.7%).

| Occupation | Male | Female |
| Healthcare Support | 0 (0.0%) | 74 (100.0%) |
| Security & Protection | 21 (36.8%) | 36 (63.2%) |
| Firefighting & Prevention | 7 (46.7%) | 8 (53.3%) |
| Law Enforcement | 14 (33.3%) | 28 (66.7%) |
| Food Preparation & Serving | 88 (39.3%) | 136 (60.7%) |
| Cleaning & Maintenance | 112 (83.6%) | 22 (16.4%) |
| Personal Care & Service | 6 (4.1%) | 142 (96.0%) |
| Total (Category) | 227 (35.6%) | 410 (64.4%) |
| Total (Overall) | 1,598 (48.6%) | 1,689 (51.4%) |
Sales and Office Occupations
The most common Sales and Office occupations in Kemper County are Office & Administration (400 | 12.2%), and Sales & Related (122 | 3.7%).

Sales and Office Occupations by Sex

| Occupation | Male | Female |
| Sales & Related | 23 (18.9%) | 99 (81.1%) |
| Office & Administration | 52 (13.0%) | 348 (87.0%) |
| Total (Category) | 75 (14.4%) | 447 (85.6%) |
| Total (Overall) | 1,598 (48.6%) | 1,689 (51.4%) |
Natural Resources, Construction and Maintenance Occupations
The most common Natural Resources, Construction and Maintenance occupations in Kemper County are Construction & Extraction (84 | 2.6%), Farming, Fishing & Forestry (68 | 2.1%), and Installation, Maintenance & Repair (35 | 1.1%).

Natural Resources, Construction and Maintenance Occupations by Sex

| Occupation | Male | Female |
| Farming, Fishing & Forestry | 68 (100.0%) | 0 (0.0%) |
| Construction & Extraction | 84 (100.0%) | 0 (0.0%) |
| Installation, Maintenance & Repair | 35 (100.0%) | 0 (0.0%) |
| Total (Category) | 187 (100.0%) | 0 (0.0%) |
| Total (Overall) | 1,598 (48.6%) | 1,689 (51.4%) |
Production, Transportation and Moving Occupations
The most common Production, Transportation and Moving occupations in Kemper County are Production (552 | 16.8%), Transportation (248 | 7.5%), and Material Moving (159 | 4.8%).

Production, Transportation and Moving Occupations by Sex

| Occupation | Male | Female |
| Production | 235 (42.6%) | 317 (57.4%) |
| Transportation | 225 (90.7%) | 23 (9.3%) |
| Material Moving | 123 (77.4%) | 36 (22.6%) |
| Total (Category) | 583 (60.8%) | 376 (39.2%) |
| Total (Overall) | 1,598 (48.6%) | 1,689 (51.4%) |
Employment Industries by Sex in Kemper County
Employment Industries in Kemper County
The major employment industries in Kemper County include Educational Services (583 | 17.7%), Manufacturing (572 | 17.4%), Health Care & Social Assistance (337 | 10.2%), Retail Trade (273 | 8.3%), and Arts, Entertainment & Recreation (264 | 8.0%).

Employment Industries by Sex in Kemper County
The Kemper County industries that see more men than women are Agriculture, Fishing & Hunting (100.0%), Construction (100.0%), and Utilities (100.0%), whereas the industries that tend to have a higher number of women are Administrative & Support (92.1%), Health Care & Social Assistance (76.8%), and Manufacturing (70.8%).

| Industry | Male | Female |
| Agriculture, Fishing & Hunting | 154 (100.0%) | 0 (0.0%) |
| Mining, Quarrying, & Extraction | 0 (0.0%) | 0 (0.0%) |
| Construction | 115 (100.0%) | 0 (0.0%) |
| Manufacturing | 167 (29.2%) | 405 (70.8%) |
| Wholesale Trade | 64 (45.4%) | 77 (54.6%) |
| Retail Trade | 90 (33.0%) | 183 (67.0%) |
| Transportation & Warehousing | 188 (97.4%) | 5 (2.6%) |
| Utilities | 41 (100.0%) | 0 (0.0%) |
| Information | 0 (0.0%) | 0 (0.0%) |
| Finance & Insurance | 23 (100.0%) | 0 (0.0%) |
| Real Estate, Rental & Leasing | 4 (100.0%) | 0 (0.0%) |
| Professional & Scientific | 15 (36.6%) | 26 (63.4%) |
| Enterprise Management | 0 (0.0%) | 0 (0.0%) |
| Administrative & Support | 3 (7.9%) | 35 (92.1%) |
| Educational Services | 369 (63.3%) | 214 (36.7%) |
| Health Care & Social Assistance | 78 (23.2%) | 259 (76.8%) |
| Arts, Entertainment & Recreation | 109 (41.3%) | 155 (58.7%) |
| Accommodation & Food Services | 59 (41.5%) | 83 (58.5%) |
| Public Administration | 67 (34.5%) | 127 (65.5%) |
| Total | 1,598 (48.6%) | 1,689 (51.4%) |
Education in Kemper County
School Enrollment in Kemper County
The most common levels of schooling among the 2,256 students in Kemper County are college / undergraduate (698 | 30.9%), middle school (454 | 20.1%), and graduate / professional (343 | 15.2%).

| School Level | # Students | % Students |
| Nursery / Preschool | 125 | 5.5% |
| Kindergarten | 62 | 2.8% |
| Elementary School | 327 | 14.5% |
| Middle School | 454 | 20.1% |
| High School | 247 | 11.0% |
| College / Undergraduate | 698 | 30.9% |
| Graduate / Professional | 343 | 15.2% |
| Total | 2,256 | 100.0% |
School Enrollment by Age by Funding Source in Kemper County
Out of a total of 2,256 students who are enrolled in schools in Kemper County, 280 (12.4%) attend a private institution, while the remaining 1,976 (87.6%) are enrolled in public schools. The age group of 3 to 4 year olds has the highest likelihood of being enrolled in private schools, with 116 (92.8% in the age bracket) enrolled. Conversely, the age group of 18 to 19 year olds has the lowest likelihood of being enrolled in a private school, with 366 (100.0% in the age bracket) attending a public institution.

| Age Bracket | Public School | Private School |
| 3 to 4 Year Olds | 9 (7.2%) | 116 (92.8%) |
| 5 to 9 Year Old | 303 (78.9%) | 81 (21.1%) |
| 10 to 14 Year Olds | 386 (86.9%) | 58 (13.1%) |
| 15 to 17 Year Olds | 250 (96.5%) | 9 (3.5%) |
| 18 to 19 Year Olds | 366 (100.0%) | 0 (0.0%) |
| 20 to 24 Year Olds | 533 (98.7%) | 7 (1.3%) |
| 25 to 34 Year Olds | 32 (86.5%) | 5 (13.5%) |
| 35 Years and over | 98 (97.0%) | 3 (3.0%) |
| Total | 1,976 (87.6%) | 280 (12.4%) |
Educational Attainment by Field of Study in Kemper County
Education (314 | 29.4%), business (240 | 22.5%), literature & languages (115 | 10.8%), social sciences (90 | 8.4%), and science & technology (88 | 8.2%) are the most common fields of study among 1,069 individuals in Kemper County who have obtained a bachelor's degree or higher.

| Field of Study | # Graduates | % Graduates |
| Computers & Mathematics | 24 | 2.2% |
| Bio, Nature & Agricultural | 45 | 4.2% |
| Physical & Health Sciences | 42 | 3.9% |
| Psychology | 1 | 0.1% |
| Social Sciences | 90 | 8.4% |
| Engineering | 15 | 1.4% |
| Multidisciplinary Studies | 0 | 0.0% |
| Science & Technology | 88 | 8.2% |
| Business | 240 | 22.5% |
| Education | 314 | 29.4% |
| Literature & Languages | 115 | 10.8% |
| Liberal Arts & History | 29 | 2.7% |
| Visual & Performing Arts | 14 | 1.3% |
| Communications | 0 | 0.0% |
| Arts & Humanities | 52 | 4.9% |
| Total | 1,069 | 100.0% |
Transportation & Commute in Kemper County
Vehicle Availability by Sex in Kemper County
The most prevalent vehicle ownership categories in Kemper County are males with 3 vehicles (751, accounting for 50.2%) and females with 3 vehicles (708, making up 45.4%).
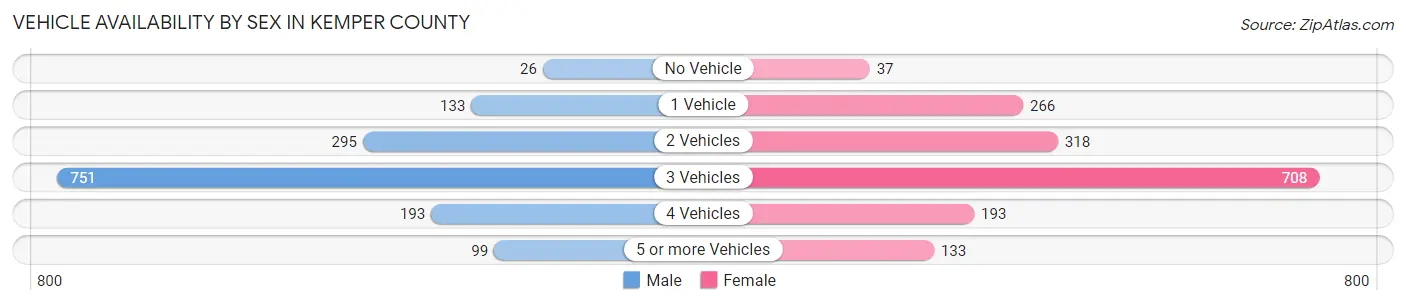
| Vehicles Available | Male | Female |
| No Vehicle | 26 (1.7%) | 37 (2.2%) |
| 1 Vehicle | 133 (8.9%) | 266 (16.1%) |
| 2 Vehicles | 295 (19.7%) | 318 (19.2%) |
| 3 Vehicles | 751 (50.2%) | 708 (42.8%) |
| 4 Vehicles | 193 (12.9%) | 193 (11.7%) |
| 5 or more Vehicles | 99 (6.6%) | 133 (8.0%) |
| Total | 1,497 (100.0%) | 1,655 (100.0%) |
Commute Time in Kemper County
The most frequently occuring commute durations in Kemper County are 30 to 34 minutes (546 commuters, 17.4%), 15 to 19 minutes (397 commuters, 12.7%), and 60 to 89 minutes (382 commuters, 12.2%).

| Commute Time | # Commuters | % Commuters |
| Less than 5 Minutes | 127 | 4.1% |
| 5 to 9 Minutes | 195 | 6.2% |
| 10 to 14 Minutes | 306 | 9.8% |
| 15 to 19 Minutes | 397 | 12.7% |
| 20 to 24 Minutes | 120 | 3.8% |
| 25 to 29 Minutes | 74 | 2.4% |
| 30 to 34 Minutes | 546 | 17.4% |
| 35 to 39 Minutes | 230 | 7.3% |
| 40 to 44 Minutes | 291 | 9.3% |
| 45 to 59 Minutes | 371 | 11.8% |
| 60 to 89 Minutes | 382 | 12.2% |
| 90 or more Minutes | 98 | 3.1% |
Commute Time by Sex in Kemper County
The most common commute times in Kemper County are 30 to 34 minutes (371 commuters, 25.5%) for males and 15 to 19 minutes (376 commuters, 22.3%) for females.
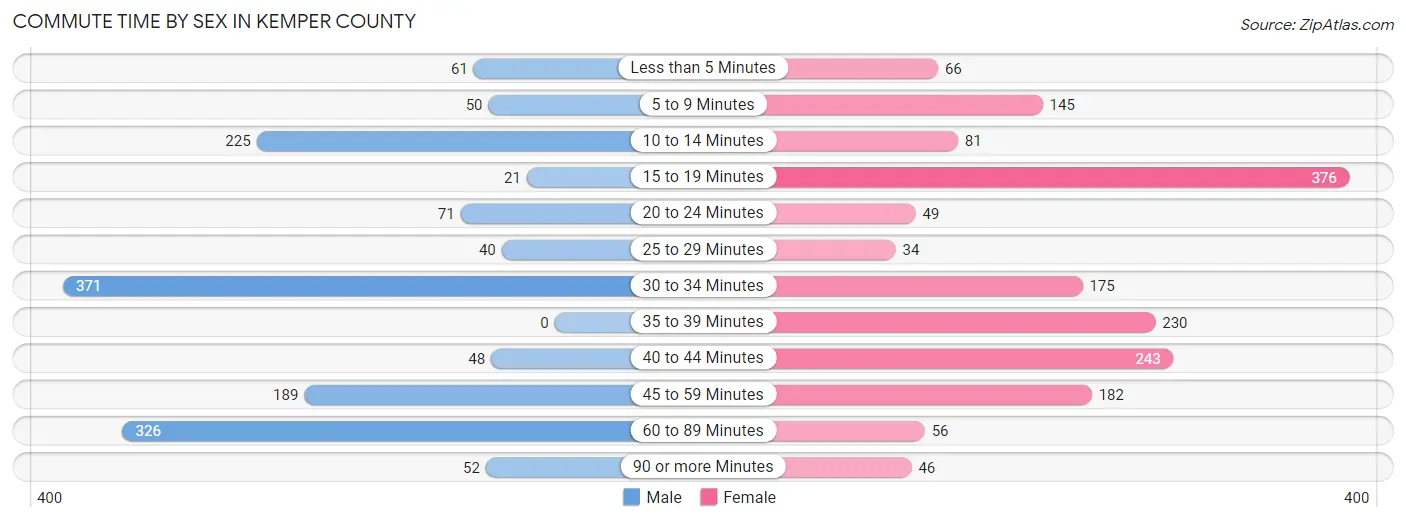
| Commute Time | Male | Female |
| Less than 5 Minutes | 61 (4.2%) | 66 (3.9%) |
| 5 to 9 Minutes | 50 (3.4%) | 145 (8.6%) |
| 10 to 14 Minutes | 225 (15.5%) | 81 (4.8%) |
| 15 to 19 Minutes | 21 (1.4%) | 376 (22.3%) |
| 20 to 24 Minutes | 71 (4.9%) | 49 (2.9%) |
| 25 to 29 Minutes | 40 (2.8%) | 34 (2.0%) |
| 30 to 34 Minutes | 371 (25.5%) | 175 (10.4%) |
| 35 to 39 Minutes | 0 (0.0%) | 230 (13.7%) |
| 40 to 44 Minutes | 48 (3.3%) | 243 (14.4%) |
| 45 to 59 Minutes | 189 (13.0%) | 182 (10.8%) |
| 60 to 89 Minutes | 326 (22.4%) | 56 (3.3%) |
| 90 or more Minutes | 52 (3.6%) | 46 (2.7%) |
Time of Departure to Work by Sex in Kemper County
The most frequent times of departure to work in Kemper County are 6:00 AM to 6:29 AM (404, 27.8%) for males and 7:00 AM to 7:29 AM (407, 24.2%) for females.

| Time of Departure | Male | Female |
| 12:00 AM to 4:59 AM | 197 (13.6%) | 218 (13.0%) |
| 5:00 AM to 5:29 AM | 94 (6.5%) | 115 (6.8%) |
| 5:30 AM to 5:59 AM | 51 (3.5%) | 18 (1.1%) |
| 6:00 AM to 6:29 AM | 404 (27.8%) | 107 (6.4%) |
| 6:30 AM to 6:59 AM | 139 (9.6%) | 279 (16.6%) |
| 7:00 AM to 7:29 AM | 161 (11.1%) | 407 (24.2%) |
| 7:30 AM to 7:59 AM | 150 (10.3%) | 199 (11.8%) |
| 8:00 AM to 8:29 AM | 3 (0.2%) | 15 (0.9%) |
| 8:30 AM to 8:59 AM | 0 (0.0%) | 34 (2.0%) |
| 9:00 AM to 9:59 AM | 0 (0.0%) | 81 (4.8%) |
| 10:00 AM to 10:59 AM | 6 (0.4%) | 43 (2.5%) |
| 11:00 AM to 11:59 AM | 5 (0.3%) | 0 (0.0%) |
| 12:00 PM to 3:59 PM | 93 (6.4%) | 128 (7.6%) |
| 4:00 PM to 11:59 PM | 151 (10.4%) | 39 (2.3%) |
| Total | 1,454 (100.0%) | 1,683 (100.0%) |
Housing Occupancy in Kemper County
Occupancy by Ownership in Kemper County
Of the total 3,143 dwellings in Kemper County, owner-occupied units account for 2,413 (76.8%), while renter-occupied units make up 730 (23.2%).

| Occupancy | # Housing Units | % Housing Units |
| Owner Occupied Housing Units | 2,413 | 76.8% |
| Renter-Occupied Housing Units | 730 | 23.2% |
| Total Occupied Housing Units | 3,143 | 100.0% |
Occupancy by Household Size in Kemper County

| Household Size | # Housing Units | % Housing Units |
| 1-Person Household | 911 | 29.0% |
| 2-Person Household | 1,038 | 33.0% |
| 3-Person Household | 718 | 22.8% |
| 4+ Person Household | 476 | 15.1% |
| Total Housing Units | 3,143 | 100.0% |
Occupancy by Ownership by Household Size in Kemper County
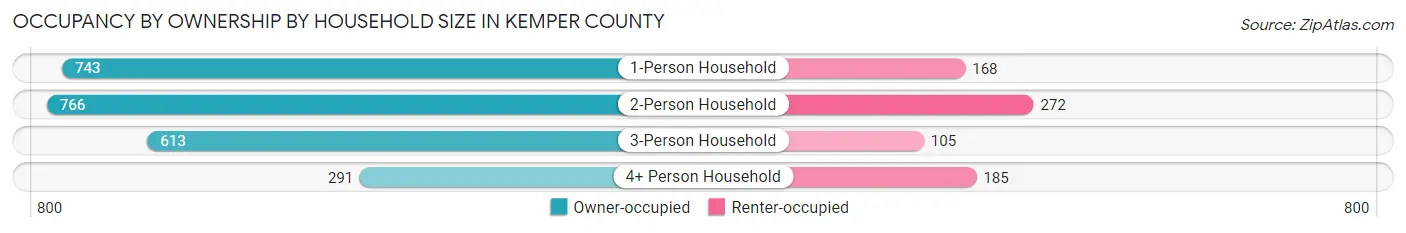
| Household Size | Owner-occupied | Renter-occupied |
| 1-Person Household | 743 (81.6%) | 168 (18.4%) |
| 2-Person Household | 766 (73.8%) | 272 (26.2%) |
| 3-Person Household | 613 (85.4%) | 105 (14.6%) |
| 4+ Person Household | 291 (61.1%) | 185 (38.9%) |
| Total Housing Units | 2,413 (76.8%) | 730 (23.2%) |
Occupancy by Educational Attainment in Kemper County

| Household Size | Owner-occupied | Renter-occupied |
| Less than High School | 362 (58.6%) | 256 (41.4%) |
| High School Diploma | 750 (92.2%) | 63 (7.7%) |
| College/Associate Degree | 845 (72.2%) | 326 (27.8%) |
| Bachelor's Degree or higher | 456 (84.3%) | 85 (15.7%) |
Occupancy by Age of Householder in Kemper County
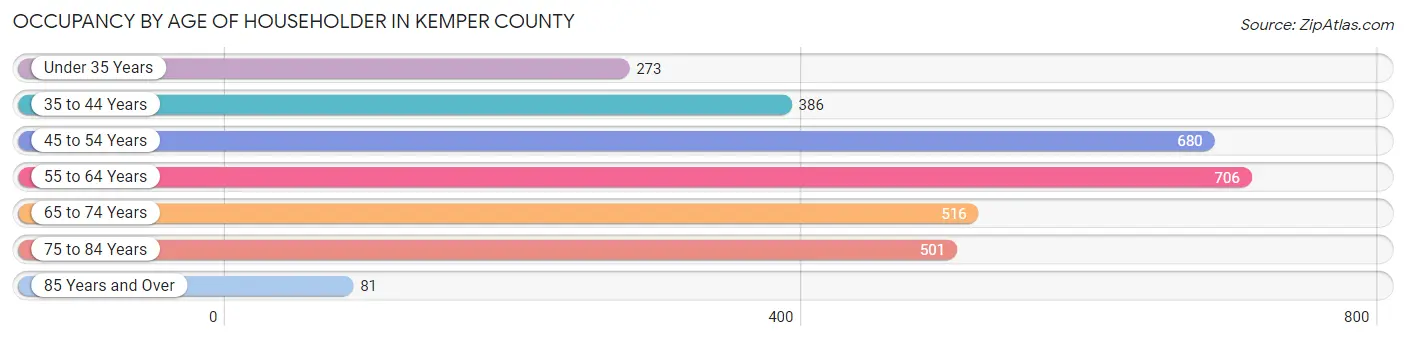
| Age Bracket | # Households | % Households |
| Under 35 Years | 273 | 8.7% |
| 35 to 44 Years | 386 | 12.3% |
| 45 to 54 Years | 680 | 21.6% |
| 55 to 64 Years | 706 | 22.5% |
| 65 to 74 Years | 516 | 16.4% |
| 75 to 84 Years | 501 | 15.9% |
| 85 Years and Over | 81 | 2.6% |
| Total | 3,143 | 100.0% |
Housing Finances in Kemper County
Median Income by Occupancy in Kemper County
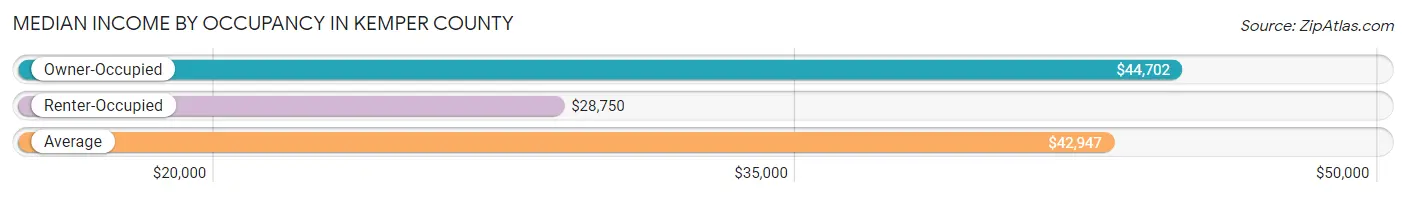
| Occupancy Type | # Households | Median Income |
| Owner-Occupied | 2,413 (76.8%) | $44,702 |
| Renter-Occupied | 730 (23.2%) | $28,750 |
| Average | 3,143 (100.0%) | $42,947 |
Occupancy by Householder Income Bracket in Kemper County

| Income Bracket | Owner-occupied | Renter-occupied |
| Less than $5,000 | 91 (3.8%) | 94 (12.9%) |
| $5,000 to $9,999 | 54 (2.2%) | 131 (17.9%) |
| $10,000 to $14,999 | 146 (6.0%) | 43 (5.9%) |
| $15,000 to $19,999 | 73 (3.0%) | 73 (10.0%) |
| $20,000 to $24,999 | 326 (13.5%) | 11 (1.5%) |
| $25,000 to $34,999 | 170 (7.0%) | 42 (5.8%) |
| $35,000 to $49,999 | 537 (22.3%) | 125 (17.1%) |
| $50,000 to $74,999 | 451 (18.7%) | 61 (8.4%) |
| $75,000 to $99,999 | 244 (10.1%) | 37 (5.1%) |
| $100,000 to $149,999 | 99 (4.1%) | 92 (12.6%) |
| $150,000 or more | 222 (9.2%) | 21 (2.9%) |
| Total | 2,413 (100.0%) | 730 (100.0%) |
Monthly Housing Cost Tiers in Kemper County

| Monthly Cost | Owner-occupied | Renter-occupied |
| Less than $300 | 454 (18.8%) | 124 (17.0%) |
| $300 to $499 | 614 (25.5%) | 135 (18.5%) |
| $500 to $799 | 606 (25.1%) | 142 (19.5%) |
| $800 to $999 | 285 (11.8%) | 60 (8.2%) |
| $1,000 to $1,499 | 258 (10.7%) | 36 (4.9%) |
| $1,500 to $1,999 | 52 (2.1%) | 0 (0.0%) |
| $2,000 to $2,499 | 79 (3.3%) | 0 (0.0%) |
| $2,500 to $2,999 | 65 (2.7%) | 0 (0.0%) |
| $3,000 or more | 0 (0.0%) | 0 (0.0%) |
| Total | 2,413 (100.0%) | 730 (100.0%) |
Physical Housing Characteristics in Kemper County
Housing Structures in Kemper County

| Structure Type | # Housing Units | % Housing Units |
| Single Unit, Detached | 2,260 | 71.9% |
| Single Unit, Attached | 30 | 0.9% |
| 2 Unit Apartments | 4 | 0.1% |
| 3 or 4 Unit Apartments | 134 | 4.3% |
| 5 to 9 Unit Apartments | 80 | 2.5% |
| 10 or more Apartments | 61 | 1.9% |
| Mobile Home / Other | 574 | 18.3% |
| Total | 3,143 | 100.0% |
Housing Structures by Occupancy in Kemper County

| Structure Type | Owner-occupied | Renter-occupied |
| Single Unit, Detached | 1,961 (86.8%) | 299 (13.2%) |
| Single Unit, Attached | 30 (100.0%) | 0 (0.0%) |
| 2 Unit Apartments | 0 (0.0%) | 4 (100.0%) |
| 3 or 4 Unit Apartments | 0 (0.0%) | 134 (100.0%) |
| 5 to 9 Unit Apartments | 0 (0.0%) | 80 (100.0%) |
| 10 or more Apartments | 0 (0.0%) | 61 (100.0%) |
| Mobile Home / Other | 422 (73.5%) | 152 (26.5%) |
| Total | 2,413 (76.8%) | 730 (23.2%) |
Housing Structures by Number of Rooms in Kemper County

| Number of Rooms | Owner-occupied | Renter-occupied |
| 1 Room | 0 (0.0%) | 64 (8.8%) |
| 2 or 3 Rooms | 146 (6.0%) | 56 (7.7%) |
| 4 or 5 Rooms | 1,065 (44.1%) | 440 (60.3%) |
| 6 or 7 Rooms | 944 (39.1%) | 154 (21.1%) |
| 8 or more Rooms | 258 (10.7%) | 16 (2.2%) |
| Total | 2,413 (100.0%) | 730 (100.0%) |
Housing Structure by Heating Type in Kemper County
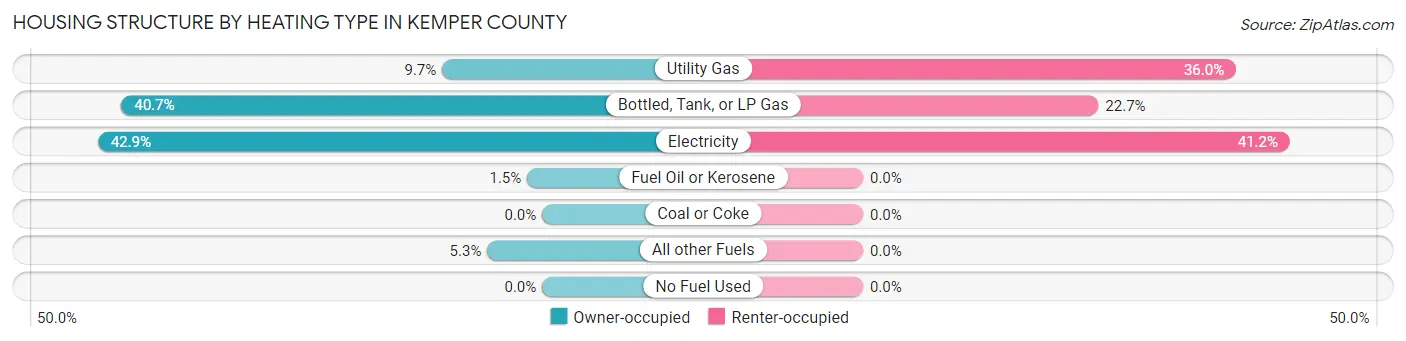
| Heating Type | Owner-occupied | Renter-occupied |
| Utility Gas | 233 (9.7%) | 263 (36.0%) |
| Bottled, Tank, or LP Gas | 981 (40.6%) | 166 (22.7%) |
| Electricity | 1,036 (42.9%) | 301 (41.2%) |
| Fuel Oil or Kerosene | 35 (1.5%) | 0 (0.0%) |
| Coal or Coke | 0 (0.0%) | 0 (0.0%) |
| All other Fuels | 128 (5.3%) | 0 (0.0%) |
| No Fuel Used | 0 (0.0%) | 0 (0.0%) |
| Total | 2,413 (100.0%) | 730 (100.0%) |
Household Vehicle Usage in Kemper County
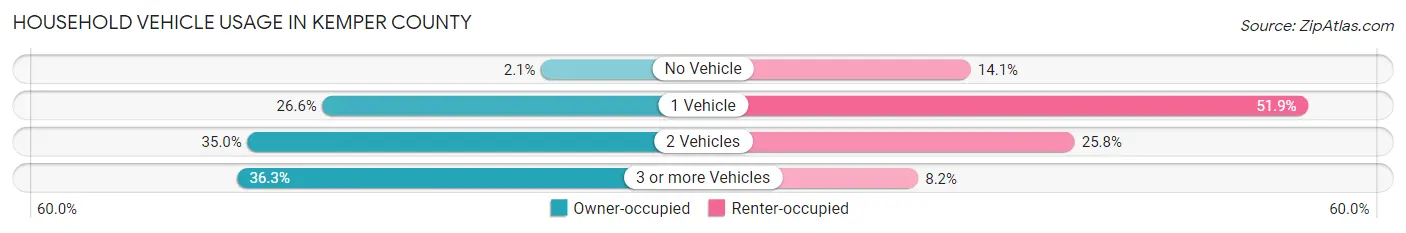
| Vehicles per Household | Owner-occupied | Renter-occupied |
| No Vehicle | 51 (2.1%) | 103 (14.1%) |
| 1 Vehicle | 642 (26.6%) | 379 (51.9%) |
| 2 Vehicles | 845 (35.0%) | 188 (25.8%) |
| 3 or more Vehicles | 875 (36.3%) | 60 (8.2%) |
| Total | 2,413 (100.0%) | 730 (100.0%) |
Real Estate & Mortgages in Kemper County
Real Estate and Mortgage Overview in Kemper County
| Characteristic | Without Mortgage | With Mortgage |
| Housing Units | 1,565 | 848 |
| Median Property Value | $82,700 | $107,600 |
| Median Household Income | $39,408 | $88 |
| Monthly Housing Costs | $439 | $0 |
| Real Estate Taxes | $462 | $306 |
Property Value by Mortgage Status in Kemper County

| Property Value | Without Mortgage | With Mortgage |
| Less than $50,000 | 383 (24.5%) | 85 (10.0%) |
| $50,000 to $99,999 | 705 (45.1%) | 295 (34.8%) |
| $100,000 to $299,999 | 386 (24.7%) | 433 (51.1%) |
| $300,000 to $499,999 | 28 (1.8%) | 29 (3.4%) |
| $500,000 to $749,999 | 63 (4.0%) | 0 (0.0%) |
| $750,000 to $999,999 | 0 (0.0%) | 6 (0.7%) |
| $1,000,000 or more | 0 (0.0%) | 0 (0.0%) |
| Total | 1,565 (100.0%) | 848 (100.0%) |
Household Income by Mortgage Status in Kemper County

| Household Income | Without Mortgage | With Mortgage |
| Less than $10,000 | 127 (8.1%) | 0 (0.0%) |
| $10,000 to $24,999 | 482 (30.8%) | 18 (2.1%) |
| $25,000 to $34,999 | 134 (8.6%) | 63 (7.4%) |
| $35,000 to $49,999 | 302 (19.3%) | 36 (4.3%) |
| $50,000 to $74,999 | 185 (11.8%) | 235 (27.7%) |
| $75,000 to $99,999 | 143 (9.1%) | 266 (31.4%) |
| $100,000 to $149,999 | 58 (3.7%) | 101 (11.9%) |
| $150,000 or more | 134 (8.6%) | 41 (4.8%) |
| Total | 1,565 (100.0%) | 848 (100.0%) |
Property Value to Household Income Ratio in Kemper County

| Value-to-Income Ratio | Without Mortgage | With Mortgage |
| Less than 2.0x | 921 (58.9%) | 52,466 (6,187.0%) |
| 2.0x to 2.9x | 133 (8.5%) | 482 (56.8%) |
| 3.0x to 3.9x | 128 (8.2%) | 238 (28.1%) |
| 4.0x or more | 335 (21.4%) | 22 (2.6%) |
| Total | 1,565 (100.0%) | 848 (100.0%) |
Real Estate Taxes by Mortgage Status in Kemper County

| Property Taxes | Without Mortgage | With Mortgage |
| Less than $800 | 658 (42.0%) | 0 (0.0%) |
| $800 to $1,499 | 127 (8.1%) | 254 (29.9%) |
| $800 to $1,499 | 70 (4.5%) | 178 (21.0%) |
| Total | 1,565 (100.0%) | 848 (100.0%) |
Health & Disability in Kemper County
Health Insurance Coverage by Age in Kemper County

| Age Bracket | With Coverage | Without Coverage |
| Under 6 Years | 385 (68.6%) | 176 (31.4%) |
| 6 to 18 Years | 1,168 (93.7%) | 79 (6.3%) |
| 19 to 25 Years | 1,036 (86.1%) | 167 (13.9%) |
| 26 to 34 Years | 414 (51.4%) | 391 (48.6%) |
| 35 to 44 Years | 580 (77.0%) | 173 (23.0%) |
| 45 to 54 Years | 861 (81.5%) | 195 (18.5%) |
| 55 to 64 Years | 1,003 (92.7%) | 79 (7.3%) |
| 65 to 74 Years | 957 (100.0%) | 0 (0.0%) |
| 75 Years and older | 847 (100.0%) | 0 (0.0%) |
| Total | 7,251 (85.2%) | 1,260 (14.8%) |
Health Insurance Coverage by Citizenship Status in Kemper County
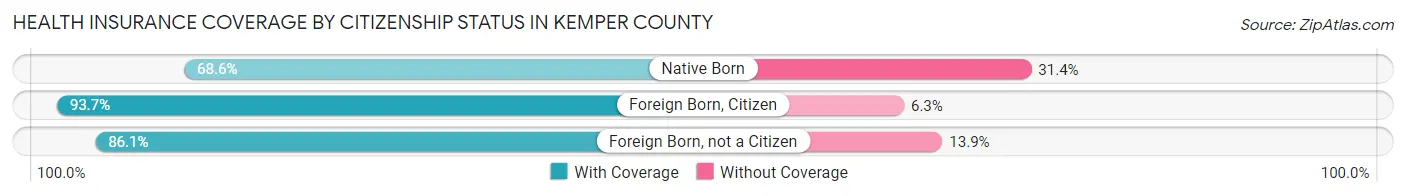
| Citizenship Status | With Coverage | Without Coverage |
| Native Born | 385 (68.6%) | 176 (31.4%) |
| Foreign Born, Citizen | 1,168 (93.7%) | 79 (6.3%) |
| Foreign Born, not a Citizen | 1,036 (86.1%) | 167 (13.9%) |
Health Insurance Coverage by Household Income in Kemper County

| Household Income | With Coverage | Without Coverage |
| Under $25,000 | 1,610 (83.9%) | 308 (16.1%) |
| $25,000 to $49,999 | 1,576 (77.7%) | 452 (22.3%) |
| $50,000 to $74,999 | 1,363 (81.3%) | 313 (18.7%) |
| $75,000 to $99,999 | 965 (96.4%) | 36 (3.6%) |
| $100,000 and over | 1,319 (93.9%) | 86 (6.1%) |
Public vs Private Health Insurance Coverage by Age in Kemper County

| Age Bracket | Public Insurance | Private Insurance |
| Under 6 | 336 (59.9%) | 49 (8.7%) |
| 6 to 18 Years | 781 (62.6%) | 645 (51.7%) |
| 19 to 25 Years | 245 (20.4%) | 796 (66.2%) |
| 25 to 34 Years | 97 (12.0%) | 317 (39.4%) |
| 35 to 44 Years | 155 (20.6%) | 552 (73.3%) |
| 45 to 54 Years | 242 (22.9%) | 660 (62.5%) |
| 55 to 64 Years | 244 (22.6%) | 799 (73.8%) |
| 65 to 74 Years | 931 (97.3%) | 608 (63.5%) |
| 75 Years and over | 847 (100.0%) | 566 (66.8%) |
| Total | 3,878 (45.6%) | 4,992 (58.7%) |
Disability Status by Sex by Age in Kemper County

| Age Bracket | Male | Female |
| Under 5 Years | 0 (0.0%) | 0 (0.0%) |
| 5 to 17 Years | 34 (6.1%) | 46 (8.0%) |
| 18 to 34 Years | 50 (5.1%) | 18 (1.5%) |
| 35 to 64 Years | 263 (18.5%) | 397 (27.0%) |
| 65 to 74 Years | 241 (53.8%) | 105 (20.6%) |
| 75 Years and over | 318 (85.0%) | 363 (76.7%) |
Disability Class by Sex by Age in Kemper County
Disability Class: Hearing Difficulty

| Age Bracket | Male | Female |
| Under 5 Years | 0 (0.0%) | 0 (0.0%) |
| 5 to 17 Years | 23 (4.1%) | 0 (0.0%) |
| 18 to 34 Years | 0 (0.0%) | 12 (1.0%) |
| 35 to 64 Years | 90 (6.3%) | 192 (13.1%) |
| 65 to 74 Years | 129 (28.8%) | 18 (3.5%) |
| 75 Years and over | 259 (69.3%) | 311 (65.7%) |
Disability Class: Vision Difficulty
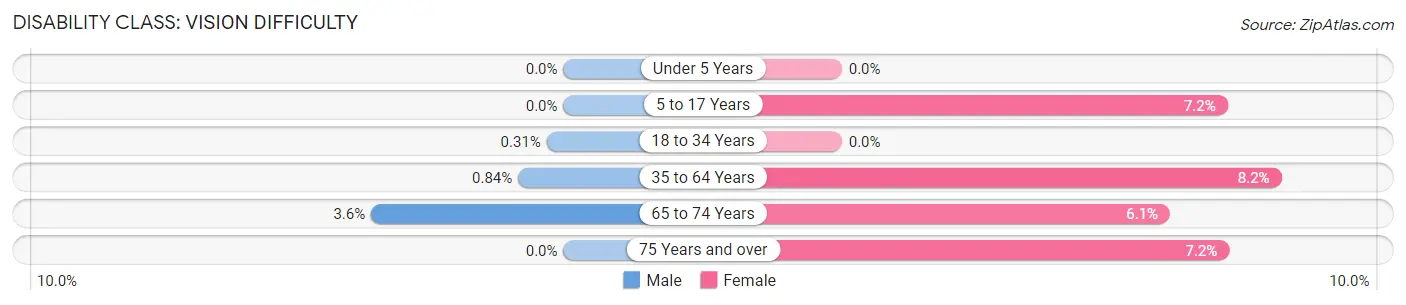
| Age Bracket | Male | Female |
| Under 5 Years | 0 (0.0%) | 0 (0.0%) |
| 5 to 17 Years | 0 (0.0%) | 41 (7.2%) |
| 18 to 34 Years | 3 (0.3%) | 0 (0.0%) |
| 35 to 64 Years | 12 (0.8%) | 120 (8.2%) |
| 65 to 74 Years | 16 (3.6%) | 31 (6.1%) |
| 75 Years and over | 0 (0.0%) | 34 (7.2%) |
Disability Class: Cognitive Difficulty

| Age Bracket | Male | Female |
| 5 to 17 Years | 11 (2.0%) | 46 (8.0%) |
| 18 to 34 Years | 41 (4.2%) | 12 (1.0%) |
| 35 to 64 Years | 47 (3.3%) | 80 (5.4%) |
| 65 to 74 Years | 22 (4.9%) | 22 (4.3%) |
| 75 Years and over | 111 (29.7%) | 46 (9.7%) |
Disability Class: Ambulatory Difficulty

| Age Bracket | Male | Female |
| 5 to 17 Years | 0 (0.0%) | 41 (7.2%) |
| 18 to 34 Years | 0 (0.0%) | 6 (0.5%) |
| 35 to 64 Years | 112 (7.9%) | 195 (13.3%) |
| 65 to 74 Years | 124 (27.7%) | 75 (14.7%) |
| 75 Years and over | 117 (31.3%) | 140 (29.6%) |
Disability Class: Self-Care Difficulty

| Age Bracket | Male | Female |
| 5 to 17 Years | 0 (0.0%) | 0 (0.0%) |
| 18 to 34 Years | 0 (0.0%) | 0 (0.0%) |
| 35 to 64 Years | 73 (5.1%) | 1 (0.1%) |
| 65 to 74 Years | 52 (11.6%) | 4 (0.8%) |
| 75 Years and over | 20 (5.3%) | 27 (5.7%) |
Technology Access in Kemper County
Computing Device Access in Kemper County

| Device Type | # Households | % Households |
| Desktop or Laptop | 1,674 | 53.3% |
| Smartphone | 2,460 | 78.3% |
| Tablet | 1,360 | 43.3% |
| No Computing Device | 473 | 15.0% |
| Total | 3,143 | 100.0% |
Internet Access in Kemper County
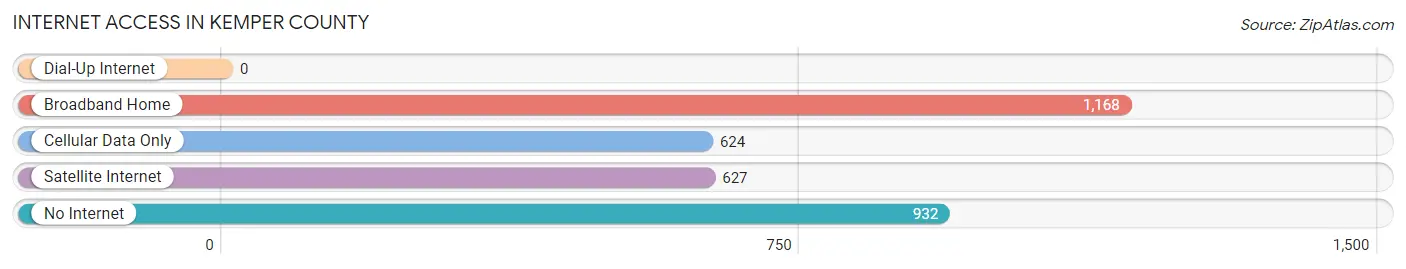
| Internet Type | # Households | % Households |
| Dial-Up Internet | 0 | 0.0% |
| Broadband Home | 1,168 | 37.2% |
| Cellular Data Only | 624 | 19.9% |
| Satellite Internet | 627 | 20.0% |
| No Internet | 932 | 29.6% |
| Total | 3,143 | 100.0% |
Kemper County Summary
Kemper County is located in the east-central part of Mississippi, in the United States. It is bordered by Noxubee County to the north, Winston County to the east, Lauderdale County to the south, and Clarke County to the west. The county seat is DeKalb. The county was created in 1833 and named for Reuben Kemper, a hero of the Battle of New Orleans.
Geography
Kemper County covers an area of 576 square miles, of which 574 square miles is land and 2 square miles is water. The terrain is mostly flat, with some rolling hills in the northern part of the county. The Noxubee River flows through the county, and there are several small creeks and streams. The county is mostly covered in pine and hardwood forests, with some agricultural land in the south.
Demographics
As of the 2010 census, the population of Kemper County was 10,456. The racial makeup of the county was 68.3% African American, 30.2% White, 0.3% Native American, 0.2% Asian, 0.1% Pacific Islander, and 0.9% from other races. The median household income was $25,945, and the median family income was $32,917.
Economy
Kemper County is primarily an agricultural county, with the main crops being cotton, corn, soybeans, and wheat. The county also has a large timber industry, with several sawmills and wood-processing plants. The county is also home to several manufacturing plants, including a paper mill and a furniture factory.
The county is served by the Mississippi Central Railroad, which runs through the county from east to west. The county also has several state highways, including Mississippi Highway 16, Mississippi Highway 39, and Mississippi Highway 492.
History
Kemper County was created in 1833 from parts of Noxubee and Lauderdale counties. It was named for Reuben Kemper, a hero of the Battle of New Orleans. The county seat was originally located in DeKalb, but was moved to DeKalb in 1837.
The county was largely agricultural in the 19th century, with cotton being the main crop. The county was also home to several sawmills and wood-processing plants.
In the early 20th century, the county was hit hard by the Great Depression, and many of the sawmills and wood-processing plants closed. The county was also hit hard by the boll weevil infestation of the 1920s and 1930s, which destroyed much of the cotton crop.
In the late 20th century, the county began to diversify its economy, with the opening of several manufacturing plants. The county also began to attract new businesses, such as a paper mill and a furniture factory.
Today, Kemper County is a largely rural county, with a diversified economy. The county is home to several sawmills and wood-processing plants, as well as several manufacturing plants. The county is also home to several state parks, including Noxubee National Wildlife Refuge and Tombigbee National Forest.
Common Questions
What is the Total Population of Kemper County?
Total Population of Kemper County is 8,980.
What is the Total Male Population of Kemper County?
Total Male Population of Kemper County is 4,614.
What is the Total Female Population of Kemper County?
Total Female Population of Kemper County is 4,366.
What is the Ratio of Males per 100 Females in Kemper County?
There are 105.68 Males per 100 Females in Kemper County.
What is the Ratio of Females per 100 Males in Kemper County?
There are 94.63 Females per 100 Males in Kemper County.
What is the Median Population Age in Kemper County?
Median Population Age in Kemper County is 39.7 Years.
What is the Average Family Size in Kemper County
Average Family Size in Kemper County is 3.1 People.
What is the Average Household Size in Kemper County
Average Household Size in Kemper County is 2.5 People.
What is Per Capita Income in Kemper County?
Per Capita income in Kemper County is $22,046.
What is the Median Family Income in Kemper County?
Median Family Income in Kemper County is $51,650.
What is the Median Household income in Kemper County?
Median Household Income in Kemper County is $42,947.
What is Income or Wage Gap in Kemper County?
Income or Wage Gap in Kemper County is 23.3%.
Women in Kemper County earn 76.7 cents for every dollar earned by a man.
What is Inequality or Gini Index in Kemper County?
Inequality or Gini Index in Kemper County is 0.46.
How Large is the Labor Force in Kemper County?
There are 3,826 People in the Labor Forcein in Kemper County.
What is the Percentage of People in the Labor Force in Kemper County?
50.7% of People are in the Labor Force in Kemper County.
What is the Unemployment Rate in Kemper County?
Unemployment Rate in Kemper County is 14.1%.