Jefferson Davis County, MS
Jefferson Davis County Overview
11,291
TOTAL POPULATION
5,386
MALE POPULATION
5,905
FEMALE POPULATION
91.21
MALES / 100 FEMALES
109.64
FEMALES / 100 MALES
44.5
MEDIAN AGE
3.2
AVG FAMILY SIZE
2.5
AVG HOUSEHOLD SIZE
$22,693
PER CAPITA INCOME
$55,145
AVG FAMILY INCOME
$36,473
AVG HOUSEHOLD INCOME
3.4%
WAGE / INCOME GAP [ % ]
96.6¢/ $1
WAGE / INCOME GAP [ $ ]
$11,952
FAMILY INCOME DEFICIT
0.46
INEQUALITY / GINI INDEX
4,953
LABOR FORCE [ PEOPLE ]
53.4%
PERCENT IN LABOR FORCE
9.2%
UNEMPLOYMENT RATE
Jefferson Davis County Area Codes
Race in Jefferson Davis County
The most populous races in Jefferson Davis County are Black / African American (6,889 | 61.0%), White / Caucasian (4,257 | 37.7%), and Two or more Races (134 | 1.2%).

| Race | # Population | % Population |
| Asian | 11 | 0.1% |
| Black / African American | 6,889 | 61.0% |
| Hawaiian / Pacific | 0 | 0.0% |
| Hispanic or Latino | 22 | 0.2% |
| Native / Alaskan | 0 | 0.0% |
| White / Caucasian | 4,257 | 37.7% |
| Two or more Races | 134 | 1.2% |
| Some other Race | 0 | 0.0% |
| Total | 11,291 | 100.0% |
Ancestry in Jefferson Davis County
The most populous ancestries reported in Jefferson Davis County are American (767 | 6.8%), English (548 | 4.9%), Irish (544 | 4.8%), Scotch-Irish (251 | 2.2%), and German (164 | 1.5%), together accounting for 20.1% of all Jefferson Davis County residents.

| Ancestry | # Population | % Population |
| African | 111 | 1.0% |
| American | 767 | 6.8% |
| Arab | 32 | 0.3% |
| Bulgarian | 1 | 0.0% |
| Cherokee | 28 | 0.3% |
| Danish | 20 | 0.2% |
| English | 548 | 4.9% |
| European | 82 | 0.7% |
| French | 111 | 1.0% |
| French Canadian | 11 | 0.1% |
| German | 164 | 1.5% |
| Hungarian | 3 | 0.0% |
| Indian (Asian) | 11 | 0.1% |
| Irish | 544 | 4.8% |
| Italian | 94 | 0.8% |
| Mexican | 9 | 0.1% |
| Norwegian | 12 | 0.1% |
| Pennsylvania German | 2 | 0.0% |
| Scotch-Irish | 251 | 2.2% |
| Scottish | 40 | 0.4% |
| Subsaharan African | 111 | 1.0% |
| Swedish | 1 | 0.0% |
| Trinidadian and Tobagonian | 16 | 0.1% |
| Welsh | 7 | 0.1% | View All 24 Rows |
Immigrants in Jefferson Davis County
The most numerous immigrant groups reported in Jefferson Davis County came from Europe (28 | 0.3%), Germany (14 | 0.1%), Western Europe (14 | 0.1%), Italy (13 | 0.1%), and Southern Europe (13 | 0.1%), together accounting for 0.7% of all Jefferson Davis County residents.

| Immigration Origin | # Population | % Population |
| Asia | 11 | 0.1% |
| Bulgaria | 1 | 0.0% |
| China | 11 | 0.1% |
| Eastern Asia | 11 | 0.1% |
| Eastern Europe | 1 | 0.0% |
| Europe | 28 | 0.3% |
| Germany | 14 | 0.1% |
| Italy | 13 | 0.1% |
| Southern Europe | 13 | 0.1% |
| Western Europe | 14 | 0.1% | View All 10 Rows |
Sex and Age in Jefferson Davis County
Sex and Age in Jefferson Davis County
The most populous age groups in Jefferson Davis County are 60 to 64 Years (436 | 8.1%) for men and 35 to 39 Years (483 | 8.2%) for women.

| Age Bracket | Male | Female |
| Under 5 Years | 285 (5.3%) | 312 (5.3%) |
| 5 to 9 Years | 233 (4.3%) | 391 (6.6%) |
| 10 to 14 Years | 419 (7.8%) | 232 (3.9%) |
| 15 to 19 Years | 419 (7.8%) | 173 (2.9%) |
| 20 to 24 Years | 316 (5.9%) | 439 (7.4%) |
| 25 to 29 Years | 257 (4.8%) | 358 (6.1%) |
| 30 to 34 Years | 295 (5.5%) | 192 (3.3%) |
| 35 to 39 Years | 279 (5.2%) | 483 (8.2%) |
| 40 to 44 Years | 316 (5.9%) | 289 (4.9%) |
| 45 to 49 Years | 318 (5.9%) | 337 (5.7%) |
| 50 to 54 Years | 348 (6.5%) | 364 (6.2%) |
| 55 to 59 Years | 313 (5.8%) | 413 (7.0%) |
| 60 to 64 Years | 436 (8.1%) | 452 (7.6%) |
| 65 to 69 Years | 313 (5.8%) | 373 (6.3%) |
| 70 to 74 Years | 369 (6.9%) | 419 (7.1%) |
| 75 to 79 Years | 332 (6.2%) | 374 (6.3%) |
| 80 to 84 Years | 97 (1.8%) | 155 (2.6%) |
| 85 Years and over | 41 (0.8%) | 149 (2.5%) |
| Total | 5,386 (100.0%) | 5,905 (100.0%) |
Families and Households in Jefferson Davis County
Median Family Size in Jefferson Davis County
The median family size in Jefferson Davis County is 3.22 persons per family, with single male/father families (157 | 5.4%) accounting for the largest median family size of 3.25 persons per family. On the other hand, married-couple families (1,851 | 63.7%) represent the smallest median family size with 3.20 persons per family.

| Family Type | # Families | Family Size |
| Married-Couple | 1,851 (63.7%) | 3.20 |
| Single Male/Father | 157 (5.4%) | 3.25 |
| Single Female/Mother | 896 (30.8%) | 3.25 |
| Total Families | 2,904 (100.0%) | 3.22 |
Median Household Size in Jefferson Davis County
The median household size in Jefferson Davis County is 2.51 persons per household, with single male/father households (157 | 3.5%) accounting for the largest median household size of 3.43 persons per household. non-family households (1,549 | 34.8%) represent the smallest median household size with 1.09 persons per household.

| Household Type | # Households | Household Size |
| Married-Couple | 1,851 (41.6%) | 3.20 |
| Single Male/Father | 157 (3.5%) | 3.43 |
| Single Female/Mother | 896 (20.1%) | 3.35 |
| Non-family | 1,549 (34.8%) | 1.09 |
| Total Households | 4,453 (100.0%) | 2.51 |
Household Size by Marriage Status in Jefferson Davis County
Out of a total of 4,453 households in Jefferson Davis County, 2,904 (65.2%) are family households, while 1,549 (34.8%) are nonfamily households. The most numerous type of family households are 2-person households, comprising 1,627, and the most common type of nonfamily households are 1-person households, comprising 1,442.

| Household Size | Family Households | Nonfamily Households |
| 1-Person Households | - | 1,442 (32.4%) |
| 2-Person Households | 1,627 (36.5%) | 107 (2.4%) |
| 3-Person Households | 552 (12.4%) | 0 (0.0%) |
| 4-Person Households | 265 (5.9%) | 0 (0.0%) |
| 5-Person Households | 216 (4.9%) | 0 (0.0%) |
| 6-Person Households | 180 (4.0%) | 0 (0.0%) |
| 7+ Person Households | 64 (1.4%) | 0 (0.0%) |
| Total | 2,904 (65.2%) | 1,549 (34.8%) |
Female Fertility in Jefferson Davis County
Fertility by Age in Jefferson Davis County
Average fertility rate in Jefferson Davis County is 72.0 births per 1,000 women. Women in the age bracket of 20 to 34 years have the highest fertility rate with 140.0 births per 1,000 women. Women in the age bracket of 20 to 34 years acount for 83.1% of all women with births.
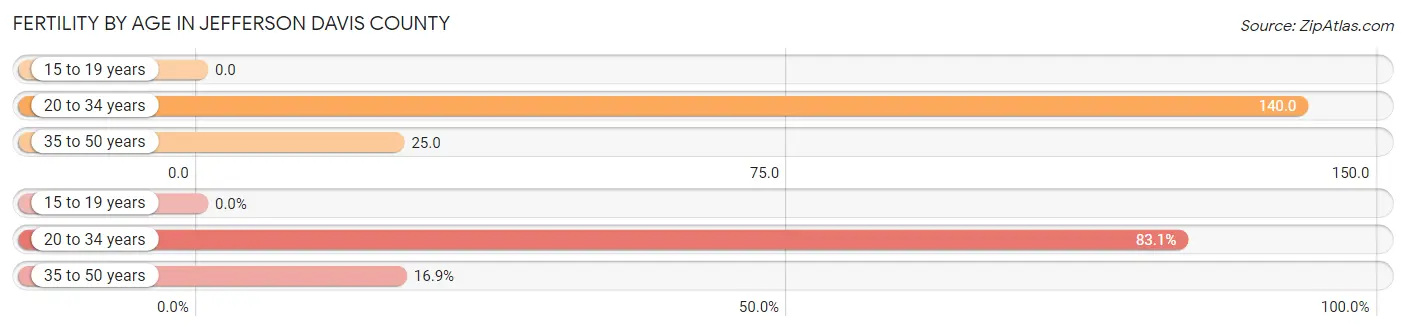
| Age Bracket | Women with Births | Births / 1,000 Women |
| 15 to 19 years | 0 (0.0%) | 0.0 |
| 20 to 34 years | 138 (83.1%) | 140.0 |
| 35 to 50 years | 28 (16.9%) | 25.0 |
| Total | 166 (100.0%) | 72.0 |
Fertility by Age by Marriage Status in Jefferson Davis County
40.4% of women with births (166) in Jefferson Davis County are married. The highest percentage of unmarried women with births falls into 20 to 34 years age bracket with 71.7% of them unmarried at the time of birth, while the lowest percentage of unmarried women with births belong to 35 to 50 years age bracket with 0.0% of them unmarried.

| Age Bracket | Married | Unmarried |
| 15 to 19 years | 0 (0.0%) | 0 (0.0%) |
| 20 to 34 years | 39 (28.3%) | 99 (71.7%) |
| 35 to 50 years | 28 (100.0%) | 0 (0.0%) |
| Total | 67 (40.4%) | 99 (59.6%) |
Fertility by Education in Jefferson Davis County

| Educational Attainment | Women with Births | Births / 1,000 Women |
| Less than High School | 0 (0.0%) | 0.0 |
| High School Diploma | 67 (40.4%) | 105.0 |
| College or Associate's Degree | 99 (59.6%) | 110.0 |
| Bachelor's Degree | 0 (0.0%) | 0.0 |
| Graduate Degree | 0 (0.0%) | 0.0 |
| Total | 166 (100.0%) | 72.0 |
Fertility by Education by Marriage Status in Jefferson Davis County
59.6% of women with births in Jefferson Davis County are unmarried. Women with the educational attainment of college or associate's degree are most likely to be married with 60.6% of them married at childbirth, while women with the educational attainment of high school diploma are least likely to be married with 89.5% of them unmarried at childbirth.
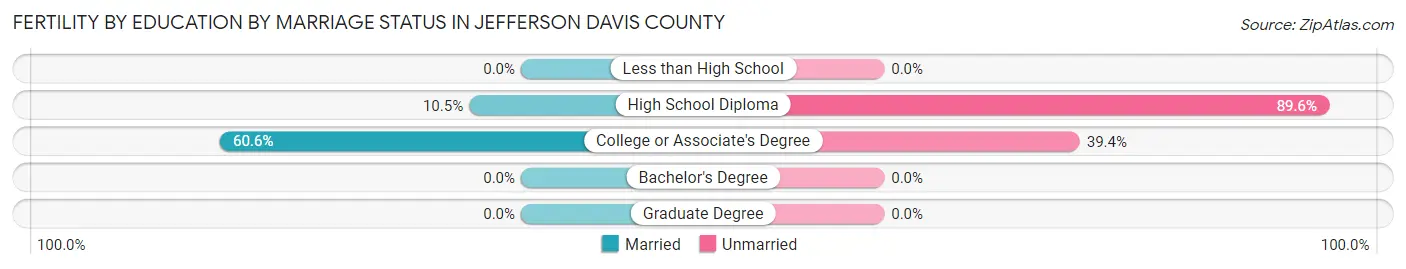
| Educational Attainment | Married | Unmarried |
| Less than High School | 0 (0.0%) | 0 (0.0%) |
| High School Diploma | 7 (10.4%) | 60 (89.5%) |
| College or Associate's Degree | 60 (60.6%) | 39 (39.4%) |
| Bachelor's Degree | 0 (0.0%) | 0 (0.0%) |
| Graduate Degree | 0 (0.0%) | 0 (0.0%) |
| Total | 67 (40.4%) | 99 (59.6%) |
Income in Jefferson Davis County
Income Overview in Jefferson Davis County
Per Capita Income in Jefferson Davis County is $22,693, while median incomes of families and households are $55,145 and $36,473 respectively.
| Characteristic | Number | Measure |
| Per Capita Income | 11,291 | $22,693 |
| Median Family Income | 2,904 | $55,145 |
| Mean Family Income | 2,904 | $64,893 |
| Median Household Income | 4,453 | $36,473 |
| Mean Household Income | 4,453 | $54,515 |
| Income Deficit | 2,904 | $11,952 |
| Wage / Income Gap (%) | 11,291 | 3.40% |
| Wage / Income Gap ($) | 11,291 | 96.60¢ per $1 |
| Gini / Inequality Index | 11,291 | 0.46 |
Earnings by Sex in Jefferson Davis County
Average Earnings in Jefferson Davis County are $25,802, $26,042 for men and $25,156 for women, a difference of 3.4%.

| Sex | Number | Average Earnings |
| Male | 2,250 (46.3%) | $26,042 |
| Female | 2,613 (53.7%) | $25,156 |
| Total | 4,863 (100.0%) | $25,802 |
Earnings by Sex by Income Bracket in Jefferson Davis County
The most common earnings brackets in Jefferson Davis County are $25,000 to $29,999 for men (275 | 12.2%) and $2,499 or less for women (322 | 12.3%).

| Income | Male | Female |
| $2,499 or less | 162 (7.2%) | 322 (12.3%) |
| $2,500 to $4,999 | 68 (3.0%) | 28 (1.1%) |
| $5,000 to $7,499 | 44 (2.0%) | 23 (0.9%) |
| $7,500 to $9,999 | 42 (1.9%) | 81 (3.1%) |
| $10,000 to $12,499 | 94 (4.2%) | 208 (8.0%) |
| $12,500 to $14,999 | 44 (2.0%) | 40 (1.5%) |
| $15,000 to $17,499 | 225 (10.0%) | 152 (5.8%) |
| $17,500 to $19,999 | 136 (6.0%) | 137 (5.2%) |
| $20,000 to $22,499 | 55 (2.4%) | 125 (4.8%) |
| $22,500 to $24,999 | 210 (9.3%) | 188 (7.2%) |
| $25,000 to $29,999 | 275 (12.2%) | 155 (5.9%) |
| $30,000 to $34,999 | 127 (5.6%) | 164 (6.3%) |
| $35,000 to $39,999 | 78 (3.5%) | 116 (4.4%) |
| $40,000 to $44,999 | 60 (2.7%) | 187 (7.2%) |
| $45,000 to $49,999 | 37 (1.6%) | 111 (4.3%) |
| $50,000 to $54,999 | 58 (2.6%) | 92 (3.5%) |
| $55,000 to $64,999 | 76 (3.4%) | 82 (3.1%) |
| $65,000 to $74,999 | 169 (7.5%) | 140 (5.4%) |
| $75,000 to $99,999 | 154 (6.8%) | 207 (7.9%) |
| $100,000+ | 136 (6.0%) | 55 (2.1%) |
| Total | 2,250 (100.0%) | 2,613 (100.0%) |
Earnings by Sex by Educational Attainment in Jefferson Davis County
Average earnings in Jefferson Davis County are $28,416 for men and $30,274 for women, a difference of 6.1%. Men with an educational attainment of graduate degree enjoy the highest average annual earnings of $73,000, while those with college or associate's degree education earn the least with $24,527. Women with an educational attainment of graduate degree earn the most with the average annual earnings of $57,885, while those with high school diploma education have the smallest earnings of $23,347.

| Educational Attainment | Male Income | Female Income |
| Less than High School | $25,735 | $0 |
| High School Diploma | $28,097 | $23,347 |
| College or Associate's Degree | $24,527 | $27,558 |
| Bachelor's Degree | $63,958 | $0 |
| Graduate Degree | $73,000 | $57,885 |
| Total | $28,416 | $30,274 |
Family Income in Jefferson Davis County
Family Income Brackets in Jefferson Davis County
According to the Jefferson Davis County family income data, there are 511 families falling into the $100,000 to $149,999 income range, which is the most common income bracket and makes up 17.6% of all families. Conversely, the $200,000+ income bracket is the least frequent group with only 35 families (1.2%) belonging to this category.
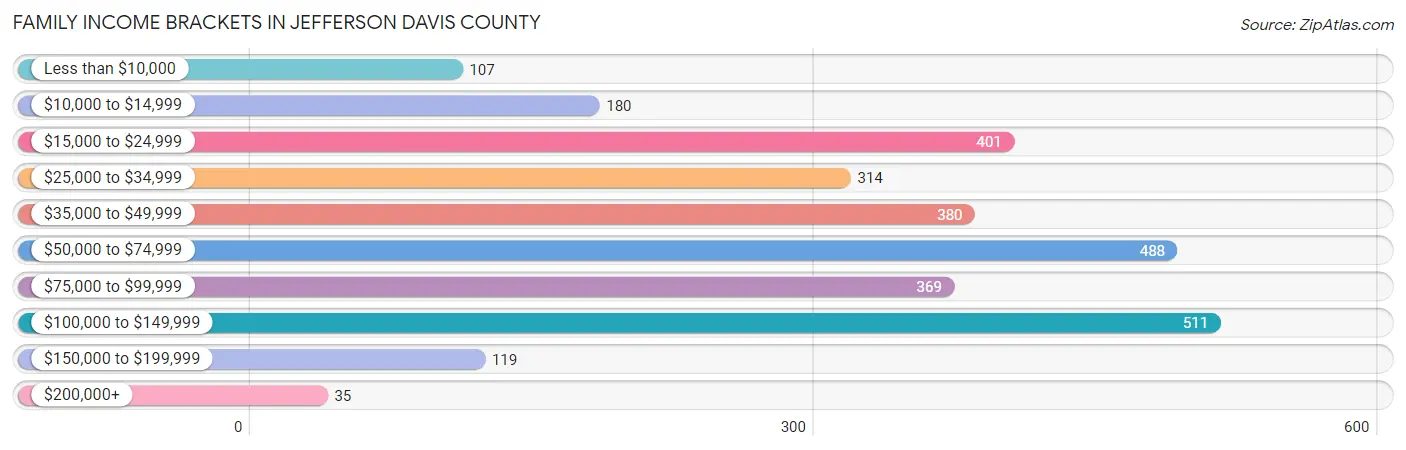
| Income Bracket | # Families | % Families |
| Less than $10,000 | 107 | 3.7% |
| $10,000 to $14,999 | 180 | 6.2% |
| $15,000 to $24,999 | 401 | 13.8% |
| $25,000 to $34,999 | 314 | 10.8% |
| $35,000 to $49,999 | 380 | 13.1% |
| $50,000 to $74,999 | 488 | 16.8% |
| $75,000 to $99,999 | 369 | 12.7% |
| $100,000 to $149,999 | 511 | 17.6% |
| $150,000 to $199,999 | 119 | 4.1% |
| $200,000+ | 35 | 1.2% |
Family Income by Famaliy Size in Jefferson Davis County
7+ person families (59 | 2.0%) account for the highest median family income in Jefferson Davis County with $116,140 per family, while 2-person families (1,664 | 57.3%) have the highest median income of $24,889 per family member.
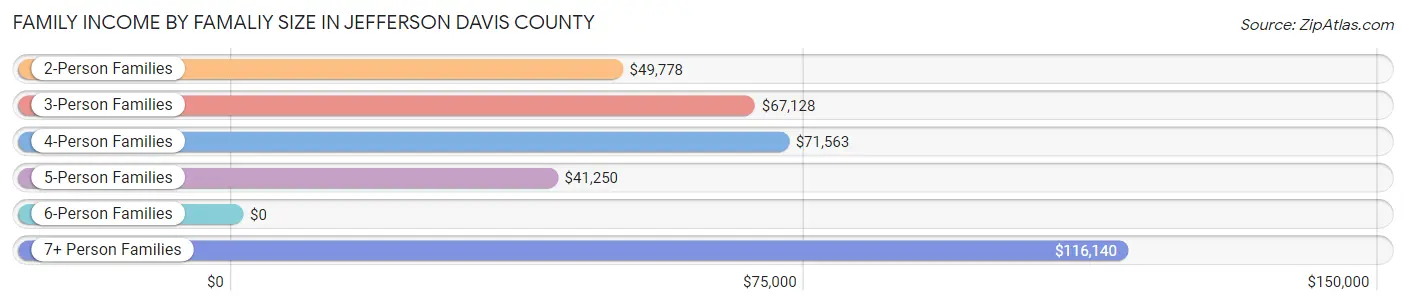
| Income Bracket | # Families | Median Income |
| 2-Person Families | 1,664 (57.3%) | $49,778 |
| 3-Person Families | 534 (18.4%) | $67,128 |
| 4-Person Families | 291 (10.0%) | $71,563 |
| 5-Person Families | 176 (6.1%) | $41,250 |
| 6-Person Families | 180 (6.2%) | $0 |
| 7+ Person Families | 59 (2.0%) | $116,140 |
| Total | 2,904 (100.0%) | $55,145 |
Family Income by Number of Earners in Jefferson Davis County
The median family income in Jefferson Davis County is $55,145, with families comprising 3+ earners (306) having the highest median family income of $110,200, while families with no earners (802) have the lowest median family income of $23,333, accounting for 10.5% and 27.6% of families, respectively.

| Number of Earners | # Families | Median Income |
| No Earners | 802 (27.6%) | $23,333 |
| 1 Earner | 962 (33.1%) | $43,443 |
| 2 Earners | 834 (28.7%) | $85,636 |
| 3+ Earners | 306 (10.5%) | $110,200 |
| Total | 2,904 (100.0%) | $55,145 |
Household Income in Jefferson Davis County
Household Income Brackets in Jefferson Davis County
With 833 households falling in the category, the $15,000 to $24,999 income range is the most frequent in Jefferson Davis County, accounting for 18.7% of all households. In contrast, only 67 households (1.5%) fall into the $200,000+ income bracket, making it the least populous group.

| Income Bracket | # Households | % Households |
| Less than $10,000 | 298 | 6.7% |
| $10,000 to $14,999 | 459 | 10.3% |
| $15,000 to $24,999 | 833 | 18.7% |
| $25,000 to $34,999 | 552 | 12.4% |
| $35,000 to $49,999 | 485 | 10.9% |
| $50,000 to $74,999 | 623 | 14.0% |
| $75,000 to $99,999 | 441 | 9.9% |
| $100,000 to $149,999 | 561 | 12.6% |
| $150,000 to $199,999 | 129 | 2.9% |
| $200,000+ | 67 | 1.5% |
Household Income by Householder Age in Jefferson Davis County
The median household income in Jefferson Davis County is $36,473, with the highest median household income of $49,314 found in the 45 to 64 years age bracket for the primary householder. A total of 1,596 households (35.8%) fall into this category. Meanwhile, the 65+ years age bracket for the primary householder has the lowest median household income of $31,061, with 1,832 households (41.1%) in this group.

| Income Bracket | # Households | Median Income |
| 15 to 24 Years | 68 (1.5%) | $32,727 |
| 25 to 44 Years | 957 (21.5%) | $36,788 |
| 45 to 64 Years | 1,596 (35.8%) | $49,314 |
| 65+ Years | 1,832 (41.1%) | $31,061 |
| Total | 4,453 (100.0%) | $36,473 |
Poverty in Jefferson Davis County
Income Below Poverty by Sex and Age in Jefferson Davis County
With 22.0% poverty level for males and 24.0% for females among the residents of Jefferson Davis County, 5 year old males and under 5 year old females are the most vulnerable to poverty, with 108 males (95.6%) and 164 females (52.6%) in their respective age groups living below the poverty level.

| Age Bracket | Male | Female |
| Under 5 Years | 100 (35.1%) | 164 (52.6%) |
| 5 Years | 108 (95.6%) | 32 (36.4%) |
| 6 to 11 Years | 120 (42.4%) | 170 (45.7%) |
| 12 to 14 Years | 62 (24.8%) | 63 (38.7%) |
| 15 Years | 29 (25.4%) | 6 (20.7%) |
| 16 and 17 Years | 34 (36.6%) | 31 (23.1%) |
| 18 to 24 Years | 115 (22.2%) | 32 (7.1%) |
| 25 to 34 Years | 113 (20.7%) | 155 (28.3%) |
| 35 to 44 Years | 82 (13.9%) | 158 (20.5%) |
| 45 to 54 Years | 109 (16.4%) | 185 (26.4%) |
| 55 to 64 Years | 155 (21.0%) | 179 (20.7%) |
| 65 to 74 Years | 85 (12.9%) | 130 (16.4%) |
| 75 Years and over | 51 (11.7%) | 111 (16.7%) |
| Total | 1,163 (22.0%) | 1,416 (24.0%) |
Income Above Poverty by Sex and Age in Jefferson Davis County
According to the poverty statistics in Jefferson Davis County, males aged 75 years and over and females aged 18 to 24 years are the age groups that are most secure financially, with 88.3% of males and 92.9% of females in these age groups living above the poverty line.

| Age Bracket | Male | Female |
| Under 5 Years | 185 (64.9%) | 148 (47.4%) |
| 5 Years | 5 (4.4%) | 56 (63.6%) |
| 6 to 11 Years | 163 (57.6%) | 202 (54.3%) |
| 12 to 14 Years | 188 (75.2%) | 100 (61.4%) |
| 15 Years | 85 (74.6%) | 23 (79.3%) |
| 16 and 17 Years | 59 (63.4%) | 103 (76.9%) |
| 18 to 24 Years | 404 (77.8%) | 417 (92.9%) |
| 25 to 34 Years | 433 (79.3%) | 393 (71.7%) |
| 35 to 44 Years | 507 (86.1%) | 614 (79.5%) |
| 45 to 54 Years | 554 (83.6%) | 516 (73.6%) |
| 55 to 64 Years | 584 (79.0%) | 685 (79.3%) |
| 65 to 74 Years | 573 (87.1%) | 662 (83.6%) |
| 75 Years and over | 384 (88.3%) | 554 (83.3%) |
| Total | 4,124 (78.0%) | 4,473 (76.0%) |
Income Below Poverty Among Married-Couple Families in Jefferson Davis County
The poverty statistics for married-couple families in Jefferson Davis County show that 11.4% or 210 of the total 1,851 families live below the poverty line. Families with 1 or 2 children have the highest poverty rate of 38.5%, comprising of 134 families. On the other hand, families with no children have the lowest poverty rate of 5.0%, which includes 68 families.
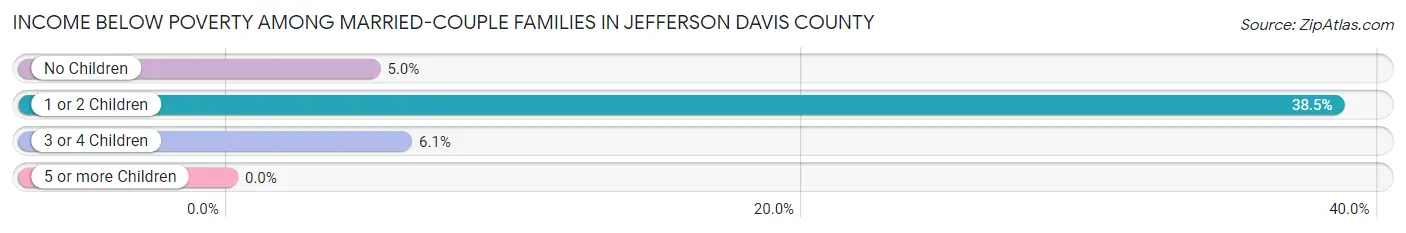
| Children | Above Poverty | Below Poverty |
| No Children | 1,303 (95.0%) | 68 (5.0%) |
| 1 or 2 Children | 214 (61.5%) | 134 (38.5%) |
| 3 or 4 Children | 124 (93.9%) | 8 (6.1%) |
| 5 or more Children | 0 (0.0%) | 0 (0.0%) |
| Total | 1,641 (88.6%) | 210 (11.4%) |
Income Below Poverty Among Single-Parent Households in Jefferson Davis County
According to the poverty data in Jefferson Davis County, 40.1% or 63 single-father households and 28.3% or 254 single-mother households are living below the poverty line. Among single-father households, those with 1 or 2 children have the highest poverty rate, with 49 households (53.3%) experiencing poverty. Likewise, among single-mother households, those with 3 or 4 children have the highest poverty rate, with 46 households (57.5%) falling below the poverty line.

| Children | Single Father | Single Mother |
| No Children | 14 (35.9%) | 34 (7.0%) |
| 1 or 2 Children | 49 (53.3%) | 174 (52.1%) |
| 3 or 4 Children | 0 (0.0%) | 46 (57.5%) |
| 5 or more Children | 0 (0.0%) | 0 (0.0%) |
| Total | 63 (40.1%) | 254 (28.3%) |
Income Below Poverty Among Married-Couple vs Single-Parent Households in Jefferson Davis County
The poverty data for Jefferson Davis County shows that 210 of the married-couple family households (11.4%) and 317 of the single-parent households (30.1%) are living below the poverty level. Within the married-couple family households, those with 1 or 2 children have the highest poverty rate, with 134 households (38.5%) falling below the poverty line. Among the single-parent households, those with 1 or 2 children have the highest poverty rate, with 223 household (52.3%) living below poverty.
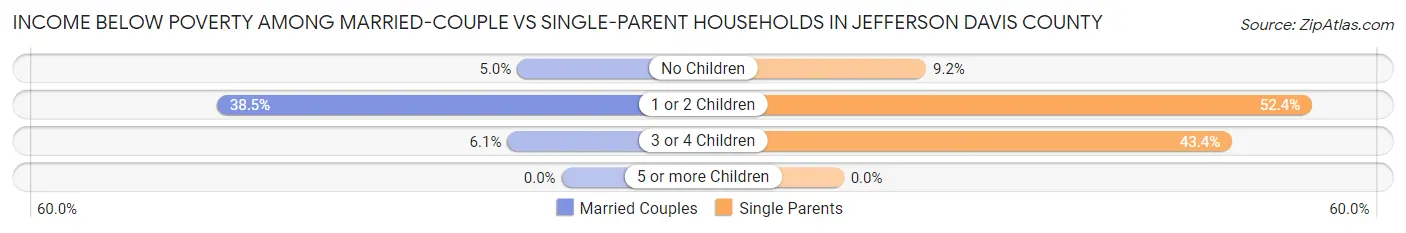
| Children | Married-Couple Families | Single-Parent Households |
| No Children | 68 (5.0%) | 48 (9.2%) |
| 1 or 2 Children | 134 (38.5%) | 223 (52.3%) |
| 3 or 4 Children | 8 (6.1%) | 46 (43.4%) |
| 5 or more Children | 0 (0.0%) | 0 (0.0%) |
| Total | 210 (11.4%) | 317 (30.1%) |
Employment Characteristics in Jefferson Davis County
Employment by Class of Employer in Jefferson Davis County
Among the 4,431 employed individuals in Jefferson Davis County, private company employees (2,980 | 67.2%), state government employees (477 | 10.8%), and local government employees (363 | 8.2%) make up the most common classes of employment.

| Employer Class | # Employees | % Employees |
| Private Company Employees | 2,980 | 67.2% |
| Self-Employed (Incorporated) | 59 | 1.3% |
| Self-Employed (Not Incorporated) | 215 | 4.9% |
| Not-for-profit Organizations | 220 | 5.0% |
| Local Government Employees | 363 | 8.2% |
| State Government Employees | 477 | 10.8% |
| Federal Government Employees | 117 | 2.6% |
| Unpaid Family Workers | 0 | 0.0% |
| Total | 4,431 | 100.0% |
Employment Status by Age in Jefferson Davis County
According to the labor force statistics for Jefferson Davis County, out of the total population over 16 years of age (9,276), 53.4% or 4,953 individuals are in the labor force, with 9.2% or 456 of them unemployed. The age group with the highest labor force participation rate is 35 to 44 years, with 87.1% or 1,191 individuals in the labor force. Within the labor force, the 16 to 19 years age range has the highest percentage of unemployed individuals, with 58.7% or 44 of them being unemployed.

| Age Bracket | In Labor Force | Unemployed |
| 16 to 19 Years | 75 (16.7%) | 44 (58.7%) |
| 20 to 24 Years | 635 (84.1%) | 104 (16.4%) |
| 25 to 29 Years | 474 (77.1%) | 63 (13.3%) |
| 30 to 34 Years | 406 (83.4%) | 0 (0.0%) |
| 35 to 44 Years | 1,191 (87.1%) | 91 (7.6%) |
| 45 to 54 Years | 977 (71.5%) | 97 (9.9%) |
| 55 to 59 Years | 401 (55.2%) | 18 (4.5%) |
| 60 to 64 Years | 329 (37.0%) | 0 (0.0%) |
| 65 to 74 Years | 386 (26.2%) | 32 (8.3%) |
| 75 Years and over | 80 (7.0%) | 8 (10.0%) |
| Total | 4,953 (53.4%) | 456 (9.2%) |
Employment Status by Educational Attainment in Jefferson Davis County
According to labor force statistics for Jefferson Davis County, 69.3% of individuals (3,777) out of the total population between 25 and 64 years of age (5,450) are in the labor force, with 7.1% or 268 of them being unemployed. The group with the highest labor force participation rate are those with the educational attainment of bachelor's degree or higher, with 85.4% or 688 individuals in the labor force. Within the labor force, individuals with high school diploma education have the highest percentage of unemployment, with 8.1% or 104 of them being unemployed.

| Educational Attainment | In Labor Force | Unemployed |
| Less than High School | 401 (60.6%) | 51 (7.7%) |
| High School Diploma | 1,278 (59.9%) | 173 (8.1%) |
| College / Associate Degree | 1,413 (76.4%) | 129 (7.0%) |
| Bachelor's Degree or higher | 688 (85.4%) | 39 (4.9%) |
| Total | 3,777 (69.3%) | 387 (7.1%) |
Employment Occupations by Sex in Jefferson Davis County
Management, Business, Science and Arts Occupations
The most common Management, Business, Science and Arts occupations in Jefferson Davis County are Community & Social Service (426 | 9.5%), Health Diagnosing & Treating (360 | 8.0%), Education, Arts & Media (258 | 5.8%), Health Technologists (258 | 5.8%), and Management (212 | 4.7%).

Management, Business, Science and Arts Occupations by Sex
Within the Management, Business, Science and Arts occupations in Jefferson Davis County, the most male-oriented occupations are Architecture & Engineering (100.0%), Business & Financial (40.6%), and Computers, Engineering & Science (40.3%), while the most female-oriented occupations are Education Instruction & Library (91.7%), Health Diagnosing & Treating (86.7%), and Community & Social Service (82.4%).

| Occupation | Male | Female |
| Management | 65 (30.7%) | 147 (69.3%) |
| Business & Financial | 41 (40.6%) | 60 (59.4%) |
| Computers, Engineering & Science | 25 (40.3%) | 37 (59.7%) |
| Computers & Mathematics | 12 (24.5%) | 37 (75.5%) |
| Architecture & Engineering | 13 (100.0%) | 0 (0.0%) |
| Life, Physical & Social Science | 0 (0.0%) | 0 (0.0%) |
| Community & Social Service | 75 (17.6%) | 351 (82.4%) |
| Education, Arts & Media | 61 (23.6%) | 197 (76.4%) |
| Legal Services & Support | 0 (0.0%) | 0 (0.0%) |
| Education Instruction & Library | 14 (8.3%) | 154 (91.7%) |
| Arts, Media & Entertainment | 0 (0.0%) | 0 (0.0%) |
| Health Diagnosing & Treating | 48 (13.3%) | 312 (86.7%) |
| Health Technologists | 48 (18.6%) | 210 (81.4%) |
| Total (Category) | 254 (21.9%) | 907 (78.1%) |
| Total (Overall) | 2,081 (46.4%) | 2,403 (53.6%) |
Services Occupations
The most common Services occupations in Jefferson Davis County are Healthcare Support (277 | 6.2%), Personal Care & Service (118 | 2.6%), Cleaning & Maintenance (87 | 1.9%), Security & Protection (83 | 1.8%), and Food Preparation & Serving (77 | 1.7%).

Services Occupations by Sex
Within the Services occupations in Jefferson Davis County, the most male-oriented occupations are Security & Protection (100.0%), Firefighting & Prevention (100.0%), and Law Enforcement (100.0%), while the most female-oriented occupations are Healthcare Support (96.8%), Personal Care & Service (66.9%), and Food Preparation & Serving (37.7%).

| Occupation | Male | Female |
| Healthcare Support | 9 (3.3%) | 268 (96.8%) |
| Security & Protection | 83 (100.0%) | 0 (0.0%) |
| Firefighting & Prevention | 33 (100.0%) | 0 (0.0%) |
| Law Enforcement | 50 (100.0%) | 0 (0.0%) |
| Food Preparation & Serving | 48 (62.3%) | 29 (37.7%) |
| Cleaning & Maintenance | 62 (71.3%) | 25 (28.7%) |
| Personal Care & Service | 39 (33.1%) | 79 (66.9%) |
| Total (Category) | 241 (37.5%) | 401 (62.5%) |
| Total (Overall) | 2,081 (46.4%) | 2,403 (53.6%) |
Sales and Office Occupations
The most common Sales and Office occupations in Jefferson Davis County are Office & Administration (479 | 10.7%), and Sales & Related (444 | 9.9%).

Sales and Office Occupations by Sex

| Occupation | Male | Female |
| Sales & Related | 121 (27.3%) | 323 (72.8%) |
| Office & Administration | 119 (24.8%) | 360 (75.2%) |
| Total (Category) | 240 (26.0%) | 683 (74.0%) |
| Total (Overall) | 2,081 (46.4%) | 2,403 (53.6%) |
Natural Resources, Construction and Maintenance Occupations
The most common Natural Resources, Construction and Maintenance occupations in Jefferson Davis County are Construction & Extraction (330 | 7.4%), Installation, Maintenance & Repair (158 | 3.5%), and Farming, Fishing & Forestry (27 | 0.6%).

Natural Resources, Construction and Maintenance Occupations by Sex

| Occupation | Male | Female |
| Farming, Fishing & Forestry | 0 (0.0%) | 27 (100.0%) |
| Construction & Extraction | 302 (91.5%) | 28 (8.5%) |
| Installation, Maintenance & Repair | 158 (100.0%) | 0 (0.0%) |
| Total (Category) | 460 (89.3%) | 55 (10.7%) |
| Total (Overall) | 2,081 (46.4%) | 2,403 (53.6%) |
Production, Transportation and Moving Occupations
The most common Production, Transportation and Moving occupations in Jefferson Davis County are Transportation (551 | 12.3%), Production (441 | 9.8%), and Material Moving (251 | 5.6%).

Production, Transportation and Moving Occupations by Sex
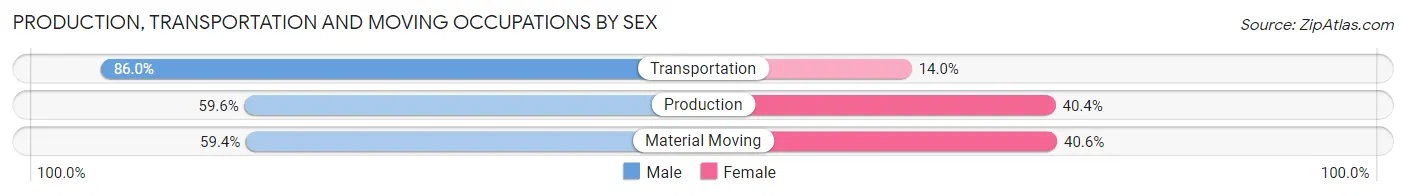
| Occupation | Male | Female |
| Production | 263 (59.6%) | 178 (40.4%) |
| Transportation | 474 (86.0%) | 77 (14.0%) |
| Material Moving | 149 (59.4%) | 102 (40.6%) |
| Total (Category) | 886 (71.3%) | 357 (28.7%) |
| Total (Overall) | 2,081 (46.4%) | 2,403 (53.6%) |
Employment Industries by Sex in Jefferson Davis County
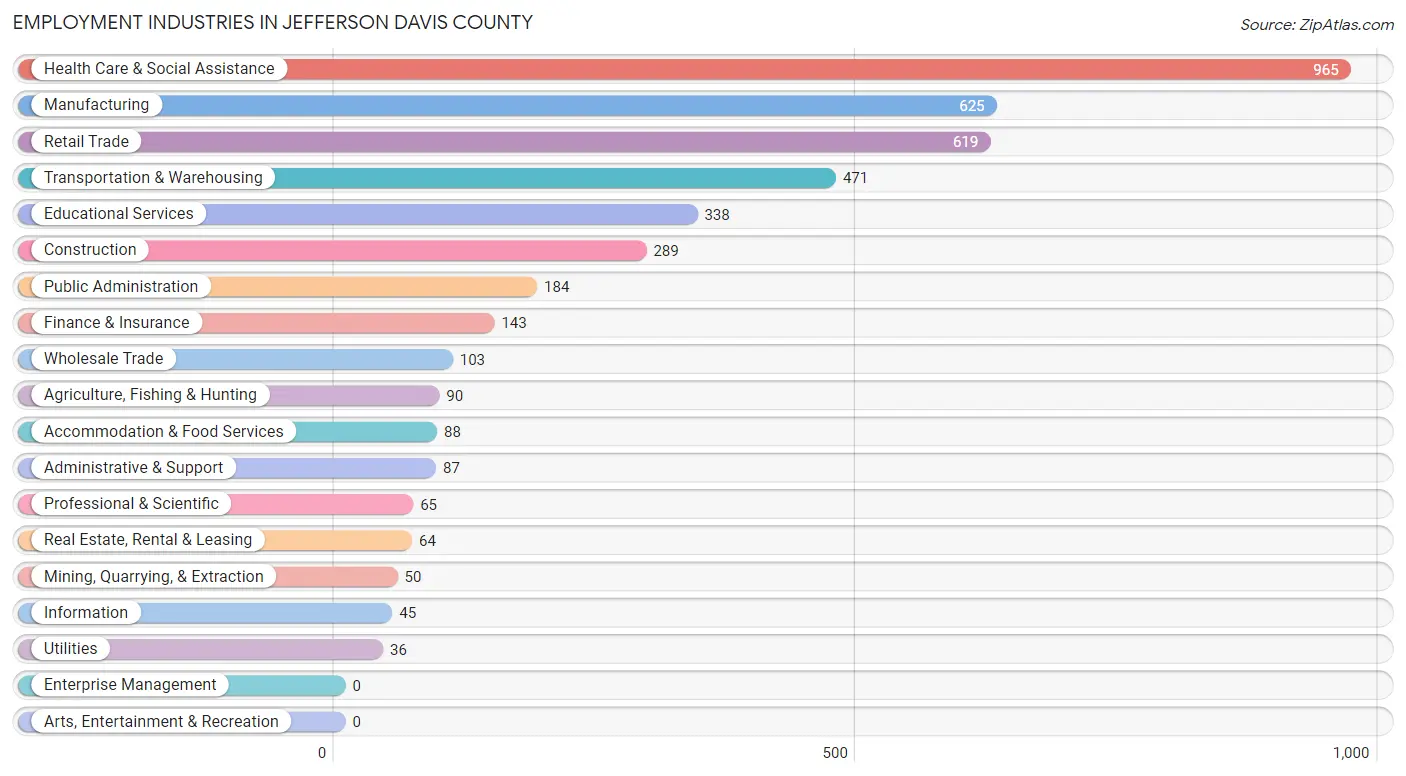
Employment Industries in Jefferson Davis County
The major employment industries in Jefferson Davis County include Health Care & Social Assistance (965 | 21.5%), Manufacturing (625 | 13.9%), Retail Trade (619 | 13.8%), Transportation & Warehousing (471 | 10.5%), and Educational Services (338 | 7.5%).
Employment Industries by Sex in Jefferson Davis County
The Jefferson Davis County industries that see more men than women are Mining, Quarrying, & Extraction (100.0%), Utilities (100.0%), and Construction (87.5%), whereas the industries that tend to have a higher number of women are Finance & Insurance (90.2%), Health Care & Social Assistance (89.4%), and Educational Services (89.0%).

| Industry | Male | Female |
| Agriculture, Fishing & Hunting | 43 (47.8%) | 47 (52.2%) |
| Mining, Quarrying, & Extraction | 50 (100.0%) | 0 (0.0%) |
| Construction | 253 (87.5%) | 36 (12.5%) |
| Manufacturing | 386 (61.8%) | 239 (38.2%) |
| Wholesale Trade | 88 (85.4%) | 15 (14.6%) |
| Retail Trade | 264 (42.6%) | 355 (57.4%) |
| Transportation & Warehousing | 404 (85.8%) | 67 (14.2%) |
| Utilities | 36 (100.0%) | 0 (0.0%) |
| Information | 38 (84.4%) | 7 (15.6%) |
| Finance & Insurance | 14 (9.8%) | 129 (90.2%) |
| Real Estate, Rental & Leasing | 17 (26.6%) | 47 (73.4%) |
| Professional & Scientific | 8 (12.3%) | 57 (87.7%) |
| Enterprise Management | 0 (0.0%) | 0 (0.0%) |
| Administrative & Support | 34 (39.1%) | 53 (60.9%) |
| Educational Services | 37 (11.0%) | 301 (89.0%) |
| Health Care & Social Assistance | 102 (10.6%) | 863 (89.4%) |
| Arts, Entertainment & Recreation | 0 (0.0%) | 0 (0.0%) |
| Accommodation & Food Services | 48 (54.5%) | 40 (45.5%) |
| Public Administration | 126 (68.5%) | 58 (31.5%) |
| Total | 2,081 (46.4%) | 2,403 (53.6%) |
Education in Jefferson Davis County
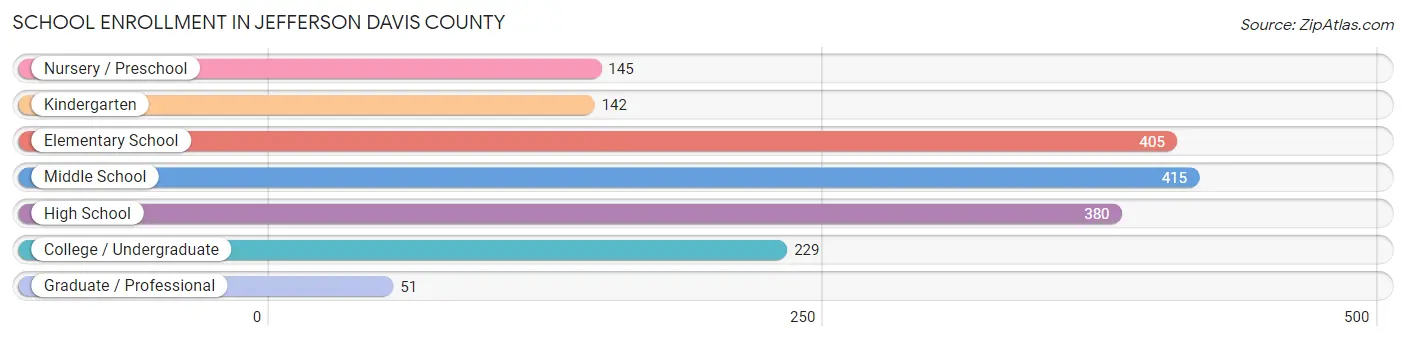
School Enrollment in Jefferson Davis County
The most common levels of schooling among the 1,767 students in Jefferson Davis County are middle school (415 | 23.5%), elementary school (405 | 22.9%), and high school (380 | 21.5%).
| School Level | # Students | % Students |
| Nursery / Preschool | 145 | 8.2% |
| Kindergarten | 142 | 8.0% |
| Elementary School | 405 | 22.9% |
| Middle School | 415 | 23.5% |
| High School | 380 | 21.5% |
| College / Undergraduate | 229 | 13.0% |
| Graduate / Professional | 51 | 2.9% |
| Total | 1,767 | 100.0% |
School Enrollment by Age by Funding Source in Jefferson Davis County
Out of a total of 1,767 students who are enrolled in schools in Jefferson Davis County, 428 (24.2%) attend a private institution, while the remaining 1,339 (75.8%) are enrolled in public schools. The age group of 3 to 4 year olds has the highest likelihood of being enrolled in private schools, with 65 (89.0% in the age bracket) enrolled. Conversely, the age group of 20 to 24 year olds has the lowest likelihood of being enrolled in a private school, with 122 (100.0% in the age bracket) attending a public institution.

| Age Bracket | Public School | Private School |
| 3 to 4 Year Olds | 8 (11.0%) | 65 (89.0%) |
| 5 to 9 Year Old | 419 (83.6%) | 82 (16.4%) |
| 10 to 14 Year Olds | 435 (82.9%) | 90 (17.1%) |
| 15 to 17 Year Olds | 282 (82.2%) | 61 (17.8%) |
| 18 to 19 Year Olds | 35 (32.7%) | 72 (67.3%) |
| 20 to 24 Year Olds | 122 (100.0%) | 0 (0.0%) |
| 25 to 34 Year Olds | 0 (0.0%) | 0 (0.0%) |
| 35 Years and over | 38 (39.6%) | 58 (60.4%) |
| Total | 1,339 (75.8%) | 428 (24.2%) |
Educational Attainment by Field of Study in Jefferson Davis County
Education (329 | 26.8%), business (163 | 13.3%), liberal arts & history (146 | 11.9%), bio, nature & agricultural (140 | 11.4%), and arts & humanities (118 | 9.6%) are the most common fields of study among 1,228 individuals in Jefferson Davis County who have obtained a bachelor's degree or higher.

| Field of Study | # Graduates | % Graduates |
| Computers & Mathematics | 51 | 4.2% |
| Bio, Nature & Agricultural | 140 | 11.4% |
| Physical & Health Sciences | 0 | 0.0% |
| Psychology | 47 | 3.8% |
| Social Sciences | 51 | 4.2% |
| Engineering | 24 | 1.9% |
| Multidisciplinary Studies | 0 | 0.0% |
| Science & Technology | 113 | 9.2% |
| Business | 163 | 13.3% |
| Education | 329 | 26.8% |
| Literature & Languages | 31 | 2.5% |
| Liberal Arts & History | 146 | 11.9% |
| Visual & Performing Arts | 4 | 0.3% |
| Communications | 11 | 0.9% |
| Arts & Humanities | 118 | 9.6% |
| Total | 1,228 | 100.0% |
Transportation & Commute in Jefferson Davis County
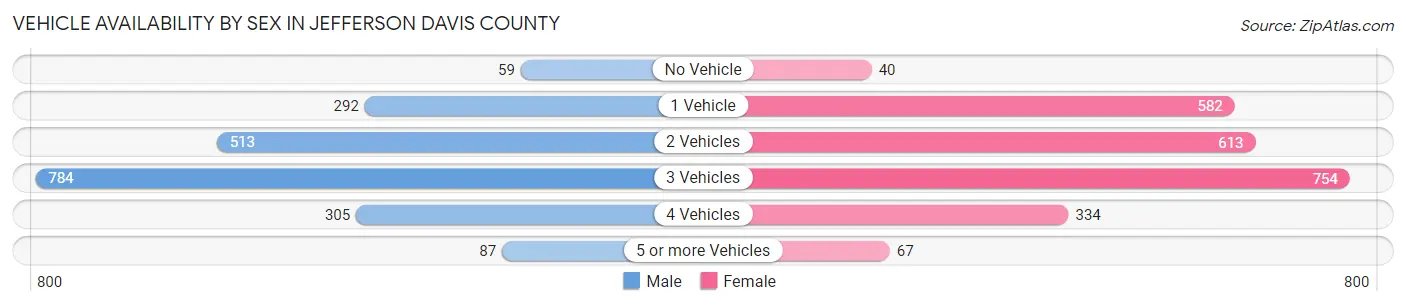
Vehicle Availability by Sex in Jefferson Davis County
The most prevalent vehicle ownership categories in Jefferson Davis County are males with 3 vehicles (784, accounting for 38.4%) and females with 3 vehicles (754, making up 32.8%).
| Vehicles Available | Male | Female |
| No Vehicle | 59 (2.9%) | 40 (1.7%) |
| 1 Vehicle | 292 (14.3%) | 582 (24.3%) |
| 2 Vehicles | 513 (25.2%) | 613 (25.7%) |
| 3 Vehicles | 784 (38.4%) | 754 (31.6%) |
| 4 Vehicles | 305 (14.9%) | 334 (14.0%) |
| 5 or more Vehicles | 87 (4.3%) | 67 (2.8%) |
| Total | 2,040 (100.0%) | 2,390 (100.0%) |
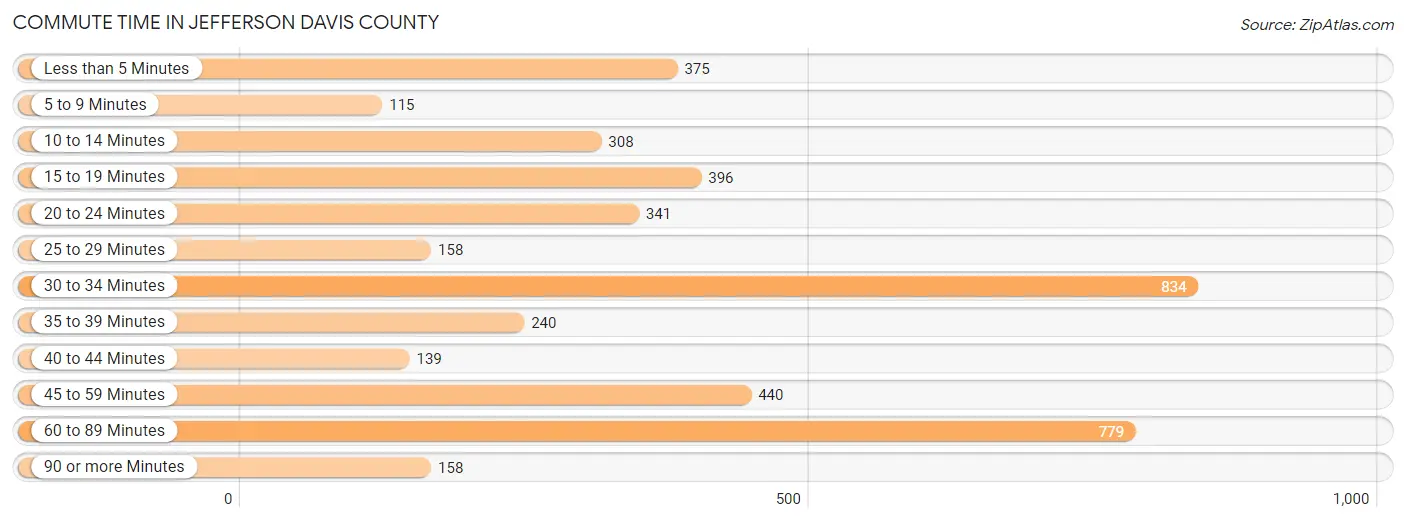
Commute Time in Jefferson Davis County
The most frequently occuring commute durations in Jefferson Davis County are 30 to 34 minutes (834 commuters, 19.5%), 60 to 89 minutes (779 commuters, 18.2%), and 45 to 59 minutes (440 commuters, 10.3%).
| Commute Time | # Commuters | % Commuters |
| Less than 5 Minutes | 375 | 8.8% |
| 5 to 9 Minutes | 115 | 2.7% |
| 10 to 14 Minutes | 308 | 7.2% |
| 15 to 19 Minutes | 396 | 9.2% |
| 20 to 24 Minutes | 341 | 8.0% |
| 25 to 29 Minutes | 158 | 3.7% |
| 30 to 34 Minutes | 834 | 19.5% |
| 35 to 39 Minutes | 240 | 5.6% |
| 40 to 44 Minutes | 139 | 3.3% |
| 45 to 59 Minutes | 440 | 10.3% |
| 60 to 89 Minutes | 779 | 18.2% |
| 90 or more Minutes | 158 | 3.7% |
Commute Time by Sex in Jefferson Davis County
The most common commute times in Jefferson Davis County are 60 to 89 minutes (395 commuters, 19.8%) for males and 30 to 34 minutes (487 commuters, 21.3%) for females.

| Commute Time | Male | Female |
| Less than 5 Minutes | 254 (12.7%) | 121 (5.3%) |
| 5 to 9 Minutes | 35 (1.8%) | 80 (3.5%) |
| 10 to 14 Minutes | 188 (9.4%) | 120 (5.2%) |
| 15 to 19 Minutes | 57 (2.9%) | 339 (14.8%) |
| 20 to 24 Minutes | 89 (4.5%) | 252 (11.0%) |
| 25 to 29 Minutes | 91 (4.6%) | 67 (2.9%) |
| 30 to 34 Minutes | 347 (17.4%) | 487 (21.3%) |
| 35 to 39 Minutes | 75 (3.8%) | 165 (7.2%) |
| 40 to 44 Minutes | 72 (3.6%) | 67 (2.9%) |
| 45 to 59 Minutes | 274 (13.7%) | 166 (7.3%) |
| 60 to 89 Minutes | 395 (19.8%) | 384 (16.8%) |
| 90 or more Minutes | 120 (6.0%) | 38 (1.7%) |
Time of Departure to Work by Sex in Jefferson Davis County
The most frequent times of departure to work in Jefferson Davis County are 6:00 AM to 6:29 AM (341, 17.1%) for males and 7:00 AM to 7:29 AM (517, 22.6%) for females.

| Time of Departure | Male | Female |
| 12:00 AM to 4:59 AM | 257 (12.9%) | 348 (15.2%) |
| 5:00 AM to 5:29 AM | 252 (12.6%) | 40 (1.8%) |
| 5:30 AM to 5:59 AM | 207 (10.4%) | 61 (2.7%) |
| 6:00 AM to 6:29 AM | 341 (17.1%) | 198 (8.7%) |
| 6:30 AM to 6:59 AM | 156 (7.8%) | 264 (11.6%) |
| 7:00 AM to 7:29 AM | 237 (11.9%) | 517 (22.6%) |
| 7:30 AM to 7:59 AM | 120 (6.0%) | 115 (5.0%) |
| 8:00 AM to 8:29 AM | 206 (10.3%) | 158 (6.9%) |
| 8:30 AM to 8:59 AM | 9 (0.4%) | 38 (1.7%) |
| 9:00 AM to 9:59 AM | 12 (0.6%) | 138 (6.0%) |
| 10:00 AM to 10:59 AM | 25 (1.3%) | 0 (0.0%) |
| 11:00 AM to 11:59 AM | 0 (0.0%) | 0 (0.0%) |
| 12:00 PM to 3:59 PM | 35 (1.8%) | 273 (11.9%) |
| 4:00 PM to 11:59 PM | 140 (7.0%) | 136 (5.9%) |
| Total | 1,997 (100.0%) | 2,286 (100.0%) |
Housing Occupancy in Jefferson Davis County
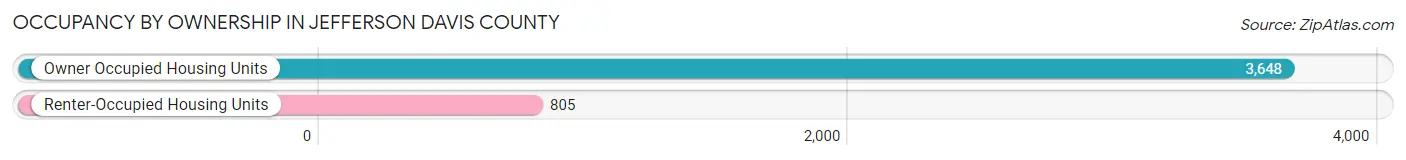
Occupancy by Ownership in Jefferson Davis County
Of the total 4,453 dwellings in Jefferson Davis County, owner-occupied units account for 3,648 (81.9%), while renter-occupied units make up 805 (18.1%).
| Occupancy | # Housing Units | % Housing Units |
| Owner Occupied Housing Units | 3,648 | 81.9% |
| Renter-Occupied Housing Units | 805 | 18.1% |
| Total Occupied Housing Units | 4,453 | 100.0% |
Occupancy by Household Size in Jefferson Davis County

| Household Size | # Housing Units | % Housing Units |
| 1-Person Household | 1,442 | 32.4% |
| 2-Person Household | 1,734 | 38.9% |
| 3-Person Household | 552 | 12.4% |
| 4+ Person Household | 725 | 16.3% |
| Total Housing Units | 4,453 | 100.0% |
Occupancy by Ownership by Household Size in Jefferson Davis County

| Household Size | Owner-occupied | Renter-occupied |
| 1-Person Household | 1,051 (72.9%) | 391 (27.1%) |
| 2-Person Household | 1,592 (91.8%) | 142 (8.2%) |
| 3-Person Household | 424 (76.8%) | 128 (23.2%) |
| 4+ Person Household | 581 (80.1%) | 144 (19.9%) |
| Total Housing Units | 3,648 (81.9%) | 805 (18.1%) |
Occupancy by Educational Attainment in Jefferson Davis County

| Household Size | Owner-occupied | Renter-occupied |
| Less than High School | 416 (84.7%) | 75 (15.3%) |
| High School Diploma | 1,527 (81.6%) | 344 (18.4%) |
| College/Associate Degree | 1,130 (76.2%) | 352 (23.7%) |
| Bachelor's Degree or higher | 575 (94.4%) | 34 (5.6%) |
Occupancy by Age of Householder in Jefferson Davis County

| Age Bracket | # Households | % Households |
| Under 35 Years | 338 | 7.6% |
| 35 to 44 Years | 687 | 15.4% |
| 45 to 54 Years | 633 | 14.2% |
| 55 to 64 Years | 963 | 21.6% |
| 65 to 74 Years | 944 | 21.2% |
| 75 to 84 Years | 759 | 17.0% |
| 85 Years and Over | 129 | 2.9% |
| Total | 4,453 | 100.0% |
Housing Finances in Jefferson Davis County
Median Income by Occupancy in Jefferson Davis County

| Occupancy Type | # Households | Median Income |
| Owner-Occupied | 3,648 (81.9%) | $45,403 |
| Renter-Occupied | 805 (18.1%) | $19,063 |
| Average | 4,453 (100.0%) | $36,473 |
Occupancy by Householder Income Bracket in Jefferson Davis County

| Income Bracket | Owner-occupied | Renter-occupied |
| Less than $5,000 | 80 (2.2%) | 111 (13.8%) |
| $5,000 to $9,999 | 98 (2.7%) | 9 (1.1%) |
| $10,000 to $14,999 | 330 (9.0%) | 128 (15.9%) |
| $15,000 to $19,999 | 316 (8.7%) | 210 (26.1%) |
| $20,000 to $24,999 | 273 (7.5%) | 35 (4.3%) |
| $25,000 to $34,999 | 471 (12.9%) | 83 (10.3%) |
| $35,000 to $49,999 | 397 (10.9%) | 89 (11.1%) |
| $50,000 to $74,999 | 603 (16.5%) | 21 (2.6%) |
| $75,000 to $99,999 | 324 (8.9%) | 115 (14.3%) |
| $100,000 to $149,999 | 559 (15.3%) | 4 (0.5%) |
| $150,000 or more | 197 (5.4%) | 0 (0.0%) |
| Total | 3,648 (100.0%) | 805 (100.0%) |
Monthly Housing Cost Tiers in Jefferson Davis County

| Monthly Cost | Owner-occupied | Renter-occupied |
| Less than $300 | 535 (14.7%) | 55 (6.8%) |
| $300 to $499 | 968 (26.5%) | 87 (10.8%) |
| $500 to $799 | 832 (22.8%) | 226 (28.1%) |
| $800 to $999 | 562 (15.4%) | 95 (11.8%) |
| $1,000 to $1,499 | 639 (17.5%) | 26 (3.2%) |
| $1,500 to $1,999 | 47 (1.3%) | 0 (0.0%) |
| $2,000 to $2,499 | 45 (1.2%) | 0 (0.0%) |
| $2,500 to $2,999 | 20 (0.5%) | 0 (0.0%) |
| $3,000 or more | 0 (0.0%) | 0 (0.0%) |
| Total | 3,648 (100.0%) | 805 (100.0%) |
Physical Housing Characteristics in Jefferson Davis County
Housing Structures in Jefferson Davis County

| Structure Type | # Housing Units | % Housing Units |
| Single Unit, Detached | 3,249 | 73.0% |
| Single Unit, Attached | 15 | 0.3% |
| 2 Unit Apartments | 33 | 0.7% |
| 3 or 4 Unit Apartments | 77 | 1.7% |
| 5 to 9 Unit Apartments | 58 | 1.3% |
| 10 or more Apartments | 17 | 0.4% |
| Mobile Home / Other | 1,004 | 22.6% |
| Total | 4,453 | 100.0% |
Housing Structures by Occupancy in Jefferson Davis County

| Structure Type | Owner-occupied | Renter-occupied |
| Single Unit, Detached | 2,791 (85.9%) | 458 (14.1%) |
| Single Unit, Attached | 15 (100.0%) | 0 (0.0%) |
| 2 Unit Apartments | 6 (18.2%) | 27 (81.8%) |
| 3 or 4 Unit Apartments | 12 (15.6%) | 65 (84.4%) |
| 5 to 9 Unit Apartments | 0 (0.0%) | 58 (100.0%) |
| 10 or more Apartments | 0 (0.0%) | 17 (100.0%) |
| Mobile Home / Other | 824 (82.1%) | 180 (17.9%) |
| Total | 3,648 (81.9%) | 805 (18.1%) |
Housing Structures by Number of Rooms in Jefferson Davis County

| Number of Rooms | Owner-occupied | Renter-occupied |
| 1 Room | 24 (0.7%) | 0 (0.0%) |
| 2 or 3 Rooms | 126 (3.5%) | 183 (22.7%) |
| 4 or 5 Rooms | 1,041 (28.5%) | 333 (41.4%) |
| 6 or 7 Rooms | 1,703 (46.7%) | 241 (29.9%) |
| 8 or more Rooms | 754 (20.7%) | 48 (6.0%) |
| Total | 3,648 (100.0%) | 805 (100.0%) |
Housing Structure by Heating Type in Jefferson Davis County

| Heating Type | Owner-occupied | Renter-occupied |
| Utility Gas | 296 (8.1%) | 85 (10.6%) |
| Bottled, Tank, or LP Gas | 1,224 (33.6%) | 234 (29.1%) |
| Electricity | 2,071 (56.8%) | 486 (60.4%) |
| Fuel Oil or Kerosene | 0 (0.0%) | 0 (0.0%) |
| Coal or Coke | 0 (0.0%) | 0 (0.0%) |
| All other Fuels | 46 (1.3%) | 0 (0.0%) |
| No Fuel Used | 11 (0.3%) | 0 (0.0%) |
| Total | 3,648 (100.0%) | 805 (100.0%) |
Household Vehicle Usage in Jefferson Davis County

| Vehicles per Household | Owner-occupied | Renter-occupied |
| No Vehicle | 204 (5.6%) | 109 (13.5%) |
| 1 Vehicle | 1,009 (27.7%) | 466 (57.9%) |
| 2 Vehicles | 1,318 (36.1%) | 148 (18.4%) |
| 3 or more Vehicles | 1,117 (30.6%) | 82 (10.2%) |
| Total | 3,648 (100.0%) | 805 (100.0%) |
Real Estate & Mortgages in Jefferson Davis County
Real Estate and Mortgage Overview in Jefferson Davis County
| Characteristic | Without Mortgage | With Mortgage |
| Housing Units | 2,312 | 1,336 |
| Median Property Value | $84,300 | $96,000 |
| Median Household Income | $38,041 | $119 |
| Monthly Housing Costs | $454 | $0 |
| Real Estate Taxes | $644 | $442 |
Property Value by Mortgage Status in Jefferson Davis County

| Property Value | Without Mortgage | With Mortgage |
| Less than $50,000 | 810 (35.0%) | 147 (11.0%) |
| $50,000 to $99,999 | 565 (24.4%) | 544 (40.7%) |
| $100,000 to $299,999 | 792 (34.3%) | 615 (46.0%) |
| $300,000 to $499,999 | 110 (4.8%) | 13 (1.0%) |
| $500,000 to $749,999 | 35 (1.5%) | 0 (0.0%) |
| $750,000 to $999,999 | 0 (0.0%) | 0 (0.0%) |
| $1,000,000 or more | 0 (0.0%) | 17 (1.3%) |
| Total | 2,312 (100.0%) | 1,336 (100.0%) |
Household Income by Mortgage Status in Jefferson Davis County

| Household Income | Without Mortgage | With Mortgage |
| Less than $10,000 | 156 (6.8%) | 11 (0.8%) |
| $10,000 to $24,999 | 658 (28.5%) | 22 (1.7%) |
| $25,000 to $34,999 | 288 (12.5%) | 261 (19.5%) |
| $35,000 to $49,999 | 233 (10.1%) | 183 (13.7%) |
| $50,000 to $74,999 | 332 (14.4%) | 164 (12.3%) |
| $75,000 to $99,999 | 188 (8.1%) | 271 (20.3%) |
| $100,000 to $149,999 | 379 (16.4%) | 136 (10.2%) |
| $150,000 or more | 78 (3.4%) | 180 (13.5%) |
| Total | 2,312 (100.0%) | 1,336 (100.0%) |
Property Value to Household Income Ratio in Jefferson Davis County

| Value-to-Income Ratio | Without Mortgage | With Mortgage |
| Less than 2.0x | 1,196 (51.7%) | 55,714 (4,170.2%) |
| 2.0x to 2.9x | 256 (11.1%) | 731 (54.7%) |
| 3.0x to 3.9x | 188 (8.1%) | 211 (15.8%) |
| 4.0x or more | 617 (26.7%) | 124 (9.3%) |
| Total | 2,312 (100.0%) | 1,336 (100.0%) |
Real Estate Taxes by Mortgage Status in Jefferson Davis County

| Property Taxes | Without Mortgage | With Mortgage |
| Less than $800 | 855 (37.0%) | 11 (0.8%) |
| $800 to $1,499 | 345 (14.9%) | 445 (33.3%) |
| $800 to $1,499 | 324 (14.0%) | 227 (17.0%) |
| Total | 2,312 (100.0%) | 1,336 (100.0%) |
Health & Disability in Jefferson Davis County
Health Insurance Coverage by Age in Jefferson Davis County

| Age Bracket | With Coverage | Without Coverage |
| Under 6 Years | 785 (98.4%) | 13 (1.6%) |
| 6 to 18 Years | 1,398 (90.5%) | 146 (9.5%) |
| 19 to 25 Years | 755 (70.6%) | 314 (29.4%) |
| 26 to 34 Years | 677 (75.8%) | 216 (24.2%) |
| 35 to 44 Years | 946 (69.5%) | 415 (30.5%) |
| 45 to 54 Years | 1,095 (81.3%) | 252 (18.7%) |
| 55 to 64 Years | 1,538 (96.0%) | 65 (4.1%) |
| 65 to 74 Years | 1,450 (100.0%) | 0 (0.0%) |
| 75 Years and older | 1,100 (100.0%) | 0 (0.0%) |
| Total | 9,744 (87.3%) | 1,421 (12.7%) |
Health Insurance Coverage by Citizenship Status in Jefferson Davis County

| Citizenship Status | With Coverage | Without Coverage |
| Native Born | 785 (98.4%) | 13 (1.6%) |
| Foreign Born, Citizen | 1,398 (90.5%) | 146 (9.5%) |
| Foreign Born, not a Citizen | 755 (70.6%) | 314 (29.4%) |
Health Insurance Coverage by Household Income in Jefferson Davis County

| Household Income | With Coverage | Without Coverage |
| Under $25,000 | 2,473 (85.1%) | 432 (14.9%) |
| $25,000 to $49,999 | 2,040 (85.9%) | 336 (14.1%) |
| $50,000 to $74,999 | 1,855 (89.9%) | 209 (10.1%) |
| $75,000 to $99,999 | 1,022 (85.6%) | 172 (14.4%) |
| $100,000 and over | 2,329 (89.5%) | 272 (10.5%) |
Public vs Private Health Insurance Coverage by Age in Jefferson Davis County

| Age Bracket | Public Insurance | Private Insurance |
| Under 6 | 665 (83.3%) | 124 (15.5%) |
| 6 to 18 Years | 1,016 (65.8%) | 440 (28.5%) |
| 19 to 25 Years | 202 (18.9%) | 565 (52.8%) |
| 25 to 34 Years | 221 (24.7%) | 468 (52.4%) |
| 35 to 44 Years | 192 (14.1%) | 806 (59.2%) |
| 45 to 54 Years | 340 (25.2%) | 804 (59.7%) |
| 55 to 64 Years | 674 (42.0%) | 945 (59.0%) |
| 65 to 74 Years | 1,325 (91.4%) | 731 (50.4%) |
| 75 Years and over | 1,089 (99.0%) | 474 (43.1%) |
| Total | 5,724 (51.3%) | 5,357 (48.0%) |
Disability Status by Sex by Age in Jefferson Davis County

| Age Bracket | Male | Female |
| Under 5 Years | 0 (0.0%) | 0 (0.0%) |
| 5 to 17 Years | 32 (3.7%) | 61 (7.8%) |
| 18 to 34 Years | 55 (5.2%) | 87 (8.7%) |
| 35 to 64 Years | 595 (30.1%) | 550 (23.5%) |
| 65 to 74 Years | 220 (33.4%) | 193 (24.4%) |
| 75 Years and over | 291 (66.9%) | 296 (44.5%) |
Disability Class by Sex by Age in Jefferson Davis County
Disability Class: Hearing Difficulty
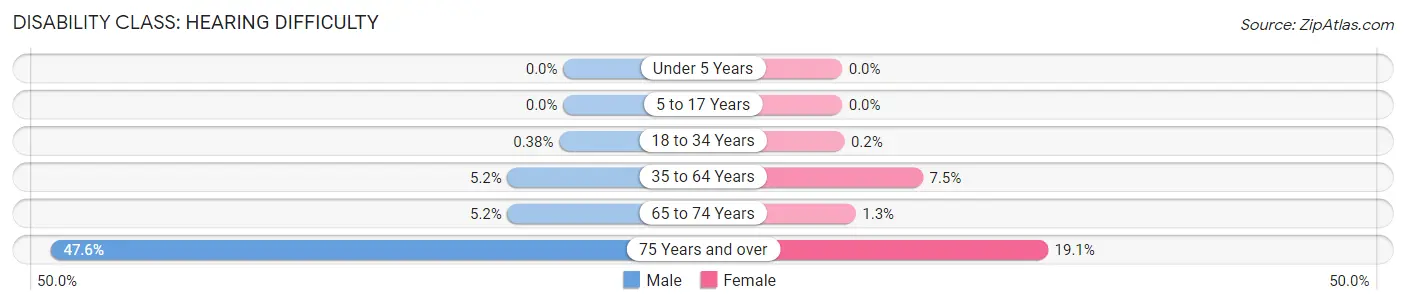
| Age Bracket | Male | Female |
| Under 5 Years | 0 (0.0%) | 0 (0.0%) |
| 5 to 17 Years | 0 (0.0%) | 0 (0.0%) |
| 18 to 34 Years | 4 (0.4%) | 2 (0.2%) |
| 35 to 64 Years | 102 (5.2%) | 175 (7.5%) |
| 65 to 74 Years | 34 (5.2%) | 10 (1.3%) |
| 75 Years and over | 207 (47.6%) | 127 (19.1%) |
Disability Class: Vision Difficulty
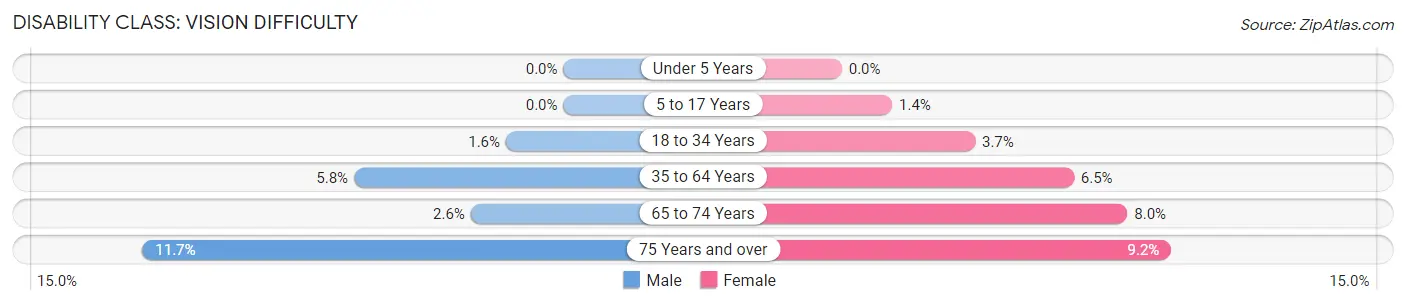
| Age Bracket | Male | Female |
| Under 5 Years | 0 (0.0%) | 0 (0.0%) |
| 5 to 17 Years | 0 (0.0%) | 11 (1.4%) |
| 18 to 34 Years | 17 (1.6%) | 37 (3.7%) |
| 35 to 64 Years | 115 (5.8%) | 151 (6.5%) |
| 65 to 74 Years | 17 (2.6%) | 63 (8.0%) |
| 75 Years and over | 51 (11.7%) | 61 (9.2%) |
Disability Class: Cognitive Difficulty

| Age Bracket | Male | Female |
| 5 to 17 Years | 32 (3.7%) | 50 (6.4%) |
| 18 to 34 Years | 31 (2.9%) | 48 (4.8%) |
| 35 to 64 Years | 275 (13.9%) | 158 (6.8%) |
| 65 to 74 Years | 158 (24.0%) | 76 (9.6%) |
| 75 Years and over | 27 (6.2%) | 131 (19.7%) |
Disability Class: Ambulatory Difficulty

| Age Bracket | Male | Female |
| 5 to 17 Years | 0 (0.0%) | 7 (0.9%) |
| 18 to 34 Years | 5 (0.5%) | 0 (0.0%) |
| 35 to 64 Years | 391 (19.8%) | 308 (13.2%) |
| 65 to 74 Years | 169 (25.7%) | 168 (21.2%) |
| 75 Years and over | 177 (40.7%) | 185 (27.8%) |
Disability Class: Self-Care Difficulty

| Age Bracket | Male | Female |
| 5 to 17 Years | 8 (0.9%) | 14 (1.8%) |
| 18 to 34 Years | 10 (0.9%) | 0 (0.0%) |
| 35 to 64 Years | 157 (8.0%) | 65 (2.8%) |
| 65 to 74 Years | 113 (17.2%) | 0 (0.0%) |
| 75 Years and over | 110 (25.3%) | 82 (12.3%) |
Technology Access in Jefferson Davis County
Computing Device Access in Jefferson Davis County

| Device Type | # Households | % Households |
| Desktop or Laptop | 2,436 | 54.7% |
| Smartphone | 3,348 | 75.2% |
| Tablet | 1,913 | 43.0% |
| No Computing Device | 785 | 17.6% |
| Total | 4,453 | 100.0% |
Internet Access in Jefferson Davis County

| Internet Type | # Households | % Households |
| Dial-Up Internet | 11 | 0.3% |
| Broadband Home | 1,756 | 39.4% |
| Cellular Data Only | 945 | 21.2% |
| Satellite Internet | 503 | 11.3% |
| No Internet | 1,307 | 29.3% |
| Total | 4,453 | 100.0% |
Jefferson Davis County Summary
Jefferson Davis County is located in the southeastern corner of Mississippi, and is bordered by the states of Louisiana and Alabama. The county was named after the President of the Confederate States of America, Jefferson Davis. The county seat is Prentiss, and the county is part of the Hattiesburg, MS Metropolitan Statistical Area.
Geography
Jefferson Davis County is located in the southeastern corner of Mississippi, and is bordered by the states of Louisiana and Alabama. The county is located in the Coastal Plain region of Mississippi, and is characterized by flat terrain and sandy soils. The county is drained by the Leaf River, which flows through the county from north to south. The county has a total area of 590 square miles, of which 586 square miles is land and 4 square miles is water.
Demographics
As of the 2010 census, there were 12,487 people, 4,717 households, and 3,323 families residing in the county. The population density was 21 people per square mile. There were 5,541 housing units at an average density of 9 per square mile. The racial makeup of the county was 68.2% White, 29.3% Black or African American, 0.3% Native American, 0.2% Asian, 0.1% Pacific Islander, 0.7% from other races, and 1.4% from two or more races. 1.7% of the population were Hispanic or Latino of any race.
There were 4,717 households, out of which 32.2% had children under the age of 18 living with them, 48.2% were married couples living together, 17.2% had a female householder with no husband present, and 29.2% were non-families. 25.2% of all households were made up of individuals, and 11.2% had someone living alone who was 65 years of age or older. The average household size was 2.60 and the average family size was 3.11.
In the county, the population was spread out, with 26.2% under the age of 18, 8.7% from 18 to 24, 26.2% from 25 to 44, 24.2% from 45 to 64, and 14.7% who were 65 years of age or older. The median age was 37 years. For every 100 females there were 93.2 males. For every 100 females age 18 and over, there were 89.2 males.
The median income for a household in the county was $27,945, and the median income for a family was $33,945. Males had a median income of $30,945 versus $20,945 for females. The per capita income for the county was $14,945. About 17.2% of families and 20.2% of the population were below the poverty line, including 28.2% of those under age 18 and 17.2% of those age 65 or over.
Economy
The economy of Jefferson Davis County is largely based on agriculture and forestry. The county is home to a number of large timber companies, and the timber industry is the largest employer in the county. Other major industries in the county include manufacturing, retail, and healthcare.
The county is home to a number of large employers, including the Mississippi Forestry Commission, the Mississippi Department of Corrections, and the Mississippi Department of Transportation. The county is also home to a number of small businesses, including restaurants, retail stores, and service providers.
The county is served by the Jefferson Davis County School District, which operates a number of public schools in the county. The county is also home to a number of private schools, including the Prentiss Christian School and the Jefferson Davis Academy.
Conclusion
Jefferson Davis County is located in the southeastern corner of Mississippi, and is bordered by the states of Louisiana and Alabama. The county was named after the President of the Confederate States of America, Jefferson Davis. The county has a total area of 590 square miles, and is characterized by flat terrain and sandy soils. As of the 2010 census, there were 12,487 people, 4,717 households, and 3,323 families residing in the county. The economy of Jefferson Davis County is largely based on agriculture and forestry, and the county is home to a number of large employers, including the Mississippi Forestry Commission, the Mississippi Department of Corrections, and the Mississippi Department of Transportation. The county is served by the Jefferson Davis County School District, which operates a number of public schools in the county.
Common Questions
What is the Total Population of Jefferson Davis County?
Total Population of Jefferson Davis County is 11,291.
What is the Total Male Population of Jefferson Davis County?
Total Male Population of Jefferson Davis County is 5,386.
What is the Total Female Population of Jefferson Davis County?
Total Female Population of Jefferson Davis County is 5,905.
What is the Ratio of Males per 100 Females in Jefferson Davis County?
There are 91.21 Males per 100 Females in Jefferson Davis County.
What is the Ratio of Females per 100 Males in Jefferson Davis County?
There are 109.64 Females per 100 Males in Jefferson Davis County.
What is the Median Population Age in Jefferson Davis County?
Median Population Age in Jefferson Davis County is 44.5 Years.
What is the Average Family Size in Jefferson Davis County
Average Family Size in Jefferson Davis County is 3.2 People.
What is the Average Household Size in Jefferson Davis County
Average Household Size in Jefferson Davis County is 2.5 People.
What is Per Capita Income in Jefferson Davis County?
Per Capita income in Jefferson Davis County is $22,693.
What is the Median Family Income in Jefferson Davis County?
Median Family Income in Jefferson Davis County is $55,145.
What is the Median Household income in Jefferson Davis County?
Median Household Income in Jefferson Davis County is $36,473.
What is Income or Wage Gap in Jefferson Davis County?
Income or Wage Gap in Jefferson Davis County is 3.4%.
Women in Jefferson Davis County earn 96.6 cents for every dollar earned by a man.
What is Family Income Deficit in Jefferson Davis County?
Family Income Deficit in Jefferson Davis County is $11,952.
Families that are below poverty line in Jefferson Davis County earn $11,952 less on average than the poverty threshold level.
What is Inequality or Gini Index in Jefferson Davis County?
Inequality or Gini Index in Jefferson Davis County is 0.46.
How Large is the Labor Force in Jefferson Davis County?
There are 4,953 People in the Labor Forcein in Jefferson Davis County.
What is the Percentage of People in the Labor Force in Jefferson Davis County?
53.4% of People are in the Labor Force in Jefferson Davis County.
What is the Unemployment Rate in Jefferson Davis County?
Unemployment Rate in Jefferson Davis County is 9.2%.