Itawamba County, MS
Itawamba County Map

Itawamba County Overview
23,888
TOTAL POPULATION
11,861
MALE POPULATION
12,027
FEMALE POPULATION
98.62
MALES / 100 FEMALES
101.40
FEMALES / 100 MALES
39.9
MEDIAN AGE
3.0
AVG FAMILY SIZE
2.5
AVG HOUSEHOLD SIZE
$33,243
PER CAPITA INCOME
$68,647
AVG FAMILY INCOME
$57,252
AVG HOUSEHOLD INCOME
25.5%
WAGE / INCOME GAP [ % ]
74.5¢/ $1
WAGE / INCOME GAP [ $ ]
$7,991
FAMILY INCOME DEFICIT
0.49
INEQUALITY / GINI INDEX
11,220
LABOR FORCE [ PEOPLE ]
57.9%
PERCENT IN LABOR FORCE
2.8%
UNEMPLOYMENT RATE
Itawamba County Area Codes
Race in Itawamba County
The most populous races in Itawamba County are White / Caucasian (21,470 | 89.9%), Black / African American (1,439 | 6.0%), and Two or more Races (642 | 2.7%).

| Race | # Population | % Population |
| Asian | 49 | 0.2% |
| Black / African American | 1,439 | 6.0% |
| Hawaiian / Pacific | 6 | 0.0% |
| Hispanic or Latino | 430 | 1.8% |
| Native / Alaskan | 89 | 0.4% |
| White / Caucasian | 21,470 | 89.9% |
| Two or more Races | 642 | 2.7% |
| Some other Race | 193 | 0.8% |
| Total | 23,888 | 100.0% |
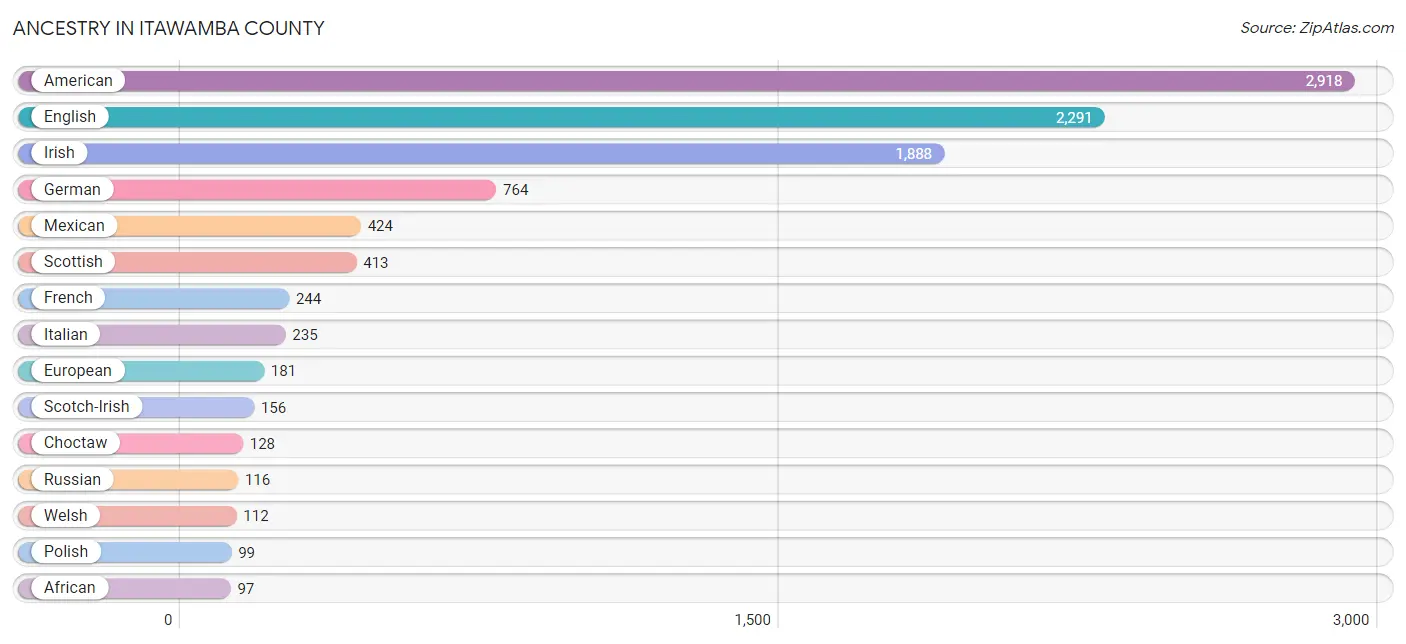
Ancestry in Itawamba County
The most populous ancestries reported in Itawamba County are American (2,918 | 12.2%), English (2,291 | 9.6%), Irish (1,888 | 7.9%), German (764 | 3.2%), and Mexican (424 | 1.8%), together accounting for 34.7% of all Itawamba County residents.
| Ancestry | # Population | % Population |
| African | 97 | 0.4% |
| American | 2,918 | 12.2% |
| Arab | 22 | 0.1% |
| Blackfeet | 32 | 0.1% |
| British | 28 | 0.1% |
| Canadian | 18 | 0.1% |
| Cherokee | 71 | 0.3% |
| Choctaw | 128 | 0.5% |
| Creek | 19 | 0.1% |
| Croatian | 18 | 0.1% |
| Czechoslovakian | 3 | 0.0% |
| Danish | 6 | 0.0% |
| Dutch | 62 | 0.3% |
| English | 2,291 | 9.6% |
| European | 181 | 0.8% |
| Finnish | 1 | 0.0% |
| French | 244 | 1.0% |
| French Canadian | 9 | 0.0% |
| German | 764 | 3.2% |
| Greek | 26 | 0.1% |
| Hungarian | 21 | 0.1% |
| Irish | 1,888 | 7.9% |
| Italian | 235 | 1.0% |
| Jordanian | 4 | 0.0% |
| Mexican | 424 | 1.8% |
| Northern European | 10 | 0.0% |
| Norwegian | 12 | 0.1% |
| Polish | 99 | 0.4% |
| Puerto Rican | 2 | 0.0% |
| Russian | 116 | 0.5% |
| Scotch-Irish | 156 | 0.6% |
| Scottish | 413 | 1.7% |
| Spaniard | 1 | 0.0% |
| Subsaharan African | 97 | 0.4% |
| Swedish | 15 | 0.1% |
| Thai | 49 | 0.2% |
| Welsh | 112 | 0.5% | View All 37 Rows |
Immigrants in Itawamba County
The most numerous immigrant groups reported in Itawamba County came from Europe (77 | 0.3%), England (49 | 0.2%), Northern Europe (49 | 0.2%), Canada (18 | 0.1%), and Eastern Europe (15 | 0.1%), together accounting for 0.9% of all Itawamba County residents.

| Immigration Origin | # Population | % Population |
| Brazil | 2 | 0.0% |
| Canada | 18 | 0.1% |
| Central America | 13 | 0.1% |
| Eastern Europe | 15 | 0.1% |
| England | 49 | 0.2% |
| Europe | 77 | 0.3% |
| Germany | 13 | 0.1% |
| Latin America | 15 | 0.1% |
| Lithuania | 15 | 0.1% |
| Mexico | 13 | 0.1% |
| Northern Europe | 49 | 0.2% |
| Oceania | 6 | 0.0% |
| South America | 2 | 0.0% |
| Western Europe | 13 | 0.1% | View All 14 Rows |
Sex and Age in Itawamba County
Sex and Age in Itawamba County
The most populous age groups in Itawamba County are 15 to 19 Years (1,164 | 9.8%) for men and 15 to 19 Years (994 | 8.3%) for women.

| Age Bracket | Male | Female |
| Under 5 Years | 609 (5.1%) | 632 (5.2%) |
| 5 to 9 Years | 665 (5.6%) | 693 (5.8%) |
| 10 to 14 Years | 779 (6.6%) | 730 (6.1%) |
| 15 to 19 Years | 1,164 (9.8%) | 994 (8.3%) |
| 20 to 24 Years | 886 (7.5%) | 739 (6.1%) |
| 25 to 29 Years | 727 (6.1%) | 749 (6.2%) |
| 30 to 34 Years | 715 (6.0%) | 692 (5.8%) |
| 35 to 39 Years | 666 (5.6%) | 538 (4.5%) |
| 40 to 44 Years | 694 (5.9%) | 902 (7.5%) |
| 45 to 49 Years | 855 (7.2%) | 794 (6.6%) |
| 50 to 54 Years | 772 (6.5%) | 786 (6.5%) |
| 55 to 59 Years | 940 (7.9%) | 724 (6.0%) |
| 60 to 64 Years | 546 (4.6%) | 725 (6.0%) |
| 65 to 69 Years | 721 (6.1%) | 687 (5.7%) |
| 70 to 74 Years | 406 (3.4%) | 537 (4.5%) |
| 75 to 79 Years | 397 (3.4%) | 423 (3.5%) |
| 80 to 84 Years | 128 (1.1%) | 363 (3.0%) |
| 85 Years and over | 191 (1.6%) | 319 (2.6%) |
| Total | 11,861 (100.0%) | 12,027 (100.0%) |
Families and Households in Itawamba County
Median Family Size in Itawamba County
The median family size in Itawamba County is 2.96 persons per family, with married-couple families (4,652 | 75.0%) accounting for the largest median family size of 3.12 persons per family. On the other hand, single male/father families (474 | 7.6%) represent the smallest median family size with 2.38 persons per family.

| Family Type | # Families | Family Size |
| Married-Couple | 4,652 (75.0%) | 3.12 |
| Single Male/Father | 474 (7.6%) | 2.38 |
| Single Female/Mother | 1,077 (17.4%) | 2.54 |
| Total Families | 6,203 (100.0%) | 2.96 |
Median Household Size in Itawamba County
The median household size in Itawamba County is 2.53 persons per household, with married-couple households (4,652 | 51.8%) accounting for the largest median household size of 3.17 persons per household. non-family households (2,773 | 30.9%) represent the smallest median household size with 1.36 persons per household.

| Household Type | # Households | Household Size |
| Married-Couple | 4,652 (51.8%) | 3.17 |
| Single Male/Father | 474 (5.3%) | 2.67 |
| Single Female/Mother | 1,077 (12.0%) | 2.72 |
| Non-family | 2,773 (30.9%) | 1.36 |
| Total Households | 8,976 (100.0%) | 2.53 |
Household Size by Marriage Status in Itawamba County
Out of a total of 8,976 households in Itawamba County, 6,203 (69.1%) are family households, while 2,773 (30.9%) are nonfamily households. The most numerous type of family households are 2-person households, comprising 3,182, and the most common type of nonfamily households are 1-person households, comprising 2,161.

| Household Size | Family Households | Nonfamily Households |
| 1-Person Households | - | 2,161 (24.1%) |
| 2-Person Households | 3,182 (35.4%) | 494 (5.5%) |
| 3-Person Households | 1,244 (13.9%) | 73 (0.8%) |
| 4-Person Households | 1,085 (12.1%) | 0 (0.0%) |
| 5-Person Households | 444 (5.0%) | 45 (0.5%) |
| 6-Person Households | 176 (2.0%) | 0 (0.0%) |
| 7+ Person Households | 72 (0.8%) | 0 (0.0%) |
| Total | 6,203 (69.1%) | 2,773 (30.9%) |
Female Fertility in Itawamba County
Fertility by Age in Itawamba County
Average fertility rate in Itawamba County is 57.0 births per 1,000 women. Women in the age bracket of 20 to 34 years have the highest fertility rate with 127.0 births per 1,000 women. Women in the age bracket of 20 to 34 years acount for 87.1% of all women with births.

| Age Bracket | Women with Births | Births / 1,000 Women |
| 15 to 19 years | 0 (0.0%) | 0.0 |
| 20 to 34 years | 277 (87.1%) | 127.0 |
| 35 to 50 years | 41 (12.9%) | 17.0 |
| Total | 318 (100.0%) | 57.0 |
Fertility by Age by Marriage Status in Itawamba County
95.6% of women with births (318) in Itawamba County are married. The highest percentage of unmarried women with births falls into 20 to 34 years age bracket with 5.1% of them unmarried at the time of birth, while the lowest percentage of unmarried women with births belong to 35 to 50 years age bracket with 0.0% of them unmarried.

| Age Bracket | Married | Unmarried |
| 15 to 19 years | 0 (0.0%) | 0 (0.0%) |
| 20 to 34 years | 263 (95.0%) | 14 (5.1%) |
| 35 to 50 years | 41 (100.0%) | 0 (0.0%) |
| Total | 304 (95.6%) | 14 (4.4%) |
Fertility by Education in Itawamba County

| Educational Attainment | Women with Births | Births / 1,000 Women |
| Less than High School | 0 (0.0%) | 0.0 |
| High School Diploma | 13 (4.1%) | 8.0 |
| College or Associate's Degree | 163 (51.3%) | 67.0 |
| Bachelor's Degree | 33 (10.4%) | 81.0 |
| Graduate Degree | 109 (34.3%) | 404.0 |
| Total | 318 (100.0%) | 57.0 |
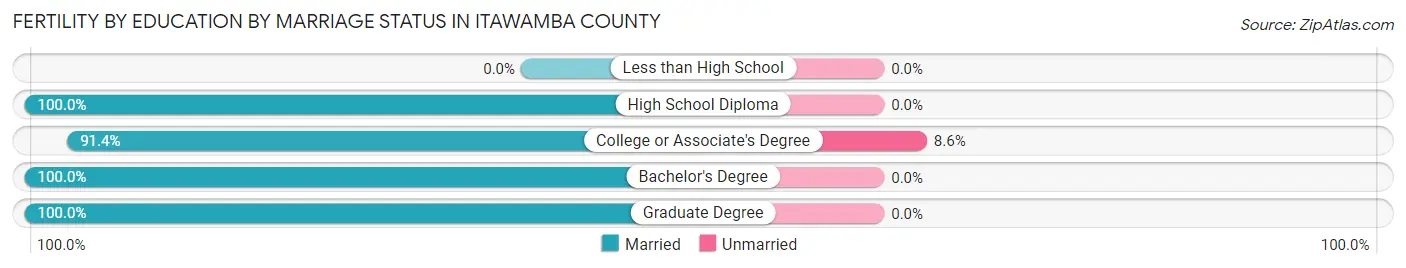
Fertility by Education by Marriage Status in Itawamba County
4.4% of women with births in Itawamba County are unmarried. Women with the educational attainment of high school diploma are most likely to be married with 100.0% of them married at childbirth, while women with the educational attainment of college or associate's degree are least likely to be married with 8.6% of them unmarried at childbirth.
| Educational Attainment | Married | Unmarried |
| Less than High School | 0 (0.0%) | 0 (0.0%) |
| High School Diploma | 13 (100.0%) | 0 (0.0%) |
| College or Associate's Degree | 149 (91.4%) | 14 (8.6%) |
| Bachelor's Degree | 33 (100.0%) | 0 (0.0%) |
| Graduate Degree | 109 (100.0%) | 0 (0.0%) |
| Total | 304 (95.6%) | 14 (4.4%) |
Income in Itawamba County
Income Overview in Itawamba County
Per Capita Income in Itawamba County is $33,243, while median incomes of families and households are $68,647 and $57,252 respectively.
| Characteristic | Number | Measure |
| Per Capita Income | 23,888 | $33,243 |
| Median Family Income | 6,203 | $68,647 |
| Mean Family Income | 6,203 | $89,909 |
| Median Household Income | 8,976 | $57,252 |
| Mean Household Income | 8,976 | $82,383 |
| Income Deficit | 6,203 | $7,991 |
| Wage / Income Gap (%) | 23,888 | 25.45% |
| Wage / Income Gap ($) | 23,888 | 74.55¢ per $1 |
| Gini / Inequality Index | 23,888 | 0.49 |
Earnings by Sex in Itawamba County
Average Earnings in Itawamba County are $34,982, $40,478 for men and $30,175 for women, a difference of 25.5%.

| Sex | Number | Average Earnings |
| Male | 6,203 (53.3%) | $40,478 |
| Female | 5,428 (46.7%) | $30,175 |
| Total | 11,631 (100.0%) | $34,982 |
Earnings by Sex by Income Bracket in Itawamba County
The most common earnings brackets in Itawamba County are $75,000 to $99,999 for men (655 | 10.6%) and $30,000 to $34,999 for women (650 | 12.0%).

| Income | Male | Female |
| $2,499 or less | 161 (2.6%) | 215 (4.0%) |
| $2,500 to $4,999 | 212 (3.4%) | 188 (3.5%) |
| $5,000 to $7,499 | 74 (1.2%) | 145 (2.7%) |
| $7,500 to $9,999 | 118 (1.9%) | 153 (2.8%) |
| $10,000 to $12,499 | 165 (2.7%) | 249 (4.6%) |
| $12,500 to $14,999 | 67 (1.1%) | 156 (2.9%) |
| $15,000 to $17,499 | 111 (1.8%) | 266 (4.9%) |
| $17,500 to $19,999 | 226 (3.6%) | 144 (2.6%) |
| $20,000 to $22,499 | 59 (0.9%) | 372 (6.9%) |
| $22,500 to $24,999 | 178 (2.9%) | 303 (5.6%) |
| $25,000 to $29,999 | 610 (9.8%) | 508 (9.4%) |
| $30,000 to $34,999 | 491 (7.9%) | 650 (12.0%) |
| $35,000 to $39,999 | 567 (9.1%) | 317 (5.8%) |
| $40,000 to $44,999 | 408 (6.6%) | 411 (7.6%) |
| $45,000 to $49,999 | 210 (3.4%) | 215 (4.0%) |
| $50,000 to $54,999 | 358 (5.8%) | 145 (2.7%) |
| $55,000 to $64,999 | 617 (10.0%) | 309 (5.7%) |
| $65,000 to $74,999 | 588 (9.5%) | 417 (7.7%) |
| $75,000 to $99,999 | 655 (10.6%) | 225 (4.2%) |
| $100,000+ | 328 (5.3%) | 40 (0.7%) |
| Total | 6,203 (100.0%) | 5,428 (100.0%) |
Earnings by Sex by Educational Attainment in Itawamba County
Average earnings in Itawamba County are $44,856 for men and $33,718 for women, a difference of 24.8%. Men with an educational attainment of graduate degree enjoy the highest average annual earnings of $80,625, while those with less than high school education earn the least with $33,569. Women with an educational attainment of graduate degree earn the most with the average annual earnings of $57,049, while those with less than high school education have the smallest earnings of $20,945.

| Educational Attainment | Male Income | Female Income |
| Less than High School | $33,569 | $20,945 |
| High School Diploma | $50,035 | $28,633 |
| College or Associate's Degree | $40,955 | $33,665 |
| Bachelor's Degree | $49,250 | $42,790 |
| Graduate Degree | $80,625 | $57,049 |
| Total | $44,856 | $33,718 |
Family Income in Itawamba County
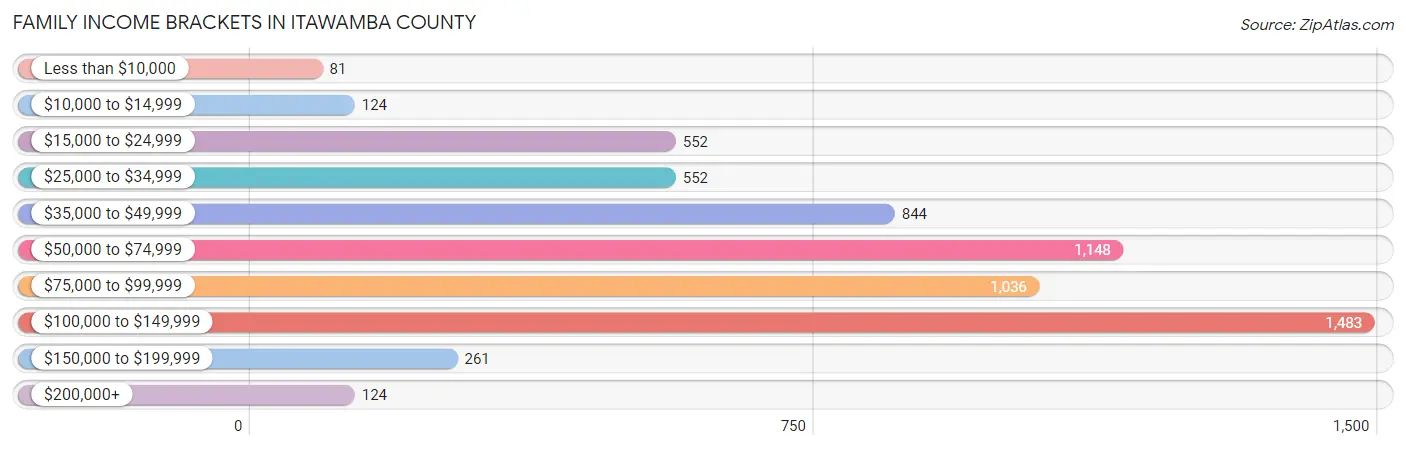
Family Income Brackets in Itawamba County
According to the Itawamba County family income data, there are 1,483 families falling into the $100,000 to $149,999 income range, which is the most common income bracket and makes up 23.9% of all families. Conversely, the less than $10,000 income bracket is the least frequent group with only 81 families (1.3%) belonging to this category.
| Income Bracket | # Families | % Families |
| Less than $10,000 | 81 | 1.3% |
| $10,000 to $14,999 | 124 | 2.0% |
| $15,000 to $24,999 | 552 | 8.9% |
| $25,000 to $34,999 | 552 | 8.9% |
| $35,000 to $49,999 | 844 | 13.6% |
| $50,000 to $74,999 | 1,148 | 18.5% |
| $75,000 to $99,999 | 1,036 | 16.7% |
| $100,000 to $149,999 | 1,483 | 23.9% |
| $150,000 to $199,999 | 261 | 4.2% |
| $200,000+ | 124 | 2.0% |
Family Income by Famaliy Size in Itawamba County
5-person families (366 | 5.9%) account for the highest median family income in Itawamba County with $105,096 per family, while 2-person families (3,418 | 55.1%) have the highest median income of $29,456 per family member.

| Income Bracket | # Families | Median Income |
| 2-Person Families | 3,418 (55.1%) | $58,912 |
| 3-Person Families | 1,172 (18.9%) | $82,813 |
| 4-Person Families | 1,009 (16.3%) | $69,421 |
| 5-Person Families | 366 (5.9%) | $105,096 |
| 6-Person Families | 167 (2.7%) | $98,066 |
| 7+ Person Families | 71 (1.1%) | $78,750 |
| Total | 6,203 (100.0%) | $68,647 |
Family Income by Number of Earners in Itawamba County
The median family income in Itawamba County is $68,647, with families comprising 3+ earners (575) having the highest median family income of $106,406, while families with no earners (1,135) have the lowest median family income of $36,949, accounting for 9.3% and 18.3% of families, respectively.

| Number of Earners | # Families | Median Income |
| No Earners | 1,135 (18.3%) | $36,949 |
| 1 Earner | 1,959 (31.6%) | $50,034 |
| 2 Earners | 2,534 (40.8%) | $92,089 |
| 3+ Earners | 575 (9.3%) | $106,406 |
| Total | 6,203 (100.0%) | $68,647 |
Household Income in Itawamba County
Household Income Brackets in Itawamba County
With 1,580 households falling in the category, the $100,000 to $149,999 income range is the most frequent in Itawamba County, accounting for 17.6% of all households. In contrast, only 180 households (2.0%) fall into the $200,000+ income bracket, making it the least populous group.

| Income Bracket | # Households | % Households |
| Less than $10,000 | 332 | 3.7% |
| $10,000 to $14,999 | 548 | 6.1% |
| $15,000 to $24,999 | 862 | 9.6% |
| $25,000 to $34,999 | 1,005 | 11.2% |
| $35,000 to $49,999 | 1,328 | 14.8% |
| $50,000 to $74,999 | 1,373 | 15.3% |
| $75,000 to $99,999 | 1,490 | 16.6% |
| $100,000 to $149,999 | 1,580 | 17.6% |
| $150,000 to $199,999 | 269 | 3.0% |
| $200,000+ | 180 | 2.0% |
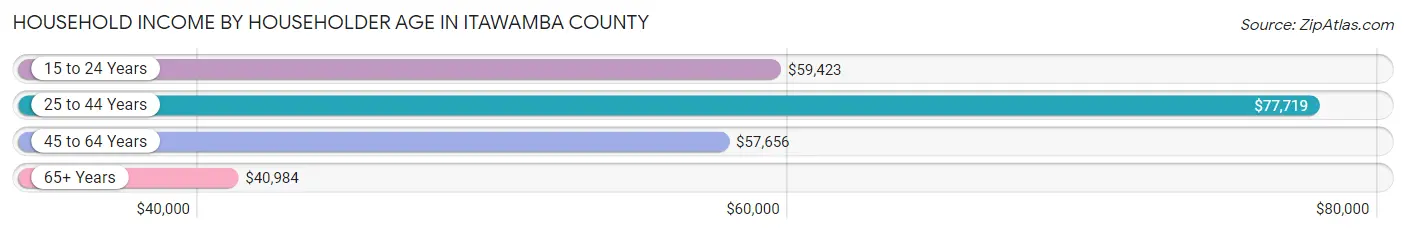
Household Income by Householder Age in Itawamba County
The median household income in Itawamba County is $57,252, with the highest median household income of $77,719 found in the 25 to 44 years age bracket for the primary householder. A total of 2,543 households (28.3%) fall into this category. Meanwhile, the 65+ years age bracket for the primary householder has the lowest median household income of $40,984, with 2,651 households (29.5%) in this group.
| Income Bracket | # Households | Median Income |
| 15 to 24 Years | 468 (5.2%) | $59,423 |
| 25 to 44 Years | 2,543 (28.3%) | $77,719 |
| 45 to 64 Years | 3,314 (36.9%) | $57,656 |
| 65+ Years | 2,651 (29.5%) | $40,984 |
| Total | 8,976 (100.0%) | $57,252 |
Poverty in Itawamba County
Income Below Poverty by Sex and Age in Itawamba County
With 7.7% poverty level for males and 13.1% for females among the residents of Itawamba County, 6 to 11 year old males and 16 and 17 year old females are the most vulnerable to poverty, with 107 males (13.4%) and 90 females (24.9%) in their respective age groups living below the poverty level.

| Age Bracket | Male | Female |
| Under 5 Years | 76 (13.2%) | 59 (10.1%) |
| 5 Years | 2 (2.2%) | 9 (4.8%) |
| 6 to 11 Years | 107 (13.4%) | 32 (5.5%) |
| 12 to 14 Years | 19 (4.3%) | 14 (3.7%) |
| 15 Years | 0 (0.0%) | 13 (12.5%) |
| 16 and 17 Years | 15 (8.6%) | 90 (24.9%) |
| 18 to 24 Years | 103 (10.1%) | 214 (21.1%) |
| 25 to 34 Years | 25 (1.8%) | 135 (9.4%) |
| 35 to 44 Years | 127 (9.4%) | 217 (15.1%) |
| 45 to 54 Years | 119 (7.3%) | 125 (7.9%) |
| 55 to 64 Years | 126 (8.6%) | 291 (20.2%) |
| 65 to 74 Years | 63 (5.7%) | 146 (12.2%) |
| 75 Years and over | 71 (10.5%) | 126 (13.3%) |
| Total | 853 (7.7%) | 1,471 (13.1%) |
Income Above Poverty by Sex and Age in Itawamba County
According to the poverty statistics in Itawamba County, males aged 15 years and females aged 12 to 14 years are the age groups that are most secure financially, with 100.0% of males and 96.3% of females in these age groups living above the poverty line.
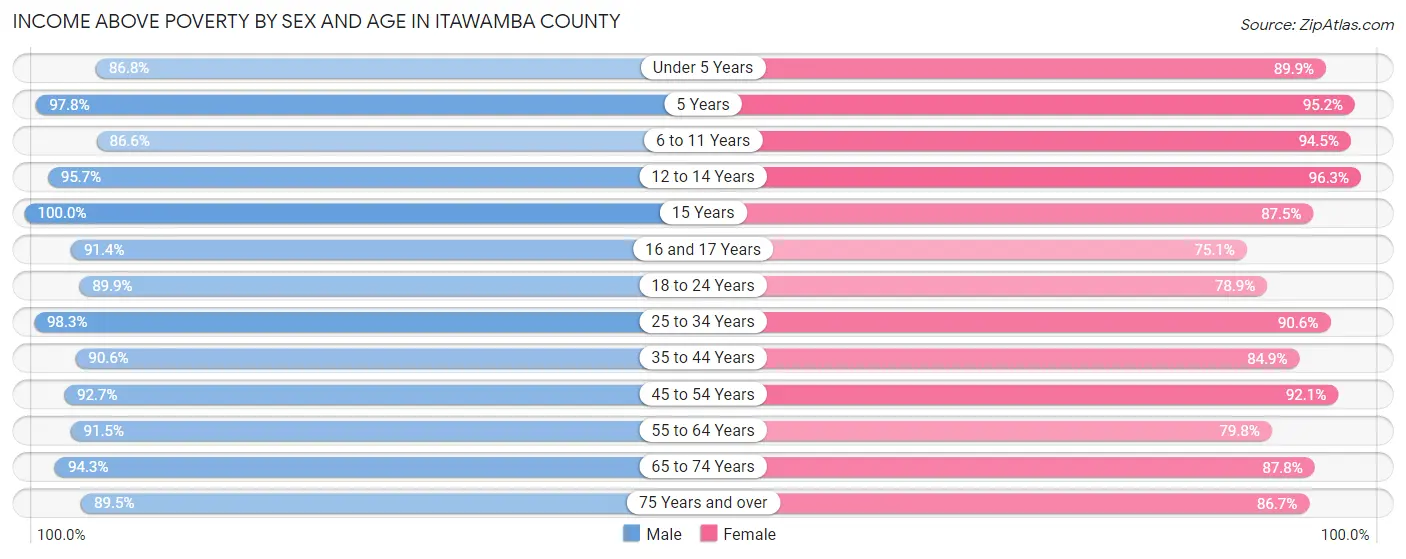
| Age Bracket | Male | Female |
| Under 5 Years | 498 (86.8%) | 523 (89.9%) |
| 5 Years | 90 (97.8%) | 180 (95.2%) |
| 6 to 11 Years | 694 (86.6%) | 546 (94.5%) |
| 12 to 14 Years | 422 (95.7%) | 368 (96.3%) |
| 15 Years | 297 (100.0%) | 91 (87.5%) |
| 16 and 17 Years | 159 (91.4%) | 272 (75.1%) |
| 18 to 24 Years | 913 (89.9%) | 801 (78.9%) |
| 25 to 34 Years | 1,404 (98.3%) | 1,306 (90.6%) |
| 35 to 44 Years | 1,218 (90.6%) | 1,222 (84.9%) |
| 45 to 54 Years | 1,506 (92.7%) | 1,455 (92.1%) |
| 55 to 64 Years | 1,348 (91.4%) | 1,148 (79.8%) |
| 65 to 74 Years | 1,048 (94.3%) | 1,046 (87.7%) |
| 75 Years and over | 606 (89.5%) | 823 (86.7%) |
| Total | 10,203 (92.3%) | 9,781 (86.9%) |
Income Below Poverty Among Married-Couple Families in Itawamba County
The poverty statistics for married-couple families in Itawamba County show that 2.6% or 119 of the total 4,652 families live below the poverty line. Families with 3 or 4 children have the highest poverty rate of 11.3%, comprising of 43 families. On the other hand, families with 5 or more children have the lowest poverty rate of 0.0%, which includes 0 families.

| Children | Above Poverty | Below Poverty |
| No Children | 2,791 (99.0%) | 27 (1.0%) |
| 1 or 2 Children | 1,367 (96.5%) | 49 (3.5%) |
| 3 or 4 Children | 338 (88.7%) | 43 (11.3%) |
| 5 or more Children | 37 (100.0%) | 0 (0.0%) |
| Total | 4,533 (97.4%) | 119 (2.6%) |
Income Below Poverty Among Single-Parent Households in Itawamba County
According to the poverty data in Itawamba County, 17.5% or 83 single-father households and 17.7% or 191 single-mother households are living below the poverty line. Among single-father households, those with 3 or 4 children have the highest poverty rate, with 1 households (100.0%) experiencing poverty. Likewise, among single-mother households, those with 3 or 4 children have the highest poverty rate, with 5 households (83.3%) falling below the poverty line.

| Children | Single Father | Single Mother |
| No Children | 82 (28.9%) | 66 (12.7%) |
| 1 or 2 Children | 0 (0.0%) | 120 (21.8%) |
| 3 or 4 Children | 1 (100.0%) | 5 (83.3%) |
| 5 or more Children | 0 (0.0%) | 0 (0.0%) |
| Total | 83 (17.5%) | 191 (17.7%) |
Income Below Poverty Among Married-Couple vs Single-Parent Households in Itawamba County
The poverty data for Itawamba County shows that 119 of the married-couple family households (2.6%) and 274 of the single-parent households (17.7%) are living below the poverty level. Within the married-couple family households, those with 3 or 4 children have the highest poverty rate, with 43 households (11.3%) falling below the poverty line. Among the single-parent households, those with 3 or 4 children have the highest poverty rate, with 6 household (85.7%) living below poverty.

| Children | Married-Couple Families | Single-Parent Households |
| No Children | 27 (1.0%) | 148 (18.4%) |
| 1 or 2 Children | 49 (3.5%) | 120 (16.2%) |
| 3 or 4 Children | 43 (11.3%) | 6 (85.7%) |
| 5 or more Children | 0 (0.0%) | 0 (0.0%) |
| Total | 119 (2.6%) | 274 (17.7%) |
Employment Characteristics in Itawamba County
Employment by Class of Employer in Itawamba County
Among the 10,630 employed individuals in Itawamba County, private company employees (7,975 | 75.0%), self-employed (not incorporated) (697 | 6.6%), and state government employees (625 | 5.9%) make up the most common classes of employment.

| Employer Class | # Employees | % Employees |
| Private Company Employees | 7,975 | 75.0% |
| Self-Employed (Incorporated) | 182 | 1.7% |
| Self-Employed (Not Incorporated) | 697 | 6.6% |
| Not-for-profit Organizations | 476 | 4.5% |
| Local Government Employees | 524 | 4.9% |
| State Government Employees | 625 | 5.9% |
| Federal Government Employees | 132 | 1.2% |
| Unpaid Family Workers | 19 | 0.2% |
| Total | 10,630 | 100.0% |
Employment Status by Age in Itawamba County
According to the labor force statistics for Itawamba County, out of the total population over 16 years of age (19,379), 57.9% or 11,220 individuals are in the labor force, with 2.8% or 314 of them unemployed. The age group with the highest labor force participation rate is 25 to 29 years, with 85.6% or 1,263 individuals in the labor force. Within the labor force, the 75 years and over age range has the highest percentage of unemployed individuals, with 14.8% or 4 of them being unemployed.

| Age Bracket | In Labor Force | Unemployed |
| 16 to 19 Years | 485 (27.6%) | 56 (11.5%) |
| 20 to 24 Years | 1,276 (78.5%) | 34 (2.7%) |
| 25 to 29 Years | 1,263 (85.6%) | 67 (5.3%) |
| 30 to 34 Years | 1,145 (81.4%) | 38 (3.3%) |
| 35 to 44 Years | 2,276 (81.3%) | 80 (3.5%) |
| 45 to 54 Years | 2,553 (79.6%) | 3 (0.1%) |
| 55 to 59 Years | 958 (57.6%) | 18 (1.9%) |
| 60 to 64 Years | 513 (40.4%) | 4 (0.8%) |
| 65 to 74 Years | 731 (31.1%) | 12 (1.6%) |
| 75 Years and over | 27 (1.5%) | 4 (14.8%) |
| Total | 11,220 (57.9%) | 314 (2.8%) |
Employment Status by Educational Attainment in Itawamba County
According to labor force statistics for Itawamba County, 73.6% of individuals (8,703) out of the total population between 25 and 64 years of age (11,825) are in the labor force, with 2.4% or 209 of them being unemployed. The group with the highest labor force participation rate are those with the educational attainment of college / associate degree, with 84.1% or 3,712 individuals in the labor force. Within the labor force, individuals with high school diploma education have the highest percentage of unemployment, with 3.8% or 102 of them being unemployed.

| Educational Attainment | In Labor Force | Unemployed |
| Less than High School | 828 (53.4%) | 33 (2.1%) |
| High School Diploma | 2,684 (66.3%) | 154 (3.8%) |
| College / Associate Degree | 3,712 (84.1%) | 62 (1.4%) |
| Bachelor's Degree or higher | 1,484 (81.9%) | 47 (2.6%) |
| Total | 8,703 (73.6%) | 284 (2.4%) |
Employment Occupations by Sex in Itawamba County
Management, Business, Science and Arts Occupations
The most common Management, Business, Science and Arts occupations in Itawamba County are Community & Social Service (892 | 8.2%), Management (823 | 7.6%), Health Diagnosing & Treating (818 | 7.5%), Education Instruction & Library (577 | 5.3%), and Health Technologists (463 | 4.3%).

Management, Business, Science and Arts Occupations by Sex
Within the Management, Business, Science and Arts occupations in Itawamba County, the most male-oriented occupations are Life, Physical & Social Science (100.0%), Business & Financial (75.3%), and Architecture & Engineering (74.2%), while the most female-oriented occupations are Arts, Media & Entertainment (100.0%), Health Technologists (87.7%), and Health Diagnosing & Treating (83.7%).
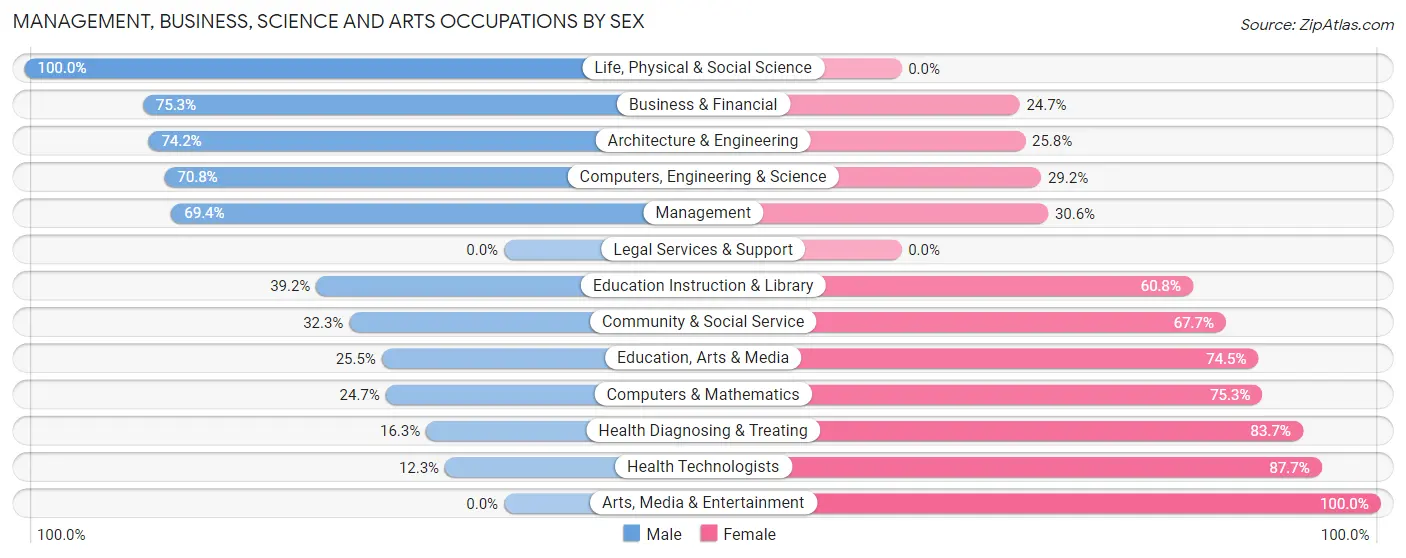
| Occupation | Male | Female |
| Management | 571 (69.4%) | 252 (30.6%) |
| Business & Financial | 113 (75.3%) | 37 (24.7%) |
| Computers, Engineering & Science | 204 (70.8%) | 84 (29.2%) |
| Computers & Mathematics | 20 (24.7%) | 61 (75.3%) |
| Architecture & Engineering | 66 (74.2%) | 23 (25.8%) |
| Life, Physical & Social Science | 118 (100.0%) | 0 (0.0%) |
| Community & Social Service | 288 (32.3%) | 604 (67.7%) |
| Education, Arts & Media | 62 (25.5%) | 181 (74.5%) |
| Legal Services & Support | 0 (0.0%) | 0 (0.0%) |
| Education Instruction & Library | 226 (39.2%) | 351 (60.8%) |
| Arts, Media & Entertainment | 0 (0.0%) | 72 (100.0%) |
| Health Diagnosing & Treating | 133 (16.3%) | 685 (83.7%) |
| Health Technologists | 57 (12.3%) | 406 (87.7%) |
| Total (Category) | 1,309 (44.1%) | 1,662 (55.9%) |
| Total (Overall) | 5,781 (53.2%) | 5,078 (46.8%) |
Services Occupations
The most common Services occupations in Itawamba County are Healthcare Support (523 | 4.8%), Food Preparation & Serving (482 | 4.4%), Cleaning & Maintenance (374 | 3.4%), Security & Protection (196 | 1.8%), and Law Enforcement (165 | 1.5%).
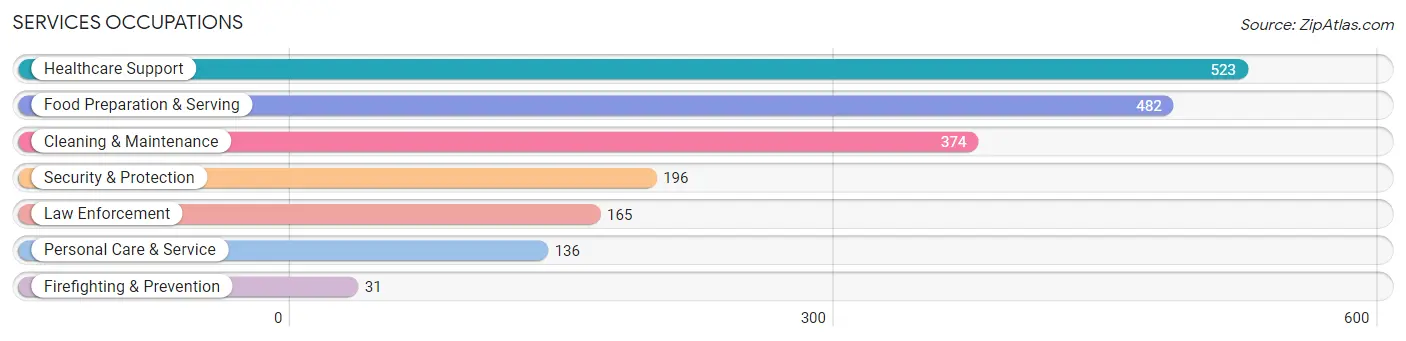
Services Occupations by Sex
Within the Services occupations in Itawamba County, the most male-oriented occupations are Firefighting & Prevention (100.0%), Security & Protection (74.5%), and Law Enforcement (69.7%), while the most female-oriented occupations are Food Preparation & Serving (88.2%), Personal Care & Service (87.5%), and Healthcare Support (85.7%).

| Occupation | Male | Female |
| Healthcare Support | 75 (14.3%) | 448 (85.7%) |
| Security & Protection | 146 (74.5%) | 50 (25.5%) |
| Firefighting & Prevention | 31 (100.0%) | 0 (0.0%) |
| Law Enforcement | 115 (69.7%) | 50 (30.3%) |
| Food Preparation & Serving | 57 (11.8%) | 425 (88.2%) |
| Cleaning & Maintenance | 137 (36.6%) | 237 (63.4%) |
| Personal Care & Service | 17 (12.5%) | 119 (87.5%) |
| Total (Category) | 432 (25.3%) | 1,279 (74.8%) |
| Total (Overall) | 5,781 (53.2%) | 5,078 (46.8%) |
Sales and Office Occupations
The most common Sales and Office occupations in Itawamba County are Office & Administration (1,170 | 10.8%), and Sales & Related (1,053 | 9.7%).

Sales and Office Occupations by Sex
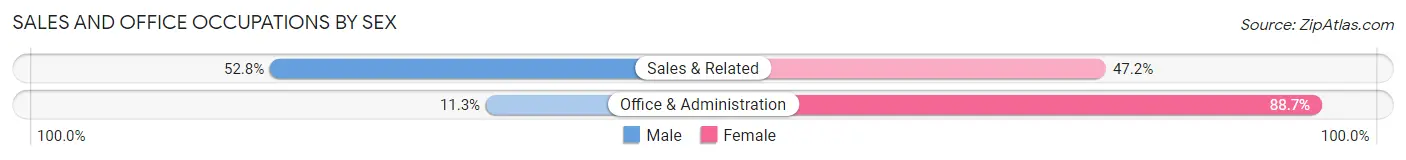
| Occupation | Male | Female |
| Sales & Related | 556 (52.8%) | 497 (47.2%) |
| Office & Administration | 132 (11.3%) | 1,038 (88.7%) |
| Total (Category) | 688 (30.9%) | 1,535 (69.1%) |
| Total (Overall) | 5,781 (53.2%) | 5,078 (46.8%) |
Natural Resources, Construction and Maintenance Occupations
The most common Natural Resources, Construction and Maintenance occupations in Itawamba County are Construction & Extraction (589 | 5.4%), Installation, Maintenance & Repair (505 | 4.6%), and Farming, Fishing & Forestry (173 | 1.6%).

Natural Resources, Construction and Maintenance Occupations by Sex

| Occupation | Male | Female |
| Farming, Fishing & Forestry | 173 (100.0%) | 0 (0.0%) |
| Construction & Extraction | 538 (91.3%) | 51 (8.7%) |
| Installation, Maintenance & Repair | 505 (100.0%) | 0 (0.0%) |
| Total (Category) | 1,216 (96.0%) | 51 (4.0%) |
| Total (Overall) | 5,781 (53.2%) | 5,078 (46.8%) |
Production, Transportation and Moving Occupations
The most common Production, Transportation and Moving occupations in Itawamba County are Production (1,422 | 13.1%), Transportation (641 | 5.9%), and Material Moving (624 | 5.8%).

Production, Transportation and Moving Occupations by Sex

| Occupation | Male | Female |
| Production | 1,014 (71.3%) | 408 (28.7%) |
| Transportation | 574 (89.5%) | 67 (10.4%) |
| Material Moving | 548 (87.8%) | 76 (12.2%) |
| Total (Category) | 2,136 (79.5%) | 551 (20.5%) |
| Total (Overall) | 5,781 (53.2%) | 5,078 (46.8%) |
Employment Industries by Sex in Itawamba County
Employment Industries in Itawamba County
The major employment industries in Itawamba County include Manufacturing (2,729 | 25.1%), Health Care & Social Assistance (1,694 | 15.6%), Retail Trade (1,109 | 10.2%), Construction (923 | 8.5%), and Educational Services (688 | 6.3%).

Employment Industries by Sex in Itawamba County
The Itawamba County industries that see more men than women are Mining, Quarrying, & Extraction (100.0%), Agriculture, Fishing & Hunting (97.3%), and Construction (86.4%), whereas the industries that tend to have a higher number of women are Health Care & Social Assistance (86.2%), Accommodation & Food Services (79.0%), and Finance & Insurance (76.2%).

| Industry | Male | Female |
| Agriculture, Fishing & Hunting | 252 (97.3%) | 7 (2.7%) |
| Mining, Quarrying, & Extraction | 21 (100.0%) | 0 (0.0%) |
| Construction | 797 (86.4%) | 126 (13.7%) |
| Manufacturing | 1,981 (72.6%) | 748 (27.4%) |
| Wholesale Trade | 347 (75.4%) | 113 (24.6%) |
| Retail Trade | 440 (39.7%) | 669 (60.3%) |
| Transportation & Warehousing | 404 (82.0%) | 89 (18.0%) |
| Utilities | 79 (85.0%) | 14 (15.0%) |
| Information | 83 (56.1%) | 65 (43.9%) |
| Finance & Insurance | 73 (23.8%) | 234 (76.2%) |
| Real Estate, Rental & Leasing | 30 (30.9%) | 67 (69.1%) |
| Professional & Scientific | 130 (81.8%) | 29 (18.2%) |
| Enterprise Management | 0 (0.0%) | 0 (0.0%) |
| Administrative & Support | 258 (44.0%) | 328 (56.0%) |
| Educational Services | 258 (37.5%) | 430 (62.5%) |
| Health Care & Social Assistance | 234 (13.8%) | 1,460 (86.2%) |
| Arts, Entertainment & Recreation | 12 (29.3%) | 29 (70.7%) |
| Accommodation & Food Services | 108 (21.0%) | 406 (79.0%) |
| Public Administration | 145 (66.2%) | 74 (33.8%) |
| Total | 5,781 (53.2%) | 5,078 (46.8%) |
Education in Itawamba County
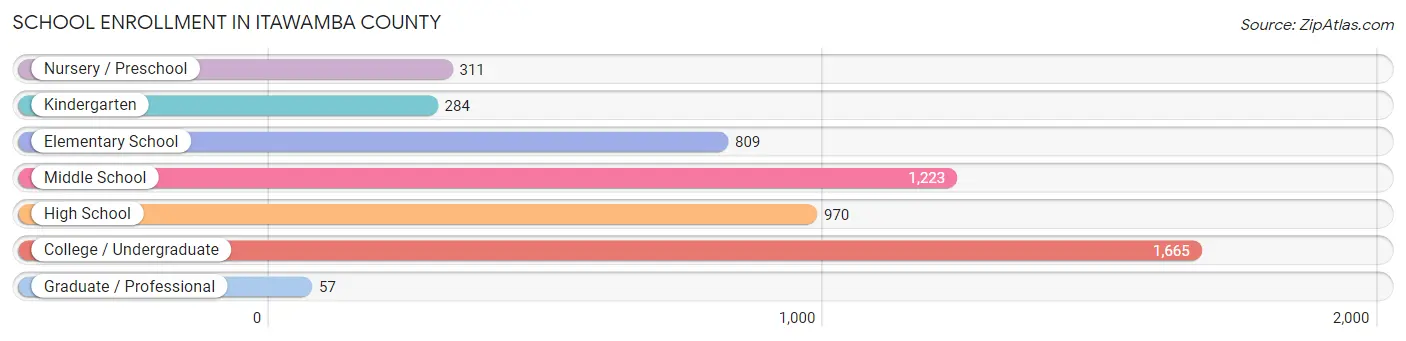
School Enrollment in Itawamba County
The most common levels of schooling among the 5,319 students in Itawamba County are college / undergraduate (1,665 | 31.3%), middle school (1,223 | 23.0%), and high school (970 | 18.2%).
| School Level | # Students | % Students |
| Nursery / Preschool | 311 | 5.9% |
| Kindergarten | 284 | 5.3% |
| Elementary School | 809 | 15.2% |
| Middle School | 1,223 | 23.0% |
| High School | 970 | 18.2% |
| College / Undergraduate | 1,665 | 31.3% |
| Graduate / Professional | 57 | 1.1% |
| Total | 5,319 | 100.0% |
School Enrollment by Age by Funding Source in Itawamba County
Out of a total of 5,319 students who are enrolled in schools in Itawamba County, 745 (14.0%) attend a private institution, while the remaining 4,574 (86.0%) are enrolled in public schools. The age group of 35 years and over has the highest likelihood of being enrolled in private schools, with 111 (62.4% in the age bracket) enrolled. Conversely, the age group of 18 to 19 year olds has the lowest likelihood of being enrolled in a private school, with 968 (99.9% in the age bracket) attending a public institution.

| Age Bracket | Public School | Private School |
| 3 to 4 Year Olds | 64 (71.9%) | 25 (28.1%) |
| 5 to 9 Year Old | 1,089 (89.7%) | 125 (10.3%) |
| 10 to 14 Year Olds | 1,184 (87.2%) | 174 (12.8%) |
| 15 to 17 Year Olds | 793 (91.9%) | 70 (8.1%) |
| 18 to 19 Year Olds | 968 (99.9%) | 1 (0.1%) |
| 20 to 24 Year Olds | 354 (70.4%) | 149 (29.6%) |
| 25 to 34 Year Olds | 57 (39.3%) | 88 (60.7%) |
| 35 Years and over | 67 (37.6%) | 111 (62.4%) |
| Total | 4,574 (86.0%) | 745 (14.0%) |
Educational Attainment by Field of Study in Itawamba County
Business (625 | 24.7%), education (599 | 23.7%), arts & humanities (276 | 10.9%), science & technology (250 | 9.9%), and bio, nature & agricultural (237 | 9.4%) are the most common fields of study among 2,532 individuals in Itawamba County who have obtained a bachelor's degree or higher.

| Field of Study | # Graduates | % Graduates |
| Computers & Mathematics | 15 | 0.6% |
| Bio, Nature & Agricultural | 237 | 9.4% |
| Physical & Health Sciences | 35 | 1.4% |
| Psychology | 57 | 2.2% |
| Social Sciences | 33 | 1.3% |
| Engineering | 58 | 2.3% |
| Multidisciplinary Studies | 24 | 0.9% |
| Science & Technology | 250 | 9.9% |
| Business | 625 | 24.7% |
| Education | 599 | 23.7% |
| Literature & Languages | 66 | 2.6% |
| Liberal Arts & History | 189 | 7.5% |
| Visual & Performing Arts | 42 | 1.7% |
| Communications | 26 | 1.0% |
| Arts & Humanities | 276 | 10.9% |
| Total | 2,532 | 100.0% |
Transportation & Commute in Itawamba County
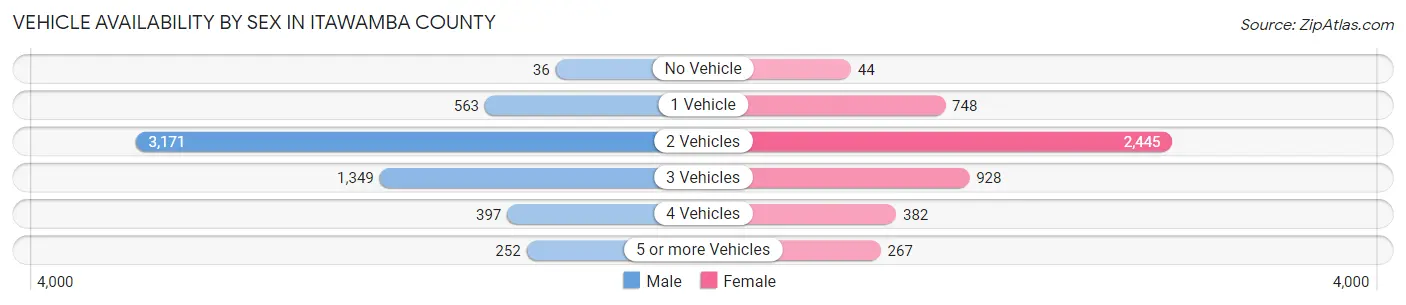
Vehicle Availability by Sex in Itawamba County
The most prevalent vehicle ownership categories in Itawamba County are males with 2 vehicles (3,171, accounting for 55.0%) and females with 2 vehicles (2,445, making up 65.9%).
| Vehicles Available | Male | Female |
| No Vehicle | 36 (0.6%) | 44 (0.9%) |
| 1 Vehicle | 563 (9.8%) | 748 (15.5%) |
| 2 Vehicles | 3,171 (55.0%) | 2,445 (50.8%) |
| 3 Vehicles | 1,349 (23.4%) | 928 (19.3%) |
| 4 Vehicles | 397 (6.9%) | 382 (7.9%) |
| 5 or more Vehicles | 252 (4.4%) | 267 (5.6%) |
| Total | 5,768 (100.0%) | 4,814 (100.0%) |
Commute Time in Itawamba County
The most frequently occuring commute durations in Itawamba County are 30 to 34 minutes (2,320 commuters, 23.0%), 10 to 14 minutes (1,522 commuters, 15.1%), and 15 to 19 minutes (1,188 commuters, 11.8%).

| Commute Time | # Commuters | % Commuters |
| Less than 5 Minutes | 311 | 3.1% |
| 5 to 9 Minutes | 876 | 8.7% |
| 10 to 14 Minutes | 1,522 | 15.1% |
| 15 to 19 Minutes | 1,188 | 11.8% |
| 20 to 24 Minutes | 1,186 | 11.8% |
| 25 to 29 Minutes | 820 | 8.1% |
| 30 to 34 Minutes | 2,320 | 23.0% |
| 35 to 39 Minutes | 449 | 4.4% |
| 40 to 44 Minutes | 653 | 6.5% |
| 45 to 59 Minutes | 406 | 4.0% |
| 60 to 89 Minutes | 254 | 2.5% |
| 90 or more Minutes | 94 | 0.9% |
Commute Time by Sex in Itawamba County
The most common commute times in Itawamba County are 30 to 34 minutes (1,098 commuters, 20.3%) for males and 30 to 34 minutes (1,222 commuters, 26.2%) for females.

| Commute Time | Male | Female |
| Less than 5 Minutes | 229 (4.2%) | 82 (1.8%) |
| 5 to 9 Minutes | 403 (7.4%) | 473 (10.1%) |
| 10 to 14 Minutes | 882 (16.3%) | 640 (13.7%) |
| 15 to 19 Minutes | 698 (12.9%) | 490 (10.5%) |
| 20 to 24 Minutes | 585 (10.8%) | 601 (12.9%) |
| 25 to 29 Minutes | 498 (9.2%) | 322 (6.9%) |
| 30 to 34 Minutes | 1,098 (20.3%) | 1,222 (26.2%) |
| 35 to 39 Minutes | 301 (5.6%) | 148 (3.2%) |
| 40 to 44 Minutes | 355 (6.6%) | 298 (6.4%) |
| 45 to 59 Minutes | 208 (3.8%) | 198 (4.2%) |
| 60 to 89 Minutes | 110 (2.0%) | 144 (3.1%) |
| 90 or more Minutes | 46 (0.9%) | 48 (1.0%) |
Time of Departure to Work by Sex in Itawamba County
The most frequent times of departure to work in Itawamba County are 6:00 AM to 6:29 AM (1,115, 20.6%) for males and 7:00 AM to 7:29 AM (977, 20.9%) for females.

| Time of Departure | Male | Female |
| 12:00 AM to 4:59 AM | 395 (7.3%) | 86 (1.8%) |
| 5:00 AM to 5:29 AM | 271 (5.0%) | 248 (5.3%) |
| 5:30 AM to 5:59 AM | 483 (8.9%) | 197 (4.2%) |
| 6:00 AM to 6:29 AM | 1,115 (20.6%) | 494 (10.6%) |
| 6:30 AM to 6:59 AM | 876 (16.2%) | 687 (14.7%) |
| 7:00 AM to 7:29 AM | 763 (14.1%) | 977 (20.9%) |
| 7:30 AM to 7:59 AM | 459 (8.5%) | 794 (17.0%) |
| 8:00 AM to 8:29 AM | 176 (3.3%) | 225 (4.8%) |
| 8:30 AM to 8:59 AM | 5 (0.1%) | 144 (3.1%) |
| 9:00 AM to 9:59 AM | 47 (0.9%) | 65 (1.4%) |
| 10:00 AM to 10:59 AM | 38 (0.7%) | 65 (1.4%) |
| 11:00 AM to 11:59 AM | 2 (0.0%) | 54 (1.2%) |
| 12:00 PM to 3:59 PM | 453 (8.4%) | 223 (4.8%) |
| 4:00 PM to 11:59 PM | 330 (6.1%) | 407 (8.7%) |
| Total | 5,413 (100.0%) | 4,666 (100.0%) |
Housing Occupancy in Itawamba County
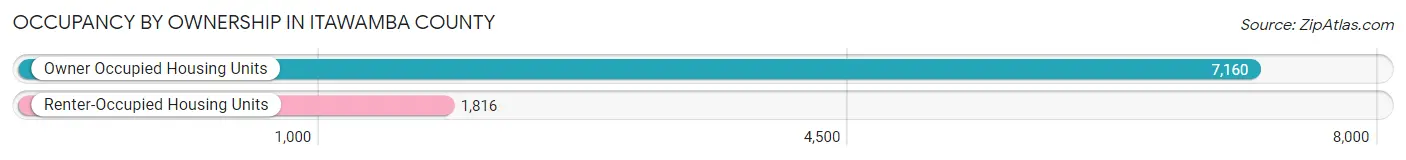
Occupancy by Ownership in Itawamba County
Of the total 8,976 dwellings in Itawamba County, owner-occupied units account for 7,160 (79.8%), while renter-occupied units make up 1,816 (20.2%).
| Occupancy | # Housing Units | % Housing Units |
| Owner Occupied Housing Units | 7,160 | 79.8% |
| Renter-Occupied Housing Units | 1,816 | 20.2% |
| Total Occupied Housing Units | 8,976 | 100.0% |
Occupancy by Household Size in Itawamba County

| Household Size | # Housing Units | % Housing Units |
| 1-Person Household | 2,161 | 24.1% |
| 2-Person Household | 3,676 | 40.9% |
| 3-Person Household | 1,317 | 14.7% |
| 4+ Person Household | 1,822 | 20.3% |
| Total Housing Units | 8,976 | 100.0% |
Occupancy by Ownership by Household Size in Itawamba County

| Household Size | Owner-occupied | Renter-occupied |
| 1-Person Household | 1,746 (80.8%) | 415 (19.2%) |
| 2-Person Household | 2,969 (80.8%) | 707 (19.2%) |
| 3-Person Household | 983 (74.6%) | 334 (25.4%) |
| 4+ Person Household | 1,462 (80.2%) | 360 (19.8%) |
| Total Housing Units | 7,160 (79.8%) | 1,816 (20.2%) |
Occupancy by Educational Attainment in Itawamba County

| Household Size | Owner-occupied | Renter-occupied |
| Less than High School | 783 (75.9%) | 248 (24.0%) |
| High School Diploma | 2,249 (80.4%) | 549 (19.6%) |
| College/Associate Degree | 2,950 (79.7%) | 749 (20.3%) |
| Bachelor's Degree or higher | 1,178 (81.4%) | 270 (18.6%) |
Occupancy by Age of Householder in Itawamba County

| Age Bracket | # Households | % Households |
| Under 35 Years | 1,785 | 19.9% |
| 35 to 44 Years | 1,226 | 13.7% |
| 45 to 54 Years | 1,642 | 18.3% |
| 55 to 64 Years | 1,672 | 18.6% |
| 65 to 74 Years | 1,490 | 16.6% |
| 75 to 84 Years | 841 | 9.4% |
| 85 Years and Over | 320 | 3.6% |
| Total | 8,976 | 100.0% |
Housing Finances in Itawamba County
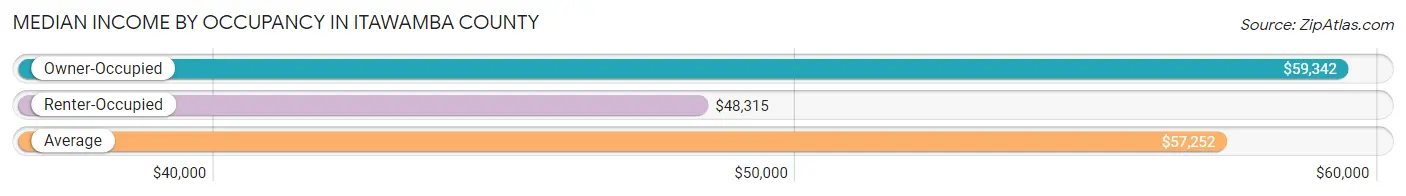
Median Income by Occupancy in Itawamba County
| Occupancy Type | # Households | Median Income |
| Owner-Occupied | 7,160 (79.8%) | $59,342 |
| Renter-Occupied | 1,816 (20.2%) | $48,315 |
| Average | 8,976 (100.0%) | $57,252 |
Occupancy by Householder Income Bracket in Itawamba County

| Income Bracket | Owner-occupied | Renter-occupied |
| Less than $5,000 | 193 (2.7%) | 48 (2.6%) |
| $5,000 to $9,999 | 49 (0.7%) | 38 (2.1%) |
| $10,000 to $14,999 | 444 (6.2%) | 106 (5.8%) |
| $15,000 to $19,999 | 136 (1.9%) | 133 (7.3%) |
| $20,000 to $24,999 | 429 (6.0%) | 166 (9.1%) |
| $25,000 to $34,999 | 876 (12.2%) | 132 (7.3%) |
| $35,000 to $49,999 | 1,014 (14.2%) | 316 (17.4%) |
| $50,000 to $74,999 | 1,157 (16.2%) | 220 (12.1%) |
| $75,000 to $99,999 | 1,053 (14.7%) | 434 (23.9%) |
| $100,000 to $149,999 | 1,432 (20.0%) | 149 (8.2%) |
| $150,000 or more | 377 (5.3%) | 74 (4.1%) |
| Total | 7,160 (100.0%) | 1,816 (100.0%) |
Monthly Housing Cost Tiers in Itawamba County

| Monthly Cost | Owner-occupied | Renter-occupied |
| Less than $300 | 1,683 (23.5%) | 73 (4.0%) |
| $300 to $499 | 1,738 (24.3%) | 102 (5.6%) |
| $500 to $799 | 1,366 (19.1%) | 617 (34.0%) |
| $800 to $999 | 866 (12.1%) | 411 (22.6%) |
| $1,000 to $1,499 | 923 (12.9%) | 288 (15.9%) |
| $1,500 to $1,999 | 392 (5.5%) | 0 (0.0%) |
| $2,000 to $2,499 | 138 (1.9%) | 0 (0.0%) |
| $2,500 to $2,999 | 54 (0.7%) | 0 (0.0%) |
| $3,000 or more | 0 (0.0%) | 0 (0.0%) |
| Total | 7,160 (100.0%) | 1,816 (100.0%) |
Physical Housing Characteristics in Itawamba County
Housing Structures in Itawamba County
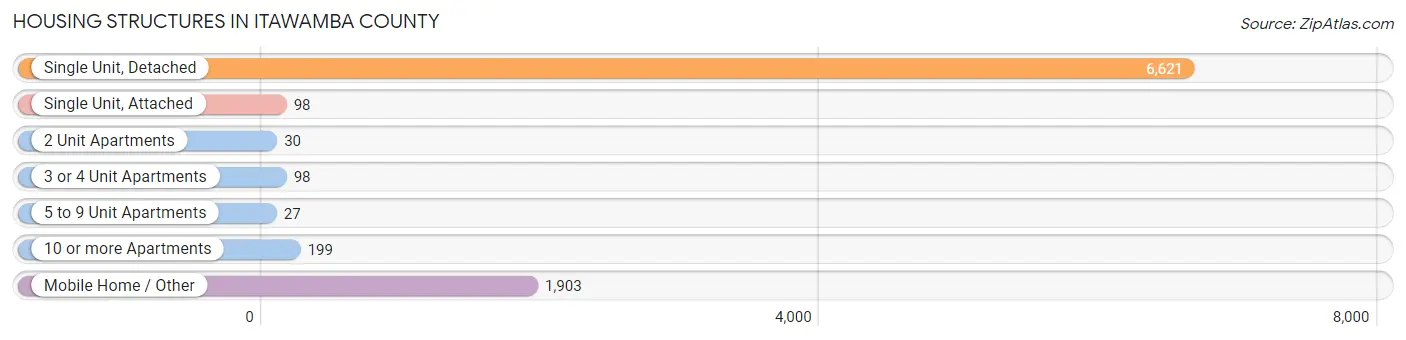
| Structure Type | # Housing Units | % Housing Units |
| Single Unit, Detached | 6,621 | 73.8% |
| Single Unit, Attached | 98 | 1.1% |
| 2 Unit Apartments | 30 | 0.3% |
| 3 or 4 Unit Apartments | 98 | 1.1% |
| 5 to 9 Unit Apartments | 27 | 0.3% |
| 10 or more Apartments | 199 | 2.2% |
| Mobile Home / Other | 1,903 | 21.2% |
| Total | 8,976 | 100.0% |
Housing Structures by Occupancy in Itawamba County

| Structure Type | Owner-occupied | Renter-occupied |
| Single Unit, Detached | 5,679 (85.8%) | 942 (14.2%) |
| Single Unit, Attached | 22 (22.5%) | 76 (77.5%) |
| 2 Unit Apartments | 3 (10.0%) | 27 (90.0%) |
| 3 or 4 Unit Apartments | 0 (0.0%) | 98 (100.0%) |
| 5 to 9 Unit Apartments | 0 (0.0%) | 27 (100.0%) |
| 10 or more Apartments | 0 (0.0%) | 199 (100.0%) |
| Mobile Home / Other | 1,456 (76.5%) | 447 (23.5%) |
| Total | 7,160 (79.8%) | 1,816 (20.2%) |
Housing Structures by Number of Rooms in Itawamba County

| Number of Rooms | Owner-occupied | Renter-occupied |
| 1 Room | 0 (0.0%) | 23 (1.3%) |
| 2 or 3 Rooms | 88 (1.2%) | 134 (7.4%) |
| 4 or 5 Rooms | 2,716 (37.9%) | 881 (48.5%) |
| 6 or 7 Rooms | 3,073 (42.9%) | 654 (36.0%) |
| 8 or more Rooms | 1,283 (17.9%) | 124 (6.8%) |
| Total | 7,160 (100.0%) | 1,816 (100.0%) |
Housing Structure by Heating Type in Itawamba County
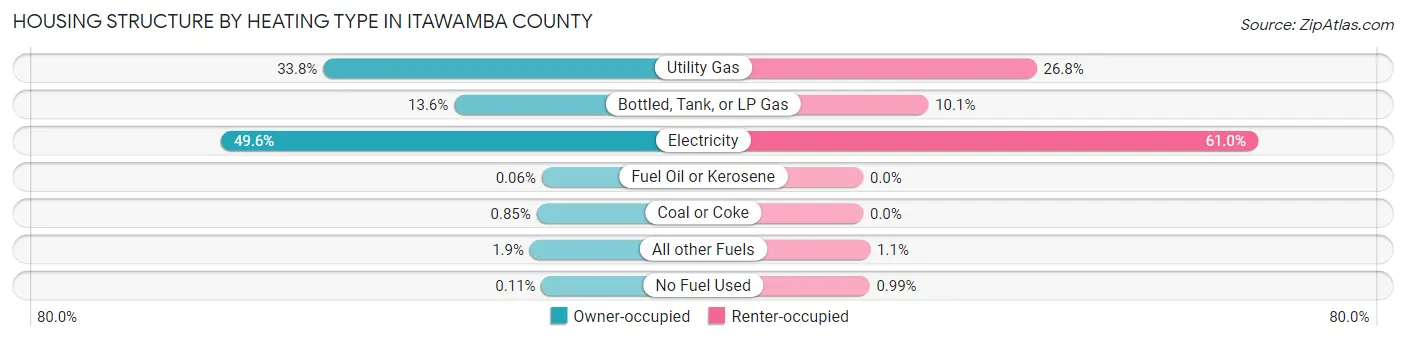
| Heating Type | Owner-occupied | Renter-occupied |
| Utility Gas | 2,423 (33.8%) | 487 (26.8%) |
| Bottled, Tank, or LP Gas | 974 (13.6%) | 183 (10.1%) |
| Electricity | 3,554 (49.6%) | 1,108 (61.0%) |
| Fuel Oil or Kerosene | 4 (0.1%) | 0 (0.0%) |
| Coal or Coke | 61 (0.9%) | 0 (0.0%) |
| All other Fuels | 136 (1.9%) | 20 (1.1%) |
| No Fuel Used | 8 (0.1%) | 18 (1.0%) |
| Total | 7,160 (100.0%) | 1,816 (100.0%) |
Household Vehicle Usage in Itawamba County

| Vehicles per Household | Owner-occupied | Renter-occupied |
| No Vehicle | 222 (3.1%) | 121 (6.7%) |
| 1 Vehicle | 1,417 (19.8%) | 672 (37.0%) |
| 2 Vehicles | 3,331 (46.5%) | 942 (51.9%) |
| 3 or more Vehicles | 2,190 (30.6%) | 81 (4.5%) |
| Total | 7,160 (100.0%) | 1,816 (100.0%) |
Real Estate & Mortgages in Itawamba County
Real Estate and Mortgage Overview in Itawamba County
| Characteristic | Without Mortgage | With Mortgage |
| Housing Units | 4,124 | 3,036 |
| Median Property Value | $93,700 | $136,200 |
| Median Household Income | $45,388 | $122 |
| Monthly Housing Costs | $341 | $0 |
| Real Estate Taxes | $598 | $586 |
Property Value by Mortgage Status in Itawamba County

| Property Value | Without Mortgage | With Mortgage |
| Less than $50,000 | 1,330 (32.3%) | 33 (1.1%) |
| $50,000 to $99,999 | 963 (23.4%) | 700 (23.1%) |
| $100,000 to $299,999 | 1,403 (34.0%) | 1,980 (65.2%) |
| $300,000 to $499,999 | 382 (9.3%) | 212 (7.0%) |
| $500,000 to $749,999 | 3 (0.1%) | 0 (0.0%) |
| $750,000 to $999,999 | 0 (0.0%) | 0 (0.0%) |
| $1,000,000 or more | 43 (1.0%) | 111 (3.7%) |
| Total | 4,124 (100.0%) | 3,036 (100.0%) |
Household Income by Mortgage Status in Itawamba County

| Household Income | Without Mortgage | With Mortgage |
| Less than $10,000 | 181 (4.4%) | 20 (0.7%) |
| $10,000 to $24,999 | 749 (18.2%) | 61 (2.0%) |
| $25,000 to $34,999 | 620 (15.0%) | 260 (8.6%) |
| $35,000 to $49,999 | 754 (18.3%) | 256 (8.4%) |
| $50,000 to $74,999 | 649 (15.7%) | 260 (8.6%) |
| $75,000 to $99,999 | 420 (10.2%) | 508 (16.7%) |
| $100,000 to $149,999 | 496 (12.0%) | 633 (20.8%) |
| $150,000 or more | 255 (6.2%) | 936 (30.8%) |
| Total | 4,124 (100.0%) | 3,036 (100.0%) |
Property Value to Household Income Ratio in Itawamba County

| Value-to-Income Ratio | Without Mortgage | With Mortgage |
| Less than 2.0x | 2,282 (55.3%) | 83,929 (2,764.5%) |
| 2.0x to 2.9x | 622 (15.1%) | 1,519 (50.0%) |
| 3.0x to 3.9x | 137 (3.3%) | 571 (18.8%) |
| 4.0x or more | 1,032 (25.0%) | 357 (11.8%) |
| Total | 4,124 (100.0%) | 3,036 (100.0%) |
Real Estate Taxes by Mortgage Status in Itawamba County

| Property Taxes | Without Mortgage | With Mortgage |
| Less than $800 | 1,598 (38.8%) | 39 (1.3%) |
| $800 to $1,499 | 581 (14.1%) | 1,110 (36.6%) |
| $800 to $1,499 | 406 (9.8%) | 646 (21.3%) |
| Total | 4,124 (100.0%) | 3,036 (100.0%) |
Health & Disability in Itawamba County
Health Insurance Coverage by Age in Itawamba County

| Age Bracket | With Coverage | Without Coverage |
| Under 6 Years | 1,659 (98.8%) | 20 (1.2%) |
| 6 to 18 Years | 3,807 (95.9%) | 162 (4.1%) |
| 19 to 25 Years | 2,035 (81.3%) | 469 (18.7%) |
| 26 to 34 Years | 2,058 (79.2%) | 540 (20.8%) |
| 35 to 44 Years | 1,974 (71.9%) | 770 (28.1%) |
| 45 to 54 Years | 2,844 (89.1%) | 346 (10.8%) |
| 55 to 64 Years | 2,771 (95.1%) | 142 (4.9%) |
| 65 to 74 Years | 2,271 (98.6%) | 32 (1.4%) |
| 75 Years and older | 1,626 (100.0%) | 0 (0.0%) |
| Total | 21,045 (89.4%) | 2,481 (10.5%) |
Health Insurance Coverage by Citizenship Status in Itawamba County

| Citizenship Status | With Coverage | Without Coverage |
| Native Born | 1,659 (98.8%) | 20 (1.2%) |
| Foreign Born, Citizen | 3,807 (95.9%) | 162 (4.1%) |
| Foreign Born, not a Citizen | 2,035 (81.3%) | 469 (18.7%) |
Health Insurance Coverage by Household Income in Itawamba County

| Household Income | With Coverage | Without Coverage |
| Under $25,000 | 2,325 (90.1%) | 254 (9.9%) |
| $25,000 to $49,999 | 4,332 (81.3%) | 997 (18.7%) |
| $50,000 to $74,999 | 3,628 (89.0%) | 450 (11.0%) |
| $75,000 to $99,999 | 3,993 (89.9%) | 449 (10.1%) |
| $100,000 and over | 5,949 (95.3%) | 296 (4.7%) |
Public vs Private Health Insurance Coverage by Age in Itawamba County
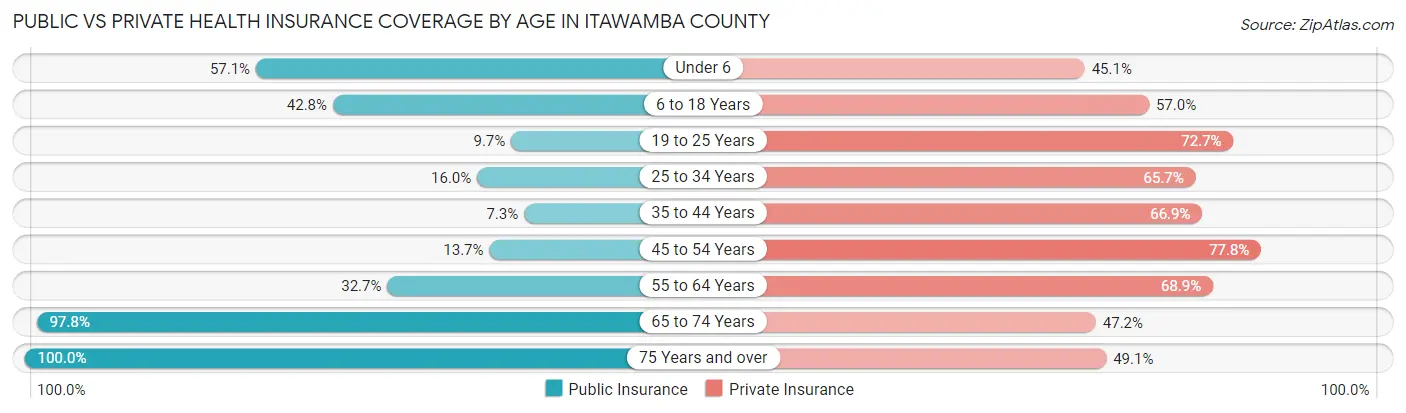
| Age Bracket | Public Insurance | Private Insurance |
| Under 6 | 958 (57.1%) | 757 (45.1%) |
| 6 to 18 Years | 1,698 (42.8%) | 2,263 (57.0%) |
| 19 to 25 Years | 243 (9.7%) | 1,820 (72.7%) |
| 25 to 34 Years | 416 (16.0%) | 1,706 (65.7%) |
| 35 to 44 Years | 200 (7.3%) | 1,836 (66.9%) |
| 45 to 54 Years | 438 (13.7%) | 2,483 (77.8%) |
| 55 to 64 Years | 952 (32.7%) | 2,007 (68.9%) |
| 65 to 74 Years | 2,252 (97.8%) | 1,086 (47.2%) |
| 75 Years and over | 1,626 (100.0%) | 798 (49.1%) |
| Total | 8,783 (37.3%) | 14,756 (62.7%) |
Disability Status by Sex by Age in Itawamba County
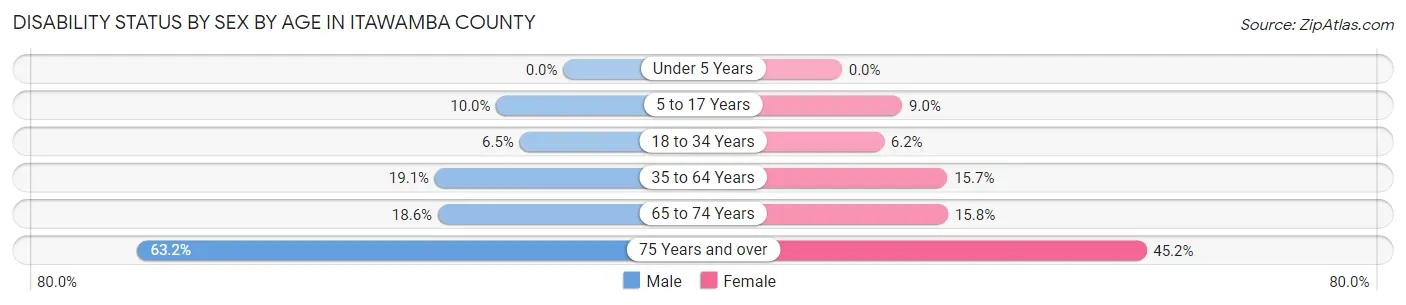
| Age Bracket | Male | Female |
| Under 5 Years | 0 (0.0%) | 0 (0.0%) |
| 5 to 17 Years | 191 (10.0%) | 169 (9.0%) |
| 18 to 34 Years | 194 (6.5%) | 169 (6.2%) |
| 35 to 64 Years | 837 (19.1%) | 698 (15.7%) |
| 65 to 74 Years | 207 (18.6%) | 188 (15.8%) |
| 75 Years and over | 428 (63.2%) | 429 (45.2%) |
Disability Class by Sex by Age in Itawamba County
Disability Class: Hearing Difficulty

| Age Bracket | Male | Female |
| Under 5 Years | 0 (0.0%) | 0 (0.0%) |
| 5 to 17 Years | 0 (0.0%) | 24 (1.3%) |
| 18 to 34 Years | 27 (0.9%) | 0 (0.0%) |
| 35 to 64 Years | 409 (9.3%) | 98 (2.2%) |
| 65 to 74 Years | 95 (8.6%) | 27 (2.3%) |
| 75 Years and over | 272 (40.2%) | 147 (15.5%) |
Disability Class: Vision Difficulty

| Age Bracket | Male | Female |
| Under 5 Years | 0 (0.0%) | 0 (0.0%) |
| 5 to 17 Years | 30 (1.6%) | 0 (0.0%) |
| 18 to 34 Years | 33 (1.1%) | 13 (0.5%) |
| 35 to 64 Years | 145 (3.3%) | 303 (6.8%) |
| 65 to 74 Years | 66 (5.9%) | 35 (2.9%) |
| 75 Years and over | 196 (28.9%) | 39 (4.1%) |
Disability Class: Cognitive Difficulty

| Age Bracket | Male | Female |
| 5 to 17 Years | 162 (8.4%) | 169 (9.0%) |
| 18 to 34 Years | 83 (2.8%) | 140 (5.2%) |
| 35 to 64 Years | 291 (6.6%) | 272 (6.1%) |
| 65 to 74 Years | 39 (3.5%) | 33 (2.8%) |
| 75 Years and over | 142 (21.0%) | 76 (8.0%) |
Disability Class: Ambulatory Difficulty

| Age Bracket | Male | Female |
| 5 to 17 Years | 0 (0.0%) | 24 (1.3%) |
| 18 to 34 Years | 32 (1.1%) | 22 (0.8%) |
| 35 to 64 Years | 452 (10.3%) | 474 (10.6%) |
| 65 to 74 Years | 148 (13.3%) | 155 (13.0%) |
| 75 Years and over | 228 (33.7%) | 297 (31.3%) |
Disability Class: Self-Care Difficulty

| Age Bracket | Male | Female |
| 5 to 17 Years | 0 (0.0%) | 24 (1.3%) |
| 18 to 34 Years | 73 (2.4%) | 22 (0.8%) |
| 35 to 64 Years | 233 (5.3%) | 129 (2.9%) |
| 65 to 74 Years | 55 (5.0%) | 43 (3.6%) |
| 75 Years and over | 58 (8.6%) | 129 (13.6%) |
Technology Access in Itawamba County
Computing Device Access in Itawamba County

| Device Type | # Households | % Households |
| Desktop or Laptop | 5,353 | 59.6% |
| Smartphone | 7,563 | 84.3% |
| Tablet | 3,982 | 44.4% |
| No Computing Device | 1,033 | 11.5% |
| Total | 8,976 | 100.0% |
Internet Access in Itawamba County

| Internet Type | # Households | % Households |
| Dial-Up Internet | 0 | 0.0% |
| Broadband Home | 4,374 | 48.7% |
| Cellular Data Only | 2,096 | 23.4% |
| Satellite Internet | 711 | 7.9% |
| No Internet | 1,938 | 21.6% |
| Total | 8,976 | 100.0% |
Itawamba County Summary
Itawamba County is located in the northeastern part of Mississippi, and is part of the Tupelo Metropolitan Statistical Area. It is bordered by Lee County to the north, Monroe County to the east, Chickasaw County to the south, and Prentiss County to the west. The county seat is Fulton, and the county has a total area of 437 square miles.
History
Itawamba County was established in 1836, and was named after the Itawamba River, which runs through the county. The county was originally part of the Chickasaw Cession of 1832, and was part of the Chickasaw Nation until the Treaty of Pontotoc Creek in 1832. The county was originally part of the Chickasaw District, and was later divided into Itawamba and Tishomingo counties in 1836.
The county was home to several Native American tribes, including the Chickasaw, Choctaw, and Creek. The first European settlers arrived in the area in the early 1800s, and the county was officially organized in 1836. The county was home to several plantations, and the economy was largely based on cotton production.
During the Civil War, Itawamba County was the site of several battles, including the Battle of Brice's Crossroads and the Battle of Harrisburg. After the war, the county was largely agricultural, and the economy was based on cotton production.
Geography
Itawamba County is located in the northeastern part of Mississippi, and is part of the Tupelo Metropolitan Statistical Area. It is bordered by Lee County to the north, Monroe County to the east, Chickasaw County to the south, and Prentiss County to the west. The county has a total area of 437 square miles, and is mostly rural. The terrain is mostly flat, with some rolling hills in the northern part of the county. The county is drained by the Tombigbee River and its tributaries, including the Itawamba River, which runs through the county.
Economy
The economy of Itawamba County is largely based on agriculture. The county is home to several large farms, and the main crops grown in the county are cotton, soybeans, corn, and wheat. The county also has a thriving timber industry, and is home to several sawmills and wood-processing plants.
The county is also home to several manufacturing companies, including furniture and automotive parts manufacturers. The county is also home to several retail stores, restaurants, and other businesses.
Demographics
As of the 2010 census, Itawamba County had a population of 23,401. The racial makeup of the county was 79.3% White, 18.2% African American, 0.3% Native American, 0.2% Asian, 0.1% Pacific Islander, 0.7% from other races, and 1.4% from two or more races. Hispanic or Latino of any race were 1.7% of the population.
The median income for a household in the county was $33,945, and the median income for a family was $41,945. The per capita income for the county was $17,845. About 17.2% of the population was below the poverty line.
Common Questions
What is the Total Population of Itawamba County?
Total Population of Itawamba County is 23,888.
What is the Total Male Population of Itawamba County?
Total Male Population of Itawamba County is 11,861.
What is the Total Female Population of Itawamba County?
Total Female Population of Itawamba County is 12,027.
What is the Ratio of Males per 100 Females in Itawamba County?
There are 98.62 Males per 100 Females in Itawamba County.
What is the Ratio of Females per 100 Males in Itawamba County?
There are 101.40 Females per 100 Males in Itawamba County.
What is the Median Population Age in Itawamba County?
Median Population Age in Itawamba County is 39.9 Years.
What is the Average Family Size in Itawamba County
Average Family Size in Itawamba County is 3.0 People.
What is the Average Household Size in Itawamba County
Average Household Size in Itawamba County is 2.5 People.
What is Per Capita Income in Itawamba County?
Per Capita income in Itawamba County is $33,243.
What is the Median Family Income in Itawamba County?
Median Family Income in Itawamba County is $68,647.
What is the Median Household income in Itawamba County?
Median Household Income in Itawamba County is $57,252.
What is Income or Wage Gap in Itawamba County?
Income or Wage Gap in Itawamba County is 25.5%.
Women in Itawamba County earn 74.5 cents for every dollar earned by a man.
What is Family Income Deficit in Itawamba County?
Family Income Deficit in Itawamba County is $7,991.
Families that are below poverty line in Itawamba County earn $7,991 less on average than the poverty threshold level.
What is Inequality or Gini Index in Itawamba County?
Inequality or Gini Index in Itawamba County is 0.49.
How Large is the Labor Force in Itawamba County?
There are 11,220 People in the Labor Forcein in Itawamba County.
What is the Percentage of People in the Labor Force in Itawamba County?
57.9% of People are in the Labor Force in Itawamba County.
What is the Unemployment Rate in Itawamba County?
Unemployment Rate in Itawamba County is 2.8%.