George County, MS
George County Map

George County Overview
24,547
TOTAL POPULATION
12,440
MALE POPULATION
12,107
FEMALE POPULATION
102.75
MALES / 100 FEMALES
97.32
FEMALES / 100 MALES
36.4
MEDIAN AGE
3.1
AVG FAMILY SIZE
2.7
AVG HOUSEHOLD SIZE
$24,756
PER CAPITA INCOME
$63,144
AVG FAMILY INCOME
$51,349
AVG HOUSEHOLD INCOME
50.2%
WAGE / INCOME GAP [ % ]
49.8¢/ $1
WAGE / INCOME GAP [ $ ]
$13,742
FAMILY INCOME DEFICIT
0.46
INEQUALITY / GINI INDEX
9,440
LABOR FORCE [ PEOPLE ]
50.3%
PERCENT IN LABOR FORCE
10.4%
UNEMPLOYMENT RATE
Race in George County
The most populous races in George County are White / Caucasian (21,705 | 88.4%), Black / African American (1,888 | 7.7%), and Hispanic or Latino (788 | 3.2%).

| Race | # Population | % Population |
| Asian | 159 | 0.6% |
| Black / African American | 1,888 | 7.7% |
| Hawaiian / Pacific | 0 | 0.0% |
| Hispanic or Latino | 788 | 3.2% |
| Native / Alaskan | 58 | 0.2% |
| White / Caucasian | 21,705 | 88.4% |
| Two or more Races | 706 | 2.9% |
| Some other Race | 31 | 0.1% |
| Total | 24,547 | 100.0% |
Ancestry in George County
The most populous ancestries reported in George County are American (3,546 | 14.4%), English (3,494 | 14.2%), Irish (2,461 | 10.0%), German (1,535 | 6.2%), and Italian (648 | 2.6%), together accounting for 47.6% of all George County residents.

| Ancestry | # Population | % Population |
| African | 30 | 0.1% |
| American | 3,546 | 14.4% |
| Arab | 2 | 0.0% |
| Austrian | 23 | 0.1% |
| British | 125 | 0.5% |
| Cajun | 11 | 0.0% |
| Central American | 215 | 0.9% |
| Cherokee | 76 | 0.3% |
| Choctaw | 5 | 0.0% |
| Colombian | 18 | 0.1% |
| Cuban | 23 | 0.1% |
| Danish | 6 | 0.0% |
| Dutch | 64 | 0.3% |
| English | 3,494 | 14.2% |
| European | 35 | 0.1% |
| Finnish | 59 | 0.2% |
| French | 451 | 1.8% |
| French Canadian | 8 | 0.0% |
| German | 1,535 | 6.2% |
| Greek | 17 | 0.1% |
| Guatemalan | 108 | 0.4% |
| Honduran | 107 | 0.4% |
| Inupiat | 3 | 0.0% |
| Irish | 2,461 | 10.0% |
| Italian | 648 | 2.6% |
| Korean | 122 | 0.5% |
| Lebanese | 2 | 0.0% |
| Mexican | 357 | 1.5% |
| Navajo | 25 | 0.1% |
| Northern European | 46 | 0.2% |
| Norwegian | 16 | 0.1% |
| Pennsylvania German | 13 | 0.1% |
| Peruvian | 27 | 0.1% |
| Polish | 92 | 0.4% |
| Puerto Rican | 60 | 0.2% |
| Romanian | 6 | 0.0% |
| Russian | 12 | 0.1% |
| Scandinavian | 92 | 0.4% |
| Scotch-Irish | 387 | 1.6% |
| Scottish | 394 | 1.6% |
| Seminole | 1 | 0.0% |
| South American | 45 | 0.2% |
| Spanish | 63 | 0.3% |
| Sri Lankan | 47 | 0.2% |
| Subsaharan African | 30 | 0.1% |
| Swedish | 161 | 0.7% |
| Ukrainian | 3 | 0.0% |
| Welsh | 123 | 0.5% | View All 48 Rows |
Immigrants in George County
The most numerous immigrant groups reported in George County came from Latin America (258 | 1.1%), Central America (239 | 1.0%), Mexico (175 | 0.7%), Asia (143 | 0.6%), and South Eastern Asia (143 | 0.6%), together accounting for 3.9% of all George County residents.

| Immigration Origin | # Population | % Population |
| Asia | 143 | 0.6% |
| Central America | 239 | 1.0% |
| England | 13 | 0.1% |
| Europe | 13 | 0.1% |
| Guatemala | 64 | 0.3% |
| Latin America | 258 | 1.1% |
| Mexico | 175 | 0.7% |
| Northern Europe | 13 | 0.1% |
| Peru | 19 | 0.1% |
| Philippines | 96 | 0.4% |
| South America | 19 | 0.1% |
| South Eastern Asia | 143 | 0.6% |
| Vietnam | 47 | 0.2% | View All 13 Rows |
Sex and Age in George County
Sex and Age in George County
The most populous age groups in George County are Under 5 Years (1,063 | 8.6%) for men and 10 to 14 Years (1,077 | 8.9%) for women.

| Age Bracket | Male | Female |
| Under 5 Years | 1,063 (8.6%) | 833 (6.9%) |
| 5 to 9 Years | 802 (6.5%) | 776 (6.4%) |
| 10 to 14 Years | 915 (7.4%) | 1,077 (8.9%) |
| 15 to 19 Years | 737 (5.9%) | 807 (6.7%) |
| 20 to 24 Years | 728 (5.9%) | 654 (5.4%) |
| 25 to 29 Years | 982 (7.9%) | 912 (7.5%) |
| 30 to 34 Years | 818 (6.6%) | 708 (5.9%) |
| 35 to 39 Years | 786 (6.3%) | 805 (6.7%) |
| 40 to 44 Years | 733 (5.9%) | 592 (4.9%) |
| 45 to 49 Years | 761 (6.1%) | 692 (5.7%) |
| 50 to 54 Years | 774 (6.2%) | 773 (6.4%) |
| 55 to 59 Years | 911 (7.3%) | 550 (4.5%) |
| 60 to 64 Years | 751 (6.0%) | 888 (7.3%) |
| 65 to 69 Years | 517 (4.2%) | 540 (4.5%) |
| 70 to 74 Years | 540 (4.3%) | 634 (5.2%) |
| 75 to 79 Years | 432 (3.5%) | 417 (3.4%) |
| 80 to 84 Years | 88 (0.7%) | 204 (1.7%) |
| 85 Years and over | 102 (0.8%) | 245 (2.0%) |
| Total | 12,440 (100.0%) | 12,107 (100.0%) |
Families and Households in George County
Median Family Size in George County
The median family size in George County is 3.09 persons per family, with married-couple families (5,122 | 76.4%) accounting for the largest median family size of 3.11 persons per family. On the other hand, single male/father families (642 | 9.6%) represent the smallest median family size with 2.95 persons per family.

| Family Type | # Families | Family Size |
| Married-Couple | 5,122 (76.4%) | 3.11 |
| Single Male/Father | 642 (9.6%) | 2.95 |
| Single Female/Mother | 936 (14.0%) | 3.07 |
| Total Families | 6,700 (100.0%) | 3.09 |
Median Household Size in George County
The median household size in George County is 2.66 persons per household, with single male/father households (642 | 7.1%) accounting for the largest median household size of 3.41 persons per household. non-family households (2,278 | 25.4%) represent the smallest median household size with 1.17 persons per household.

| Household Type | # Households | Household Size |
| Married-Couple | 5,122 (57.1%) | 3.14 |
| Single Male/Father | 642 (7.1%) | 3.41 |
| Single Female/Mother | 936 (10.4%) | 3.18 |
| Non-family | 2,278 (25.4%) | 1.17 |
| Total Households | 8,978 (100.0%) | 2.66 |
Household Size by Marriage Status in George County
Out of a total of 8,978 households in George County, 6,700 (74.6%) are family households, while 2,278 (25.4%) are nonfamily households. The most numerous type of family households are 2-person households, comprising 2,956, and the most common type of nonfamily households are 1-person households, comprising 2,017.

| Household Size | Family Households | Nonfamily Households |
| 1-Person Households | - | 2,017 (22.5%) |
| 2-Person Households | 2,956 (32.9%) | 224 (2.5%) |
| 3-Person Households | 1,645 (18.3%) | 12 (0.1%) |
| 4-Person Households | 1,078 (12.0%) | 16 (0.2%) |
| 5-Person Households | 525 (5.9%) | 9 (0.1%) |
| 6-Person Households | 231 (2.6%) | 0 (0.0%) |
| 7+ Person Households | 265 (2.9%) | 0 (0.0%) |
| Total | 6,700 (74.6%) | 2,278 (25.4%) |
Female Fertility in George County
Fertility by Age in George County
Average fertility rate in George County is 131.0 births per 1,000 women. Women in the age bracket of 20 to 34 years have the highest fertility rate with 222.0 births per 1,000 women. Women in the age bracket of 20 to 34 years acount for 72.2% of all women with births.

| Age Bracket | Women with Births | Births / 1,000 Women |
| 15 to 19 years | 0 (0.0%) | 0.0 |
| 20 to 34 years | 504 (72.2%) | 222.0 |
| 35 to 50 years | 194 (27.8%) | 86.0 |
| Total | 698 (100.0%) | 131.0 |
Fertility by Age by Marriage Status in George County
79.1% of women with births (698) in George County are married. The highest percentage of unmarried women with births falls into 20 to 34 years age bracket with 29.0% of them unmarried at the time of birth, while the lowest percentage of unmarried women with births belong to 35 to 50 years age bracket with 0.0% of them unmarried.
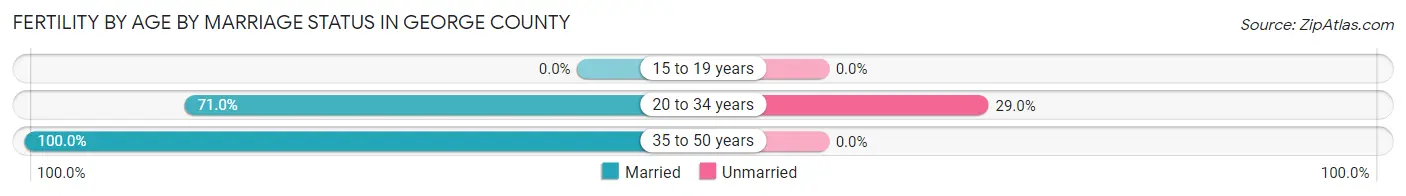
| Age Bracket | Married | Unmarried |
| 15 to 19 years | 0 (0.0%) | 0 (0.0%) |
| 20 to 34 years | 358 (71.0%) | 146 (29.0%) |
| 35 to 50 years | 194 (100.0%) | 0 (0.0%) |
| Total | 552 (79.1%) | 146 (20.9%) |
Fertility by Education in George County
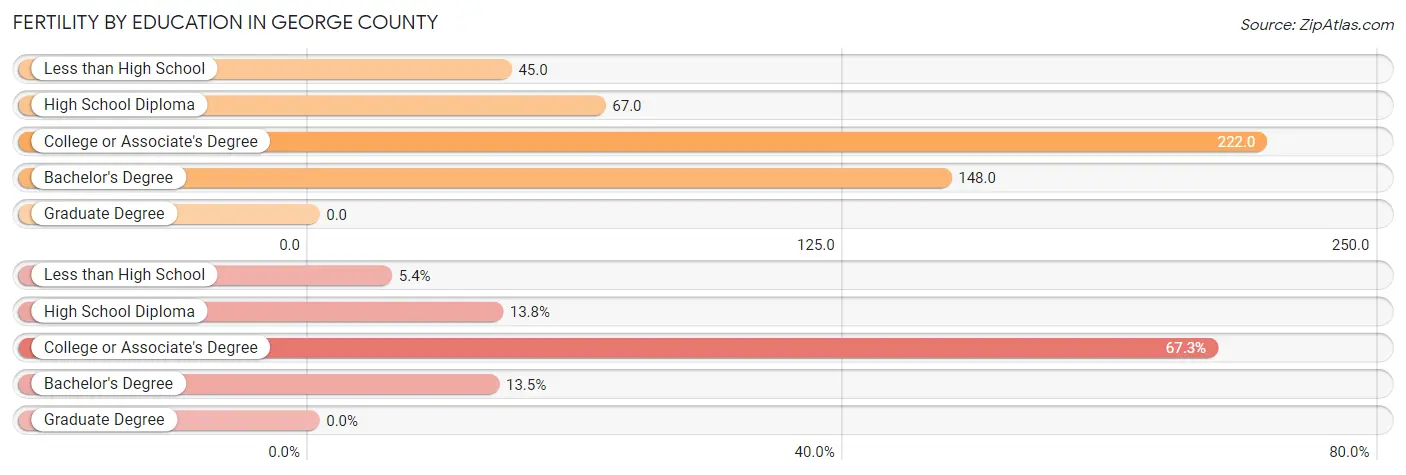
| Educational Attainment | Women with Births | Births / 1,000 Women |
| Less than High School | 38 (5.4%) | 45.0 |
| High School Diploma | 96 (13.8%) | 67.0 |
| College or Associate's Degree | 470 (67.3%) | 222.0 |
| Bachelor's Degree | 94 (13.5%) | 148.0 |
| Graduate Degree | 0 (0.0%) | 0.0 |
| Total | 698 (100.0%) | 131.0 |
Fertility by Education by Marriage Status in George County
20.9% of women with births in George County are unmarried. Women with the educational attainment of bachelor's degree are most likely to be married with 100.0% of them married at childbirth, while women with the educational attainment of high school diploma are least likely to be married with 32.3% of them unmarried at childbirth.

| Educational Attainment | Married | Unmarried |
| Less than High School | 28 (73.7%) | 10 (26.3%) |
| High School Diploma | 65 (67.7%) | 31 (32.3%) |
| College or Associate's Degree | 365 (77.7%) | 105 (22.3%) |
| Bachelor's Degree | 94 (100.0%) | 0 (0.0%) |
| Graduate Degree | 0 (0.0%) | 0 (0.0%) |
| Total | 552 (79.1%) | 146 (20.9%) |
Income in George County
Income Overview in George County
Per Capita Income in George County is $24,756, while median incomes of families and households are $63,144 and $51,349 respectively.
| Characteristic | Number | Measure |
| Per Capita Income | 24,547 | $24,756 |
| Median Family Income | 6,700 | $63,144 |
| Mean Family Income | 6,700 | $78,916 |
| Median Household Income | 8,978 | $51,349 |
| Mean Household Income | 8,978 | $68,792 |
| Income Deficit | 6,700 | $13,742 |
| Wage / Income Gap (%) | 24,547 | 50.20% |
| Wage / Income Gap ($) | 24,547 | 49.80¢ per $1 |
| Gini / Inequality Index | 24,547 | 0.46 |
Earnings by Sex in George County
Average Earnings in George County are $36,419, $45,764 for men and $22,790 for women, a difference of 50.2%.

| Sex | Number | Average Earnings |
| Male | 5,654 (56.9%) | $45,764 |
| Female | 4,285 (43.1%) | $22,790 |
| Total | 9,939 (100.0%) | $36,419 |
Earnings by Sex by Income Bracket in George County
The most common earnings brackets in George County are $100,000+ for men (944 | 16.7%) and $2,499 or less for women (475 | 11.1%).

| Income | Male | Female |
| $2,499 or less | 193 (3.4%) | 475 (11.1%) |
| $2,500 to $4,999 | 151 (2.7%) | 226 (5.3%) |
| $5,000 to $7,499 | 121 (2.1%) | 217 (5.1%) |
| $7,500 to $9,999 | 82 (1.5%) | 382 (8.9%) |
| $10,000 to $12,499 | 154 (2.7%) | 234 (5.5%) |
| $12,500 to $14,999 | 161 (2.9%) | 94 (2.2%) |
| $15,000 to $17,499 | 136 (2.4%) | 137 (3.2%) |
| $17,500 to $19,999 | 28 (0.5%) | 156 (3.6%) |
| $20,000 to $22,499 | 182 (3.2%) | 205 (4.8%) |
| $22,500 to $24,999 | 379 (6.7%) | 142 (3.3%) |
| $25,000 to $29,999 | 103 (1.8%) | 108 (2.5%) |
| $30,000 to $34,999 | 334 (5.9%) | 246 (5.7%) |
| $35,000 to $39,999 | 451 (8.0%) | 340 (7.9%) |
| $40,000 to $44,999 | 304 (5.4%) | 325 (7.6%) |
| $45,000 to $49,999 | 213 (3.8%) | 189 (4.4%) |
| $50,000 to $54,999 | 168 (3.0%) | 320 (7.5%) |
| $55,000 to $64,999 | 636 (11.3%) | 175 (4.1%) |
| $65,000 to $74,999 | 379 (6.7%) | 131 (3.1%) |
| $75,000 to $99,999 | 535 (9.5%) | 146 (3.4%) |
| $100,000+ | 944 (16.7%) | 37 (0.9%) |
| Total | 5,654 (100.0%) | 4,285 (100.0%) |
Earnings by Sex by Educational Attainment in George County
Average earnings in George County are $53,509 for men and $25,534 for women, a difference of 52.3%. Men with an educational attainment of graduate degree enjoy the highest average annual earnings of $75,227, while those with less than high school education earn the least with $40,848. Women with an educational attainment of graduate degree earn the most with the average annual earnings of $52,722, while those with high school diploma education have the smallest earnings of $16,932.

| Educational Attainment | Male Income | Female Income |
| Less than High School | $40,848 | $0 |
| High School Diploma | $46,055 | $16,932 |
| College or Associate's Degree | $56,232 | $23,930 |
| Bachelor's Degree | $53,239 | $39,950 |
| Graduate Degree | $75,227 | $52,722 |
| Total | $53,509 | $25,534 |
Family Income in George County
Family Income Brackets in George County
According to the George County family income data, there are 1,280 families falling into the $50,000 to $74,999 income range, which is the most common income bracket and makes up 19.1% of all families. Conversely, the $10,000 to $14,999 income bracket is the least frequent group with only 241 families (3.6%) belonging to this category.

| Income Bracket | # Families | % Families |
| Less than $10,000 | 342 | 5.1% |
| $10,000 to $14,999 | 241 | 3.6% |
| $15,000 to $24,999 | 509 | 7.6% |
| $25,000 to $34,999 | 449 | 6.7% |
| $35,000 to $49,999 | 1,025 | 15.3% |
| $50,000 to $74,999 | 1,280 | 19.1% |
| $75,000 to $99,999 | 1,052 | 15.7% |
| $100,000 to $149,999 | 1,079 | 16.1% |
| $150,000 to $199,999 | 442 | 6.6% |
| $200,000+ | 288 | 4.3% |
Family Income by Famaliy Size in George County
6-person families (283 | 4.2%) account for the highest median family income in George County with $114,875 per family, while 2-person families (3,242 | 48.4%) have the highest median income of $29,566 per family member.

| Income Bracket | # Families | Median Income |
| 2-Person Families | 3,242 (48.4%) | $59,133 |
| 3-Person Families | 1,438 (21.5%) | $68,409 |
| 4-Person Families | 1,077 (16.1%) | $67,583 |
| 5-Person Families | 455 (6.8%) | $90,781 |
| 6-Person Families | 283 (4.2%) | $114,875 |
| 7+ Person Families | 205 (3.1%) | $0 |
| Total | 6,700 (100.0%) | $63,144 |
Family Income by Number of Earners in George County
The median family income in George County is $63,144, with families comprising 3+ earners (344) having the highest median family income of $138,088, while families with no earners (1,388) have the lowest median family income of $35,791, accounting for 5.1% and 20.7% of families, respectively.

| Number of Earners | # Families | Median Income |
| No Earners | 1,388 (20.7%) | $35,791 |
| 1 Earner | 2,402 (35.8%) | $56,316 |
| 2 Earners | 2,566 (38.3%) | $95,164 |
| 3+ Earners | 344 (5.1%) | $138,088 |
| Total | 6,700 (100.0%) | $63,144 |
Household Income in George County
Household Income Brackets in George County
With 1,481 households falling in the category, the $50,000 to $74,999 income range is the most frequent in George County, accounting for 16.5% of all households. In contrast, only 296 households (3.3%) fall into the $200,000+ income bracket, making it the least populous group.

| Income Bracket | # Households | % Households |
| Less than $10,000 | 754 | 8.4% |
| $10,000 to $14,999 | 503 | 5.6% |
| $15,000 to $24,999 | 1,015 | 11.3% |
| $25,000 to $34,999 | 790 | 8.8% |
| $35,000 to $49,999 | 1,356 | 15.1% |
| $50,000 to $74,999 | 1,481 | 16.5% |
| $75,000 to $99,999 | 1,131 | 12.6% |
| $100,000 to $149,999 | 1,203 | 13.4% |
| $150,000 to $199,999 | 458 | 5.1% |
| $200,000+ | 296 | 3.3% |
Household Income by Householder Age in George County
The median household income in George County is $51,349, with the highest median household income of $68,438 found in the 25 to 44 years age bracket for the primary householder. A total of 2,777 households (30.9%) fall into this category. Meanwhile, the 65+ years age bracket for the primary householder has the lowest median household income of $36,104, with 2,277 households (25.4%) in this group.
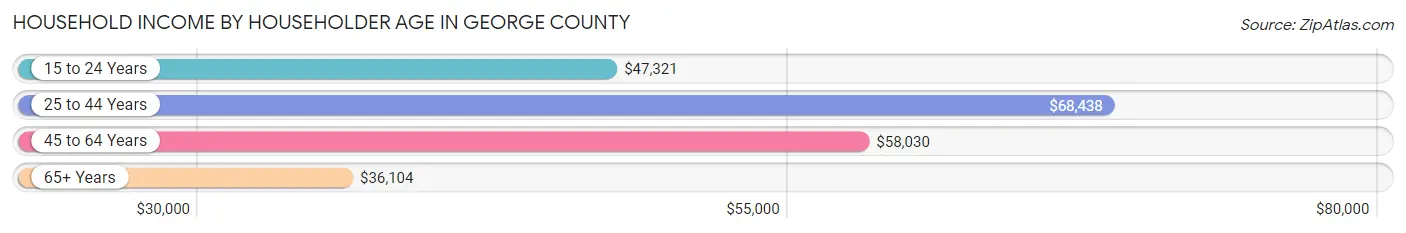
| Income Bracket | # Households | Median Income |
| 15 to 24 Years | 291 (3.2%) | $47,321 |
| 25 to 44 Years | 2,777 (30.9%) | $68,438 |
| 45 to 64 Years | 3,633 (40.5%) | $58,030 |
| 65+ Years | 2,277 (25.4%) | $36,104 |
| Total | 8,978 (100.0%) | $51,349 |
Poverty in George County
Income Below Poverty by Sex and Age in George County
With 20.0% poverty level for males and 21.8% for females among the residents of George County, 6 to 11 year old males and 5 year old females are the most vulnerable to poverty, with 562 males (52.3%) and 53 females (32.1%) in their respective age groups living below the poverty level.

| Age Bracket | Male | Female |
| Under 5 Years | 287 (27.0%) | 131 (16.6%) |
| 5 Years | 26 (17.2%) | 53 (32.1%) |
| 6 to 11 Years | 562 (52.3%) | 148 (17.0%) |
| 12 to 14 Years | 180 (37.9%) | 196 (25.8%) |
| 15 Years | 8 (5.6%) | 52 (30.4%) |
| 16 and 17 Years | 31 (9.2%) | 104 (28.6%) |
| 18 to 24 Years | 154 (16.6%) | 254 (27.4%) |
| 25 to 34 Years | 155 (9.8%) | 467 (28.8%) |
| 35 to 44 Years | 225 (16.6%) | 344 (24.6%) |
| 45 to 54 Years | 171 (11.4%) | 277 (18.9%) |
| 55 to 64 Years | 370 (23.3%) | 325 (22.6%) |
| 65 to 74 Years | 157 (15.1%) | 121 (10.4%) |
| 75 Years and over | 50 (8.1%) | 138 (16.7%) |
| Total | 2,376 (20.0%) | 2,610 (21.8%) |
Income Above Poverty by Sex and Age in George County
According to the poverty statistics in George County, males aged 15 years and females aged 65 to 74 years are the age groups that are most secure financially, with 94.4% of males and 89.6% of females in these age groups living above the poverty line.

| Age Bracket | Male | Female |
| Under 5 Years | 776 (73.0%) | 657 (83.4%) |
| 5 Years | 125 (82.8%) | 112 (67.9%) |
| 6 to 11 Years | 513 (47.7%) | 725 (83.1%) |
| 12 to 14 Years | 295 (62.1%) | 565 (74.2%) |
| 15 Years | 134 (94.4%) | 119 (69.6%) |
| 16 and 17 Years | 304 (90.7%) | 260 (71.4%) |
| 18 to 24 Years | 775 (83.4%) | 672 (72.6%) |
| 25 to 34 Years | 1,430 (90.2%) | 1,153 (71.2%) |
| 35 to 44 Years | 1,130 (83.4%) | 1,053 (75.4%) |
| 45 to 54 Years | 1,334 (88.6%) | 1,188 (81.1%) |
| 55 to 64 Years | 1,218 (76.7%) | 1,113 (77.4%) |
| 65 to 74 Years | 885 (84.9%) | 1,041 (89.6%) |
| 75 Years and over | 570 (91.9%) | 690 (83.3%) |
| Total | 9,489 (80.0%) | 9,348 (78.2%) |
Income Below Poverty Among Married-Couple Families in George County
The poverty statistics for married-couple families in George County show that 8.9% or 456 of the total 5,122 families live below the poverty line. Families with 3 or 4 children have the highest poverty rate of 15.1%, comprising of 72 families. On the other hand, families with 5 or more children have the lowest poverty rate of 0.0%, which includes 0 families.

| Children | Above Poverty | Below Poverty |
| No Children | 2,783 (92.2%) | 234 (7.8%) |
| 1 or 2 Children | 1,408 (90.4%) | 150 (9.6%) |
| 3 or 4 Children | 406 (84.9%) | 72 (15.1%) |
| 5 or more Children | 69 (100.0%) | 0 (0.0%) |
| Total | 4,666 (91.1%) | 456 (8.9%) |
Income Below Poverty Among Single-Parent Households in George County
According to the poverty data in George County, 14.6% or 94 single-father households and 45.9% or 430 single-mother households are living below the poverty line. Among single-father households, those with 3 or 4 children have the highest poverty rate, with 26 households (100.0%) experiencing poverty. Likewise, among single-mother households, those with 3 or 4 children have the highest poverty rate, with 73 households (100.0%) falling below the poverty line.

| Children | Single Father | Single Mother |
| No Children | 9 (5.2%) | 46 (11.9%) |
| 1 or 2 Children | 59 (13.3%) | 229 (58.3%) |
| 3 or 4 Children | 26 (100.0%) | 73 (100.0%) |
| 5 or more Children | 0 (0.0%) | 82 (100.0%) |
| Total | 94 (14.6%) | 430 (45.9%) |
Income Below Poverty Among Married-Couple vs Single-Parent Households in George County
The poverty data for George County shows that 456 of the married-couple family households (8.9%) and 524 of the single-parent households (33.2%) are living below the poverty level. Within the married-couple family households, those with 3 or 4 children have the highest poverty rate, with 72 households (15.1%) falling below the poverty line. Among the single-parent households, those with 3 or 4 children have the highest poverty rate, with 99 household (100.0%) living below poverty.

| Children | Married-Couple Families | Single-Parent Households |
| No Children | 234 (7.8%) | 55 (9.8%) |
| 1 or 2 Children | 150 (9.6%) | 288 (34.4%) |
| 3 or 4 Children | 72 (15.1%) | 99 (100.0%) |
| 5 or more Children | 0 (0.0%) | 82 (100.0%) |
| Total | 456 (8.9%) | 524 (33.2%) |
Employment Characteristics in George County
Employment by Class of Employer in George County
Among the 8,328 employed individuals in George County, private company employees (5,511 | 66.2%), self-employed (not incorporated) (649 | 7.8%), and local government employees (642 | 7.7%) make up the most common classes of employment.
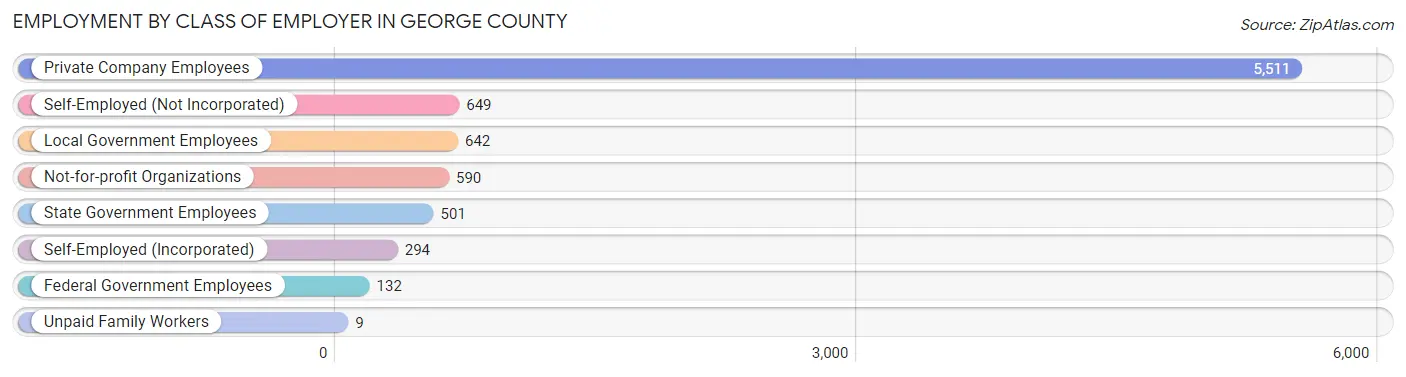
| Employer Class | # Employees | % Employees |
| Private Company Employees | 5,511 | 66.2% |
| Self-Employed (Incorporated) | 294 | 3.5% |
| Self-Employed (Not Incorporated) | 649 | 7.8% |
| Not-for-profit Organizations | 590 | 7.1% |
| Local Government Employees | 642 | 7.7% |
| State Government Employees | 501 | 6.0% |
| Federal Government Employees | 132 | 1.6% |
| Unpaid Family Workers | 9 | 0.1% |
| Total | 8,328 | 100.0% |
Employment Status by Age in George County
According to the labor force statistics for George County, out of the total population over 16 years of age (18,768), 50.3% or 9,440 individuals are in the labor force, with 10.4% or 982 of them unemployed. The age group with the highest labor force participation rate is 25 to 29 years, with 71.4% or 1,352 individuals in the labor force. Within the labor force, the 20 to 24 years age range has the highest percentage of unemployed individuals, with 32.0% or 306 of them being unemployed.
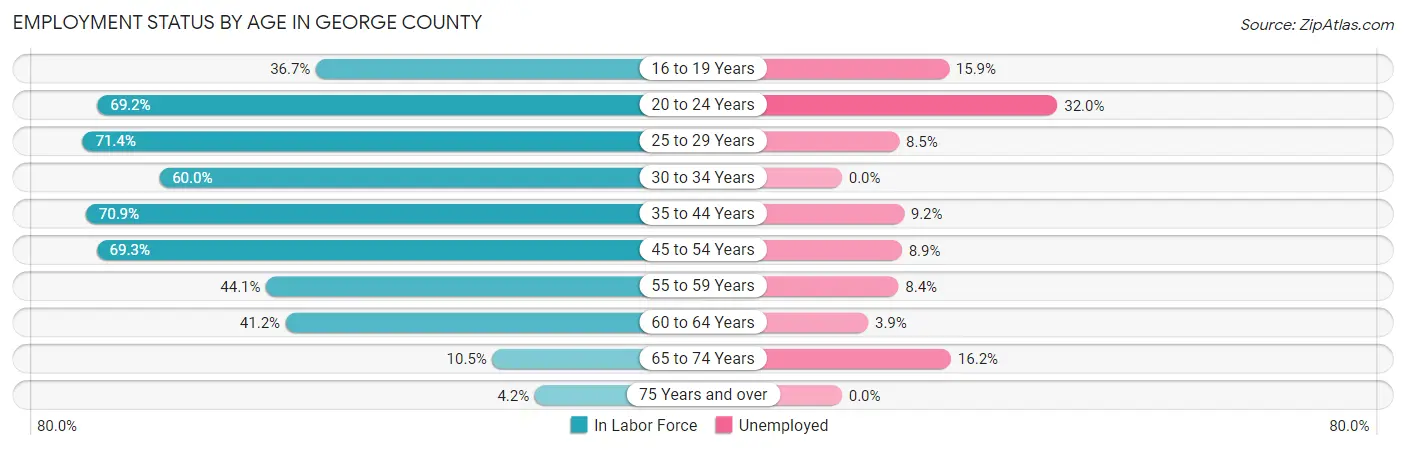
| Age Bracket | In Labor Force | Unemployed |
| 16 to 19 Years | 452 (36.7%) | 72 (15.9%) |
| 20 to 24 Years | 956 (69.2%) | 306 (32.0%) |
| 25 to 29 Years | 1,352 (71.4%) | 115 (8.5%) |
| 30 to 34 Years | 916 (60.0%) | 0 (0.0%) |
| 35 to 44 Years | 2,067 (70.9%) | 190 (9.2%) |
| 45 to 54 Years | 2,079 (69.3%) | 185 (8.9%) |
| 55 to 59 Years | 644 (44.1%) | 54 (8.4%) |
| 60 to 64 Years | 675 (41.2%) | 26 (3.9%) |
| 65 to 74 Years | 234 (10.5%) | 38 (16.2%) |
| 75 Years and over | 62 (4.2%) | 0 (0.0%) |
| Total | 9,440 (50.3%) | 982 (10.4%) |
Employment Status by Educational Attainment in George County
According to labor force statistics for George County, 62.2% of individuals (7,735) out of the total population between 25 and 64 years of age (12,436) are in the labor force, with 7.4% or 572 of them being unemployed. The group with the highest labor force participation rate are those with the educational attainment of bachelor's degree or higher, with 78.7% or 1,503 individuals in the labor force. Within the labor force, individuals with less than high school education have the highest percentage of unemployment, with 17.8% or 106 of them being unemployed.

| Educational Attainment | In Labor Force | Unemployed |
| Less than High School | 598 (41.5%) | 256 (17.8%) |
| High School Diploma | 2,350 (52.1%) | 334 (7.4%) |
| College / Associate Degree | 3,285 (71.8%) | 288 (6.3%) |
| Bachelor's Degree or higher | 1,503 (78.7%) | 111 (5.8%) |
| Total | 7,735 (62.2%) | 920 (7.4%) |
Employment Occupations by Sex in George County
Management, Business, Science and Arts Occupations
The most common Management, Business, Science and Arts occupations in George County are Community & Social Service (1,062 | 12.7%), Health Diagnosing & Treating (836 | 10.0%), Education Instruction & Library (638 | 7.6%), Health Technologists (587 | 7.0%), and Management (505 | 6.0%).

Management, Business, Science and Arts Occupations by Sex
Within the Management, Business, Science and Arts occupations in George County, the most male-oriented occupations are Life, Physical & Social Science (100.0%), Legal Services & Support (100.0%), and Architecture & Engineering (97.1%), while the most female-oriented occupations are Education Instruction & Library (91.2%), Health Diagnosing & Treating (81.1%), and Health Technologists (81.1%).

| Occupation | Male | Female |
| Management | 394 (78.0%) | 111 (22.0%) |
| Business & Financial | 86 (52.4%) | 78 (47.6%) |
| Computers, Engineering & Science | 266 (88.4%) | 35 (11.6%) |
| Computers & Mathematics | 22 (43.1%) | 29 (56.9%) |
| Architecture & Engineering | 203 (97.1%) | 6 (2.9%) |
| Life, Physical & Social Science | 41 (100.0%) | 0 (0.0%) |
| Community & Social Service | 321 (30.2%) | 741 (69.8%) |
| Education, Arts & Media | 192 (70.3%) | 81 (29.7%) |
| Legal Services & Support | 8 (100.0%) | 0 (0.0%) |
| Education Instruction & Library | 56 (8.8%) | 582 (91.2%) |
| Arts, Media & Entertainment | 65 (45.5%) | 78 (54.5%) |
| Health Diagnosing & Treating | 158 (18.9%) | 678 (81.1%) |
| Health Technologists | 111 (18.9%) | 476 (81.1%) |
| Total (Category) | 1,225 (42.7%) | 1,643 (57.3%) |
| Total (Overall) | 4,523 (53.9%) | 3,871 (46.1%) |
Services Occupations
The most common Services occupations in George County are Food Preparation & Serving (431 | 5.1%), Cleaning & Maintenance (287 | 3.4%), Healthcare Support (248 | 2.9%), Security & Protection (172 | 2.1%), and Personal Care & Service (145 | 1.7%).

Services Occupations by Sex
Within the Services occupations in George County, the most male-oriented occupations are Law Enforcement (100.0%), Security & Protection (79.1%), and Cleaning & Maintenance (63.1%), while the most female-oriented occupations are Healthcare Support (100.0%), Firefighting & Prevention (100.0%), and Food Preparation & Serving (88.9%).

| Occupation | Male | Female |
| Healthcare Support | 0 (0.0%) | 248 (100.0%) |
| Security & Protection | 136 (79.1%) | 36 (20.9%) |
| Firefighting & Prevention | 0 (0.0%) | 36 (100.0%) |
| Law Enforcement | 136 (100.0%) | 0 (0.0%) |
| Food Preparation & Serving | 48 (11.1%) | 383 (88.9%) |
| Cleaning & Maintenance | 181 (63.1%) | 106 (36.9%) |
| Personal Care & Service | 23 (15.9%) | 122 (84.1%) |
| Total (Category) | 388 (30.2%) | 895 (69.8%) |
| Total (Overall) | 4,523 (53.9%) | 3,871 (46.1%) |
Sales and Office Occupations
The most common Sales and Office occupations in George County are Office & Administration (738 | 8.8%), and Sales & Related (648 | 7.7%).

Sales and Office Occupations by Sex

| Occupation | Male | Female |
| Sales & Related | 170 (26.2%) | 478 (73.8%) |
| Office & Administration | 7 (0.9%) | 731 (99.1%) |
| Total (Category) | 177 (12.8%) | 1,209 (87.2%) |
| Total (Overall) | 4,523 (53.9%) | 3,871 (46.1%) |
Natural Resources, Construction and Maintenance Occupations
The most common Natural Resources, Construction and Maintenance occupations in George County are Construction & Extraction (855 | 10.2%), Installation, Maintenance & Repair (728 | 8.7%), and Farming, Fishing & Forestry (85 | 1.0%).

Natural Resources, Construction and Maintenance Occupations by Sex

| Occupation | Male | Female |
| Farming, Fishing & Forestry | 85 (100.0%) | 0 (0.0%) |
| Construction & Extraction | 841 (98.4%) | 14 (1.6%) |
| Installation, Maintenance & Repair | 728 (100.0%) | 0 (0.0%) |
| Total (Category) | 1,654 (99.2%) | 14 (0.8%) |
| Total (Overall) | 4,523 (53.9%) | 3,871 (46.1%) |
Production, Transportation and Moving Occupations
The most common Production, Transportation and Moving occupations in George County are Production (541 | 6.5%), Transportation (350 | 4.2%), and Material Moving (298 | 3.5%).

Production, Transportation and Moving Occupations by Sex

| Occupation | Male | Female |
| Production | 489 (90.4%) | 52 (9.6%) |
| Transportation | 339 (96.9%) | 11 (3.1%) |
| Material Moving | 251 (84.2%) | 47 (15.8%) |
| Total (Category) | 1,079 (90.7%) | 110 (9.2%) |
| Total (Overall) | 4,523 (53.9%) | 3,871 (46.1%) |
Employment Industries by Sex in George County
Employment Industries in George County
The major employment industries in George County include Health Care & Social Assistance (1,434 | 17.1%), Construction (1,136 | 13.5%), Manufacturing (901 | 10.7%), Educational Services (723 | 8.6%), and Retail Trade (675 | 8.0%).
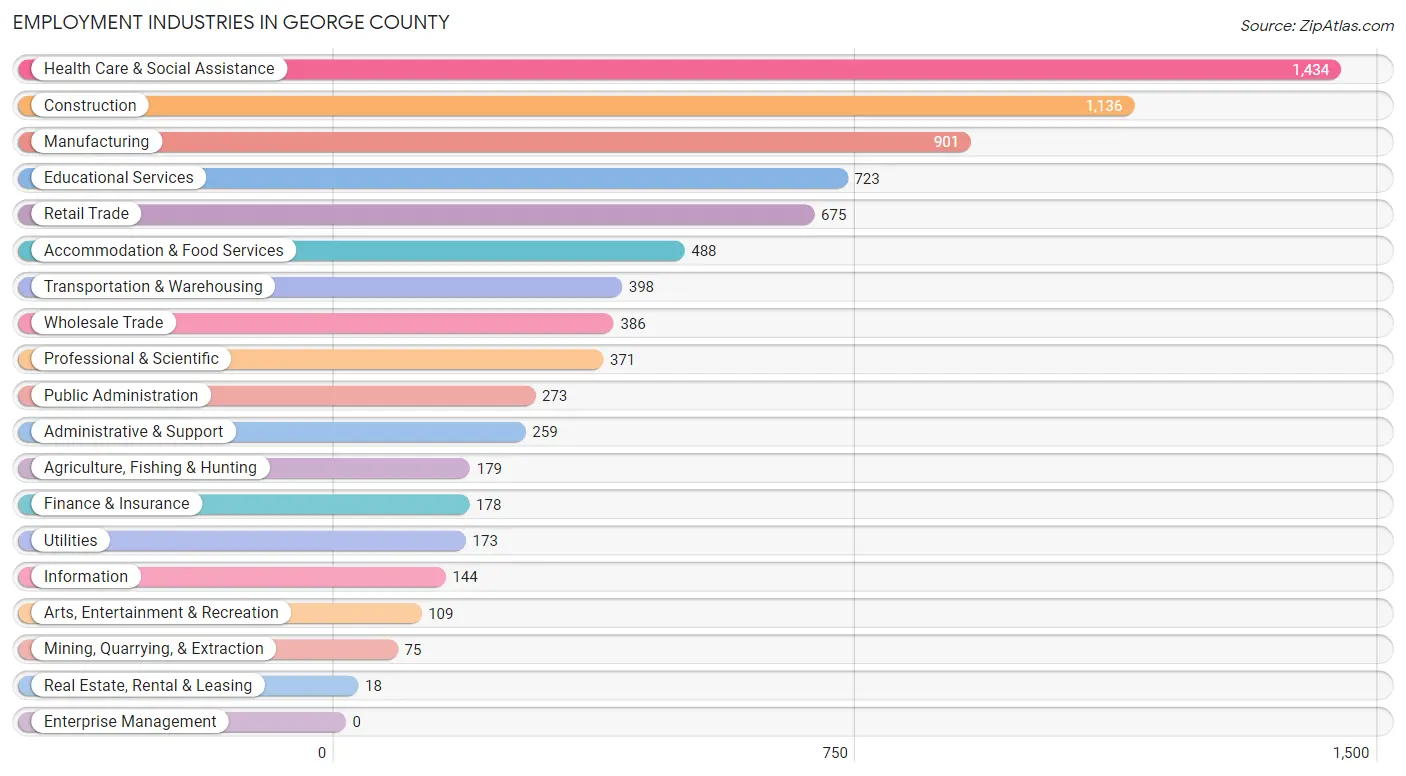
Employment Industries by Sex in George County
The George County industries that see more men than women are Agriculture, Fishing & Hunting (100.0%), Utilities (100.0%), and Information (100.0%), whereas the industries that tend to have a higher number of women are Educational Services (88.8%), Health Care & Social Assistance (83.0%), and Accommodation & Food Services (78.3%).

| Industry | Male | Female |
| Agriculture, Fishing & Hunting | 179 (100.0%) | 0 (0.0%) |
| Mining, Quarrying, & Extraction | 64 (85.3%) | 11 (14.7%) |
| Construction | 984 (86.6%) | 152 (13.4%) |
| Manufacturing | 810 (89.9%) | 91 (10.1%) |
| Wholesale Trade | 353 (91.4%) | 33 (8.6%) |
| Retail Trade | 202 (29.9%) | 473 (70.1%) |
| Transportation & Warehousing | 264 (66.3%) | 134 (33.7%) |
| Utilities | 173 (100.0%) | 0 (0.0%) |
| Information | 144 (100.0%) | 0 (0.0%) |
| Finance & Insurance | 61 (34.3%) | 117 (65.7%) |
| Real Estate, Rental & Leasing | 18 (100.0%) | 0 (0.0%) |
| Professional & Scientific | 94 (25.3%) | 277 (74.7%) |
| Enterprise Management | 0 (0.0%) | 0 (0.0%) |
| Administrative & Support | 241 (93.0%) | 18 (7.0%) |
| Educational Services | 81 (11.2%) | 642 (88.8%) |
| Health Care & Social Assistance | 244 (17.0%) | 1,190 (83.0%) |
| Arts, Entertainment & Recreation | 52 (47.7%) | 57 (52.3%) |
| Accommodation & Food Services | 106 (21.7%) | 382 (78.3%) |
| Public Administration | 144 (52.7%) | 129 (47.2%) |
| Total | 4,523 (53.9%) | 3,871 (46.1%) |
Education in George County
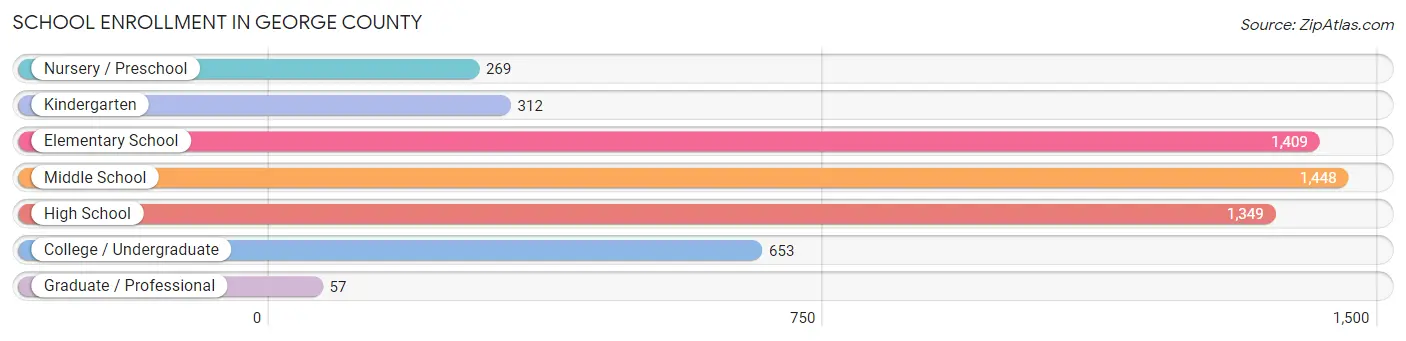
School Enrollment in George County
The most common levels of schooling among the 5,497 students in George County are middle school (1,448 | 26.3%), elementary school (1,409 | 25.6%), and high school (1,349 | 24.5%).
| School Level | # Students | % Students |
| Nursery / Preschool | 269 | 4.9% |
| Kindergarten | 312 | 5.7% |
| Elementary School | 1,409 | 25.6% |
| Middle School | 1,448 | 26.3% |
| High School | 1,349 | 24.5% |
| College / Undergraduate | 653 | 11.9% |
| Graduate / Professional | 57 | 1.0% |
| Total | 5,497 | 100.0% |
School Enrollment by Age by Funding Source in George County
Out of a total of 5,497 students who are enrolled in schools in George County, 489 (8.9%) attend a private institution, while the remaining 5,008 (91.1%) are enrolled in public schools. The age group of 15 to 17 year olds has the highest likelihood of being enrolled in private schools, with 213 (21.8% in the age bracket) enrolled. Conversely, the age group of 20 to 24 year olds has the lowest likelihood of being enrolled in a private school, with 207 (100.0% in the age bracket) attending a public institution.

| Age Bracket | Public School | Private School |
| 3 to 4 Year Olds | 241 (95.6%) | 11 (4.4%) |
| 5 to 9 Year Old | 1,373 (96.4%) | 51 (3.6%) |
| 10 to 14 Year Olds | 1,757 (90.4%) | 186 (9.6%) |
| 15 to 17 Year Olds | 762 (78.1%) | 213 (21.8%) |
| 18 to 19 Year Olds | 273 (95.8%) | 12 (4.2%) |
| 20 to 24 Year Olds | 207 (100.0%) | 0 (0.0%) |
| 25 to 34 Year Olds | 228 (100.0%) | 0 (0.0%) |
| 35 Years and over | 166 (90.7%) | 17 (9.3%) |
| Total | 5,008 (91.1%) | 489 (8.9%) |
Educational Attainment by Field of Study in George County
Education (879 | 33.6%), business (465 | 17.8%), science & technology (229 | 8.7%), visual & performing arts (169 | 6.5%), and liberal arts & history (168 | 6.4%) are the most common fields of study among 2,616 individuals in George County who have obtained a bachelor's degree or higher.

| Field of Study | # Graduates | % Graduates |
| Computers & Mathematics | 106 | 4.1% |
| Bio, Nature & Agricultural | 135 | 5.2% |
| Physical & Health Sciences | 24 | 0.9% |
| Psychology | 109 | 4.2% |
| Social Sciences | 80 | 3.1% |
| Engineering | 153 | 5.9% |
| Multidisciplinary Studies | 0 | 0.0% |
| Science & Technology | 229 | 8.7% |
| Business | 465 | 17.8% |
| Education | 879 | 33.6% |
| Literature & Languages | 35 | 1.3% |
| Liberal Arts & History | 168 | 6.4% |
| Visual & Performing Arts | 169 | 6.5% |
| Communications | 21 | 0.8% |
| Arts & Humanities | 43 | 1.6% |
| Total | 2,616 | 100.0% |
Transportation & Commute in George County
Vehicle Availability by Sex in George County
The most prevalent vehicle ownership categories in George County are males with 2 vehicles (1,668, accounting for 36.7%) and females with 2 vehicles (1,733, making up 44.1%).

| Vehicles Available | Male | Female |
| No Vehicle | 122 (2.7%) | 103 (2.7%) |
| 1 Vehicle | 528 (11.6%) | 790 (20.9%) |
| 2 Vehicles | 1,668 (36.7%) | 1,733 (45.8%) |
| 3 Vehicles | 1,030 (22.7%) | 714 (18.9%) |
| 4 Vehicles | 769 (16.9%) | 172 (4.5%) |
| 5 or more Vehicles | 425 (9.4%) | 274 (7.2%) |
| Total | 4,542 (100.0%) | 3,786 (100.0%) |
Commute Time in George County
The most frequently occuring commute durations in George County are 60 to 89 minutes (1,705 commuters, 21.4%), 15 to 19 minutes (1,212 commuters, 15.2%), and 10 to 14 minutes (827 commuters, 10.4%).

| Commute Time | # Commuters | % Commuters |
| Less than 5 Minutes | 198 | 2.5% |
| 5 to 9 Minutes | 810 | 10.2% |
| 10 to 14 Minutes | 827 | 10.4% |
| 15 to 19 Minutes | 1,212 | 15.2% |
| 20 to 24 Minutes | 690 | 8.7% |
| 25 to 29 Minutes | 231 | 2.9% |
| 30 to 34 Minutes | 641 | 8.1% |
| 35 to 39 Minutes | 95 | 1.2% |
| 40 to 44 Minutes | 474 | 6.0% |
| 45 to 59 Minutes | 753 | 9.5% |
| 60 to 89 Minutes | 1,705 | 21.4% |
| 90 or more Minutes | 311 | 3.9% |
Commute Time by Sex in George County
The most common commute times in George County are 60 to 89 minutes (1,385 commuters, 31.7%) for males and 15 to 19 minutes (803 commuters, 22.4%) for females.
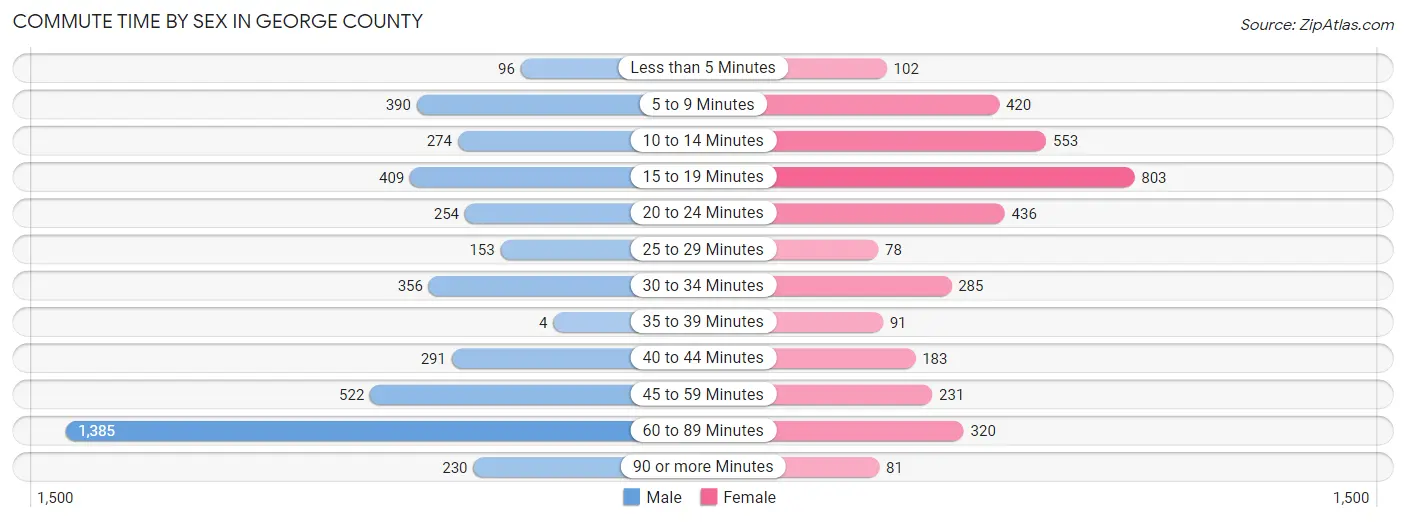
| Commute Time | Male | Female |
| Less than 5 Minutes | 96 (2.2%) | 102 (2.9%) |
| 5 to 9 Minutes | 390 (8.9%) | 420 (11.7%) |
| 10 to 14 Minutes | 274 (6.3%) | 553 (15.4%) |
| 15 to 19 Minutes | 409 (9.4%) | 803 (22.4%) |
| 20 to 24 Minutes | 254 (5.8%) | 436 (12.2%) |
| 25 to 29 Minutes | 153 (3.5%) | 78 (2.2%) |
| 30 to 34 Minutes | 356 (8.2%) | 285 (8.0%) |
| 35 to 39 Minutes | 4 (0.1%) | 91 (2.5%) |
| 40 to 44 Minutes | 291 (6.7%) | 183 (5.1%) |
| 45 to 59 Minutes | 522 (12.0%) | 231 (6.5%) |
| 60 to 89 Minutes | 1,385 (31.7%) | 320 (8.9%) |
| 90 or more Minutes | 230 (5.3%) | 81 (2.3%) |
Time of Departure to Work by Sex in George County
The most frequent times of departure to work in George County are 12:00 AM to 4:59 AM (1,174, 26.9%) for males and 6:30 AM to 6:59 AM (860, 24.0%) for females.

| Time of Departure | Male | Female |
| 12:00 AM to 4:59 AM | 1,174 (26.9%) | 38 (1.1%) |
| 5:00 AM to 5:29 AM | 356 (8.2%) | 63 (1.8%) |
| 5:30 AM to 5:59 AM | 329 (7.5%) | 65 (1.8%) |
| 6:00 AM to 6:29 AM | 916 (21.0%) | 370 (10.3%) |
| 6:30 AM to 6:59 AM | 235 (5.4%) | 860 (24.0%) |
| 7:00 AM to 7:29 AM | 553 (12.7%) | 826 (23.1%) |
| 7:30 AM to 7:59 AM | 175 (4.0%) | 176 (4.9%) |
| 8:00 AM to 8:29 AM | 209 (4.8%) | 267 (7.4%) |
| 8:30 AM to 8:59 AM | 55 (1.3%) | 67 (1.9%) |
| 9:00 AM to 9:59 AM | 103 (2.4%) | 173 (4.8%) |
| 10:00 AM to 10:59 AM | 4 (0.1%) | 54 (1.5%) |
| 11:00 AM to 11:59 AM | 84 (1.9%) | 4 (0.1%) |
| 12:00 PM to 3:59 PM | 51 (1.2%) | 118 (3.3%) |
| 4:00 PM to 11:59 PM | 120 (2.8%) | 502 (14.0%) |
| Total | 4,364 (100.0%) | 3,583 (100.0%) |
Housing Occupancy in George County
Occupancy by Ownership in George County
Of the total 8,978 dwellings in George County, owner-occupied units account for 7,354 (81.9%), while renter-occupied units make up 1,624 (18.1%).

| Occupancy | # Housing Units | % Housing Units |
| Owner Occupied Housing Units | 7,354 | 81.9% |
| Renter-Occupied Housing Units | 1,624 | 18.1% |
| Total Occupied Housing Units | 8,978 | 100.0% |
Occupancy by Household Size in George County

| Household Size | # Housing Units | % Housing Units |
| 1-Person Household | 2,017 | 22.5% |
| 2-Person Household | 3,180 | 35.4% |
| 3-Person Household | 1,657 | 18.5% |
| 4+ Person Household | 2,124 | 23.7% |
| Total Housing Units | 8,978 | 100.0% |
Occupancy by Ownership by Household Size in George County

| Household Size | Owner-occupied | Renter-occupied |
| 1-Person Household | 1,455 (72.1%) | 562 (27.9%) |
| 2-Person Household | 2,584 (81.3%) | 596 (18.7%) |
| 3-Person Household | 1,464 (88.3%) | 193 (11.7%) |
| 4+ Person Household | 1,851 (87.2%) | 273 (12.9%) |
| Total Housing Units | 7,354 (81.9%) | 1,624 (18.1%) |
Occupancy by Educational Attainment in George County

| Household Size | Owner-occupied | Renter-occupied |
| Less than High School | 908 (75.1%) | 301 (24.9%) |
| High School Diploma | 2,327 (86.4%) | 368 (13.7%) |
| College/Associate Degree | 2,785 (78.6%) | 758 (21.4%) |
| Bachelor's Degree or higher | 1,334 (87.1%) | 197 (12.9%) |
Occupancy by Age of Householder in George County

| Age Bracket | # Households | % Households |
| Under 35 Years | 1,770 | 19.7% |
| 35 to 44 Years | 1,298 | 14.5% |
| 45 to 54 Years | 1,680 | 18.7% |
| 55 to 64 Years | 1,953 | 21.7% |
| 65 to 74 Years | 1,270 | 14.1% |
| 75 to 84 Years | 764 | 8.5% |
| 85 Years and Over | 243 | 2.7% |
| Total | 8,978 | 100.0% |
Housing Finances in George County
Median Income by Occupancy in George County

| Occupancy Type | # Households | Median Income |
| Owner-Occupied | 7,354 (81.9%) | $58,867 |
| Renter-Occupied | 1,624 (18.1%) | $34,167 |
| Average | 8,978 (100.0%) | $51,349 |
Occupancy by Householder Income Bracket in George County

| Income Bracket | Owner-occupied | Renter-occupied |
| Less than $5,000 | 352 (4.8%) | 127 (7.8%) |
| $5,000 to $9,999 | 134 (1.8%) | 137 (8.4%) |
| $10,000 to $14,999 | 332 (4.5%) | 171 (10.5%) |
| $15,000 to $19,999 | 374 (5.1%) | 147 (9.0%) |
| $20,000 to $24,999 | 431 (5.9%) | 59 (3.6%) |
| $25,000 to $34,999 | 613 (8.3%) | 178 (11.0%) |
| $35,000 to $49,999 | 917 (12.5%) | 435 (26.8%) |
| $50,000 to $74,999 | 1,279 (17.4%) | 201 (12.4%) |
| $75,000 to $99,999 | 1,054 (14.3%) | 81 (5.0%) |
| $100,000 to $149,999 | 1,186 (16.1%) | 18 (1.1%) |
| $150,000 or more | 682 (9.3%) | 70 (4.3%) |
| Total | 7,354 (100.0%) | 1,624 (100.0%) |
Monthly Housing Cost Tiers in George County
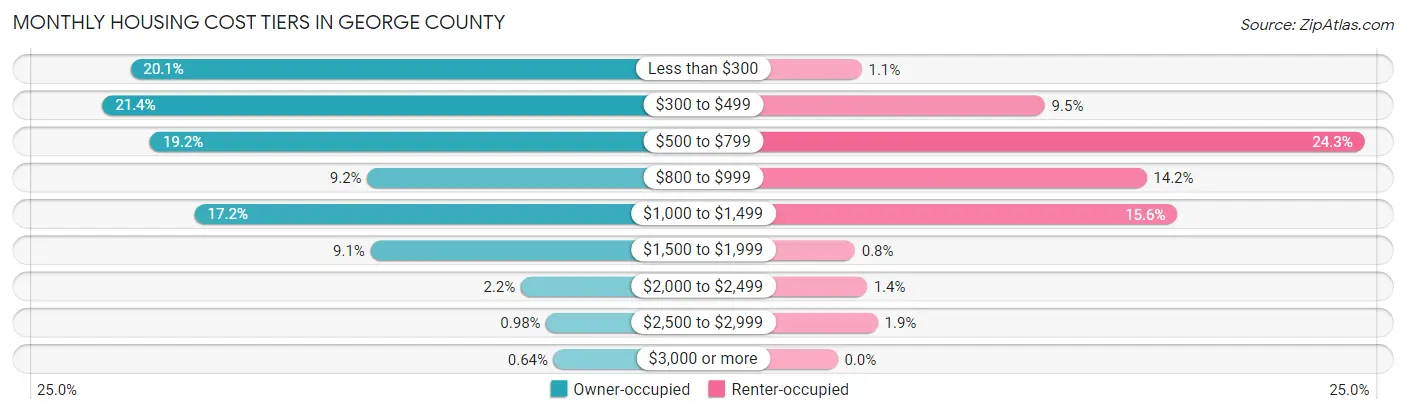
| Monthly Cost | Owner-occupied | Renter-occupied |
| Less than $300 | 1,480 (20.1%) | 18 (1.1%) |
| $300 to $499 | 1,575 (21.4%) | 155 (9.5%) |
| $500 to $799 | 1,414 (19.2%) | 394 (24.3%) |
| $800 to $999 | 678 (9.2%) | 231 (14.2%) |
| $1,000 to $1,499 | 1,263 (17.2%) | 254 (15.6%) |
| $1,500 to $1,999 | 667 (9.1%) | 13 (0.8%) |
| $2,000 to $2,499 | 158 (2.1%) | 22 (1.3%) |
| $2,500 to $2,999 | 72 (1.0%) | 30 (1.8%) |
| $3,000 or more | 47 (0.6%) | 0 (0.0%) |
| Total | 7,354 (100.0%) | 1,624 (100.0%) |
Physical Housing Characteristics in George County
Housing Structures in George County
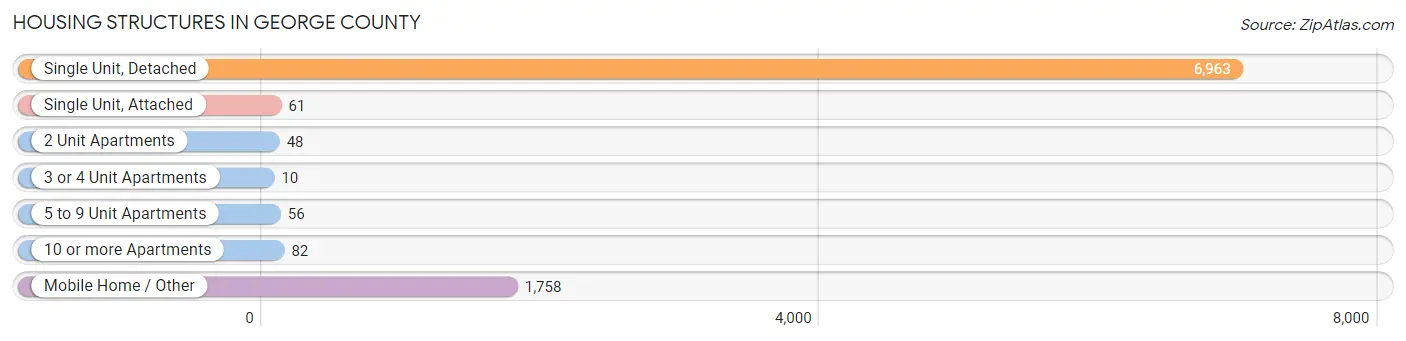
| Structure Type | # Housing Units | % Housing Units |
| Single Unit, Detached | 6,963 | 77.6% |
| Single Unit, Attached | 61 | 0.7% |
| 2 Unit Apartments | 48 | 0.5% |
| 3 or 4 Unit Apartments | 10 | 0.1% |
| 5 to 9 Unit Apartments | 56 | 0.6% |
| 10 or more Apartments | 82 | 0.9% |
| Mobile Home / Other | 1,758 | 19.6% |
| Total | 8,978 | 100.0% |
Housing Structures by Occupancy in George County

| Structure Type | Owner-occupied | Renter-occupied |
| Single Unit, Detached | 5,999 (86.2%) | 964 (13.8%) |
| Single Unit, Attached | 9 (14.7%) | 52 (85.3%) |
| 2 Unit Apartments | 7 (14.6%) | 41 (85.4%) |
| 3 or 4 Unit Apartments | 0 (0.0%) | 10 (100.0%) |
| 5 to 9 Unit Apartments | 0 (0.0%) | 56 (100.0%) |
| 10 or more Apartments | 0 (0.0%) | 82 (100.0%) |
| Mobile Home / Other | 1,339 (76.2%) | 419 (23.8%) |
| Total | 7,354 (81.9%) | 1,624 (18.1%) |
Housing Structures by Number of Rooms in George County

| Number of Rooms | Owner-occupied | Renter-occupied |
| 1 Room | 80 (1.1%) | 62 (3.8%) |
| 2 or 3 Rooms | 188 (2.6%) | 147 (9.0%) |
| 4 or 5 Rooms | 2,336 (31.8%) | 875 (53.9%) |
| 6 or 7 Rooms | 2,869 (39.0%) | 446 (27.5%) |
| 8 or more Rooms | 1,881 (25.6%) | 94 (5.8%) |
| Total | 7,354 (100.0%) | 1,624 (100.0%) |
Housing Structure by Heating Type in George County

| Heating Type | Owner-occupied | Renter-occupied |
| Utility Gas | 505 (6.9%) | 145 (8.9%) |
| Bottled, Tank, or LP Gas | 613 (8.3%) | 92 (5.7%) |
| Electricity | 5,944 (80.8%) | 1,240 (76.3%) |
| Fuel Oil or Kerosene | 0 (0.0%) | 0 (0.0%) |
| Coal or Coke | 0 (0.0%) | 0 (0.0%) |
| All other Fuels | 156 (2.1%) | 26 (1.6%) |
| No Fuel Used | 136 (1.8%) | 121 (7.4%) |
| Total | 7,354 (100.0%) | 1,624 (100.0%) |
Household Vehicle Usage in George County

| Vehicles per Household | Owner-occupied | Renter-occupied |
| No Vehicle | 327 (4.4%) | 219 (13.5%) |
| 1 Vehicle | 1,772 (24.1%) | 737 (45.4%) |
| 2 Vehicles | 2,740 (37.3%) | 468 (28.8%) |
| 3 or more Vehicles | 2,515 (34.2%) | 200 (12.3%) |
| Total | 7,354 (100.0%) | 1,624 (100.0%) |
Real Estate & Mortgages in George County
Real Estate and Mortgage Overview in George County
| Characteristic | Without Mortgage | With Mortgage |
| Housing Units | 4,158 | 3,196 |
| Median Property Value | $125,500 | $178,700 |
| Median Household Income | $48,737 | $371 |
| Monthly Housing Costs | $364 | $20 |
| Real Estate Taxes | $689 | $417 |
Property Value by Mortgage Status in George County
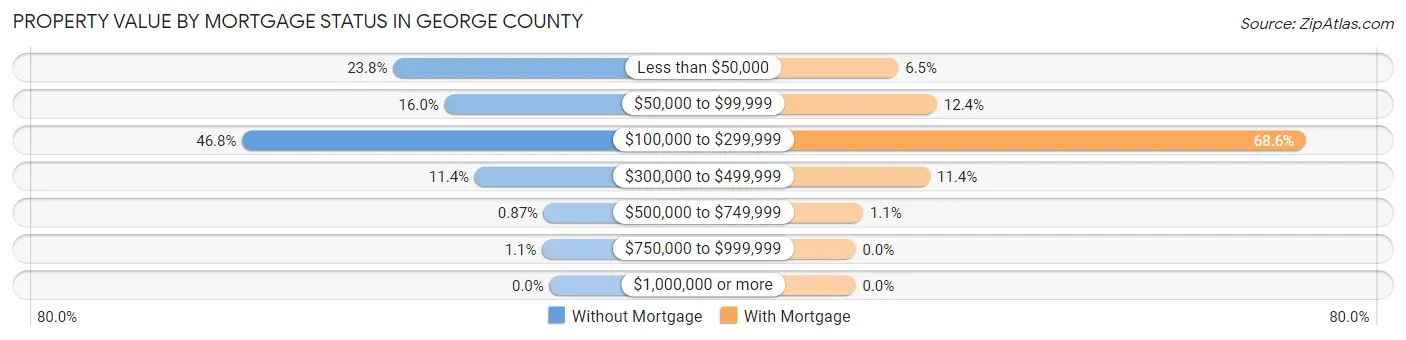
| Property Value | Without Mortgage | With Mortgage |
| Less than $50,000 | 991 (23.8%) | 208 (6.5%) |
| $50,000 to $99,999 | 665 (16.0%) | 396 (12.4%) |
| $100,000 to $299,999 | 1,947 (46.8%) | 2,193 (68.6%) |
| $300,000 to $499,999 | 473 (11.4%) | 363 (11.4%) |
| $500,000 to $749,999 | 36 (0.9%) | 36 (1.1%) |
| $750,000 to $999,999 | 46 (1.1%) | 0 (0.0%) |
| $1,000,000 or more | 0 (0.0%) | 0 (0.0%) |
| Total | 4,158 (100.0%) | 3,196 (100.0%) |
Household Income by Mortgage Status in George County

| Household Income | Without Mortgage | With Mortgage |
| Less than $10,000 | 410 (9.9%) | 49 (1.5%) |
| $10,000 to $24,999 | 776 (18.7%) | 76 (2.4%) |
| $25,000 to $34,999 | 386 (9.3%) | 361 (11.3%) |
| $35,000 to $49,999 | 607 (14.6%) | 227 (7.1%) |
| $50,000 to $74,999 | 756 (18.2%) | 310 (9.7%) |
| $75,000 to $99,999 | 425 (10.2%) | 523 (16.4%) |
| $100,000 to $149,999 | 487 (11.7%) | 629 (19.7%) |
| $150,000 or more | 311 (7.5%) | 699 (21.9%) |
| Total | 4,158 (100.0%) | 3,196 (100.0%) |
Property Value to Household Income Ratio in George County

| Value-to-Income Ratio | Without Mortgage | With Mortgage |
| Less than 2.0x | 1,550 (37.3%) | 78,493 (2,456.0%) |
| 2.0x to 2.9x | 627 (15.1%) | 1,416 (44.3%) |
| 3.0x to 3.9x | 737 (17.7%) | 851 (26.6%) |
| 4.0x or more | 1,210 (29.1%) | 337 (10.5%) |
| Total | 4,158 (100.0%) | 3,196 (100.0%) |
Real Estate Taxes by Mortgage Status in George County
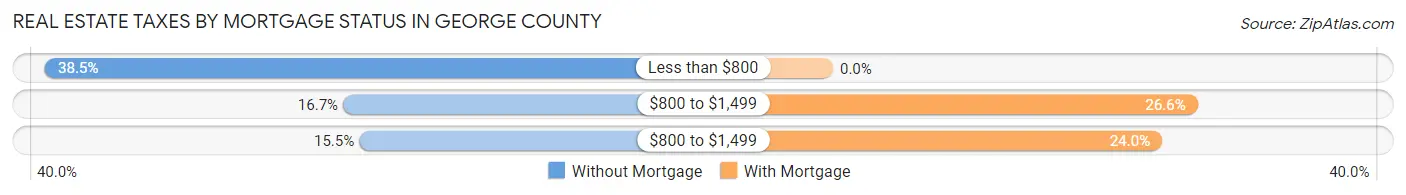
| Property Taxes | Without Mortgage | With Mortgage |
| Less than $800 | 1,601 (38.5%) | 0 (0.0%) |
| $800 to $1,499 | 693 (16.7%) | 851 (26.6%) |
| $800 to $1,499 | 644 (15.5%) | 768 (24.0%) |
| Total | 4,158 (100.0%) | 3,196 (100.0%) |
Health & Disability in George County
Health Insurance Coverage by Age in George County

| Age Bracket | With Coverage | Without Coverage |
| Under 6 Years | 2,126 (95.4%) | 103 (4.6%) |
| 6 to 18 Years | 4,406 (95.5%) | 206 (4.5%) |
| 19 to 25 Years | 1,310 (74.1%) | 459 (26.0%) |
| 26 to 34 Years | 2,292 (79.7%) | 583 (20.3%) |
| 35 to 44 Years | 2,130 (78.0%) | 602 (22.0%) |
| 45 to 54 Years | 2,228 (75.0%) | 742 (25.0%) |
| 55 to 64 Years | 2,466 (81.5%) | 560 (18.5%) |
| 65 to 74 Years | 2,204 (100.0%) | 0 (0.0%) |
| 75 Years and older | 1,448 (100.0%) | 0 (0.0%) |
| Total | 20,610 (86.4%) | 3,255 (13.6%) |
Health Insurance Coverage by Citizenship Status in George County

| Citizenship Status | With Coverage | Without Coverage |
| Native Born | 2,126 (95.4%) | 103 (4.6%) |
| Foreign Born, Citizen | 4,406 (95.5%) | 206 (4.5%) |
| Foreign Born, not a Citizen | 1,310 (74.1%) | 459 (26.0%) |
Health Insurance Coverage by Household Income in George County

| Household Income | With Coverage | Without Coverage |
| Under $25,000 | 3,930 (83.2%) | 794 (16.8%) |
| $25,000 to $49,999 | 3,962 (81.6%) | 892 (18.4%) |
| $50,000 to $74,999 | 3,693 (77.2%) | 1,092 (22.8%) |
| $75,000 to $99,999 | 2,800 (92.8%) | 218 (7.2%) |
| $100,000 and over | 6,196 (96.2%) | 243 (3.8%) |
Public vs Private Health Insurance Coverage by Age in George County
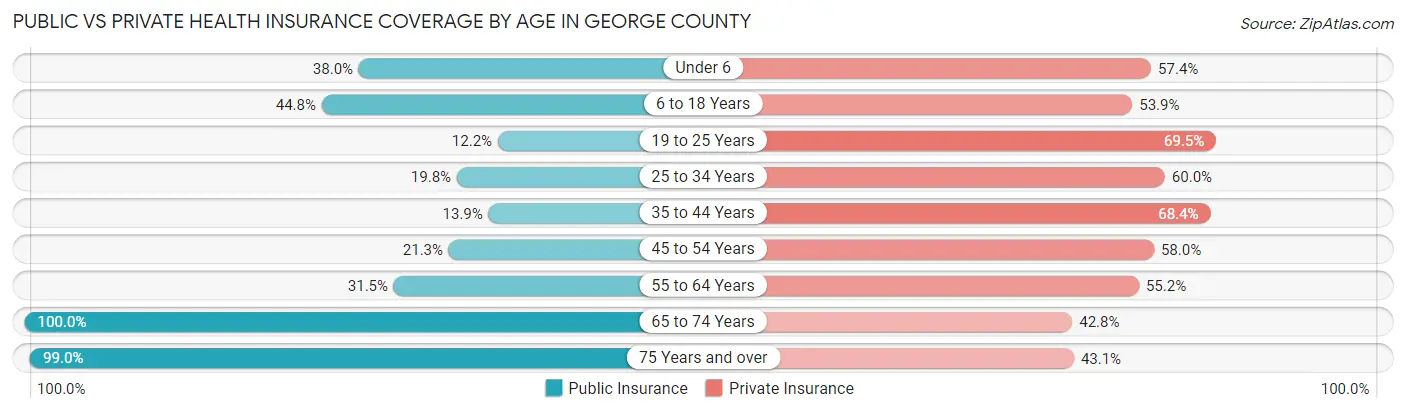
| Age Bracket | Public Insurance | Private Insurance |
| Under 6 | 846 (38.0%) | 1,280 (57.4%) |
| 6 to 18 Years | 2,068 (44.8%) | 2,487 (53.9%) |
| 19 to 25 Years | 215 (12.1%) | 1,229 (69.5%) |
| 25 to 34 Years | 568 (19.8%) | 1,724 (60.0%) |
| 35 to 44 Years | 379 (13.9%) | 1,869 (68.4%) |
| 45 to 54 Years | 631 (21.2%) | 1,721 (58.0%) |
| 55 to 64 Years | 952 (31.5%) | 1,669 (55.2%) |
| 65 to 74 Years | 2,204 (100.0%) | 943 (42.8%) |
| 75 Years and over | 1,433 (99.0%) | 624 (43.1%) |
| Total | 9,296 (39.0%) | 13,546 (56.8%) |
Disability Status by Sex by Age in George County

| Age Bracket | Male | Female |
| Under 5 Years | 47 (4.4%) | 0 (0.0%) |
| 5 to 17 Years | 128 (5.8%) | 164 (6.9%) |
| 18 to 34 Years | 326 (13.3%) | 372 (14.6%) |
| 35 to 64 Years | 1,129 (25.5%) | 732 (17.0%) |
| 65 to 74 Years | 533 (51.1%) | 562 (48.4%) |
| 75 Years and over | 449 (72.4%) | 418 (50.5%) |
Disability Class by Sex by Age in George County
Disability Class: Hearing Difficulty

| Age Bracket | Male | Female |
| Under 5 Years | 47 (4.4%) | 0 (0.0%) |
| 5 to 17 Years | 1 (0.1%) | 0 (0.0%) |
| 18 to 34 Years | 203 (8.3%) | 0 (0.0%) |
| 35 to 64 Years | 563 (12.7%) | 147 (3.4%) |
| 65 to 74 Years | 292 (28.0%) | 91 (7.8%) |
| 75 Years and over | 256 (41.3%) | 155 (18.7%) |
Disability Class: Vision Difficulty
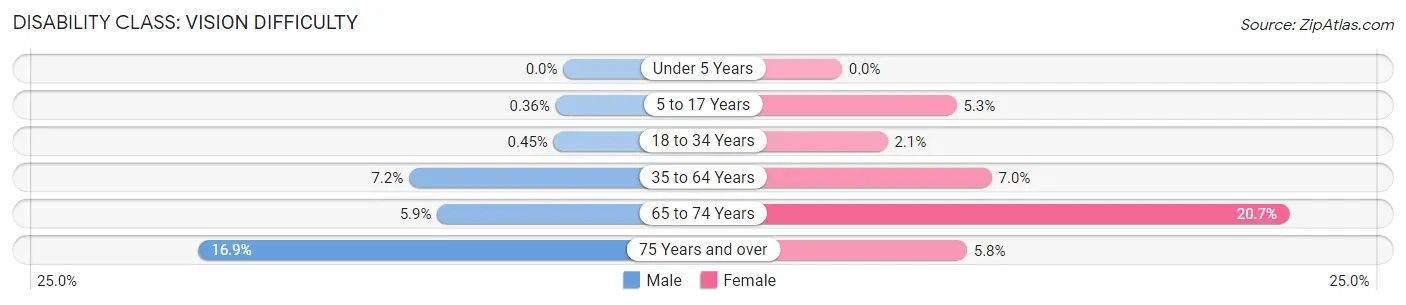
| Age Bracket | Male | Female |
| Under 5 Years | 0 (0.0%) | 0 (0.0%) |
| 5 to 17 Years | 8 (0.4%) | 127 (5.3%) |
| 18 to 34 Years | 11 (0.4%) | 54 (2.1%) |
| 35 to 64 Years | 317 (7.2%) | 299 (7.0%) |
| 65 to 74 Years | 61 (5.9%) | 241 (20.7%) |
| 75 Years and over | 105 (16.9%) | 48 (5.8%) |
Disability Class: Cognitive Difficulty
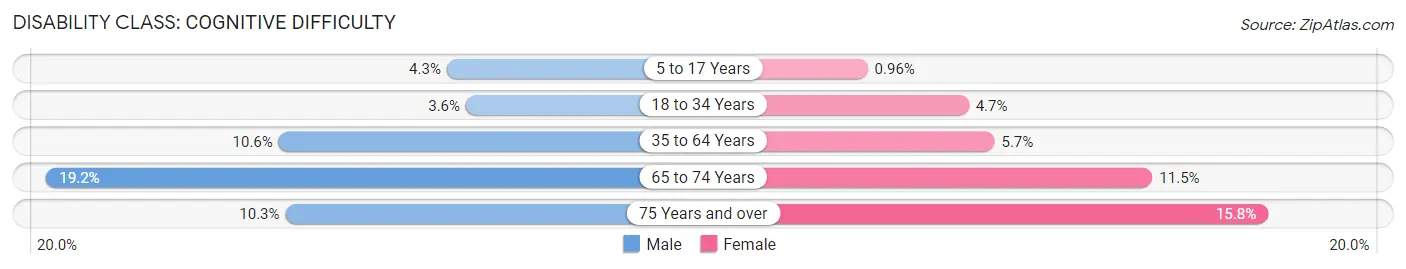
| Age Bracket | Male | Female |
| 5 to 17 Years | 95 (4.3%) | 23 (1.0%) |
| 18 to 34 Years | 89 (3.6%) | 120 (4.7%) |
| 35 to 64 Years | 468 (10.6%) | 244 (5.7%) |
| 65 to 74 Years | 200 (19.2%) | 134 (11.5%) |
| 75 Years and over | 64 (10.3%) | 131 (15.8%) |
Disability Class: Ambulatory Difficulty

| Age Bracket | Male | Female |
| 5 to 17 Years | 25 (1.1%) | 14 (0.6%) |
| 18 to 34 Years | 213 (8.7%) | 40 (1.6%) |
| 35 to 64 Years | 498 (11.3%) | 347 (8.1%) |
| 65 to 74 Years | 313 (30.0%) | 453 (39.0%) |
| 75 Years and over | 173 (27.9%) | 359 (43.4%) |
Disability Class: Self-Care Difficulty

| Age Bracket | Male | Female |
| 5 to 17 Years | 25 (1.1%) | 0 (0.0%) |
| 18 to 34 Years | 9 (0.4%) | 40 (1.6%) |
| 35 to 64 Years | 265 (6.0%) | 120 (2.8%) |
| 65 to 74 Years | 93 (8.9%) | 43 (3.7%) |
| 75 Years and over | 70 (11.3%) | 144 (17.4%) |
Technology Access in George County
Computing Device Access in George County

| Device Type | # Households | % Households |
| Desktop or Laptop | 5,501 | 61.3% |
| Smartphone | 7,498 | 83.5% |
| Tablet | 4,673 | 52.0% |
| No Computing Device | 1,058 | 11.8% |
| Total | 8,978 | 100.0% |
Internet Access in George County

| Internet Type | # Households | % Households |
| Dial-Up Internet | 115 | 1.3% |
| Broadband Home | 3,804 | 42.4% |
| Cellular Data Only | 1,880 | 20.9% |
| Satellite Internet | 1,341 | 14.9% |
| No Internet | 2,084 | 23.2% |
| Total | 8,978 | 100.0% |
George County Summary
George County is a county located in the southeastern corner of the U.S. state of Mississippi. As of the 2010 census, the population was 22,578. Its county seat is Lucedale. The county is named for James Z. George, a prominent lawyer and Mississippi state senator.
Geography
George County is located in the southeastern corner of Mississippi, along the border with Alabama. It is bordered by Greene County to the north, Jackson County to the east, and Mobile County, Alabama, to the south and west. The county has a total area of 590 square miles, of which 586 square miles is land and 4.2 square miles (0.7%) is water.
The county is located in the Coastal Plain region of Mississippi, and is mostly flat. The Pascagoula River forms the western border of the county, and the Leaf River forms the eastern border. The county is drained by several small creeks, including the Escatawpa River, which flows through the county seat of Lucedale.
Demographics
As of the 2010 United States Census, there were 22,578 people living in the county. The racial makeup of the county was 79.2% White, 17.7% Black or African American, 0.4% Native American, 0.3% Asian, 0.1% Pacific Islander, 0.7% from other races, and 1.6% from two or more races. 2.2% of the population were Hispanic or Latino of any race.
As of the census of 2000, there were 20,919 people, 7,717 households, and 5,717 families living in the county. The population density was 36 people per square mile (14/km^2). There were 8,717 housing units at an average density of 15 per square mile (6/km^2). The racial makeup of the county was 81.17% White, 16.45% Black or African American, 0.37% Native American, 0.17% Asian, 0.02% Pacific Islander, 0.90% from other races, and 0.82% from two or more races. 1.76% of the population were Hispanic or Latino of any race.
Economy
George County is a rural county with a largely agricultural economy. The county is home to several large poultry farms, as well as several timber and lumber companies. The county is also home to several small businesses, including a few restaurants and retail stores.
The county is served by the George County School District, which operates several elementary, middle, and high schools. The county is also home to the George County Vocational-Technical Center, which provides vocational and technical training to students.
The county is served by the George County Regional Airport, which provides general aviation services to the area. The county is also served by the George County Transit Authority, which provides public transportation services to the county.
Conclusion
George County is a rural county located in the southeastern corner of Mississippi. The county has a population of 22,578, and is largely agricultural in nature. The county is home to several poultry farms, timber and lumber companies, and small businesses. The county is served by the George County School District, the George County Vocational-Technical Center, the George County Regional Airport, and the George County Transit Authority.
Common Questions
What is the Total Population of George County?
Total Population of George County is 24,547.
What is the Total Male Population of George County?
Total Male Population of George County is 12,440.
What is the Total Female Population of George County?
Total Female Population of George County is 12,107.
What is the Ratio of Males per 100 Females in George County?
There are 102.75 Males per 100 Females in George County.
What is the Ratio of Females per 100 Males in George County?
There are 97.32 Females per 100 Males in George County.
What is the Median Population Age in George County?
Median Population Age in George County is 36.4 Years.
What is the Average Family Size in George County
Average Family Size in George County is 3.1 People.
What is the Average Household Size in George County
Average Household Size in George County is 2.7 People.
What is Per Capita Income in George County?
Per Capita income in George County is $24,756.
What is the Median Family Income in George County?
Median Family Income in George County is $63,144.
What is the Median Household income in George County?
Median Household Income in George County is $51,349.
What is Income or Wage Gap in George County?
Income or Wage Gap in George County is 50.2%.
Women in George County earn 49.8 cents for every dollar earned by a man.
What is Family Income Deficit in George County?
Family Income Deficit in George County is $13,742.
Families that are below poverty line in George County earn $13,742 less on average than the poverty threshold level.
What is Inequality or Gini Index in George County?
Inequality or Gini Index in George County is 0.46.
How Large is the Labor Force in George County?
There are 9,440 People in the Labor Forcein in George County.
What is the Percentage of People in the Labor Force in George County?
50.3% of People are in the Labor Force in George County.
What is the Unemployment Rate in George County?
Unemployment Rate in George County is 10.4%.