Carroll County, MS
Carroll County Map

Carroll County Overview
9,930
TOTAL POPULATION
5,307
MALE POPULATION
4,623
FEMALE POPULATION
114.80
MALES / 100 FEMALES
87.11
FEMALES / 100 MALES
45.5
MEDIAN AGE
3.0
AVG FAMILY SIZE
2.4
AVG HOUSEHOLD SIZE
$29,588
PER CAPITA INCOME
$66,321
AVG FAMILY INCOME
$42,285
AVG HOUSEHOLD INCOME
10.6%
WAGE / INCOME GAP [ % ]
89.4¢/ $1
WAGE / INCOME GAP [ $ ]
0.46
INEQUALITY / GINI INDEX
3,893
LABOR FORCE [ PEOPLE ]
45.4%
PERCENT IN LABOR FORCE
6.0%
UNEMPLOYMENT RATE
Carroll County Area Codes
Race in Carroll County
The most populous races in Carroll County are White / Caucasian (6,290 | 63.3%), Black / African American (3,557 | 35.8%), and Two or more Races (83 | 0.8%).

| Race | # Population | % Population |
| Asian | 0 | 0.0% |
| Black / African American | 3,557 | 35.8% |
| Hawaiian / Pacific | 0 | 0.0% |
| Hispanic or Latino | 11 | 0.1% |
| Native / Alaskan | 0 | 0.0% |
| White / Caucasian | 6,290 | 63.3% |
| Two or more Races | 83 | 0.8% |
| Some other Race | 0 | 0.0% |
| Total | 9,930 | 100.0% |
Ancestry in Carroll County
The most populous ancestries reported in Carroll County are American (1,301 | 13.1%), English (558 | 5.6%), Irish (237 | 2.4%), Italian (196 | 2.0%), and Scotch-Irish (178 | 1.8%), together accounting for 24.9% of all Carroll County residents.

| Ancestry | # Population | % Population |
| African | 94 | 0.9% |
| American | 1,301 | 13.1% |
| English | 558 | 5.6% |
| European | 63 | 0.6% |
| French | 78 | 0.8% |
| German | 126 | 1.3% |
| Irish | 237 | 2.4% |
| Italian | 196 | 2.0% |
| Mexican | 5 | 0.1% |
| Navajo | 21 | 0.2% |
| Puerto Rican | 6 | 0.1% |
| Scotch-Irish | 178 | 1.8% |
| Scottish | 88 | 0.9% |
| Subsaharan African | 94 | 0.9% |
| Welsh | 38 | 0.4% | View All 15 Rows |
Immigrants in Carroll County

| Immigration Origin | # Population | % Population | View All 0 Rows |
Sex and Age in Carroll County
Sex and Age in Carroll County
The most populous age groups in Carroll County are 35 to 39 Years (514 | 9.7%) for men and 55 to 59 Years (453 | 9.8%) for women.

| Age Bracket | Male | Female |
| Under 5 Years | 273 (5.1%) | 130 (2.8%) |
| 5 to 9 Years | 290 (5.5%) | 191 (4.1%) |
| 10 to 14 Years | 193 (3.6%) | 216 (4.7%) |
| 15 to 19 Years | 452 (8.5%) | 253 (5.5%) |
| 20 to 24 Years | 333 (6.3%) | 208 (4.5%) |
| 25 to 29 Years | 264 (5.0%) | 254 (5.5%) |
| 30 to 34 Years | 199 (3.7%) | 251 (5.4%) |
| 35 to 39 Years | 514 (9.7%) | 294 (6.4%) |
| 40 to 44 Years | 264 (5.0%) | 292 (6.3%) |
| 45 to 49 Years | 270 (5.1%) | 235 (5.1%) |
| 50 to 54 Years | 380 (7.2%) | 302 (6.5%) |
| 55 to 59 Years | 275 (5.2%) | 453 (9.8%) |
| 60 to 64 Years | 465 (8.8%) | 294 (6.4%) |
| 65 to 69 Years | 362 (6.8%) | 405 (8.8%) |
| 70 to 74 Years | 260 (4.9%) | 261 (5.7%) |
| 75 to 79 Years | 215 (4.1%) | 239 (5.2%) |
| 80 to 84 Years | 126 (2.4%) | 163 (3.5%) |
| 85 Years and over | 172 (3.2%) | 182 (3.9%) |
| Total | 5,307 (100.0%) | 4,623 (100.0%) |
Families and Households in Carroll County
Median Family Size in Carroll County
The median family size in Carroll County is 3.00 persons per family, with single female/mother families (534 | 20.4%) accounting for the largest median family size of 3.97 persons per family. On the other hand, single male/father families (171 | 6.5%) represent the smallest median family size with 2.19 persons per family.

| Family Type | # Families | Family Size |
| Married-Couple | 1,916 (73.1%) | 2.81 |
| Single Male/Father | 171 (6.5%) | 2.19 |
| Single Female/Mother | 534 (20.4%) | 3.97 |
| Total Families | 2,621 (100.0%) | 3.00 |
Median Household Size in Carroll County
The median household size in Carroll County is 2.36 persons per household, with single female/mother households (534 | 13.2%) accounting for the largest median household size of 4.08 persons per household. non-family households (1,416 | 35.1%) represent the smallest median household size with 1.12 persons per household.

| Household Type | # Households | Household Size |
| Married-Couple | 1,916 (47.5%) | 2.81 |
| Single Male/Father | 171 (4.2%) | 2.30 |
| Single Female/Mother | 534 (13.2%) | 4.08 |
| Non-family | 1,416 (35.1%) | 1.12 |
| Total Households | 4,037 (100.0%) | 2.36 |
Household Size by Marriage Status in Carroll County
Out of a total of 4,037 households in Carroll County, 2,621 (64.9%) are family households, while 1,416 (35.1%) are nonfamily households. The most numerous type of family households are 2-person households, comprising 1,473, and the most common type of nonfamily households are 1-person households, comprising 1,301.

| Household Size | Family Households | Nonfamily Households |
| 1-Person Households | - | 1,301 (32.2%) |
| 2-Person Households | 1,473 (36.5%) | 115 (2.9%) |
| 3-Person Households | 552 (13.7%) | 0 (0.0%) |
| 4-Person Households | 429 (10.6%) | 0 (0.0%) |
| 5-Person Households | 48 (1.2%) | 0 (0.0%) |
| 6-Person Households | 82 (2.0%) | 0 (0.0%) |
| 7+ Person Households | 37 (0.9%) | 0 (0.0%) |
| Total | 2,621 (64.9%) | 1,416 (35.1%) |
Female Fertility in Carroll County
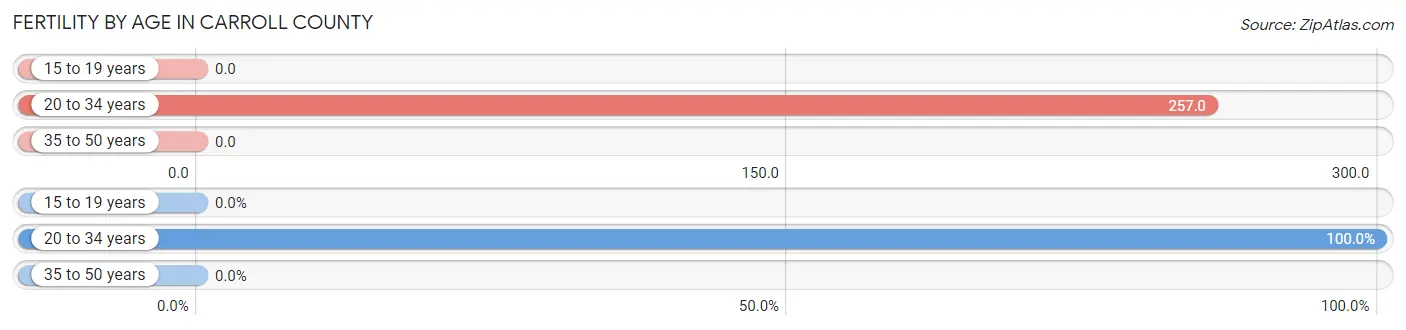
Fertility by Age in Carroll County
Average fertility rate in Carroll County is 102.0 births per 1,000 women. Women in the age bracket of 20 to 34 years have the highest fertility rate with 257.0 births per 1,000 women. Women in the age bracket of 20 to 34 years acount for 100.0% of all women with births.
| Age Bracket | Women with Births | Births / 1,000 Women |
| 15 to 19 years | 0 (0.0%) | 0.0 |
| 20 to 34 years | 183 (100.0%) | 257.0 |
| 35 to 50 years | 0 (0.0%) | 0.0 |
| Total | 183 (100.0%) | 102.0 |
Fertility by Age by Marriage Status in Carroll County
74.9% of women with births (183) in Carroll County are married. The highest percentage of unmarried women with births falls into 20 to 34 years age bracket with 25.1% of them unmarried at the time of birth, while the lowest percentage of unmarried women with births belong to 20 to 34 years age bracket with 25.1% of them unmarried.

| Age Bracket | Married | Unmarried |
| 15 to 19 years | 0 (0.0%) | 0 (0.0%) |
| 20 to 34 years | 137 (74.9%) | 46 (25.1%) |
| 35 to 50 years | 0 (0.0%) | 0 (0.0%) |
| Total | 137 (74.9%) | 46 (25.1%) |
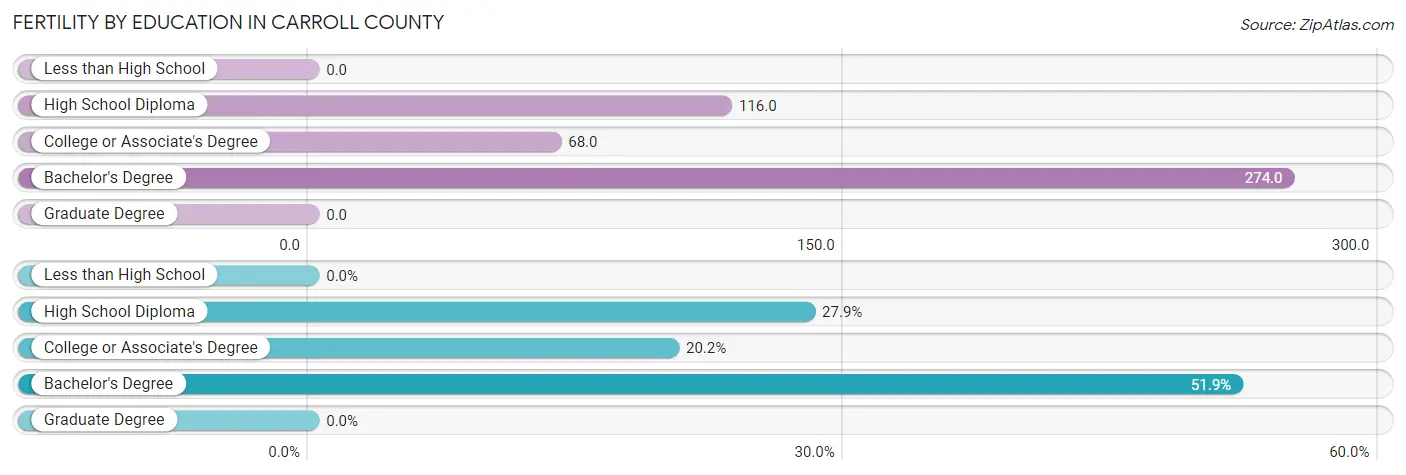
Fertility by Education in Carroll County
| Educational Attainment | Women with Births | Births / 1,000 Women |
| Less than High School | 0 (0.0%) | 0.0 |
| High School Diploma | 51 (27.9%) | 116.0 |
| College or Associate's Degree | 37 (20.2%) | 68.0 |
| Bachelor's Degree | 95 (51.9%) | 274.0 |
| Graduate Degree | 0 (0.0%) | 0.0 |
| Total | 183 (100.0%) | 102.0 |
Fertility by Education by Marriage Status in Carroll County
25.1% of women with births in Carroll County are unmarried. Women with the educational attainment of bachelor's degree are most likely to be married with 100.0% of them married at childbirth, while women with the educational attainment of college or associate's degree are least likely to be married with 54.0% of them unmarried at childbirth.

| Educational Attainment | Married | Unmarried |
| Less than High School | 0 (0.0%) | 0 (0.0%) |
| High School Diploma | 25 (49.0%) | 26 (51.0%) |
| College or Associate's Degree | 17 (46.0%) | 20 (54.0%) |
| Bachelor's Degree | 95 (100.0%) | 0 (0.0%) |
| Graduate Degree | 0 (0.0%) | 0 (0.0%) |
| Total | 137 (74.9%) | 46 (25.1%) |
Income in Carroll County
Income Overview in Carroll County
Per Capita Income in Carroll County is $29,588, while median incomes of families and households are $66,321 and $42,285 respectively.
| Characteristic | Number | Measure |
| Per Capita Income | 9,930 | $29,588 |
| Median Family Income | 2,621 | $66,321 |
| Mean Family Income | 2,621 | $75,827 |
| Median Household Income | 4,037 | $42,285 |
| Mean Household Income | 4,037 | $61,964 |
| Income Deficit | 2,621 | $0 |
| Wage / Income Gap (%) | 9,930 | 10.62% |
| Wage / Income Gap ($) | 9,930 | 89.38¢ per $1 |
| Gini / Inequality Index | 9,930 | 0.46 |
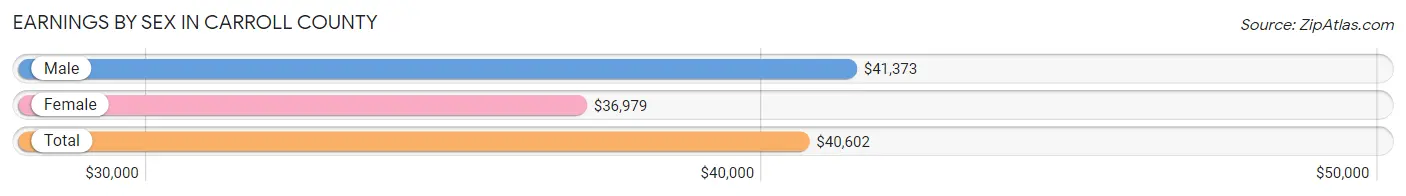
Earnings by Sex in Carroll County
Average Earnings in Carroll County are $40,602, $41,373 for men and $36,979 for women, a difference of 10.6%.
| Sex | Number | Average Earnings |
| Male | 2,280 (56.3%) | $41,373 |
| Female | 1,769 (43.7%) | $36,979 |
| Total | 4,049 (100.0%) | $40,602 |
Earnings by Sex by Income Bracket in Carroll County
The most common earnings brackets in Carroll County are $55,000 to $64,999 for men (415 | 18.2%) and $25,000 to $29,999 for women (318 | 18.0%).

| Income | Male | Female |
| $2,499 or less | 181 (7.9%) | 67 (3.8%) |
| $2,500 to $4,999 | 0 (0.0%) | 50 (2.8%) |
| $5,000 to $7,499 | 90 (4.0%) | 27 (1.5%) |
| $7,500 to $9,999 | 21 (0.9%) | 13 (0.7%) |
| $10,000 to $12,499 | 180 (7.9%) | 133 (7.5%) |
| $12,500 to $14,999 | 29 (1.3%) | 66 (3.7%) |
| $15,000 to $17,499 | 90 (4.0%) | 6 (0.3%) |
| $17,500 to $19,999 | 15 (0.7%) | 37 (2.1%) |
| $20,000 to $22,499 | 95 (4.2%) | 53 (3.0%) |
| $22,500 to $24,999 | 4 (0.2%) | 44 (2.5%) |
| $25,000 to $29,999 | 156 (6.8%) | 318 (18.0%) |
| $30,000 to $34,999 | 162 (7.1%) | 61 (3.5%) |
| $35,000 to $39,999 | 39 (1.7%) | 34 (1.9%) |
| $40,000 to $44,999 | 142 (6.2%) | 234 (13.2%) |
| $45,000 to $49,999 | 37 (1.6%) | 116 (6.6%) |
| $50,000 to $54,999 | 55 (2.4%) | 138 (7.8%) |
| $55,000 to $64,999 | 415 (18.2%) | 280 (15.8%) |
| $65,000 to $74,999 | 58 (2.5%) | 17 (1.0%) |
| $75,000 to $99,999 | 100 (4.4%) | 59 (3.3%) |
| $100,000+ | 411 (18.0%) | 16 (0.9%) |
| Total | 2,280 (100.0%) | 1,769 (100.0%) |
Earnings by Sex by Educational Attainment in Carroll County
Average earnings in Carroll County are $50,469 for men and $41,719 for women, a difference of 17.3%. Men with an educational attainment of bachelor's degree enjoy the highest average annual earnings of $125,652, while those with less than high school education earn the least with $20,268. Women with an educational attainment of graduate degree earn the most with the average annual earnings of $49,250, while those with less than high school education have the smallest earnings of $28,600.

| Educational Attainment | Male Income | Female Income |
| Less than High School | $20,268 | $28,600 |
| High School Diploma | $47,841 | $29,163 |
| College or Associate's Degree | $58,571 | $41,596 |
| Bachelor's Degree | $125,652 | $43,433 |
| Graduate Degree | $110,294 | $49,250 |
| Total | $50,469 | $41,719 |
Family Income in Carroll County
Family Income Brackets in Carroll County
According to the Carroll County family income data, there are 579 families falling into the $50,000 to $74,999 income range, which is the most common income bracket and makes up 22.1% of all families. Conversely, the less than $10,000 income bracket is the least frequent group with only 45 families (1.7%) belonging to this category.

| Income Bracket | # Families | % Families |
| Less than $10,000 | 45 | 1.7% |
| $10,000 to $14,999 | 160 | 6.1% |
| $15,000 to $24,999 | 189 | 7.2% |
| $25,000 to $34,999 | 168 | 6.4% |
| $35,000 to $49,999 | 425 | 16.2% |
| $50,000 to $74,999 | 579 | 22.1% |
| $75,000 to $99,999 | 370 | 14.1% |
| $100,000 to $149,999 | 435 | 16.6% |
| $150,000 to $199,999 | 189 | 7.2% |
| $200,000+ | 63 | 2.4% |
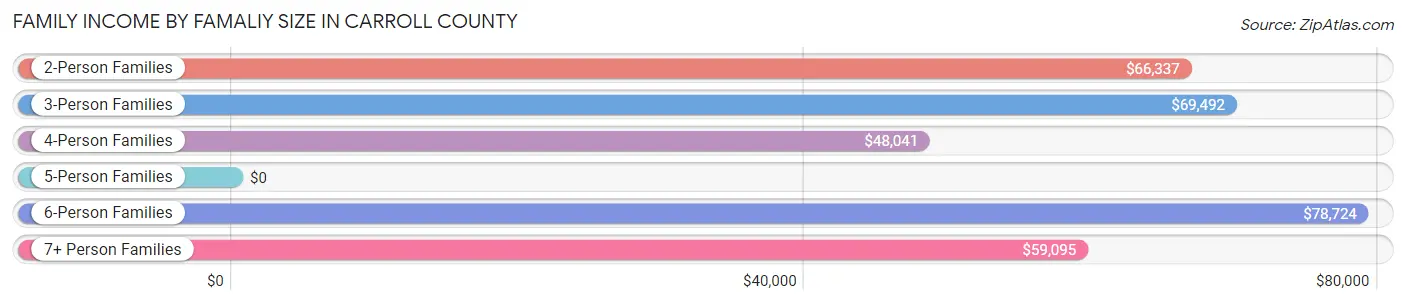
Family Income by Famaliy Size in Carroll County
6-person families (82 | 3.1%) account for the highest median family income in Carroll County with $78,724 per family, while 2-person families (1,474 | 56.2%) have the highest median income of $33,168 per family member.
| Income Bracket | # Families | Median Income |
| 2-Person Families | 1,474 (56.2%) | $66,337 |
| 3-Person Families | 611 (23.3%) | $69,492 |
| 4-Person Families | 370 (14.1%) | $48,041 |
| 5-Person Families | 47 (1.8%) | $0 |
| 6-Person Families | 82 (3.1%) | $78,724 |
| 7+ Person Families | 37 (1.4%) | $59,095 |
| Total | 2,621 (100.0%) | $66,321 |
Family Income by Number of Earners in Carroll County

| Number of Earners | # Families | Median Income |
| No Earners | 723 (27.6%) | $31,758 |
| 1 Earner | 826 (31.5%) | $65,606 |
| 2 Earners | 947 (36.1%) | $110,517 |
| 3+ Earners | 125 (4.8%) | $0 |
| Total | 2,621 (100.0%) | $66,321 |
Household Income in Carroll County
Household Income Brackets in Carroll County
With 626 households falling in the category, the $50,000 to $74,999 income range is the most frequent in Carroll County, accounting for 15.5% of all households. In contrast, only 61 households (1.5%) fall into the $200,000+ income bracket, making it the least populous group.

| Income Bracket | # Households | % Households |
| Less than $10,000 | 210 | 5.2% |
| $10,000 to $14,999 | 497 | 12.3% |
| $15,000 to $24,999 | 565 | 14.0% |
| $25,000 to $34,999 | 404 | 10.0% |
| $35,000 to $49,999 | 476 | 11.8% |
| $50,000 to $74,999 | 626 | 15.5% |
| $75,000 to $99,999 | 432 | 10.7% |
| $100,000 to $149,999 | 464 | 11.5% |
| $150,000 to $199,999 | 307 | 7.6% |
| $200,000+ | 61 | 1.5% |
Household Income by Householder Age in Carroll County
The median household income in Carroll County is $42,285, with the highest median household income of $77,540 found in the 25 to 44 years age bracket for the primary householder. A total of 922 households (22.8%) fall into this category. Meanwhile, the 65+ years age bracket for the primary householder has the lowest median household income of $27,412, with 1,496 households (37.1%) in this group.

| Income Bracket | # Households | Median Income |
| 15 to 24 Years | 76 (1.9%) | $28,750 |
| 25 to 44 Years | 922 (22.8%) | $77,540 |
| 45 to 64 Years | 1,543 (38.2%) | $53,938 |
| 65+ Years | 1,496 (37.1%) | $27,412 |
| Total | 4,037 (100.0%) | $42,285 |
Poverty in Carroll County
Income Below Poverty by Sex and Age in Carroll County
With 23.5% poverty level for males and 20.0% for females among the residents of Carroll County, 6 to 11 year old males and 15 year old females are the most vulnerable to poverty, with 89 males (39.6%) and 28 females (73.7%) in their respective age groups living below the poverty level.
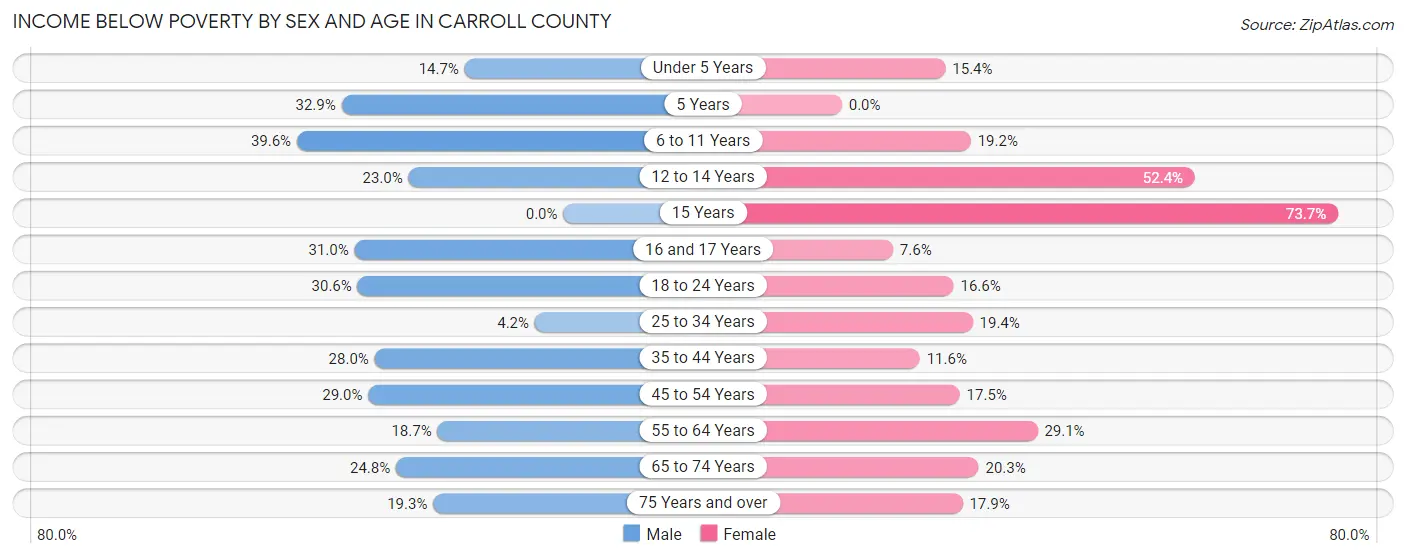
| Age Bracket | Male | Female |
| Under 5 Years | 40 (14.6%) | 20 (15.4%) |
| 5 Years | 27 (32.9%) | 0 (0.0%) |
| 6 to 11 Years | 89 (39.6%) | 45 (19.2%) |
| 12 to 14 Years | 40 (23.0%) | 54 (52.4%) |
| 15 Years | 0 (0.0%) | 28 (73.7%) |
| 16 and 17 Years | 80 (31.0%) | 12 (7.6%) |
| 18 to 24 Years | 139 (30.5%) | 44 (16.6%) |
| 25 to 34 Years | 18 (4.2%) | 94 (19.4%) |
| 35 to 44 Years | 190 (28.0%) | 62 (11.6%) |
| 45 to 54 Years | 177 (29.0%) | 94 (17.5%) |
| 55 to 64 Years | 131 (18.7%) | 217 (29.0%) |
| 65 to 74 Years | 153 (24.8%) | 133 (20.3%) |
| 75 Years and over | 97 (19.3%) | 100 (17.9%) |
| Total | 1,181 (23.5%) | 903 (20.0%) |
Income Above Poverty by Sex and Age in Carroll County
According to the poverty statistics in Carroll County, males aged 15 years and females aged 5 years are the age groups that are most secure financially, with 100.0% of males and 100.0% of females in these age groups living above the poverty line.

| Age Bracket | Male | Female |
| Under 5 Years | 233 (85.4%) | 110 (84.6%) |
| 5 Years | 55 (67.1%) | 69 (100.0%) |
| 6 to 11 Years | 136 (60.4%) | 190 (80.8%) |
| 12 to 14 Years | 134 (77.0%) | 49 (47.6%) |
| 15 Years | 24 (100.0%) | 10 (26.3%) |
| 16 and 17 Years | 178 (69.0%) | 146 (92.4%) |
| 18 to 24 Years | 316 (69.5%) | 221 (83.4%) |
| 25 to 34 Years | 408 (95.8%) | 390 (80.6%) |
| 35 to 44 Years | 488 (72.0%) | 474 (88.4%) |
| 45 to 54 Years | 434 (71.0%) | 443 (82.5%) |
| 55 to 64 Years | 570 (81.3%) | 530 (71.0%) |
| 65 to 74 Years | 463 (75.2%) | 522 (79.7%) |
| 75 Years and over | 405 (80.7%) | 458 (82.1%) |
| Total | 3,844 (76.5%) | 3,612 (80.0%) |
Income Below Poverty Among Married-Couple Families in Carroll County
The poverty statistics for married-couple families in Carroll County show that 7.5% or 143 of the total 1,916 families live below the poverty line. Families with no children have the highest poverty rate of 8.0%, comprising of 110 families. On the other hand, families with 3 or 4 children have the lowest poverty rate of 0.0%, which includes 0 families.

| Children | Above Poverty | Below Poverty |
| No Children | 1,264 (92.0%) | 110 (8.0%) |
| 1 or 2 Children | 449 (93.1%) | 33 (6.9%) |
| 3 or 4 Children | 53 (100.0%) | 0 (0.0%) |
| 5 or more Children | 7 (100.0%) | 0 (0.0%) |
| Total | 1,773 (92.5%) | 143 (7.5%) |
Income Below Poverty Among Single-Parent Households in Carroll County
According to the poverty data in Carroll County, 36.3% or 62 single-father households and 30.7% or 164 single-mother households are living below the poverty line. Among single-father households, those with no children have the highest poverty rate, with 62 households (53.0%) experiencing poverty. Likewise, among single-mother households, those with 3 or 4 children have the highest poverty rate, with 15 households (48.4%) falling below the poverty line.

| Children | Single Father | Single Mother |
| No Children | 62 (53.0%) | 41 (25.3%) |
| 1 or 2 Children | 0 (0.0%) | 108 (31.7%) |
| 3 or 4 Children | 0 (0.0%) | 15 (48.4%) |
| 5 or more Children | 0 (0.0%) | 0 (0.0%) |
| Total | 62 (36.3%) | 164 (30.7%) |
Income Below Poverty Among Married-Couple vs Single-Parent Households in Carroll County
The poverty data for Carroll County shows that 143 of the married-couple family households (7.5%) and 226 of the single-parent households (32.1%) are living below the poverty level. Within the married-couple family households, those with no children have the highest poverty rate, with 110 households (8.0%) falling below the poverty line. Among the single-parent households, those with 3 or 4 children have the highest poverty rate, with 15 household (48.4%) living below poverty.
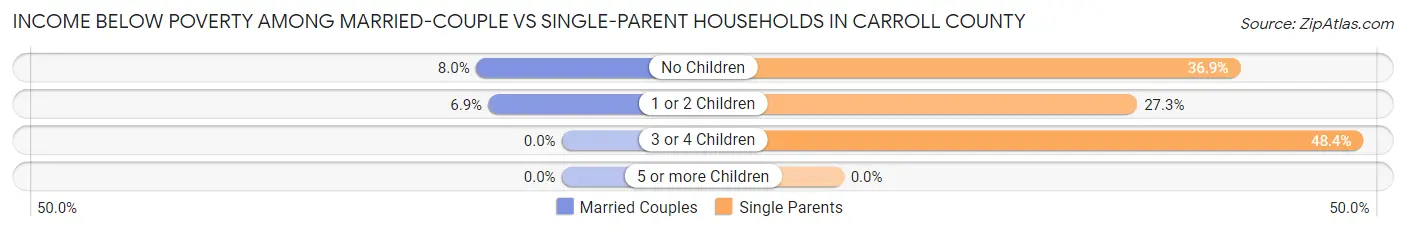
| Children | Married-Couple Families | Single-Parent Households |
| No Children | 110 (8.0%) | 103 (36.9%) |
| 1 or 2 Children | 33 (6.9%) | 108 (27.3%) |
| 3 or 4 Children | 0 (0.0%) | 15 (48.4%) |
| 5 or more Children | 0 (0.0%) | 0 (0.0%) |
| Total | 143 (7.5%) | 226 (32.1%) |
Employment Characteristics in Carroll County
Employment by Class of Employer in Carroll County
Among the 3,525 employed individuals in Carroll County, private company employees (2,348 | 66.6%), state government employees (345 | 9.8%), and local government employees (337 | 9.6%) make up the most common classes of employment.
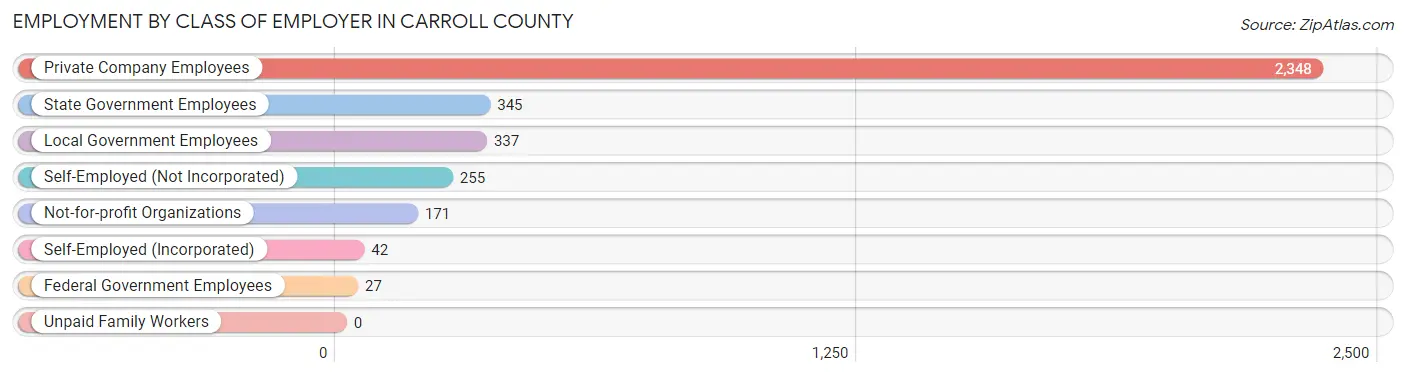
| Employer Class | # Employees | % Employees |
| Private Company Employees | 2,348 | 66.6% |
| Self-Employed (Incorporated) | 42 | 1.2% |
| Self-Employed (Not Incorporated) | 255 | 7.2% |
| Not-for-profit Organizations | 171 | 4.9% |
| Local Government Employees | 337 | 9.6% |
| State Government Employees | 345 | 9.8% |
| Federal Government Employees | 27 | 0.8% |
| Unpaid Family Workers | 0 | 0.0% |
| Total | 3,525 | 100.0% |
Employment Status by Age in Carroll County
According to the labor force statistics for Carroll County, out of the total population over 16 years of age (8,575), 45.4% or 3,893 individuals are in the labor force, with 6.0% or 234 of them unemployed. The age group with the highest labor force participation rate is 30 to 34 years, with 87.3% or 393 individuals in the labor force. Within the labor force, the 25 to 29 years age range has the highest percentage of unemployed individuals, with 31.3% or 134 of them being unemployed.
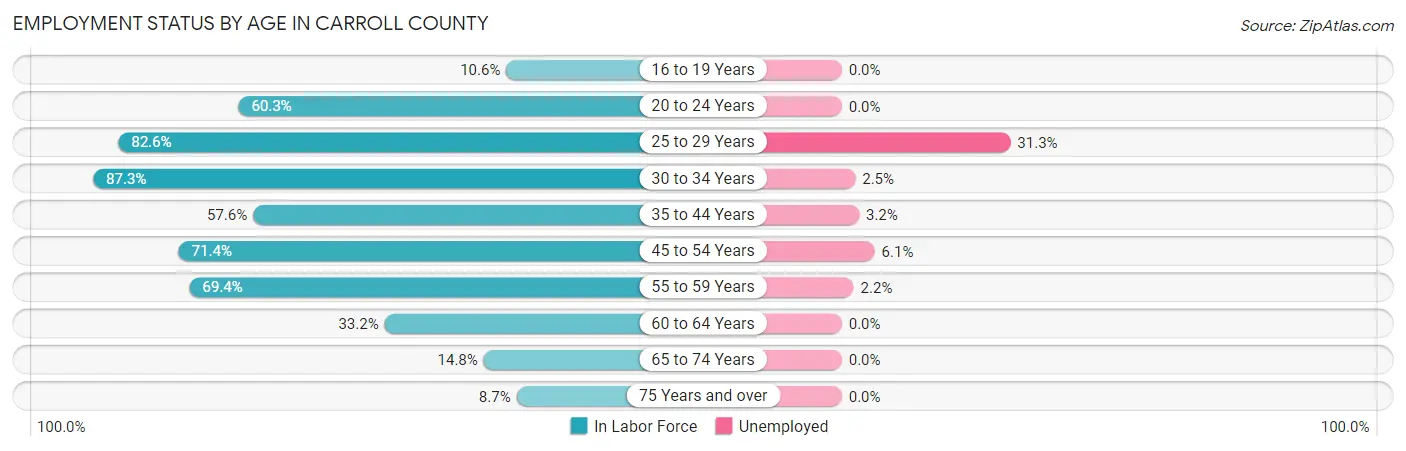
| Age Bracket | In Labor Force | Unemployed |
| 16 to 19 Years | 68 (10.6%) | 0 (0.0%) |
| 20 to 24 Years | 326 (60.3%) | 0 (0.0%) |
| 25 to 29 Years | 428 (82.6%) | 134 (31.3%) |
| 30 to 34 Years | 393 (87.3%) | 10 (2.5%) |
| 35 to 44 Years | 786 (57.6%) | 25 (3.2%) |
| 45 to 54 Years | 848 (71.4%) | 52 (6.1%) |
| 55 to 59 Years | 505 (69.4%) | 11 (2.2%) |
| 60 to 64 Years | 252 (33.2%) | 0 (0.0%) |
| 65 to 74 Years | 191 (14.8%) | 0 (0.0%) |
| 75 Years and over | 95 (8.7%) | 0 (0.0%) |
| Total | 3,893 (45.4%) | 234 (6.0%) |
Employment Status by Educational Attainment in Carroll County
According to labor force statistics for Carroll County, 64.1% of individuals (3,209) out of the total population between 25 and 64 years of age (5,006) are in the labor force, with 7.2% or 231 of them being unemployed. The group with the highest labor force participation rate are those with the educational attainment of bachelor's degree or higher, with 86.2% or 913 individuals in the labor force. Within the labor force, individuals with college / associate degree education have the highest percentage of unemployment, with 10.4% or 131 of them being unemployed.

| Educational Attainment | In Labor Force | Unemployed |
| Less than High School | 287 (32.8%) | 86 (9.8%) |
| High School Diploma | 754 (49.1%) | 135 (8.8%) |
| College / Associate Degree | 1,257 (81.7%) | 160 (10.4%) |
| Bachelor's Degree or higher | 913 (86.2%) | 8 (0.8%) |
| Total | 3,209 (64.1%) | 360 (7.2%) |
Employment Occupations by Sex in Carroll County
Management, Business, Science and Arts Occupations
The most common Management, Business, Science and Arts occupations in Carroll County are Health Diagnosing & Treating (357 | 9.8%), Computers, Engineering & Science (315 | 8.6%), Architecture & Engineering (264 | 7.2%), Management (228 | 6.2%), and Community & Social Service (201 | 5.5%).

Management, Business, Science and Arts Occupations by Sex
Within the Management, Business, Science and Arts occupations in Carroll County, the most male-oriented occupations are Business & Financial (100.0%), Computers & Mathematics (100.0%), and Life, Physical & Social Science (100.0%), while the most female-oriented occupations are Legal Services & Support (100.0%), Arts, Media & Entertainment (100.0%), and Education Instruction & Library (99.2%).
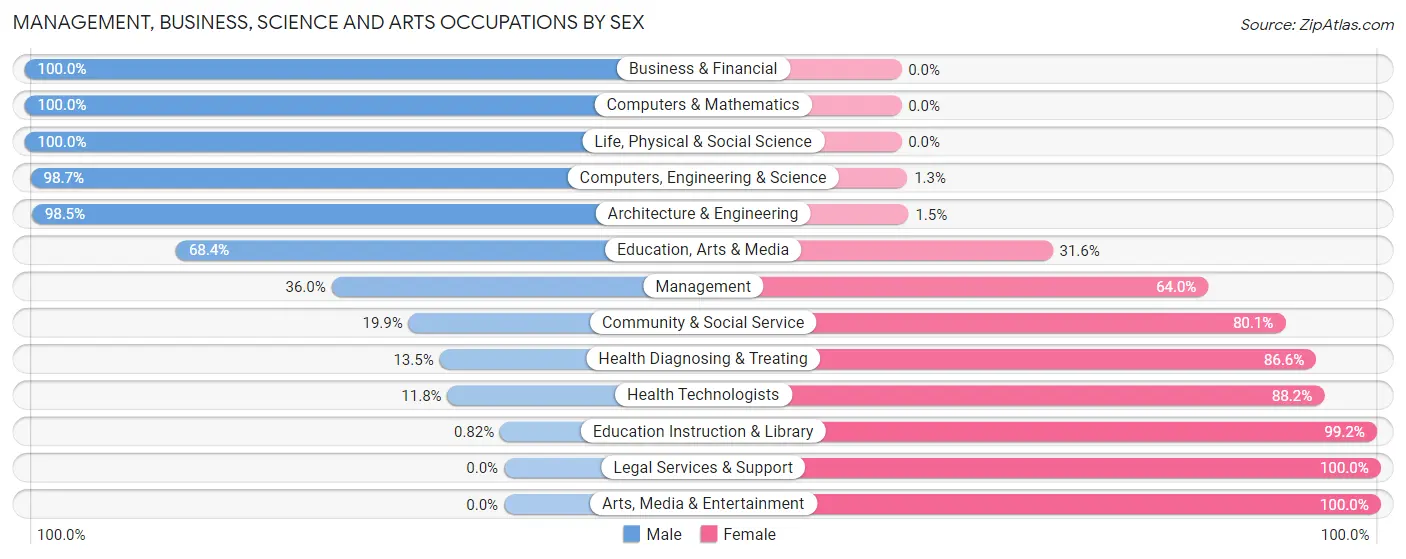
| Occupation | Male | Female |
| Management | 82 (36.0%) | 146 (64.0%) |
| Business & Financial | 96 (100.0%) | 0 (0.0%) |
| Computers, Engineering & Science | 311 (98.7%) | 4 (1.3%) |
| Computers & Mathematics | 36 (100.0%) | 0 (0.0%) |
| Architecture & Engineering | 260 (98.5%) | 4 (1.5%) |
| Life, Physical & Social Science | 15 (100.0%) | 0 (0.0%) |
| Community & Social Service | 40 (19.9%) | 161 (80.1%) |
| Education, Arts & Media | 39 (68.4%) | 18 (31.6%) |
| Legal Services & Support | 0 (0.0%) | 20 (100.0%) |
| Education Instruction & Library | 1 (0.8%) | 121 (99.2%) |
| Arts, Media & Entertainment | 0 (0.0%) | 2 (100.0%) |
| Health Diagnosing & Treating | 48 (13.5%) | 309 (86.6%) |
| Health Technologists | 19 (11.8%) | 142 (88.2%) |
| Total (Category) | 577 (48.2%) | 620 (51.8%) |
| Total (Overall) | 1,975 (54.0%) | 1,680 (46.0%) |
Services Occupations
The most common Services occupations in Carroll County are Food Preparation & Serving (142 | 3.9%), Security & Protection (85 | 2.3%), Healthcare Support (78 | 2.1%), Personal Care & Service (78 | 2.1%), and Cleaning & Maintenance (74 | 2.0%).

Services Occupations by Sex
Within the Services occupations in Carroll County, the most male-oriented occupations are Firefighting & Prevention (100.0%), Cleaning & Maintenance (60.8%), and Security & Protection (25.9%), while the most female-oriented occupations are Healthcare Support (100.0%), Law Enforcement (100.0%), and Food Preparation & Serving (100.0%).

| Occupation | Male | Female |
| Healthcare Support | 0 (0.0%) | 78 (100.0%) |
| Security & Protection | 22 (25.9%) | 63 (74.1%) |
| Firefighting & Prevention | 22 (100.0%) | 0 (0.0%) |
| Law Enforcement | 0 (0.0%) | 63 (100.0%) |
| Food Preparation & Serving | 0 (0.0%) | 142 (100.0%) |
| Cleaning & Maintenance | 45 (60.8%) | 29 (39.2%) |
| Personal Care & Service | 16 (20.5%) | 62 (79.5%) |
| Total (Category) | 83 (18.2%) | 374 (81.8%) |
| Total (Overall) | 1,975 (54.0%) | 1,680 (46.0%) |
Sales and Office Occupations
The most common Sales and Office occupations in Carroll County are Office & Administration (437 | 12.0%), and Sales & Related (328 | 9.0%).
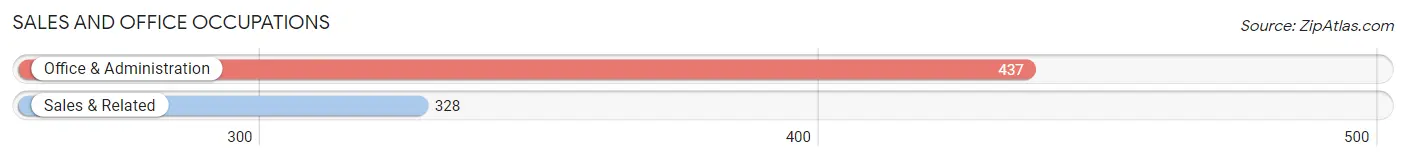
Sales and Office Occupations by Sex

| Occupation | Male | Female |
| Sales & Related | 250 (76.2%) | 78 (23.8%) |
| Office & Administration | 54 (12.4%) | 383 (87.6%) |
| Total (Category) | 304 (39.7%) | 461 (60.3%) |
| Total (Overall) | 1,975 (54.0%) | 1,680 (46.0%) |
Natural Resources, Construction and Maintenance Occupations
The most common Natural Resources, Construction and Maintenance occupations in Carroll County are Installation, Maintenance & Repair (377 | 10.3%), Construction & Extraction (312 | 8.5%), and Farming, Fishing & Forestry (46 | 1.3%).
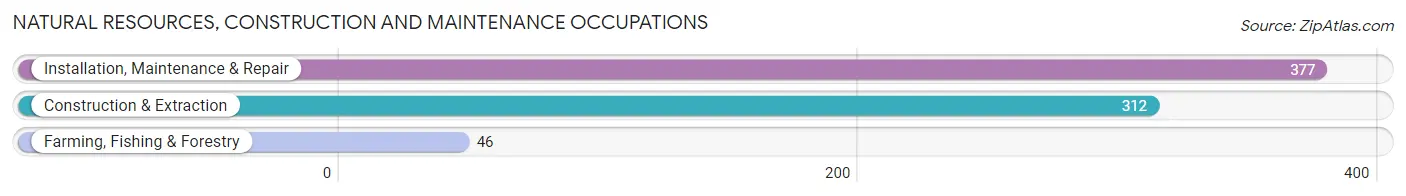
Natural Resources, Construction and Maintenance Occupations by Sex

| Occupation | Male | Female |
| Farming, Fishing & Forestry | 22 (47.8%) | 24 (52.2%) |
| Construction & Extraction | 312 (100.0%) | 0 (0.0%) |
| Installation, Maintenance & Repair | 312 (82.8%) | 65 (17.2%) |
| Total (Category) | 646 (87.9%) | 89 (12.1%) |
| Total (Overall) | 1,975 (54.0%) | 1,680 (46.0%) |
Production, Transportation and Moving Occupations
The most common Production, Transportation and Moving occupations in Carroll County are Production (305 | 8.3%), Material Moving (157 | 4.3%), and Transportation (39 | 1.1%).

Production, Transportation and Moving Occupations by Sex

| Occupation | Male | Female |
| Production | 234 (76.7%) | 71 (23.3%) |
| Transportation | 37 (94.9%) | 2 (5.1%) |
| Material Moving | 94 (59.9%) | 63 (40.1%) |
| Total (Category) | 365 (72.9%) | 136 (27.2%) |
| Total (Overall) | 1,975 (54.0%) | 1,680 (46.0%) |
Employment Industries by Sex in Carroll County
Employment Industries in Carroll County
The major employment industries in Carroll County include Construction (534 | 14.6%), Manufacturing (533 | 14.6%), Health Care & Social Assistance (486 | 13.3%), Educational Services (382 | 10.4%), and Retail Trade (329 | 9.0%).

Employment Industries by Sex in Carroll County
The Carroll County industries that see more men than women are Wholesale Trade (100.0%), Utilities (100.0%), and Information (100.0%), whereas the industries that tend to have a higher number of women are Accommodation & Food Services (100.0%), Health Care & Social Assistance (90.1%), and Educational Services (85.3%).

| Industry | Male | Female |
| Agriculture, Fishing & Hunting | 27 (31.4%) | 59 (68.6%) |
| Mining, Quarrying, & Extraction | 0 (0.0%) | 0 (0.0%) |
| Construction | 494 (92.5%) | 40 (7.5%) |
| Manufacturing | 401 (75.2%) | 132 (24.8%) |
| Wholesale Trade | 240 (100.0%) | 0 (0.0%) |
| Retail Trade | 106 (32.2%) | 223 (67.8%) |
| Transportation & Warehousing | 38 (41.8%) | 53 (58.2%) |
| Utilities | 67 (100.0%) | 0 (0.0%) |
| Information | 20 (100.0%) | 0 (0.0%) |
| Finance & Insurance | 24 (37.5%) | 40 (62.5%) |
| Real Estate, Rental & Leasing | 17 (100.0%) | 0 (0.0%) |
| Professional & Scientific | 104 (89.7%) | 12 (10.3%) |
| Enterprise Management | 0 (0.0%) | 0 (0.0%) |
| Administrative & Support | 11 (45.8%) | 13 (54.2%) |
| Educational Services | 56 (14.7%) | 326 (85.3%) |
| Health Care & Social Assistance | 48 (9.9%) | 438 (90.1%) |
| Arts, Entertainment & Recreation | 34 (100.0%) | 0 (0.0%) |
| Accommodation & Food Services | 0 (0.0%) | 169 (100.0%) |
| Public Administration | 96 (45.9%) | 113 (54.1%) |
| Total | 1,975 (54.0%) | 1,680 (46.0%) |
Education in Carroll County
School Enrollment in Carroll County
The most common levels of schooling among the 1,458 students in Carroll County are high school (421 | 28.9%), elementary school (351 | 24.1%), and middle school (289 | 19.8%).

| School Level | # Students | % Students |
| Nursery / Preschool | 65 | 4.5% |
| Kindergarten | 60 | 4.1% |
| Elementary School | 351 | 24.1% |
| Middle School | 289 | 19.8% |
| High School | 421 | 28.9% |
| College / Undergraduate | 252 | 17.3% |
| Graduate / Professional | 20 | 1.4% |
| Total | 1,458 | 100.0% |
School Enrollment by Age by Funding Source in Carroll County
Out of a total of 1,458 students who are enrolled in schools in Carroll County, 506 (34.7%) attend a private institution, while the remaining 952 (65.3%) are enrolled in public schools. The age group of 3 to 4 year olds has the highest likelihood of being enrolled in private schools, with 15 (50.0% in the age bracket) enrolled. Conversely, the age group of 18 to 19 year olds has the lowest likelihood of being enrolled in a private school, with 162 (100.0% in the age bracket) attending a public institution.

| Age Bracket | Public School | Private School |
| 3 to 4 Year Olds | 15 (50.0%) | 15 (50.0%) |
| 5 to 9 Year Old | 208 (56.2%) | 162 (43.8%) |
| 10 to 14 Year Olds | 229 (57.0%) | 173 (43.0%) |
| 15 to 17 Year Olds | 179 (60.7%) | 116 (39.3%) |
| 18 to 19 Year Olds | 162 (100.0%) | 0 (0.0%) |
| 20 to 24 Year Olds | 78 (100.0%) | 0 (0.0%) |
| 25 to 34 Year Olds | 45 (60.0%) | 30 (40.0%) |
| 35 Years and over | 36 (78.3%) | 10 (21.7%) |
| Total | 952 (65.3%) | 506 (34.7%) |
Educational Attainment by Field of Study in Carroll County
Engineering (269 | 19.0%), education (223 | 15.7%), business (208 | 14.7%), bio, nature & agricultural (173 | 12.2%), and science & technology (159 | 11.2%) are the most common fields of study among 1,418 individuals in Carroll County who have obtained a bachelor's degree or higher.

| Field of Study | # Graduates | % Graduates |
| Computers & Mathematics | 114 | 8.0% |
| Bio, Nature & Agricultural | 173 | 12.2% |
| Physical & Health Sciences | 19 | 1.3% |
| Psychology | 5 | 0.4% |
| Social Sciences | 43 | 3.0% |
| Engineering | 269 | 19.0% |
| Multidisciplinary Studies | 0 | 0.0% |
| Science & Technology | 159 | 11.2% |
| Business | 208 | 14.7% |
| Education | 223 | 15.7% |
| Literature & Languages | 2 | 0.1% |
| Liberal Arts & History | 40 | 2.8% |
| Visual & Performing Arts | 5 | 0.4% |
| Communications | 8 | 0.6% |
| Arts & Humanities | 150 | 10.6% |
| Total | 1,418 | 100.0% |
Transportation & Commute in Carroll County
Vehicle Availability by Sex in Carroll County
The most prevalent vehicle ownership categories in Carroll County are males with 2 vehicles (931, accounting for 48.1%) and females with 2 vehicles (832, making up 58.6%).

| Vehicles Available | Male | Female |
| No Vehicle | 63 (3.3%) | 38 (2.4%) |
| 1 Vehicle | 331 (17.1%) | 316 (19.9%) |
| 2 Vehicles | 931 (48.1%) | 832 (52.4%) |
| 3 Vehicles | 551 (28.4%) | 352 (22.2%) |
| 4 Vehicles | 53 (2.7%) | 40 (2.5%) |
| 5 or more Vehicles | 8 (0.4%) | 10 (0.6%) |
| Total | 1,937 (100.0%) | 1,588 (100.0%) |
Commute Time in Carroll County
The most frequently occuring commute durations in Carroll County are 30 to 34 minutes (636 commuters, 19.4%), 45 to 59 minutes (533 commuters, 16.2%), and 20 to 24 minutes (525 commuters, 16.0%).
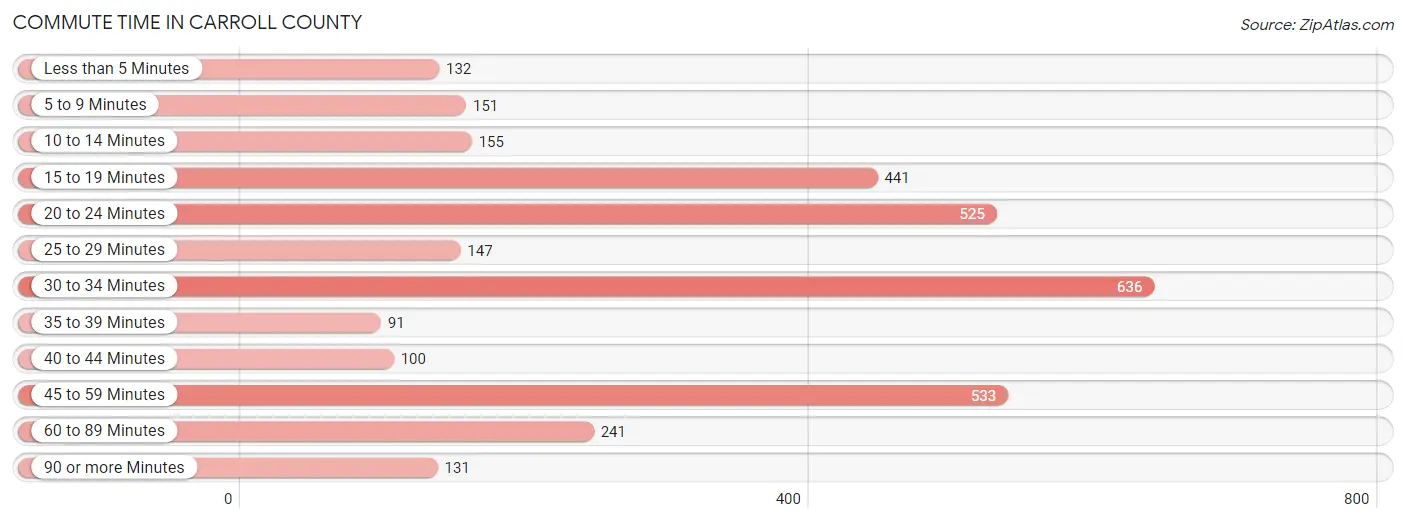
| Commute Time | # Commuters | % Commuters |
| Less than 5 Minutes | 132 | 4.0% |
| 5 to 9 Minutes | 151 | 4.6% |
| 10 to 14 Minutes | 155 | 4.7% |
| 15 to 19 Minutes | 441 | 13.4% |
| 20 to 24 Minutes | 525 | 16.0% |
| 25 to 29 Minutes | 147 | 4.5% |
| 30 to 34 Minutes | 636 | 19.4% |
| 35 to 39 Minutes | 91 | 2.8% |
| 40 to 44 Minutes | 100 | 3.0% |
| 45 to 59 Minutes | 533 | 16.2% |
| 60 to 89 Minutes | 241 | 7.3% |
| 90 or more Minutes | 131 | 4.0% |
Commute Time by Sex in Carroll County
The most common commute times in Carroll County are 30 to 34 minutes (466 commuters, 26.7%) for males and 15 to 19 minutes (332 commuters, 21.6%) for females.

| Commute Time | Male | Female |
| Less than 5 Minutes | 103 (5.9%) | 29 (1.9%) |
| 5 to 9 Minutes | 43 (2.5%) | 108 (7.0%) |
| 10 to 14 Minutes | 64 (3.7%) | 91 (5.9%) |
| 15 to 19 Minutes | 109 (6.2%) | 332 (21.6%) |
| 20 to 24 Minutes | 260 (14.9%) | 265 (17.2%) |
| 25 to 29 Minutes | 24 (1.4%) | 123 (8.0%) |
| 30 to 34 Minutes | 466 (26.7%) | 170 (11.1%) |
| 35 to 39 Minutes | 14 (0.8%) | 77 (5.0%) |
| 40 to 44 Minutes | 19 (1.1%) | 81 (5.3%) |
| 45 to 59 Minutes | 302 (17.3%) | 231 (15.0%) |
| 60 to 89 Minutes | 221 (12.7%) | 20 (1.3%) |
| 90 or more Minutes | 120 (6.9%) | 11 (0.7%) |
Time of Departure to Work by Sex in Carroll County
The most frequent times of departure to work in Carroll County are 6:00 AM to 6:29 AM (453, 26.0%) for males and 7:30 AM to 7:59 AM (313, 20.3%) for females.

| Time of Departure | Male | Female |
| 12:00 AM to 4:59 AM | 129 (7.4%) | 122 (7.9%) |
| 5:00 AM to 5:29 AM | 85 (4.9%) | 42 (2.7%) |
| 5:30 AM to 5:59 AM | 120 (6.9%) | 65 (4.2%) |
| 6:00 AM to 6:29 AM | 453 (26.0%) | 111 (7.2%) |
| 6:30 AM to 6:59 AM | 192 (11.0%) | 170 (11.1%) |
| 7:00 AM to 7:29 AM | 376 (21.5%) | 234 (15.2%) |
| 7:30 AM to 7:59 AM | 176 (10.1%) | 313 (20.3%) |
| 8:00 AM to 8:29 AM | 97 (5.6%) | 209 (13.6%) |
| 8:30 AM to 8:59 AM | 50 (2.9%) | 0 (0.0%) |
| 9:00 AM to 9:59 AM | 10 (0.6%) | 104 (6.8%) |
| 10:00 AM to 10:59 AM | 0 (0.0%) | 58 (3.8%) |
| 11:00 AM to 11:59 AM | 0 (0.0%) | 0 (0.0%) |
| 12:00 PM to 3:59 PM | 2 (0.1%) | 41 (2.7%) |
| 4:00 PM to 11:59 PM | 55 (3.2%) | 69 (4.5%) |
| Total | 1,745 (100.0%) | 1,538 (100.0%) |
Housing Occupancy in Carroll County
Occupancy by Ownership in Carroll County
Of the total 4,037 dwellings in Carroll County, owner-occupied units account for 3,323 (82.3%), while renter-occupied units make up 714 (17.7%).

| Occupancy | # Housing Units | % Housing Units |
| Owner Occupied Housing Units | 3,323 | 82.3% |
| Renter-Occupied Housing Units | 714 | 17.7% |
| Total Occupied Housing Units | 4,037 | 100.0% |
Occupancy by Household Size in Carroll County

| Household Size | # Housing Units | % Housing Units |
| 1-Person Household | 1,301 | 32.2% |
| 2-Person Household | 1,588 | 39.3% |
| 3-Person Household | 552 | 13.7% |
| 4+ Person Household | 596 | 14.8% |
| Total Housing Units | 4,037 | 100.0% |
Occupancy by Ownership by Household Size in Carroll County
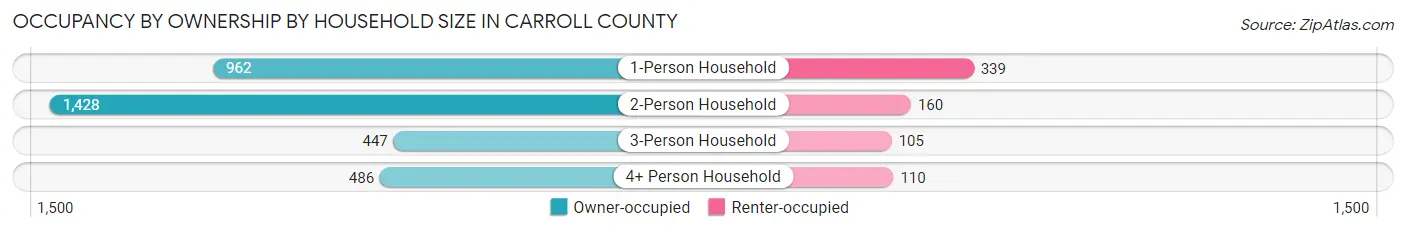
| Household Size | Owner-occupied | Renter-occupied |
| 1-Person Household | 962 (73.9%) | 339 (26.1%) |
| 2-Person Household | 1,428 (89.9%) | 160 (10.1%) |
| 3-Person Household | 447 (81.0%) | 105 (19.0%) |
| 4+ Person Household | 486 (81.5%) | 110 (18.5%) |
| Total Housing Units | 3,323 (82.3%) | 714 (17.7%) |
Occupancy by Educational Attainment in Carroll County

| Household Size | Owner-occupied | Renter-occupied |
| Less than High School | 840 (76.2%) | 263 (23.8%) |
| High School Diploma | 827 (79.4%) | 215 (20.6%) |
| College/Associate Degree | 867 (85.9%) | 142 (14.1%) |
| Bachelor's Degree or higher | 789 (89.3%) | 94 (10.6%) |
Occupancy by Age of Householder in Carroll County

| Age Bracket | # Households | % Households |
| Under 35 Years | 380 | 9.4% |
| 35 to 44 Years | 618 | 15.3% |
| 45 to 54 Years | 653 | 16.2% |
| 55 to 64 Years | 890 | 22.1% |
| 65 to 74 Years | 680 | 16.8% |
| 75 to 84 Years | 543 | 13.5% |
| 85 Years and Over | 273 | 6.8% |
| Total | 4,037 | 100.0% |
Housing Finances in Carroll County
Median Income by Occupancy in Carroll County

| Occupancy Type | # Households | Median Income |
| Owner-Occupied | 3,323 (82.3%) | $52,752 |
| Renter-Occupied | 714 (17.7%) | $21,200 |
| Average | 4,037 (100.0%) | $42,285 |
Occupancy by Householder Income Bracket in Carroll County

| Income Bracket | Owner-occupied | Renter-occupied |
| Less than $5,000 | 30 (0.9%) | 10 (1.4%) |
| $5,000 to $9,999 | 101 (3.0%) | 69 (9.7%) |
| $10,000 to $14,999 | 356 (10.7%) | 140 (19.6%) |
| $15,000 to $19,999 | 176 (5.3%) | 114 (16.0%) |
| $20,000 to $24,999 | 207 (6.2%) | 67 (9.4%) |
| $25,000 to $34,999 | 314 (9.5%) | 89 (12.5%) |
| $35,000 to $49,999 | 422 (12.7%) | 53 (7.4%) |
| $50,000 to $74,999 | 598 (18.0%) | 28 (3.9%) |
| $75,000 to $99,999 | 311 (9.4%) | 119 (16.7%) |
| $100,000 to $149,999 | 441 (13.3%) | 24 (3.4%) |
| $150,000 or more | 367 (11.0%) | 1 (0.1%) |
| Total | 3,323 (100.0%) | 714 (100.0%) |
Monthly Housing Cost Tiers in Carroll County

| Monthly Cost | Owner-occupied | Renter-occupied |
| Less than $300 | 715 (21.5%) | 88 (12.3%) |
| $300 to $499 | 1,006 (30.3%) | 128 (17.9%) |
| $500 to $799 | 468 (14.1%) | 200 (28.0%) |
| $800 to $999 | 261 (7.9%) | 53 (7.4%) |
| $1,000 to $1,499 | 469 (14.1%) | 63 (8.8%) |
| $1,500 to $1,999 | 272 (8.2%) | 53 (7.4%) |
| $2,000 to $2,499 | 68 (2.1%) | 0 (0.0%) |
| $2,500 to $2,999 | 43 (1.3%) | 0 (0.0%) |
| $3,000 or more | 21 (0.6%) | 0 (0.0%) |
| Total | 3,323 (100.0%) | 714 (100.0%) |
Physical Housing Characteristics in Carroll County
Housing Structures in Carroll County

| Structure Type | # Housing Units | % Housing Units |
| Single Unit, Detached | 2,792 | 69.2% |
| Single Unit, Attached | 3 | 0.1% |
| 2 Unit Apartments | 0 | 0.0% |
| 3 or 4 Unit Apartments | 64 | 1.6% |
| 5 to 9 Unit Apartments | 103 | 2.5% |
| 10 or more Apartments | 7 | 0.2% |
| Mobile Home / Other | 1,068 | 26.5% |
| Total | 4,037 | 100.0% |
Housing Structures by Occupancy in Carroll County

| Structure Type | Owner-occupied | Renter-occupied |
| Single Unit, Detached | 2,410 (86.3%) | 382 (13.7%) |
| Single Unit, Attached | 0 (0.0%) | 3 (100.0%) |
| 2 Unit Apartments | 0 (0.0%) | 0 (0.0%) |
| 3 or 4 Unit Apartments | 8 (12.5%) | 56 (87.5%) |
| 5 to 9 Unit Apartments | 0 (0.0%) | 103 (100.0%) |
| 10 or more Apartments | 0 (0.0%) | 7 (100.0%) |
| Mobile Home / Other | 905 (84.7%) | 163 (15.3%) |
| Total | 3,323 (82.3%) | 714 (17.7%) |
Housing Structures by Number of Rooms in Carroll County
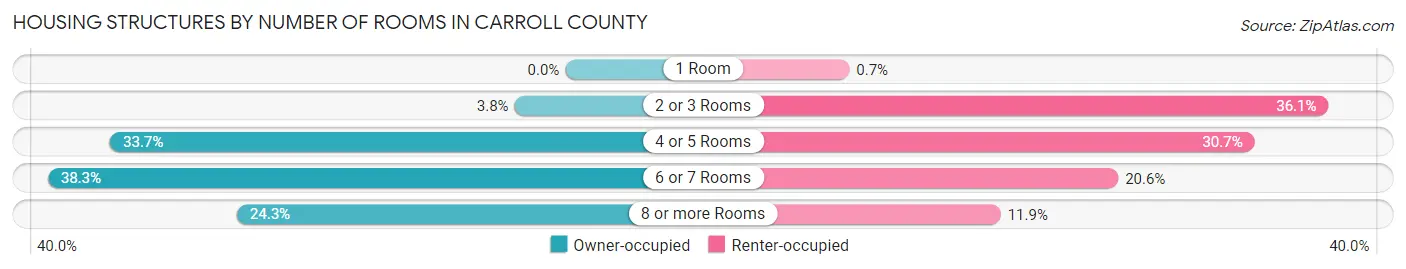
| Number of Rooms | Owner-occupied | Renter-occupied |
| 1 Room | 0 (0.0%) | 5 (0.7%) |
| 2 or 3 Rooms | 125 (3.8%) | 258 (36.1%) |
| 4 or 5 Rooms | 1,119 (33.7%) | 219 (30.7%) |
| 6 or 7 Rooms | 1,272 (38.3%) | 147 (20.6%) |
| 8 or more Rooms | 807 (24.3%) | 85 (11.9%) |
| Total | 3,323 (100.0%) | 714 (100.0%) |
Housing Structure by Heating Type in Carroll County
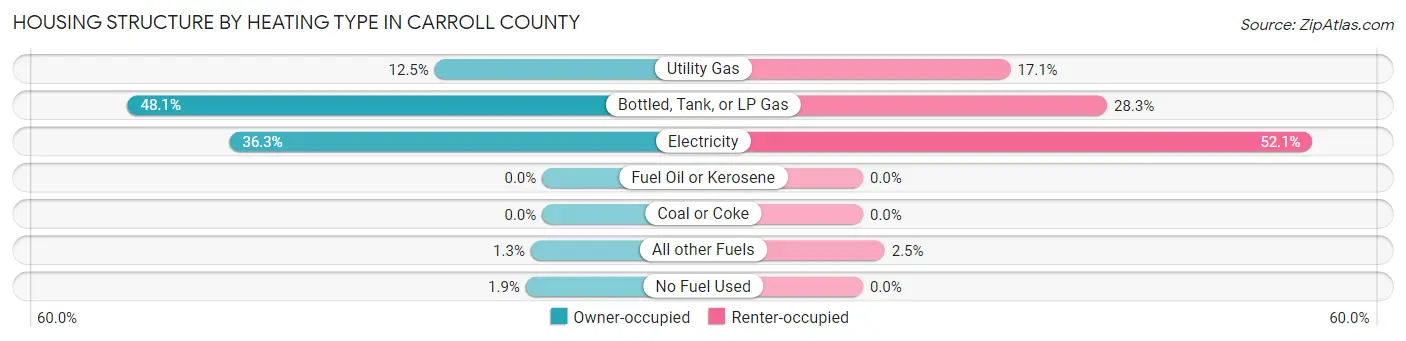
| Heating Type | Owner-occupied | Renter-occupied |
| Utility Gas | 414 (12.5%) | 122 (17.1%) |
| Bottled, Tank, or LP Gas | 1,597 (48.1%) | 202 (28.3%) |
| Electricity | 1,205 (36.3%) | 372 (52.1%) |
| Fuel Oil or Kerosene | 0 (0.0%) | 0 (0.0%) |
| Coal or Coke | 0 (0.0%) | 0 (0.0%) |
| All other Fuels | 44 (1.3%) | 18 (2.5%) |
| No Fuel Used | 63 (1.9%) | 0 (0.0%) |
| Total | 3,323 (100.0%) | 714 (100.0%) |
Household Vehicle Usage in Carroll County

| Vehicles per Household | Owner-occupied | Renter-occupied |
| No Vehicle | 91 (2.7%) | 114 (16.0%) |
| 1 Vehicle | 1,049 (31.6%) | 393 (55.0%) |
| 2 Vehicles | 1,484 (44.7%) | 199 (27.9%) |
| 3 or more Vehicles | 699 (21.0%) | 8 (1.1%) |
| Total | 3,323 (100.0%) | 714 (100.0%) |
Real Estate & Mortgages in Carroll County
Real Estate and Mortgage Overview in Carroll County
| Characteristic | Without Mortgage | With Mortgage |
| Housing Units | 2,083 | 1,240 |
| Median Property Value | $86,700 | $130,800 |
| Median Household Income | $32,128 | $219 |
| Monthly Housing Costs | $375 | $21 |
| Real Estate Taxes | $361 | $102 |
Property Value by Mortgage Status in Carroll County
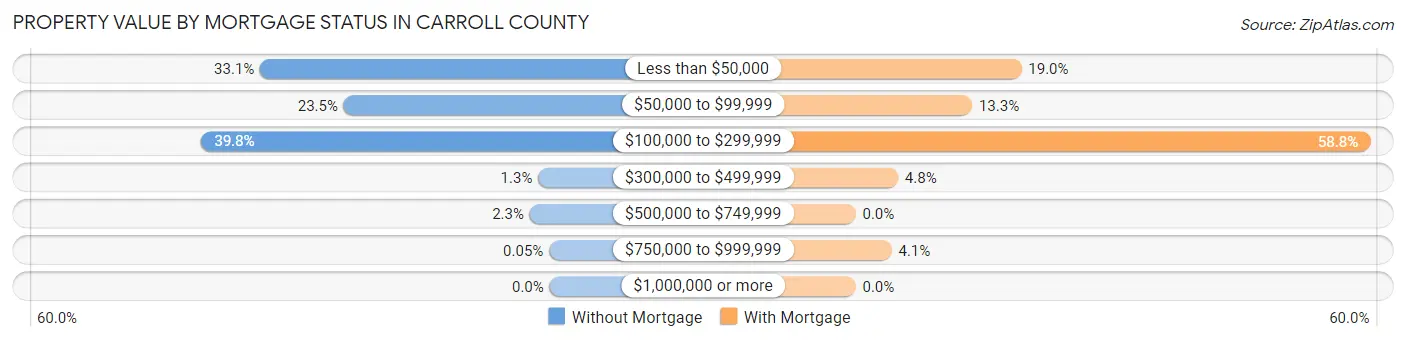
| Property Value | Without Mortgage | With Mortgage |
| Less than $50,000 | 689 (33.1%) | 235 (19.0%) |
| $50,000 to $99,999 | 490 (23.5%) | 165 (13.3%) |
| $100,000 to $299,999 | 829 (39.8%) | 729 (58.8%) |
| $300,000 to $499,999 | 27 (1.3%) | 60 (4.8%) |
| $500,000 to $749,999 | 47 (2.3%) | 0 (0.0%) |
| $750,000 to $999,999 | 1 (0.1%) | 51 (4.1%) |
| $1,000,000 or more | 0 (0.0%) | 0 (0.0%) |
| Total | 2,083 (100.0%) | 1,240 (100.0%) |
Household Income by Mortgage Status in Carroll County

| Household Income | Without Mortgage | With Mortgage |
| Less than $10,000 | 77 (3.7%) | 0 (0.0%) |
| $10,000 to $24,999 | 718 (34.5%) | 54 (4.3%) |
| $25,000 to $34,999 | 264 (12.7%) | 21 (1.7%) |
| $35,000 to $49,999 | 277 (13.3%) | 50 (4.0%) |
| $50,000 to $74,999 | 365 (17.5%) | 145 (11.7%) |
| $75,000 to $99,999 | 163 (7.8%) | 233 (18.8%) |
| $100,000 to $149,999 | 71 (3.4%) | 148 (11.9%) |
| $150,000 or more | 148 (7.1%) | 370 (29.8%) |
| Total | 2,083 (100.0%) | 1,240 (100.0%) |
Property Value to Household Income Ratio in Carroll County

| Value-to-Income Ratio | Without Mortgage | With Mortgage |
| Less than 2.0x | 1,082 (51.9%) | 91,094 (7,346.3%) |
| 2.0x to 2.9x | 288 (13.8%) | 773 (62.3%) |
| 3.0x to 3.9x | 133 (6.4%) | 286 (23.1%) |
| 4.0x or more | 572 (27.5%) | 70 (5.7%) |
| Total | 2,083 (100.0%) | 1,240 (100.0%) |
Real Estate Taxes by Mortgage Status in Carroll County
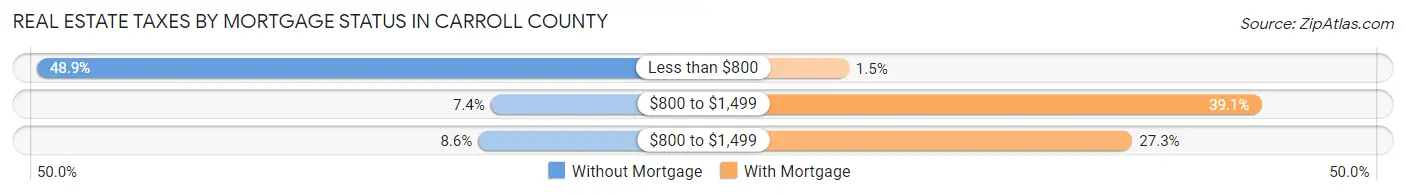
| Property Taxes | Without Mortgage | With Mortgage |
| Less than $800 | 1,018 (48.9%) | 18 (1.5%) |
| $800 to $1,499 | 155 (7.4%) | 485 (39.1%) |
| $800 to $1,499 | 179 (8.6%) | 339 (27.3%) |
| Total | 2,083 (100.0%) | 1,240 (100.0%) |
Health & Disability in Carroll County
Health Insurance Coverage by Age in Carroll County

| Age Bracket | With Coverage | Without Coverage |
| Under 6 Years | 554 (100.0%) | 0 (0.0%) |
| 6 to 18 Years | 1,248 (93.7%) | 84 (6.3%) |
| 19 to 25 Years | 420 (63.3%) | 243 (36.6%) |
| 26 to 34 Years | 782 (92.1%) | 67 (7.9%) |
| 35 to 44 Years | 1,153 (95.0%) | 61 (5.0%) |
| 45 to 54 Years | 1,050 (91.5%) | 98 (8.5%) |
| 55 to 64 Years | 1,289 (89.0%) | 159 (11.0%) |
| 65 to 74 Years | 1,271 (100.0%) | 0 (0.0%) |
| 75 Years and older | 1,060 (100.0%) | 0 (0.0%) |
| Total | 8,827 (92.5%) | 712 (7.5%) |
Health Insurance Coverage by Citizenship Status in Carroll County

| Citizenship Status | With Coverage | Without Coverage |
| Native Born | 554 (100.0%) | 0 (0.0%) |
| Foreign Born, Citizen | 1,248 (93.7%) | 84 (6.3%) |
| Foreign Born, not a Citizen | 420 (63.3%) | 243 (36.6%) |
Health Insurance Coverage by Household Income in Carroll County

| Household Income | With Coverage | Without Coverage |
| Under $25,000 | 1,875 (84.5%) | 344 (15.5%) |
| $25,000 to $49,999 | 1,894 (90.3%) | 204 (9.7%) |
| $50,000 to $74,999 | 1,756 (98.2%) | 32 (1.8%) |
| $75,000 to $99,999 | 1,164 (91.0%) | 115 (9.0%) |
| $100,000 and over | 2,138 (99.2%) | 17 (0.8%) |
Public vs Private Health Insurance Coverage by Age in Carroll County

| Age Bracket | Public Insurance | Private Insurance |
| Under 6 | 414 (74.7%) | 140 (25.3%) |
| 6 to 18 Years | 798 (59.9%) | 485 (36.4%) |
| 19 to 25 Years | 141 (21.3%) | 279 (42.1%) |
| 25 to 34 Years | 68 (8.0%) | 714 (84.1%) |
| 35 to 44 Years | 320 (26.4%) | 1,010 (83.2%) |
| 45 to 54 Years | 276 (24.0%) | 824 (71.8%) |
| 55 to 64 Years | 559 (38.6%) | 812 (56.1%) |
| 65 to 74 Years | 1,253 (98.6%) | 453 (35.6%) |
| 75 Years and over | 1,060 (100.0%) | 359 (33.9%) |
| Total | 4,889 (51.2%) | 5,076 (53.2%) |
Disability Status by Sex by Age in Carroll County

| Age Bracket | Male | Female |
| Under 5 Years | 0 (0.0%) | 0 (0.0%) |
| 5 to 17 Years | 64 (8.4%) | 0 (0.0%) |
| 18 to 34 Years | 145 (16.5%) | 4 (0.5%) |
| 35 to 64 Years | 537 (27.0%) | 428 (23.5%) |
| 65 to 74 Years | 155 (25.2%) | 27 (4.1%) |
| 75 Years and over | 367 (73.1%) | 274 (49.1%) |
Disability Class by Sex by Age in Carroll County
Disability Class: Hearing Difficulty
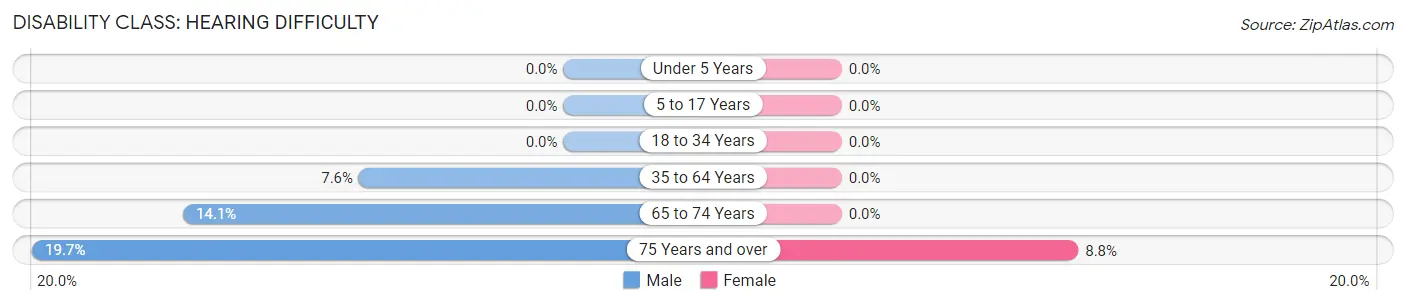
| Age Bracket | Male | Female |
| Under 5 Years | 0 (0.0%) | 0 (0.0%) |
| 5 to 17 Years | 0 (0.0%) | 0 (0.0%) |
| 18 to 34 Years | 0 (0.0%) | 0 (0.0%) |
| 35 to 64 Years | 151 (7.6%) | 0 (0.0%) |
| 65 to 74 Years | 87 (14.1%) | 0 (0.0%) |
| 75 Years and over | 99 (19.7%) | 49 (8.8%) |
Disability Class: Vision Difficulty

| Age Bracket | Male | Female |
| Under 5 Years | 0 (0.0%) | 0 (0.0%) |
| 5 to 17 Years | 1 (0.1%) | 0 (0.0%) |
| 18 to 34 Years | 0 (0.0%) | 4 (0.5%) |
| 35 to 64 Years | 151 (7.6%) | 80 (4.4%) |
| 65 to 74 Years | 10 (1.6%) | 10 (1.5%) |
| 75 Years and over | 24 (4.8%) | 90 (16.1%) |
Disability Class: Cognitive Difficulty
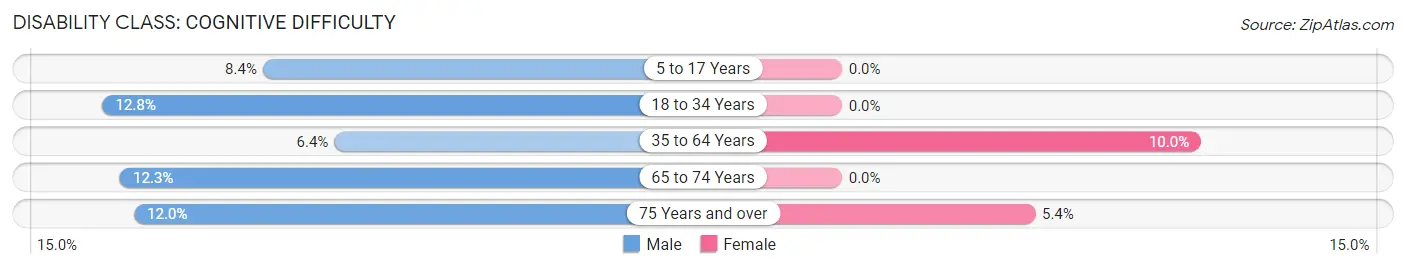
| Age Bracket | Male | Female |
| 5 to 17 Years | 64 (8.4%) | 0 (0.0%) |
| 18 to 34 Years | 113 (12.8%) | 0 (0.0%) |
| 35 to 64 Years | 127 (6.4%) | 182 (10.0%) |
| 65 to 74 Years | 76 (12.3%) | 0 (0.0%) |
| 75 Years and over | 60 (11.9%) | 30 (5.4%) |
Disability Class: Ambulatory Difficulty

| Age Bracket | Male | Female |
| 5 to 17 Years | 0 (0.0%) | 0 (0.0%) |
| 18 to 34 Years | 32 (3.6%) | 0 (0.0%) |
| 35 to 64 Years | 335 (16.8%) | 297 (16.3%) |
| 65 to 74 Years | 28 (4.5%) | 27 (4.1%) |
| 75 Years and over | 242 (48.2%) | 201 (36.0%) |
Disability Class: Self-Care Difficulty

| Age Bracket | Male | Female |
| 5 to 17 Years | 0 (0.0%) | 0 (0.0%) |
| 18 to 34 Years | 0 (0.0%) | 0 (0.0%) |
| 35 to 64 Years | 63 (3.2%) | 69 (3.8%) |
| 65 to 74 Years | 10 (1.6%) | 9 (1.4%) |
| 75 Years and over | 112 (22.3%) | 111 (19.9%) |
Technology Access in Carroll County
Computing Device Access in Carroll County

| Device Type | # Households | % Households |
| Desktop or Laptop | 2,152 | 53.3% |
| Smartphone | 3,056 | 75.7% |
| Tablet | 1,904 | 47.2% |
| No Computing Device | 905 | 22.4% |
| Total | 4,037 | 100.0% |
Internet Access in Carroll County

| Internet Type | # Households | % Households |
| Dial-Up Internet | 0 | 0.0% |
| Broadband Home | 1,598 | 39.6% |
| Cellular Data Only | 658 | 16.3% |
| Satellite Internet | 511 | 12.7% |
| No Internet | 1,519 | 37.6% |
| Total | 4,037 | 100.0% |
Carroll County Summary
Carroll County is located in the north-central region of Mississippi, and is bordered by Grenada County to the north, Montgomery County to the east, Webster County to the south, and Leflore County to the west. The county seat is Carrollton, and the county has a total area of 576 square miles. As of the 2010 census, the population was 10,597, making it the second least populous county in Mississippi.
History
Carroll County was established in 1833, and was named for Charles Carroll of Carrollton, the last surviving signer of the Declaration of Independence. The county was formed from parts of Grenada, Montgomery, and Yalobusha counties. The first county seat was located in Vaiden, but was moved to Carrollton in 1834.
During the Civil War, Carroll County was the site of several battles, including the Battle of Coffeeville in December 1862. The county was also the site of the Battle of Vaiden in May 1863, which resulted in a Confederate victory.
Geography
Carroll County is located in the north-central region of Mississippi, and is bordered by Grenada County to the north, Montgomery County to the east, Webster County to the south, and Leflore County to the west. The county has a total area of 576 square miles, of which 574 square miles is land and 2 square miles is water. The terrain is mostly flat, with some rolling hills in the northern part of the county. The Yalobusha River runs through the county, and there are several small lakes and ponds scattered throughout the area.
The climate of Carroll County is humid subtropical, with hot, humid summers and mild winters. The average annual temperature is 64°F, and the average annual precipitation is 49 inches.
Economy
The economy of Carroll County is largely based on agriculture. The county is home to several large farms, and the main crops grown in the area are cotton, soybeans, corn, and wheat. The county also has a thriving timber industry, and there are several sawmills and wood-processing plants in the area.
In addition to agriculture and timber, Carroll County also has a growing manufacturing sector. The county is home to several factories that produce furniture, textiles, and other products. The county also has a thriving tourism industry, and there are several popular attractions in the area, including the Vaiden Historic District, the Carroll County Courthouse, and the Carroll County Museum.
Demographics
As of the 2010 census, the population of Carroll County was 10,597, making it the second least populous county in Mississippi. The population is spread out, with 48.3% male and 51.7% female. The median age is 38.7 years, and the median household income is $35,945.
The racial makeup of the county is 79.2% White, 18.3% African American, 0.4% Native American, 0.3% Asian, 0.1% Pacific Islander, 0.7% from other races, and 1.1% from two or more races. The largest ancestry groups in the county are English (37.2%), African (17.3%), Irish (14.2%), and German (13.2%).
The primary language spoken in Carroll County is English, with Spanish being the second most common language. The majority of the population is Christian, with the largest denominations being Baptist (44.2%), Methodist (14.2%), and Presbyterian (7.2%).
Common Questions
What is the Total Population of Carroll County?
Total Population of Carroll County is 9,930.
What is the Total Male Population of Carroll County?
Total Male Population of Carroll County is 5,307.
What is the Total Female Population of Carroll County?
Total Female Population of Carroll County is 4,623.
What is the Ratio of Males per 100 Females in Carroll County?
There are 114.80 Males per 100 Females in Carroll County.
What is the Ratio of Females per 100 Males in Carroll County?
There are 87.11 Females per 100 Males in Carroll County.
What is the Median Population Age in Carroll County?
Median Population Age in Carroll County is 45.5 Years.
What is the Average Family Size in Carroll County
Average Family Size in Carroll County is 3.0 People.
What is the Average Household Size in Carroll County
Average Household Size in Carroll County is 2.4 People.
What is Per Capita Income in Carroll County?
Per Capita income in Carroll County is $29,588.
What is the Median Family Income in Carroll County?
Median Family Income in Carroll County is $66,321.
What is the Median Household income in Carroll County?
Median Household Income in Carroll County is $42,285.
What is Income or Wage Gap in Carroll County?
Income or Wage Gap in Carroll County is 10.6%.
Women in Carroll County earn 89.4 cents for every dollar earned by a man.
What is Inequality or Gini Index in Carroll County?
Inequality or Gini Index in Carroll County is 0.46.
How Large is the Labor Force in Carroll County?
There are 3,893 People in the Labor Forcein in Carroll County.
What is the Percentage of People in the Labor Force in Carroll County?
45.4% of People are in the Labor Force in Carroll County.
What is the Unemployment Rate in Carroll County?
Unemployment Rate in Carroll County is 6.0%.