Bolivar County, MS
Bolivar County Map
Bolivar County Overview
30,688
TOTAL POPULATION
14,462
MALE POPULATION
16,226
FEMALE POPULATION
89.13
MALES / 100 FEMALES
112.20
FEMALES / 100 MALES
36.6
MEDIAN AGE
3.1
AVG FAMILY SIZE
2.5
AVG HOUSEHOLD SIZE
$25,440
PER CAPITA INCOME
$49,306
AVG FAMILY INCOME
$37,845
AVG HOUSEHOLD INCOME
32.2%
WAGE / INCOME GAP [ % ]
67.8¢/ $1
WAGE / INCOME GAP [ $ ]
$13,215
FAMILY INCOME DEFICIT
0.56
INEQUALITY / GINI INDEX
11,921
LABOR FORCE [ PEOPLE ]
49.7%
PERCENT IN LABOR FORCE
7.4%
UNEMPLOYMENT RATE
Bolivar County Area Codes
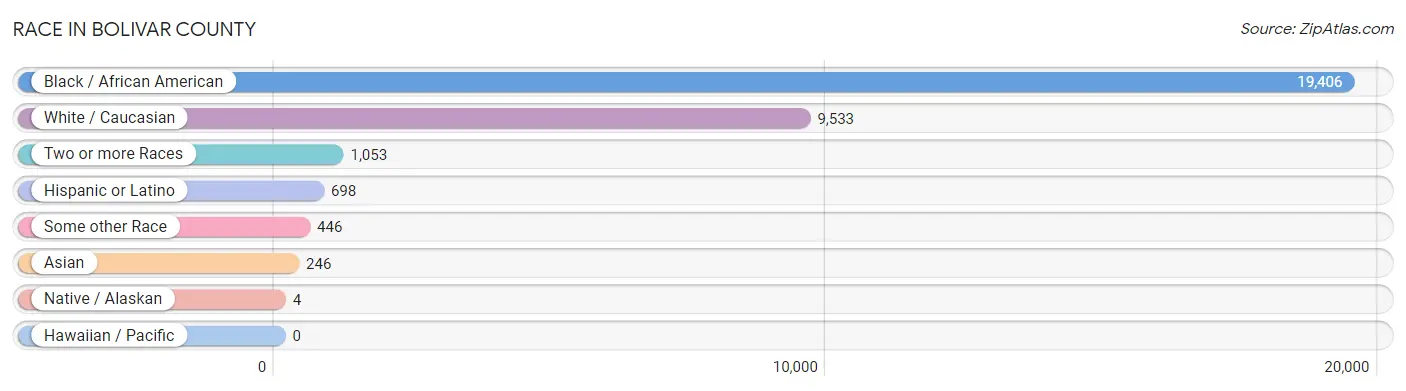
Race in Bolivar County
The most populous races in Bolivar County are Black / African American (19,406 | 63.2%), White / Caucasian (9,533 | 31.1%), and Two or more Races (1,053 | 3.4%).
| Race | # Population | % Population |
| Asian | 246 | 0.8% |
| Black / African American | 19,406 | 63.2% |
| Hawaiian / Pacific | 0 | 0.0% |
| Hispanic or Latino | 698 | 2.3% |
| Native / Alaskan | 4 | 0.0% |
| White / Caucasian | 9,533 | 31.1% |
| Two or more Races | 1,053 | 3.4% |
| Some other Race | 446 | 1.5% |
| Total | 30,688 | 100.0% |
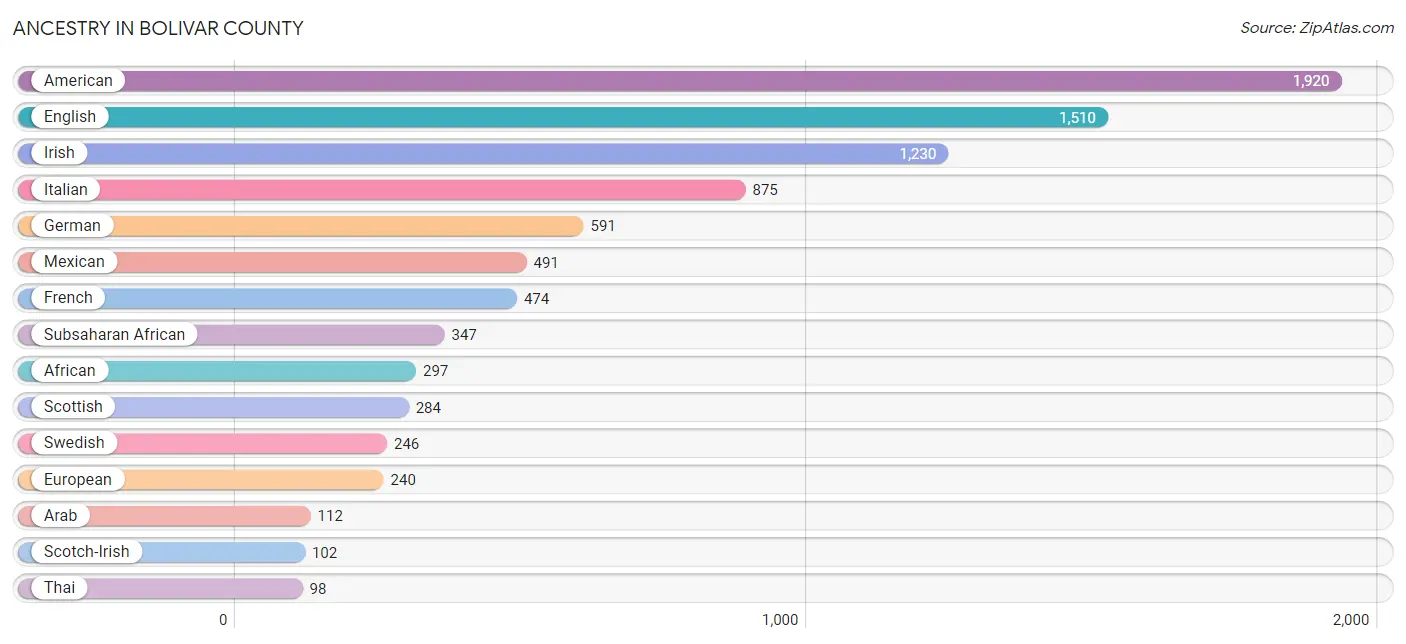
Ancestry in Bolivar County
The most populous ancestries reported in Bolivar County are American (1,920 | 6.3%), English (1,510 | 4.9%), Irish (1,230 | 4.0%), Italian (875 | 2.9%), and German (591 | 1.9%), together accounting for 20.0% of all Bolivar County residents.
| Ancestry | # Population | % Population |
| African | 297 | 1.0% |
| American | 1,920 | 6.3% |
| Arab | 112 | 0.4% |
| Australian | 52 | 0.2% |
| Blackfeet | 1 | 0.0% |
| British | 21 | 0.1% |
| Burmese | 16 | 0.1% |
| Canadian | 7 | 0.0% |
| Central American | 75 | 0.2% |
| Cuban | 18 | 0.1% |
| Dutch | 31 | 0.1% |
| Eastern European | 13 | 0.0% |
| English | 1,510 | 4.9% |
| European | 240 | 0.8% |
| French | 474 | 1.5% |
| French Canadian | 5 | 0.0% |
| German | 591 | 1.9% |
| Haitian | 31 | 0.1% |
| Indian (Asian) | 66 | 0.2% |
| Irish | 1,230 | 4.0% |
| Italian | 875 | 2.9% |
| Jamaican | 67 | 0.2% |
| Korean | 12 | 0.0% |
| Lebanese | 75 | 0.2% |
| Mexican | 491 | 1.6% |
| Mongolian | 7 | 0.0% |
| Nicaraguan | 75 | 0.2% |
| Nigerian | 69 | 0.2% |
| Northern European | 45 | 0.2% |
| Norwegian | 9 | 0.0% |
| Palestinian | 37 | 0.1% |
| Polish | 53 | 0.2% |
| Puerto Rican | 40 | 0.1% |
| Romanian | 17 | 0.1% |
| Russian | 2 | 0.0% |
| Scandinavian | 8 | 0.0% |
| Scotch-Irish | 102 | 0.3% |
| Scottish | 284 | 0.9% |
| Sioux | 1 | 0.0% |
| Slovene | 78 | 0.3% |
| South American | 72 | 0.2% |
| Spanish | 2 | 0.0% |
| Sri Lankan | 93 | 0.3% |
| Subsaharan African | 347 | 1.1% |
| Swedish | 246 | 0.8% |
| Thai | 98 | 0.3% |
| Venezuelan | 72 | 0.2% |
| Welsh | 71 | 0.2% | View All 48 Rows |
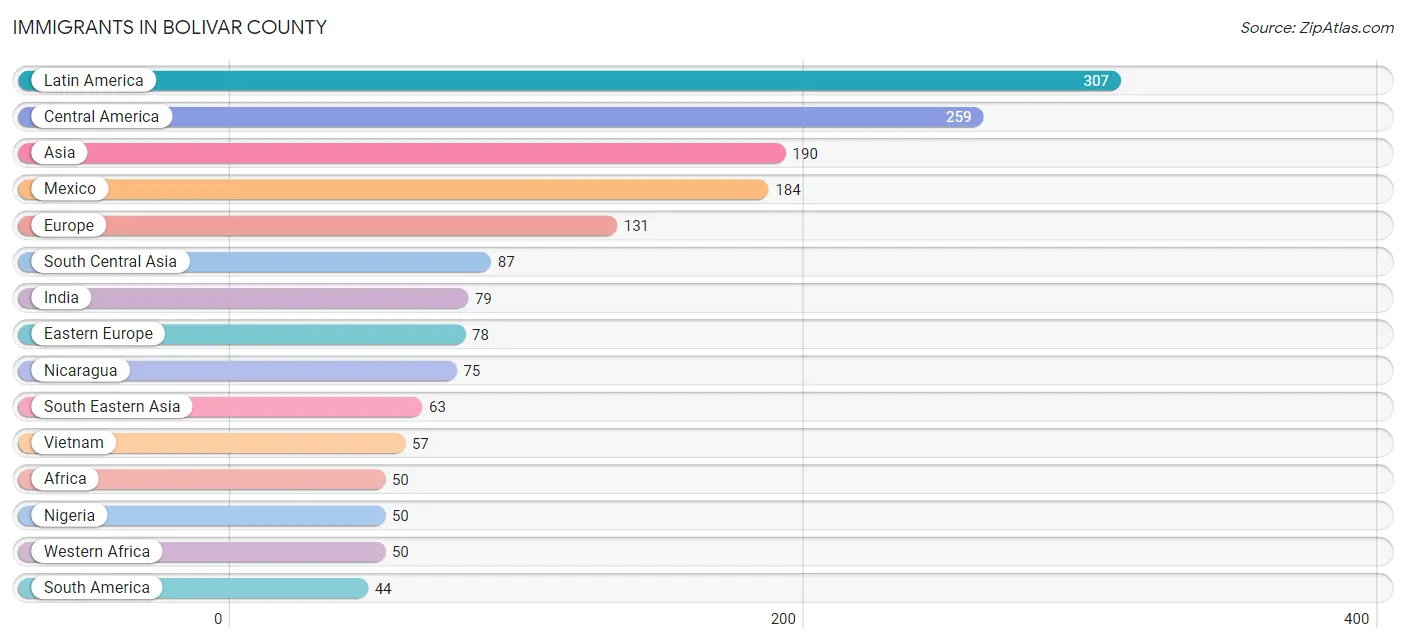
Immigrants in Bolivar County
The most numerous immigrant groups reported in Bolivar County came from Latin America (307 | 1.0%), Central America (259 | 0.8%), Asia (190 | 0.6%), Mexico (184 | 0.6%), and Europe (131 | 0.4%), together accounting for 3.5% of all Bolivar County residents.
| Immigration Origin | # Population | % Population |
| Africa | 50 | 0.2% |
| Asia | 190 | 0.6% |
| Bolivia | 9 | 0.0% |
| Caribbean | 4 | 0.0% |
| Central America | 259 | 0.8% |
| China | 3 | 0.0% |
| Eastern Asia | 3 | 0.0% |
| Eastern Europe | 78 | 0.3% |
| Europe | 131 | 0.4% |
| Germany | 30 | 0.1% |
| Haiti | 4 | 0.0% |
| India | 79 | 0.3% |
| Israel | 27 | 0.1% |
| Latin America | 307 | 1.0% |
| Mexico | 184 | 0.6% |
| Nicaragua | 75 | 0.2% |
| Nigeria | 50 | 0.2% |
| Northern Europe | 23 | 0.1% |
| Pakistan | 8 | 0.0% |
| Philippines | 6 | 0.0% |
| Saudi Arabia | 10 | 0.0% |
| Scotland | 23 | 0.1% |
| South America | 44 | 0.1% |
| South Central Asia | 87 | 0.3% |
| South Eastern Asia | 63 | 0.2% |
| Venezuela | 35 | 0.1% |
| Vietnam | 57 | 0.2% |
| Western Africa | 50 | 0.2% |
| Western Asia | 37 | 0.1% |
| Western Europe | 30 | 0.1% | View All 30 Rows |
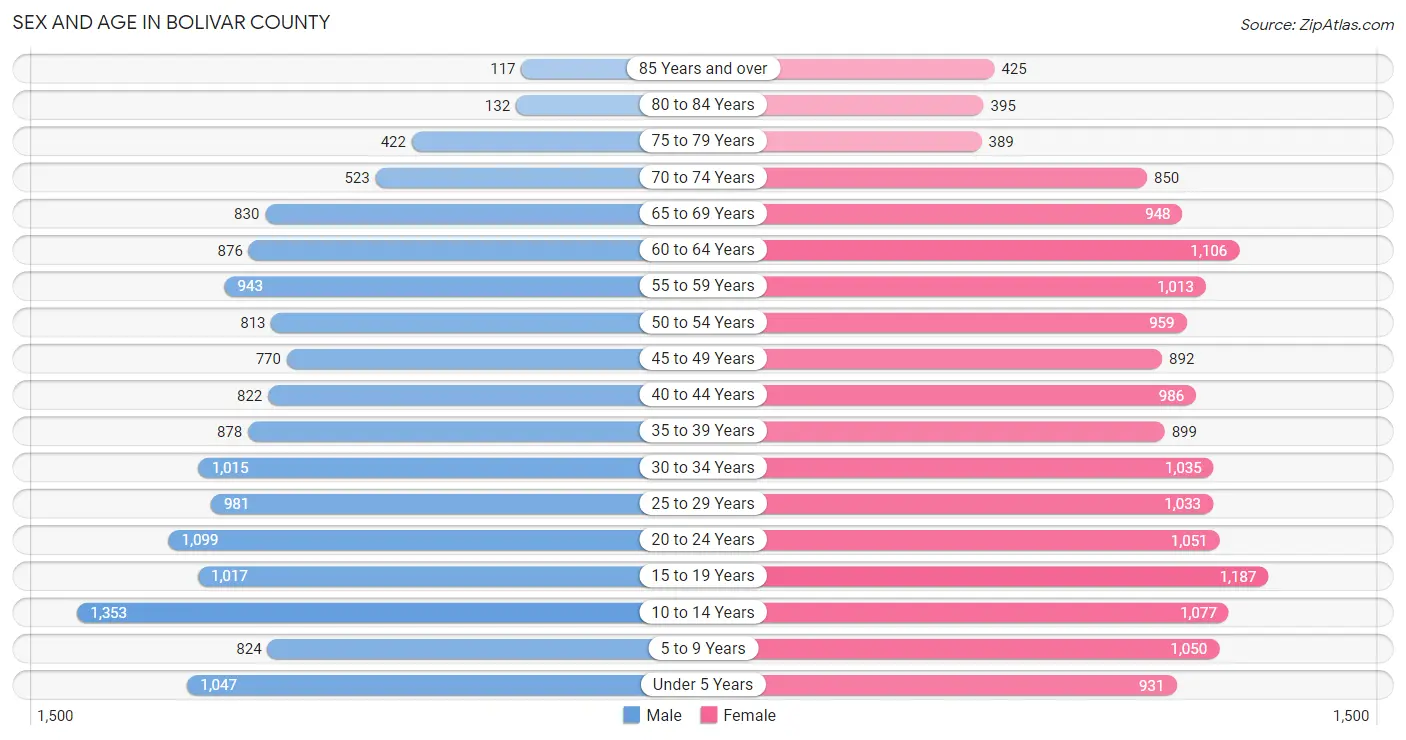
Sex and Age in Bolivar County
Sex and Age in Bolivar County
The most populous age groups in Bolivar County are 10 to 14 Years (1,353 | 9.4%) for men and 15 to 19 Years (1,187 | 7.3%) for women.
| Age Bracket | Male | Female |
| Under 5 Years | 1,047 (7.2%) | 931 (5.7%) |
| 5 to 9 Years | 824 (5.7%) | 1,050 (6.5%) |
| 10 to 14 Years | 1,353 (9.4%) | 1,077 (6.6%) |
| 15 to 19 Years | 1,017 (7.0%) | 1,187 (7.3%) |
| 20 to 24 Years | 1,099 (7.6%) | 1,051 (6.5%) |
| 25 to 29 Years | 981 (6.8%) | 1,033 (6.4%) |
| 30 to 34 Years | 1,015 (7.0%) | 1,035 (6.4%) |
| 35 to 39 Years | 878 (6.1%) | 899 (5.5%) |
| 40 to 44 Years | 822 (5.7%) | 986 (6.1%) |
| 45 to 49 Years | 770 (5.3%) | 892 (5.5%) |
| 50 to 54 Years | 813 (5.6%) | 959 (5.9%) |
| 55 to 59 Years | 943 (6.5%) | 1,013 (6.2%) |
| 60 to 64 Years | 876 (6.1%) | 1,106 (6.8%) |
| 65 to 69 Years | 830 (5.7%) | 948 (5.8%) |
| 70 to 74 Years | 523 (3.6%) | 850 (5.2%) |
| 75 to 79 Years | 422 (2.9%) | 389 (2.4%) |
| 80 to 84 Years | 132 (0.9%) | 395 (2.4%) |
| 85 Years and over | 117 (0.8%) | 425 (2.6%) |
| Total | 14,462 (100.0%) | 16,226 (100.0%) |
Families and Households in Bolivar County
Median Family Size in Bolivar County
The median family size in Bolivar County is 3.14 persons per family, with married-couple families (3,797 | 52.4%) accounting for the largest median family size of 3.21 persons per family. On the other hand, single female/mother families (2,602 | 35.9%) represent the smallest median family size with 3.05 persons per family.
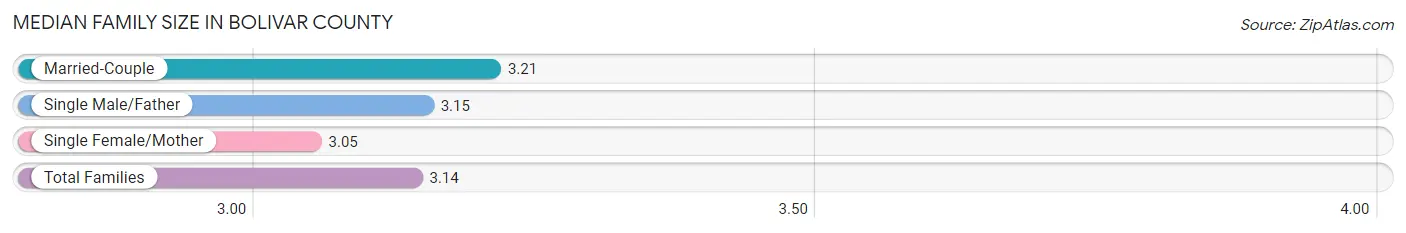
| Family Type | # Families | Family Size |
| Married-Couple | 3,797 (52.4%) | 3.21 |
| Single Male/Father | 841 (11.6%) | 3.15 |
| Single Female/Mother | 2,602 (35.9%) | 3.05 |
| Total Families | 7,240 (100.0%) | 3.14 |
Median Household Size in Bolivar County
The median household size in Bolivar County is 2.49 persons per household, with single male/father households (841 | 7.2%) accounting for the largest median household size of 3.62 persons per household. non-family households (4,464 | 38.1%) represent the smallest median household size with 1.29 persons per household.
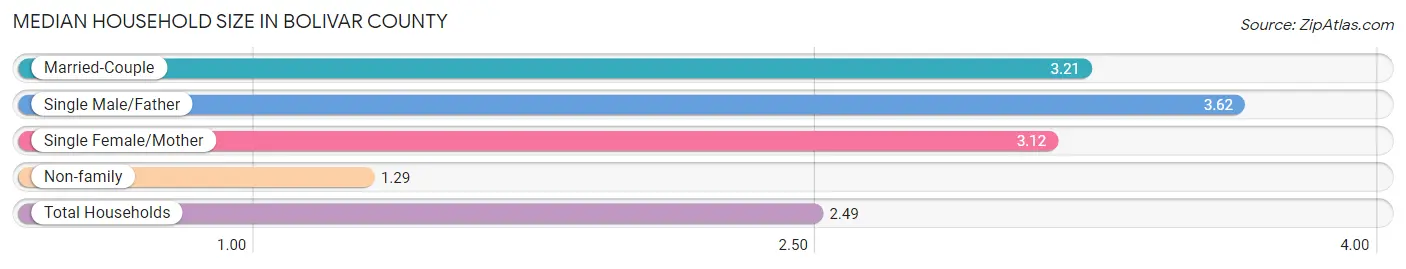
| Household Type | # Households | Household Size |
| Married-Couple | 3,797 (32.4%) | 3.21 |
| Single Male/Father | 841 (7.2%) | 3.62 |
| Single Female/Mother | 2,602 (22.2%) | 3.12 |
| Non-family | 4,464 (38.1%) | 1.29 |
| Total Households | 11,704 (100.0%) | 2.49 |
Household Size by Marriage Status in Bolivar County
Out of a total of 11,704 households in Bolivar County, 7,240 (61.9%) are family households, while 4,464 (38.1%) are nonfamily households. The most numerous type of family households are 2-person households, comprising 3,141, and the most common type of nonfamily households are 1-person households, comprising 3,851.
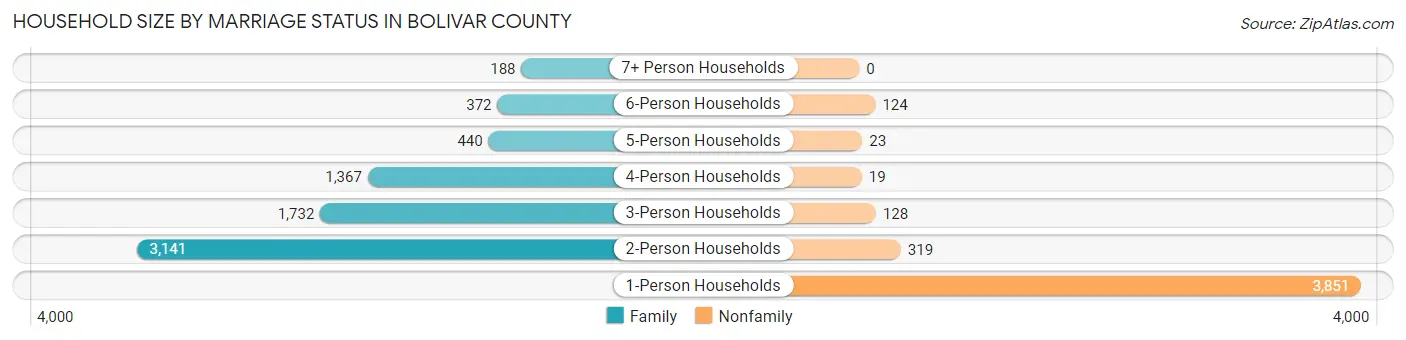
| Household Size | Family Households | Nonfamily Households |
| 1-Person Households | - | 3,851 (32.9%) |
| 2-Person Households | 3,141 (26.8%) | 319 (2.7%) |
| 3-Person Households | 1,732 (14.8%) | 128 (1.1%) |
| 4-Person Households | 1,367 (11.7%) | 19 (0.2%) |
| 5-Person Households | 440 (3.8%) | 23 (0.2%) |
| 6-Person Households | 372 (3.2%) | 124 (1.1%) |
| 7+ Person Households | 188 (1.6%) | 0 (0.0%) |
| Total | 7,240 (61.9%) | 4,464 (38.1%) |
Female Fertility in Bolivar County
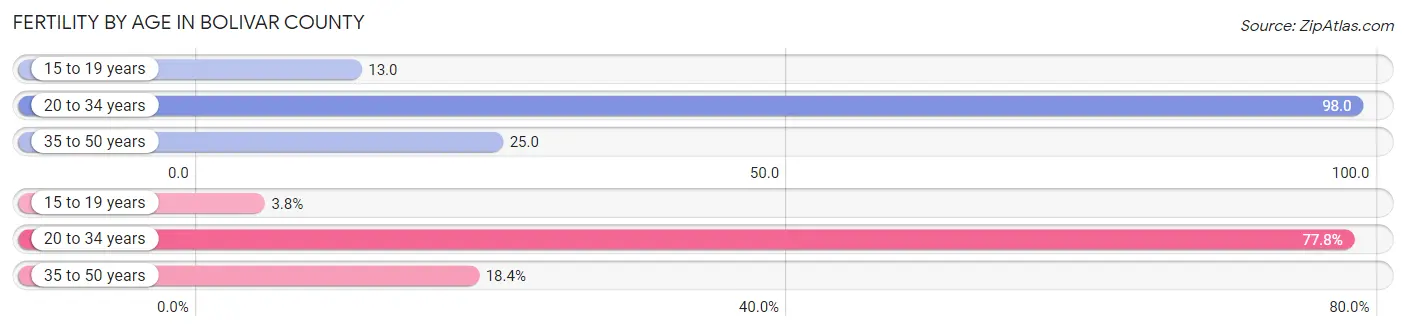
Fertility by Age in Bolivar County
Average fertility rate in Bolivar County is 54.0 births per 1,000 women. Women in the age bracket of 20 to 34 years have the highest fertility rate with 98.0 births per 1,000 women. Women in the age bracket of 20 to 34 years acount for 77.8% of all women with births.
| Age Bracket | Women with Births | Births / 1,000 Women |
| 15 to 19 years | 15 (3.8%) | 13.0 |
| 20 to 34 years | 305 (77.8%) | 98.0 |
| 35 to 50 years | 72 (18.4%) | 25.0 |
| Total | 392 (100.0%) | 54.0 |
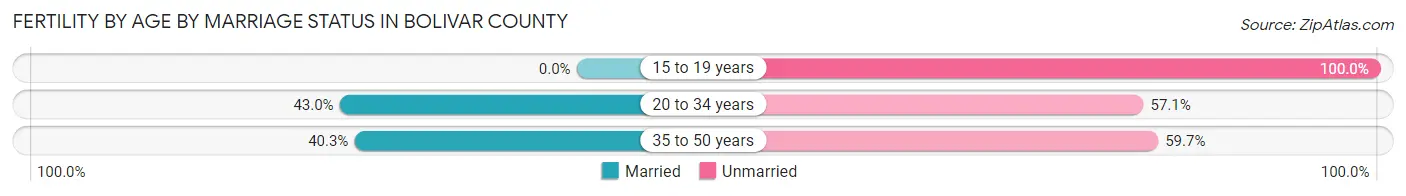
Fertility by Age by Marriage Status in Bolivar County
40.8% of women with births (392) in Bolivar County are married. The highest percentage of unmarried women with births falls into 15 to 19 years age bracket with 100.0% of them unmarried at the time of birth, while the lowest percentage of unmarried women with births belong to 20 to 34 years age bracket with 57.1% of them unmarried.
| Age Bracket | Married | Unmarried |
| 15 to 19 years | 0 (0.0%) | 15 (100.0%) |
| 20 to 34 years | 131 (42.9%) | 174 (57.1%) |
| 35 to 50 years | 29 (40.3%) | 43 (59.7%) |
| Total | 160 (40.8%) | 232 (59.2%) |
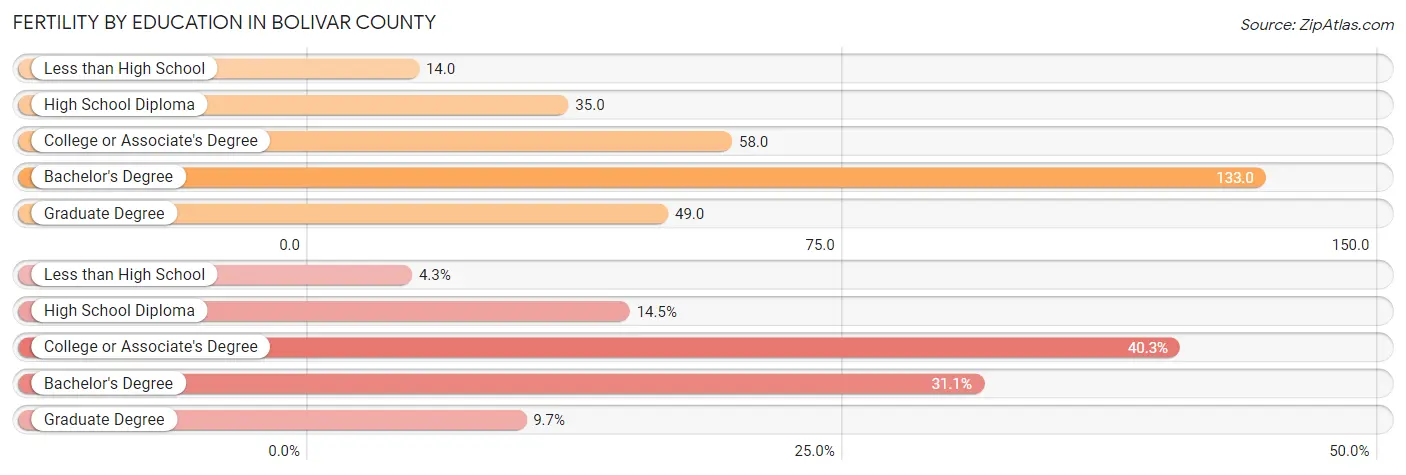
Fertility by Education in Bolivar County
Average fertility rate in Bolivar County is 54.0 births per 1,000 women. Women with the education attainment of bachelor's degree have the highest fertility rate of 133.0 births per 1,000 women, while women with the education attainment of less than high school have the lowest fertility at 14.0 births per 1,000 women. Women with the education attainment of college or associate's degree represent 40.3% of all women with births.
| Educational Attainment | Women with Births | Births / 1,000 Women |
| Less than High School | 17 (4.3%) | 14.0 |
| High School Diploma | 57 (14.5%) | 35.0 |
| College or Associate's Degree | 158 (40.3%) | 58.0 |
| Bachelor's Degree | 122 (31.1%) | 133.0 |
| Graduate Degree | 38 (9.7%) | 49.0 |
| Total | 392 (100.0%) | 54.0 |
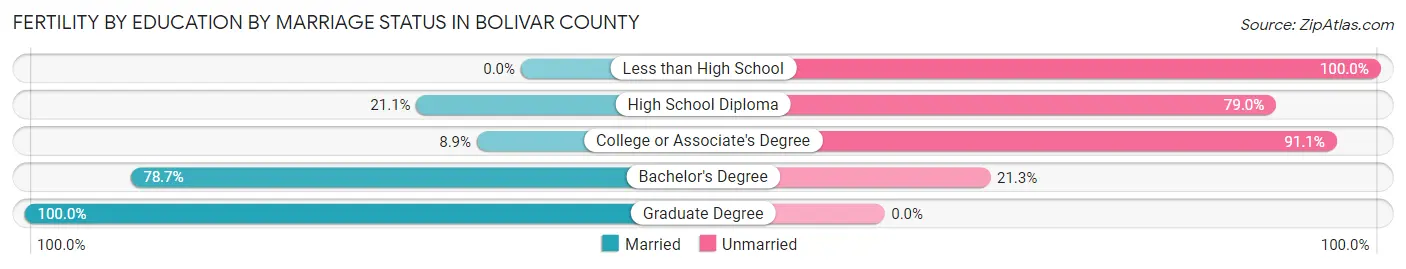
Fertility by Education by Marriage Status in Bolivar County
59.2% of women with births in Bolivar County are unmarried. Women with the educational attainment of graduate degree are most likely to be married with 100.0% of them married at childbirth, while women with the educational attainment of less than high school are least likely to be married with 100.0% of them unmarried at childbirth.
| Educational Attainment | Married | Unmarried |
| Less than High School | 0 (0.0%) | 17 (100.0%) |
| High School Diploma | 12 (21.0%) | 45 (78.9%) |
| College or Associate's Degree | 14 (8.9%) | 144 (91.1%) |
| Bachelor's Degree | 96 (78.7%) | 26 (21.3%) |
| Graduate Degree | 38 (100.0%) | 0 (0.0%) |
| Total | 160 (40.8%) | 232 (59.2%) |
Income in Bolivar County
Income Overview in Bolivar County
Per Capita Income in Bolivar County is $25,440, while median incomes of families and households are $49,306 and $37,845 respectively.
| Characteristic | Number | Measure |
| Per Capita Income | 30,688 | $25,440 |
| Median Family Income | 7,240 | $49,306 |
| Mean Family Income | 7,240 | $73,540 |
| Median Household Income | 11,704 | $37,845 |
| Mean Household Income | 11,704 | $64,115 |
| Income Deficit | 7,240 | $13,215 |
| Wage / Income Gap (%) | 30,688 | 32.18% |
| Wage / Income Gap ($) | 30,688 | 67.82¢ per $1 |
| Gini / Inequality Index | 30,688 | 0.56 |
Earnings by Sex in Bolivar County
Average Earnings in Bolivar County are $28,382, $34,966 for men and $23,713 for women, a difference of 32.2%.
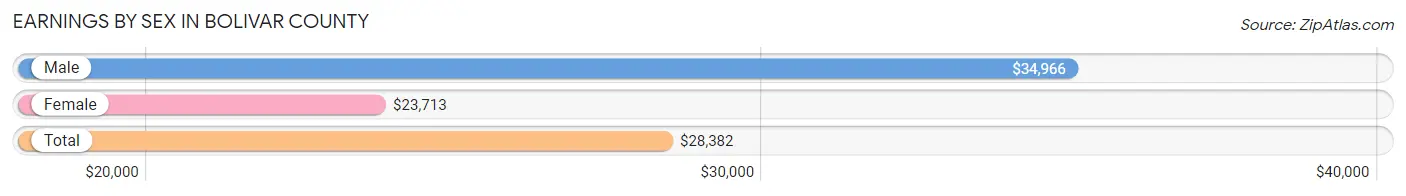
| Sex | Number | Average Earnings |
| Male | 6,046 (49.1%) | $34,966 |
| Female | 6,275 (50.9%) | $23,713 |
| Total | 12,321 (100.0%) | $28,382 |
Earnings by Sex by Income Bracket in Bolivar County
The most common earnings brackets in Bolivar County are $75,000 to $99,999 for men (677 | 11.2%) and $2,499 or less for women (653 | 10.4%).
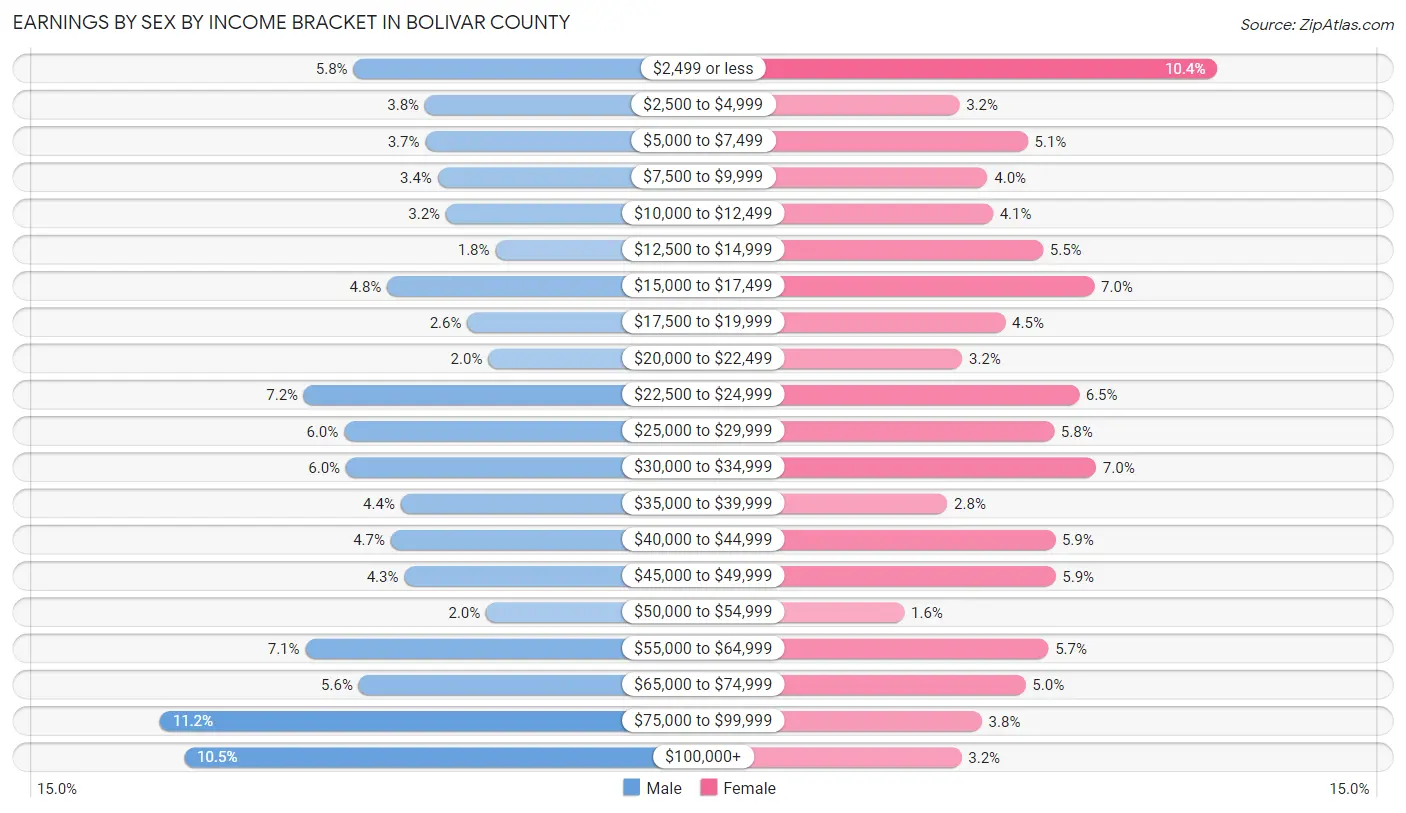
| Income | Male | Female |
| $2,499 or less | 348 (5.8%) | 653 (10.4%) |
| $2,500 to $4,999 | 227 (3.7%) | 198 (3.2%) |
| $5,000 to $7,499 | 226 (3.7%) | 319 (5.1%) |
| $7,500 to $9,999 | 205 (3.4%) | 248 (4.0%) |
| $10,000 to $12,499 | 191 (3.2%) | 257 (4.1%) |
| $12,500 to $14,999 | 107 (1.8%) | 346 (5.5%) |
| $15,000 to $17,499 | 291 (4.8%) | 436 (7.0%) |
| $17,500 to $19,999 | 155 (2.6%) | 279 (4.4%) |
| $20,000 to $22,499 | 119 (2.0%) | 203 (3.2%) |
| $22,500 to $24,999 | 432 (7.1%) | 409 (6.5%) |
| $25,000 to $29,999 | 364 (6.0%) | 365 (5.8%) |
| $30,000 to $34,999 | 361 (6.0%) | 439 (7.0%) |
| $35,000 to $39,999 | 268 (4.4%) | 177 (2.8%) |
| $40,000 to $44,999 | 285 (4.7%) | 367 (5.9%) |
| $45,000 to $49,999 | 262 (4.3%) | 368 (5.9%) |
| $50,000 to $54,999 | 123 (2.0%) | 101 (1.6%) |
| $55,000 to $64,999 | 430 (7.1%) | 355 (5.7%) |
| $65,000 to $74,999 | 339 (5.6%) | 315 (5.0%) |
| $75,000 to $99,999 | 677 (11.2%) | 238 (3.8%) |
| $100,000+ | 636 (10.5%) | 202 (3.2%) |
| Total | 6,046 (100.0%) | 6,275 (100.0%) |
Earnings by Sex by Educational Attainment in Bolivar County
Average earnings in Bolivar County are $41,977 for men and $27,436 for women, a difference of 34.6%. Men with an educational attainment of graduate degree enjoy the highest average annual earnings of $83,639, while those with high school diploma education earn the least with $29,592. Women with an educational attainment of graduate degree earn the most with the average annual earnings of $55,817, while those with less than high school education have the smallest earnings of $11,563.
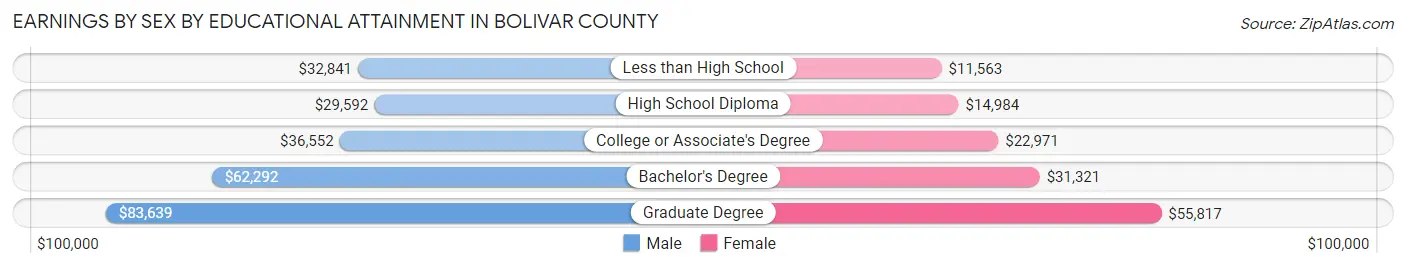
| Educational Attainment | Male Income | Female Income |
| Less than High School | $32,841 | $11,563 |
| High School Diploma | $29,592 | $14,984 |
| College or Associate's Degree | $36,552 | $22,971 |
| Bachelor's Degree | $62,292 | $31,321 |
| Graduate Degree | $83,639 | $55,817 |
| Total | $41,977 | $27,436 |
Family Income in Bolivar County
Family Income Brackets in Bolivar County
According to the Bolivar County family income data, there are 1,281 families falling into the $50,000 to $74,999 income range, which is the most common income bracket and makes up 17.7% of all families. Conversely, the $150,000 to $199,999 income bracket is the least frequent group with only 181 families (2.5%) belonging to this category.
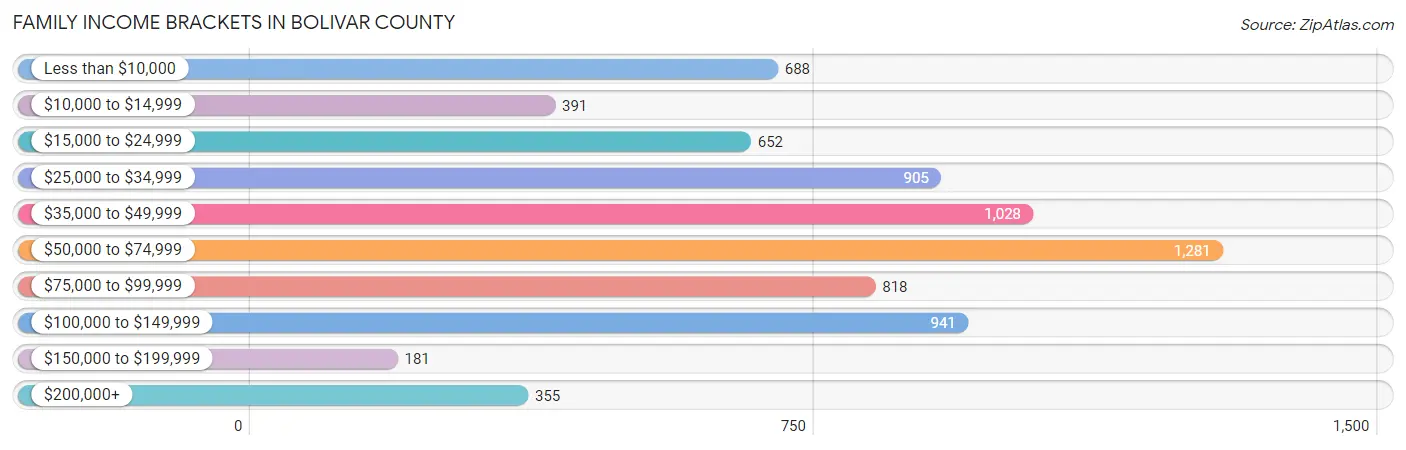
| Income Bracket | # Families | % Families |
| Less than $10,000 | 688 | 9.5% |
| $10,000 to $14,999 | 391 | 5.4% |
| $15,000 to $24,999 | 652 | 9.0% |
| $25,000 to $34,999 | 905 | 12.5% |
| $35,000 to $49,999 | 1,028 | 14.2% |
| $50,000 to $74,999 | 1,281 | 17.7% |
| $75,000 to $99,999 | 818 | 11.3% |
| $100,000 to $149,999 | 941 | 13.0% |
| $150,000 to $199,999 | 181 | 2.5% |
| $200,000+ | 355 | 4.9% |
Family Income by Famaliy Size in Bolivar County
3-person families (1,735 | 24.0%) account for the highest median family income in Bolivar County with $58,323 per family, while 2-person families (3,306 | 45.7%) have the highest median income of $26,578 per family member.
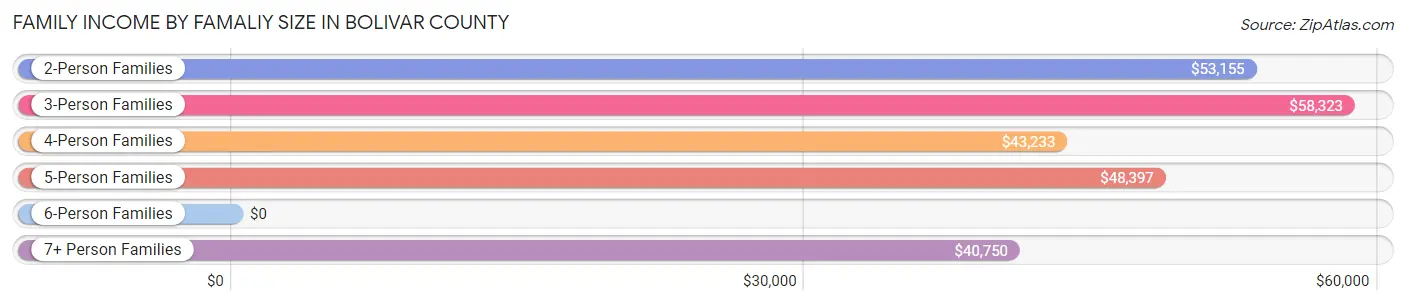
| Income Bracket | # Families | Median Income |
| 2-Person Families | 3,306 (45.7%) | $53,155 |
| 3-Person Families | 1,735 (24.0%) | $58,323 |
| 4-Person Families | 1,265 (17.5%) | $43,233 |
| 5-Person Families | 517 (7.1%) | $48,397 |
| 6-Person Families | 271 (3.7%) | $0 |
| 7+ Person Families | 146 (2.0%) | $40,750 |
| Total | 7,240 (100.0%) | $49,306 |
Family Income by Number of Earners in Bolivar County
The median family income in Bolivar County is $49,306, with families comprising 3+ earners (408) having the highest median family income of $108,333, while families with no earners (1,630) have the lowest median family income of $24,000, accounting for 5.6% and 22.5% of families, respectively.
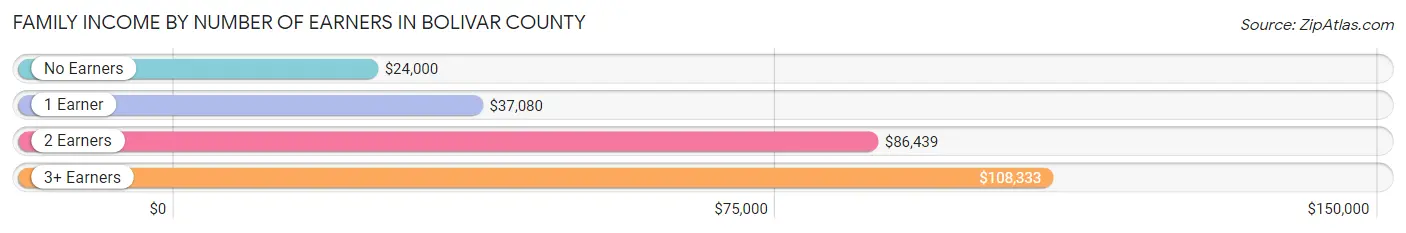
| Number of Earners | # Families | Median Income |
| No Earners | 1,630 (22.5%) | $24,000 |
| 1 Earner | 2,901 (40.1%) | $37,080 |
| 2 Earners | 2,301 (31.8%) | $86,439 |
| 3+ Earners | 408 (5.6%) | $108,333 |
| Total | 7,240 (100.0%) | $49,306 |
Household Income in Bolivar County
Household Income Brackets in Bolivar County
With 1,580 households falling in the category, the $35,000 to $49,999 income range is the most frequent in Bolivar County, accounting for 13.5% of all households. In contrast, only 234 households (2.0%) fall into the $150,000 to $199,999 income bracket, making it the least populous group.
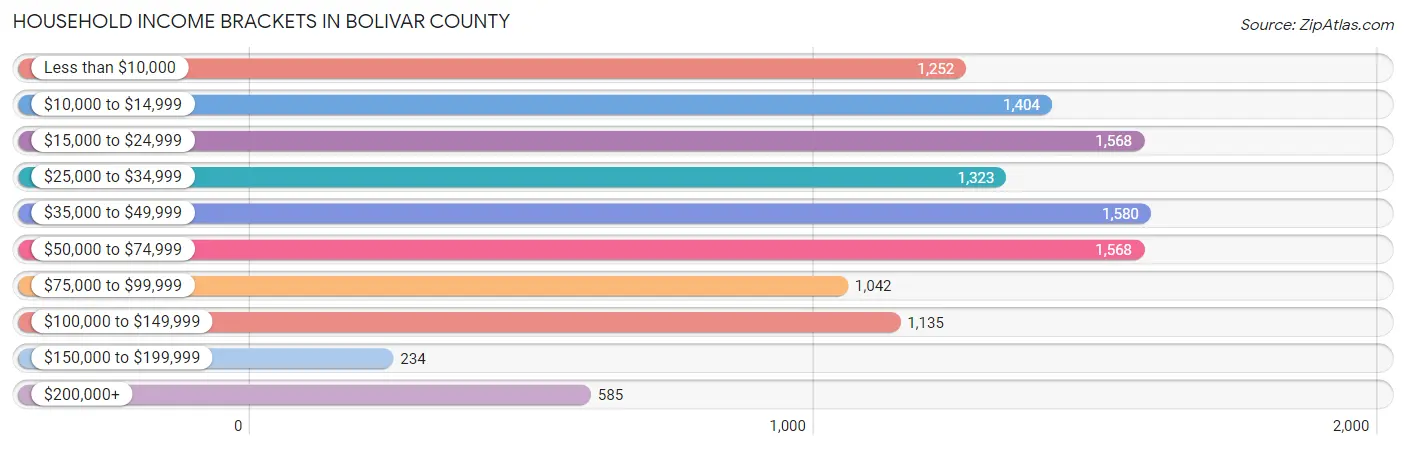
| Income Bracket | # Households | % Households |
| Less than $10,000 | 1,252 | 10.7% |
| $10,000 to $14,999 | 1,404 | 12.0% |
| $15,000 to $24,999 | 1,568 | 13.4% |
| $25,000 to $34,999 | 1,323 | 11.3% |
| $35,000 to $49,999 | 1,580 | 13.5% |
| $50,000 to $74,999 | 1,568 | 13.4% |
| $75,000 to $99,999 | 1,042 | 8.9% |
| $100,000 to $149,999 | 1,135 | 9.7% |
| $150,000 to $199,999 | 234 | 2.0% |
| $200,000+ | 585 | 5.0% |
Household Income by Householder Age in Bolivar County
The median household income in Bolivar County is $37,845, with the highest median household income of $46,710 found in the 25 to 44 years age bracket for the primary householder. A total of 3,427 households (29.3%) fall into this category. Meanwhile, the 15 to 24 years age bracket for the primary householder has the lowest median household income of $17,684, with 433 households (3.7%) in this group.
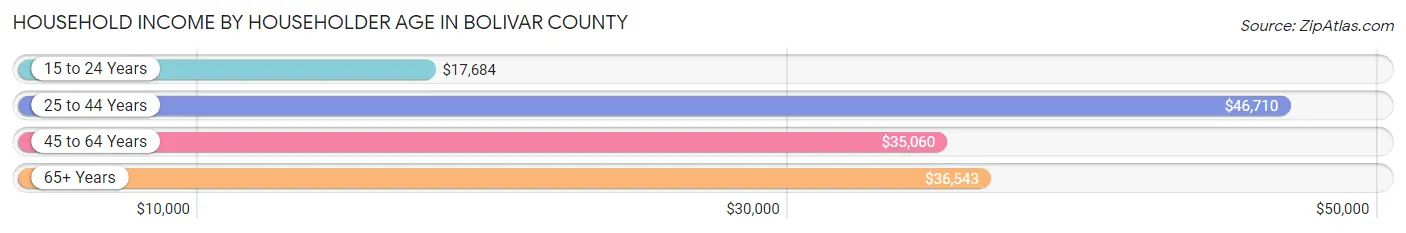
| Income Bracket | # Households | Median Income |
| 15 to 24 Years | 433 (3.7%) | $17,684 |
| 25 to 44 Years | 3,427 (29.3%) | $46,710 |
| 45 to 64 Years | 4,491 (38.4%) | $35,060 |
| 65+ Years | 3,353 (28.6%) | $36,543 |
| Total | 11,704 (100.0%) | $37,845 |
Poverty in Bolivar County
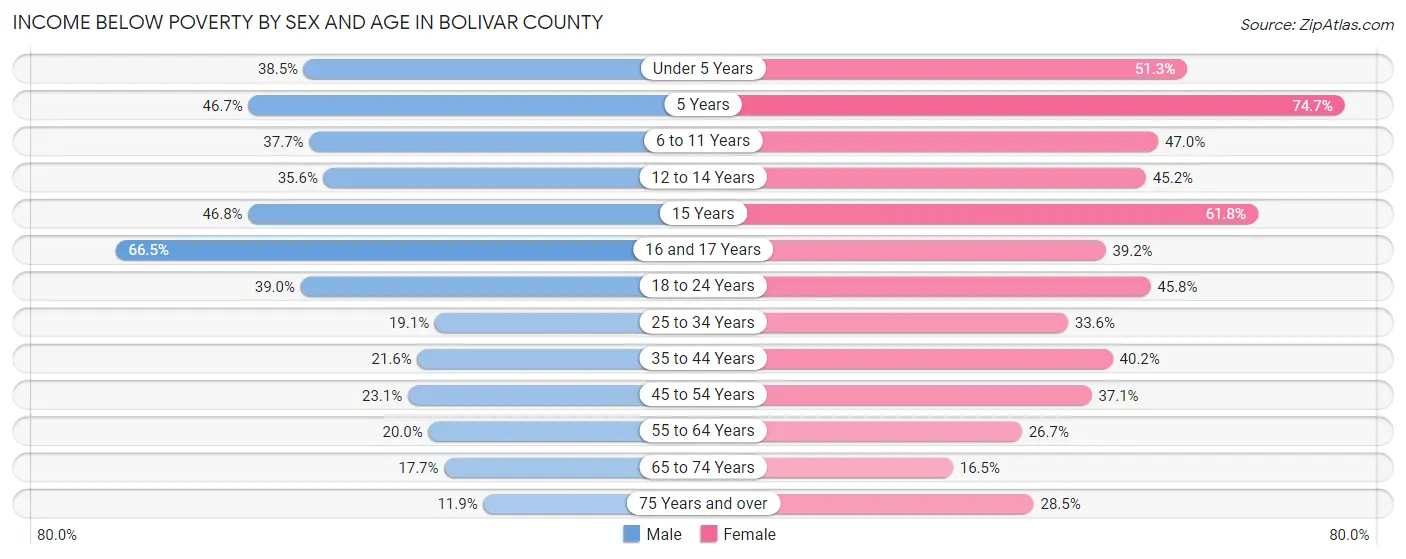
Income Below Poverty by Sex and Age in Bolivar County
With 27.1% poverty level for males and 35.8% for females among the residents of Bolivar County, 16 and 17 year old males and 5 year old females are the most vulnerable to poverty, with 244 males (66.5%) and 106 females (74.7%) in their respective age groups living below the poverty level.
| Age Bracket | Male | Female |
| Under 5 Years | 384 (38.5%) | 467 (51.3%) |
| 5 Years | 50 (46.7%) | 106 (74.7%) |
| 6 to 11 Years | 422 (37.7%) | 556 (47.0%) |
| 12 to 14 Years | 238 (35.6%) | 238 (45.2%) |
| 15 Years | 101 (46.8%) | 126 (61.8%) |
| 16 and 17 Years | 244 (66.5%) | 175 (39.2%) |
| 18 to 24 Years | 457 (39.0%) | 510 (45.8%) |
| 25 to 34 Years | 369 (19.1%) | 692 (33.6%) |
| 35 to 44 Years | 341 (21.6%) | 758 (40.2%) |
| 45 to 54 Years | 338 (23.1%) | 682 (37.1%) |
| 55 to 64 Years | 349 (20.0%) | 551 (26.7%) |
| 65 to 74 Years | 217 (17.7%) | 294 (16.5%) |
| 75 Years and over | 76 (11.9%) | 313 (28.5%) |
| Total | 3,586 (27.1%) | 5,468 (35.8%) |
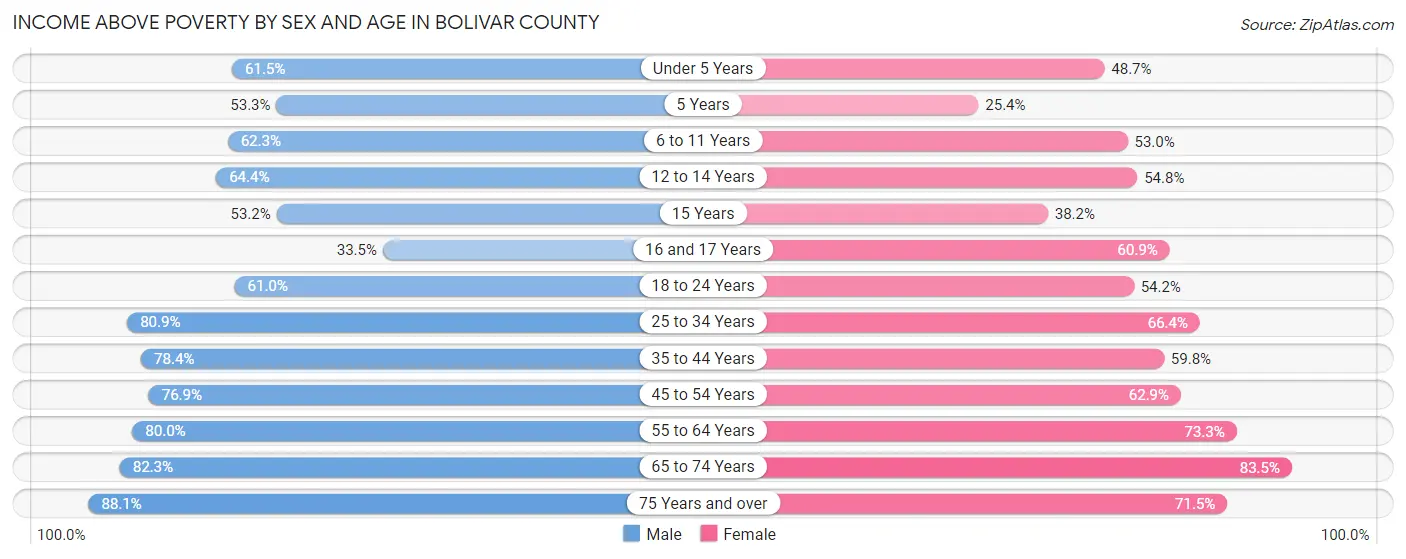
Income Above Poverty by Sex and Age in Bolivar County
According to the poverty statistics in Bolivar County, males aged 75 years and over and females aged 65 to 74 years are the age groups that are most secure financially, with 88.1% of males and 83.5% of females in these age groups living above the poverty line.
| Age Bracket | Male | Female |
| Under 5 Years | 613 (61.5%) | 444 (48.7%) |
| 5 Years | 57 (53.3%) | 36 (25.4%) |
| 6 to 11 Years | 697 (62.3%) | 628 (53.0%) |
| 12 to 14 Years | 431 (64.4%) | 289 (54.8%) |
| 15 Years | 115 (53.2%) | 78 (38.2%) |
| 16 and 17 Years | 123 (33.5%) | 272 (60.9%) |
| 18 to 24 Years | 715 (61.0%) | 603 (54.2%) |
| 25 to 34 Years | 1,567 (80.9%) | 1,370 (66.4%) |
| 35 to 44 Years | 1,235 (78.4%) | 1,127 (59.8%) |
| 45 to 54 Years | 1,128 (76.9%) | 1,158 (62.9%) |
| 55 to 64 Years | 1,394 (80.0%) | 1,511 (73.3%) |
| 65 to 74 Years | 1,011 (82.3%) | 1,490 (83.5%) |
| 75 Years and over | 565 (88.1%) | 786 (71.5%) |
| Total | 9,651 (72.9%) | 9,792 (64.2%) |
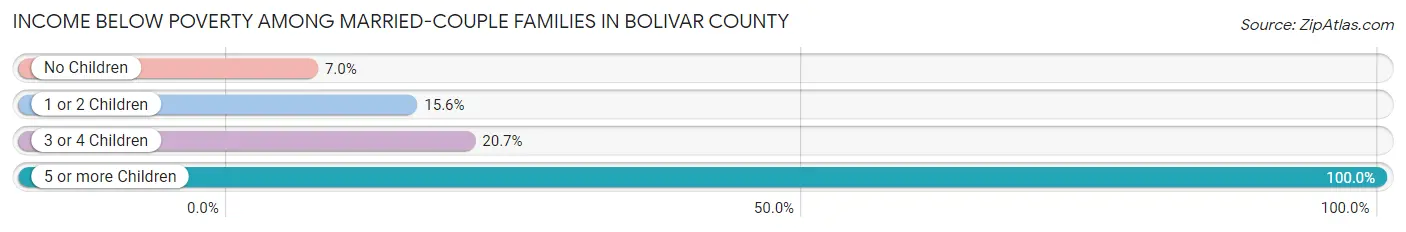
Income Below Poverty Among Married-Couple Families in Bolivar County
The poverty statistics for married-couple families in Bolivar County show that 11.0% or 416 of the total 3,797 families live below the poverty line. Families with 5 or more children have the highest poverty rate of 100.0%, comprising of 16 families. On the other hand, families with no children have the lowest poverty rate of 7.0%, which includes 163 families.
| Children | Above Poverty | Below Poverty |
| No Children | 2,178 (93.0%) | 163 (7.0%) |
| 1 or 2 Children | 1,011 (84.4%) | 187 (15.6%) |
| 3 or 4 Children | 192 (79.3%) | 50 (20.7%) |
| 5 or more Children | 0 (0.0%) | 16 (100.0%) |
| Total | 3,381 (89.0%) | 416 (11.0%) |
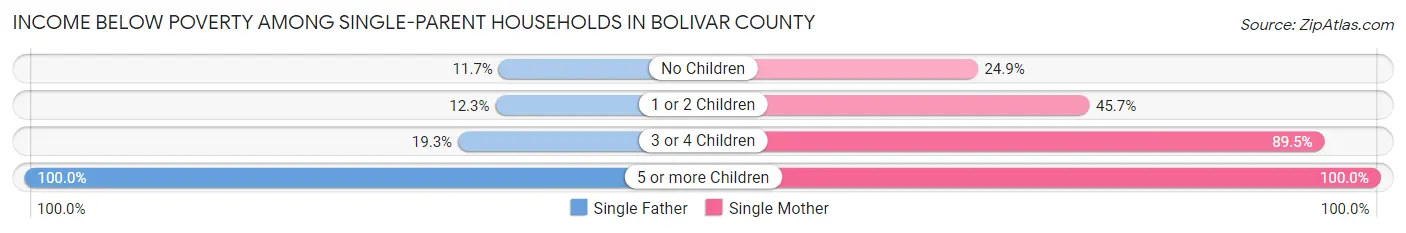
Income Below Poverty Among Single-Parent Households in Bolivar County
According to the poverty data in Bolivar County, 18.4% or 155 single-father households and 46.9% or 1,220 single-mother households are living below the poverty line. Among single-father households, those with 5 or more children have the highest poverty rate, with 50 households (100.0%) experiencing poverty. Likewise, among single-mother households, those with 5 or more children have the highest poverty rate, with 101 households (100.0%) falling below the poverty line.
| Children | Single Father | Single Mother |
| No Children | 42 (11.7%) | 245 (24.9%) |
| 1 or 2 Children | 36 (12.3%) | 506 (45.7%) |
| 3 or 4 Children | 27 (19.3%) | 368 (89.5%) |
| 5 or more Children | 50 (100.0%) | 101 (100.0%) |
| Total | 155 (18.4%) | 1,220 (46.9%) |
Income Below Poverty Among Married-Couple vs Single-Parent Households in Bolivar County
The poverty data for Bolivar County shows that 416 of the married-couple family households (11.0%) and 1,375 of the single-parent households (39.9%) are living below the poverty level. Within the married-couple family households, those with 5 or more children have the highest poverty rate, with 16 households (100.0%) falling below the poverty line. Among the single-parent households, those with 5 or more children have the highest poverty rate, with 151 household (100.0%) living below poverty.
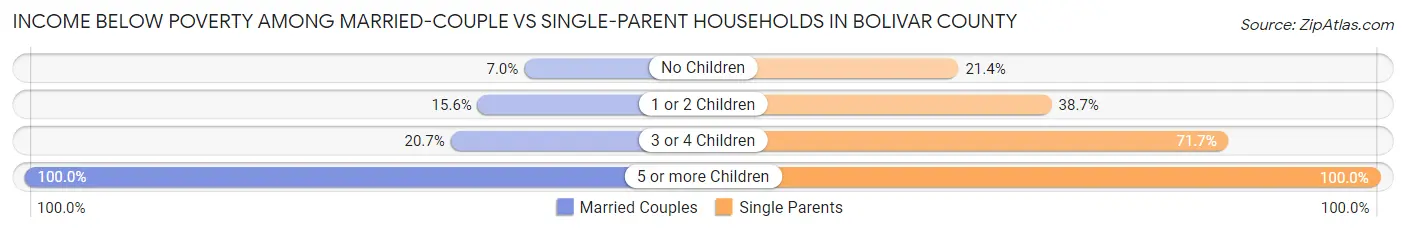
| Children | Married-Couple Families | Single-Parent Households |
| No Children | 163 (7.0%) | 287 (21.4%) |
| 1 or 2 Children | 187 (15.6%) | 542 (38.7%) |
| 3 or 4 Children | 50 (20.7%) | 395 (71.7%) |
| 5 or more Children | 16 (100.0%) | 151 (100.0%) |
| Total | 416 (11.0%) | 1,375 (39.9%) |
Employment Characteristics in Bolivar County
Employment by Class of Employer in Bolivar County
Among the 10,635 employed individuals in Bolivar County, private company employees (5,989 | 56.3%), state government employees (1,617 | 15.2%), and local government employees (950 | 8.9%) make up the most common classes of employment.
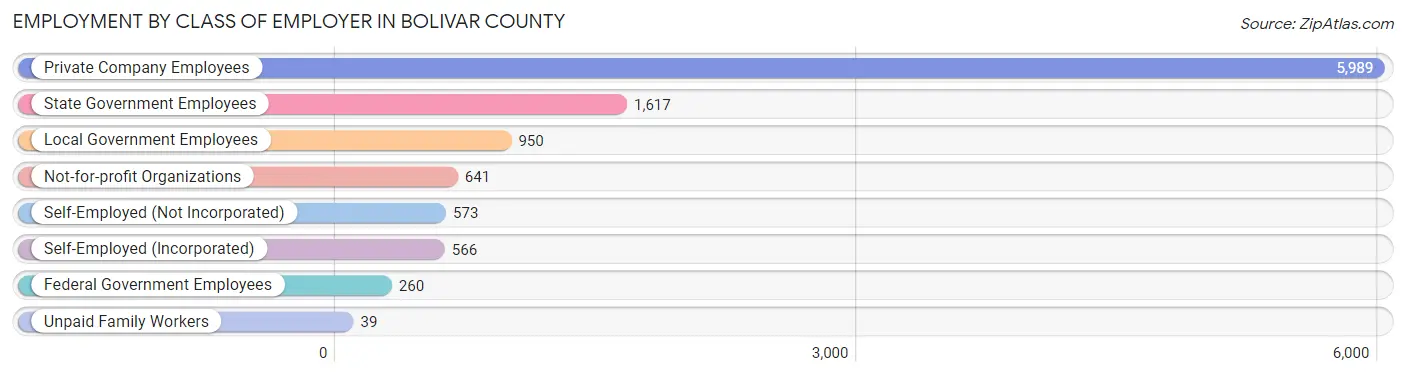
| Employer Class | # Employees | % Employees |
| Private Company Employees | 5,989 | 56.3% |
| Self-Employed (Incorporated) | 566 | 5.3% |
| Self-Employed (Not Incorporated) | 573 | 5.4% |
| Not-for-profit Organizations | 641 | 6.0% |
| Local Government Employees | 950 | 8.9% |
| State Government Employees | 1,617 | 15.2% |
| Federal Government Employees | 260 | 2.4% |
| Unpaid Family Workers | 39 | 0.4% |
| Total | 10,635 | 100.0% |
Employment Status by Age in Bolivar County
According to the labor force statistics for Bolivar County, out of the total population over 16 years of age (23,986), 49.7% or 11,921 individuals are in the labor force, with 7.4% or 882 of them unemployed. The age group with the highest labor force participation rate is 35 to 44 years, with 73.3% or 2,628 individuals in the labor force. Within the labor force, the 16 to 19 years age range has the highest percentage of unemployed individuals, with 14.7% or 73 of them being unemployed.
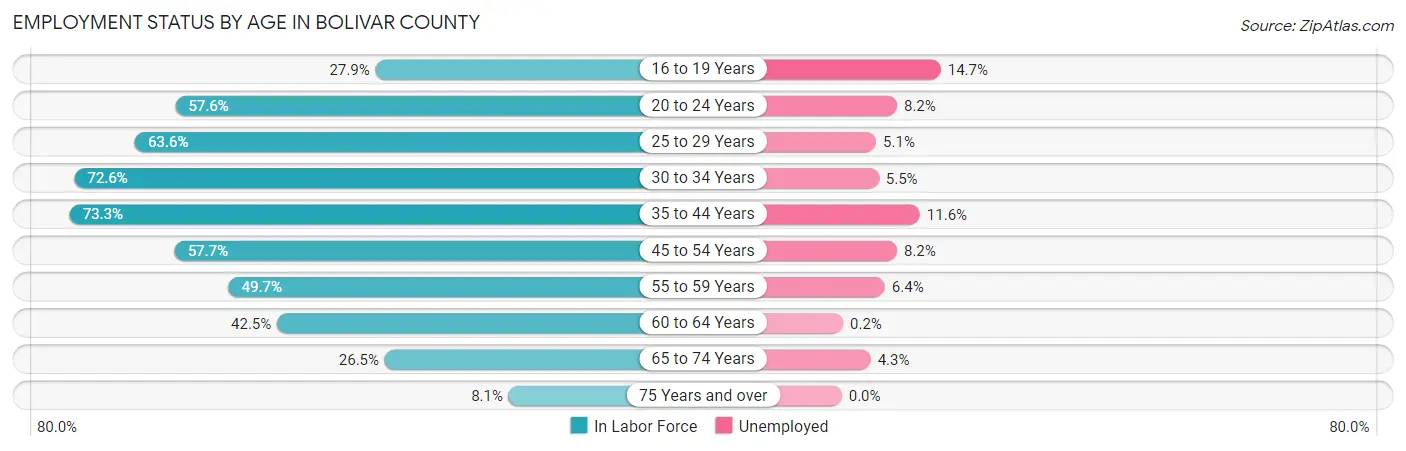
| Age Bracket | In Labor Force | Unemployed |
| 16 to 19 Years | 498 (27.9%) | 73 (14.7%) |
| 20 to 24 Years | 1,238 (57.6%) | 102 (8.2%) |
| 25 to 29 Years | 1,281 (63.6%) | 65 (5.1%) |
| 30 to 34 Years | 1,488 (72.6%) | 82 (5.5%) |
| 35 to 44 Years | 2,628 (73.3%) | 305 (11.6%) |
| 45 to 54 Years | 1,981 (57.7%) | 162 (8.2%) |
| 55 to 59 Years | 972 (49.7%) | 62 (6.4%) |
| 60 to 64 Years | 842 (42.5%) | 2 (0.2%) |
| 65 to 74 Years | 835 (26.5%) | 36 (4.3%) |
| 75 Years and over | 152 (8.1%) | 0 (0.0%) |
| Total | 11,921 (49.7%) | 882 (7.4%) |
Employment Status by Educational Attainment in Bolivar County
According to labor force statistics for Bolivar County, 61.2% of individuals (9,193) out of the total population between 25 and 64 years of age (15,021) are in the labor force, with 7.4% or 680 of them being unemployed. The group with the highest labor force participation rate are those with the educational attainment of bachelor's degree or higher, with 88.7% or 3,495 individuals in the labor force. Within the labor force, individuals with less than high school education have the highest percentage of unemployment, with 35.6% or 236 of them being unemployed.
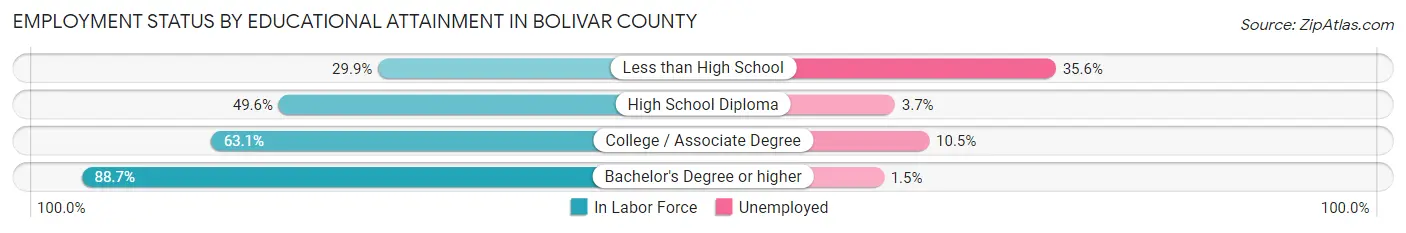
| Educational Attainment | In Labor Force | Unemployed |
| Less than High School | 664 (29.9%) | 791 (35.6%) |
| High School Diploma | 2,049 (49.6%) | 153 (3.7%) |
| College / Associate Degree | 2,984 (63.1%) | 497 (10.5%) |
| Bachelor's Degree or higher | 3,495 (88.7%) | 59 (1.5%) |
| Total | 9,193 (61.2%) | 1,112 (7.4%) |
Employment Occupations by Sex in Bolivar County
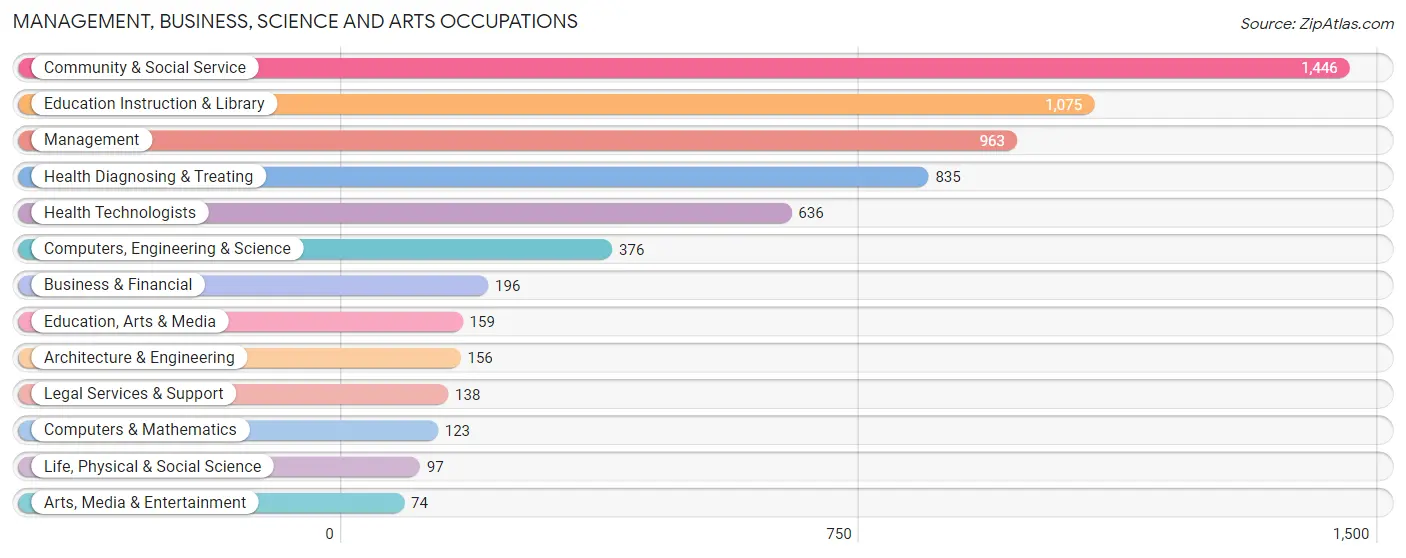
Management, Business, Science and Arts Occupations
The most common Management, Business, Science and Arts occupations in Bolivar County are Community & Social Service (1,446 | 13.1%), Education Instruction & Library (1,075 | 9.8%), Management (963 | 8.7%), Health Diagnosing & Treating (835 | 7.6%), and Health Technologists (636 | 5.8%).
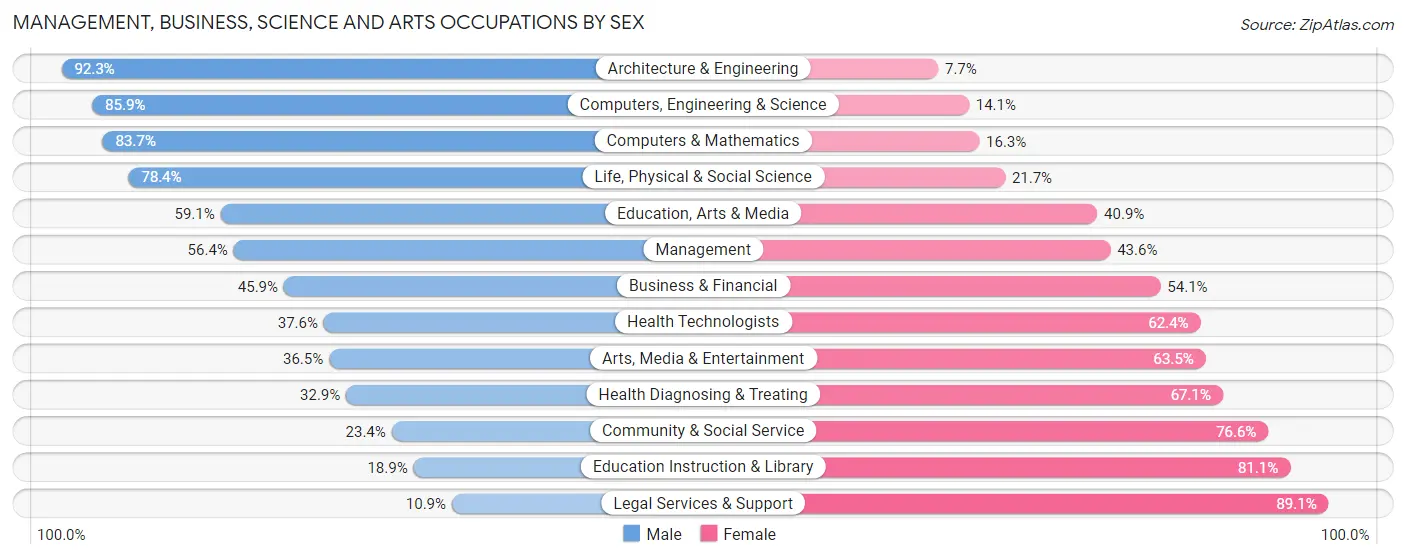
Management, Business, Science and Arts Occupations by Sex
Within the Management, Business, Science and Arts occupations in Bolivar County, the most male-oriented occupations are Architecture & Engineering (92.3%), Computers, Engineering & Science (85.9%), and Computers & Mathematics (83.7%), while the most female-oriented occupations are Legal Services & Support (89.1%), Education Instruction & Library (81.1%), and Community & Social Service (76.6%).
| Occupation | Male | Female |
| Management | 543 (56.4%) | 420 (43.6%) |
| Business & Financial | 90 (45.9%) | 106 (54.1%) |
| Computers, Engineering & Science | 323 (85.9%) | 53 (14.1%) |
| Computers & Mathematics | 103 (83.7%) | 20 (16.3%) |
| Architecture & Engineering | 144 (92.3%) | 12 (7.7%) |
| Life, Physical & Social Science | 76 (78.3%) | 21 (21.6%) |
| Community & Social Service | 339 (23.4%) | 1,107 (76.6%) |
| Education, Arts & Media | 94 (59.1%) | 65 (40.9%) |
| Legal Services & Support | 15 (10.9%) | 123 (89.1%) |
| Education Instruction & Library | 203 (18.9%) | 872 (81.1%) |
| Arts, Media & Entertainment | 27 (36.5%) | 47 (63.5%) |
| Health Diagnosing & Treating | 275 (32.9%) | 560 (67.1%) |
| Health Technologists | 239 (37.6%) | 397 (62.4%) |
| Total (Category) | 1,570 (41.1%) | 2,246 (58.9%) |
| Total (Overall) | 5,275 (47.9%) | 5,733 (52.1%) |
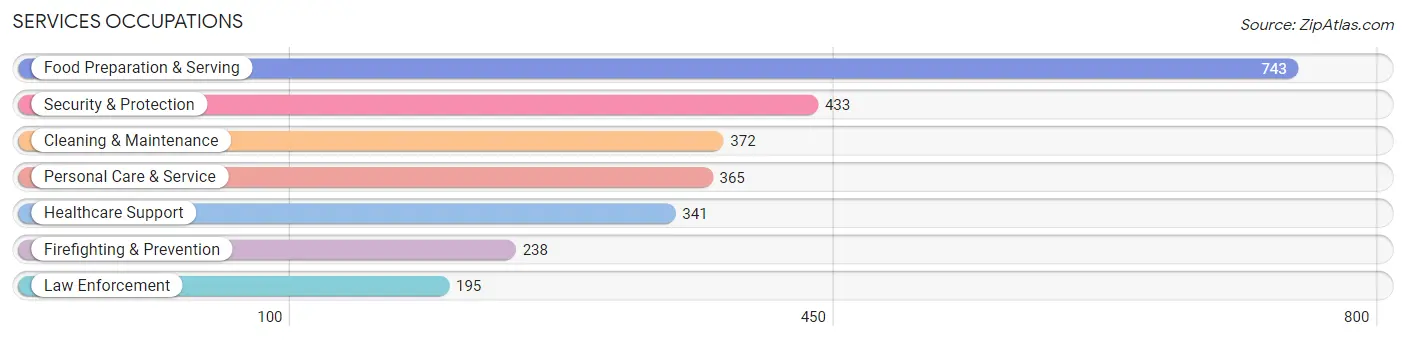
Services Occupations
The most common Services occupations in Bolivar County are Food Preparation & Serving (743 | 6.8%), Security & Protection (433 | 3.9%), Cleaning & Maintenance (372 | 3.4%), Personal Care & Service (365 | 3.3%), and Healthcare Support (341 | 3.1%).
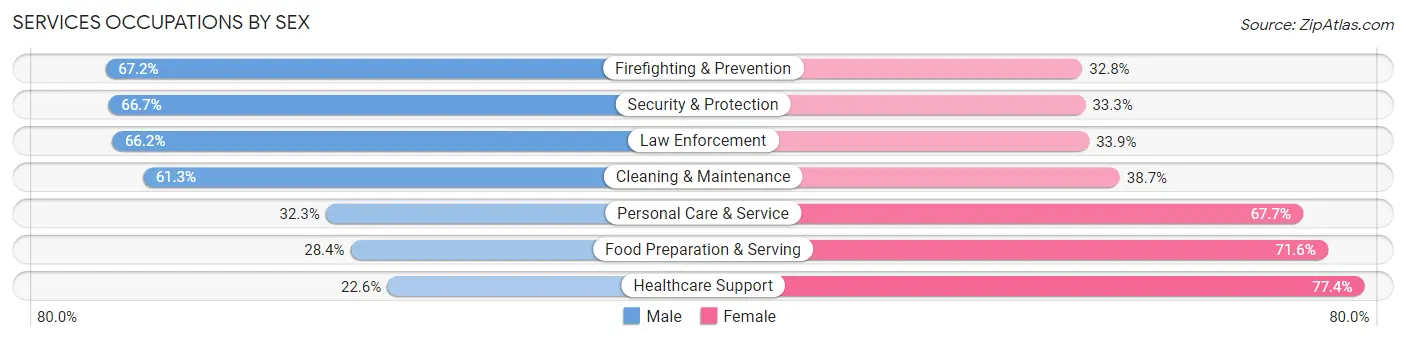
Services Occupations by Sex
Within the Services occupations in Bolivar County, the most male-oriented occupations are Firefighting & Prevention (67.2%), Security & Protection (66.7%), and Law Enforcement (66.1%), while the most female-oriented occupations are Healthcare Support (77.4%), Food Preparation & Serving (71.6%), and Personal Care & Service (67.7%).
| Occupation | Male | Female |
| Healthcare Support | 77 (22.6%) | 264 (77.4%) |
| Security & Protection | 289 (66.7%) | 144 (33.3%) |
| Firefighting & Prevention | 160 (67.2%) | 78 (32.8%) |
| Law Enforcement | 129 (66.1%) | 66 (33.9%) |
| Food Preparation & Serving | 211 (28.4%) | 532 (71.6%) |
| Cleaning & Maintenance | 228 (61.3%) | 144 (38.7%) |
| Personal Care & Service | 118 (32.3%) | 247 (67.7%) |
| Total (Category) | 923 (40.9%) | 1,331 (59.1%) |
| Total (Overall) | 5,275 (47.9%) | 5,733 (52.1%) |
Sales and Office Occupations
The most common Sales and Office occupations in Bolivar County are Office & Administration (1,460 | 13.3%), and Sales & Related (802 | 7.3%).
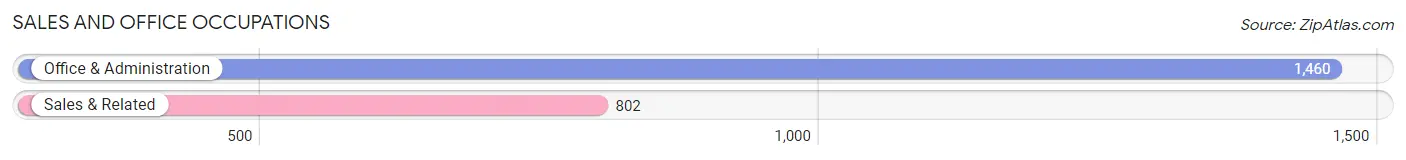
Sales and Office Occupations by Sex
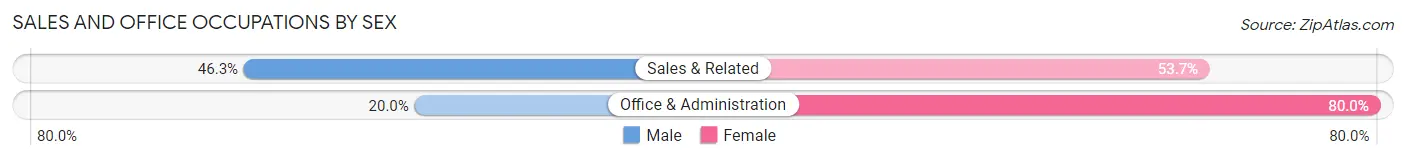
| Occupation | Male | Female |
| Sales & Related | 371 (46.3%) | 431 (53.7%) |
| Office & Administration | 292 (20.0%) | 1,168 (80.0%) |
| Total (Category) | 663 (29.3%) | 1,599 (70.7%) |
| Total (Overall) | 5,275 (47.9%) | 5,733 (52.1%) |
Natural Resources, Construction and Maintenance Occupations
The most common Natural Resources, Construction and Maintenance occupations in Bolivar County are Installation, Maintenance & Repair (535 | 4.9%), Construction & Extraction (367 | 3.3%), and Farming, Fishing & Forestry (229 | 2.1%).
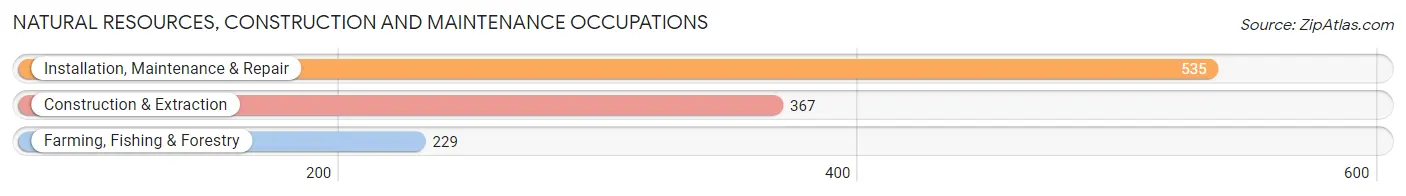
Natural Resources, Construction and Maintenance Occupations by Sex
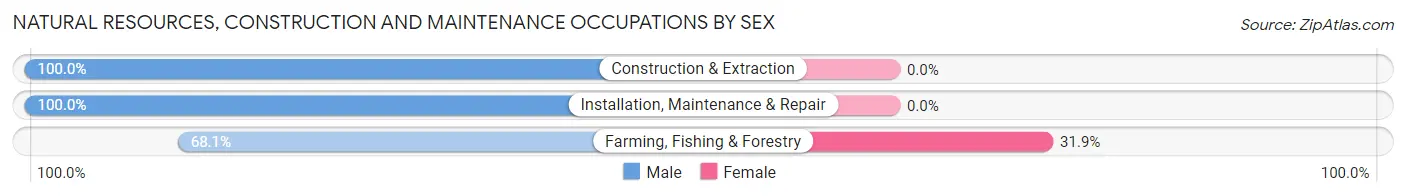
| Occupation | Male | Female |
| Farming, Fishing & Forestry | 156 (68.1%) | 73 (31.9%) |
| Construction & Extraction | 367 (100.0%) | 0 (0.0%) |
| Installation, Maintenance & Repair | 535 (100.0%) | 0 (0.0%) |
| Total (Category) | 1,058 (93.5%) | 73 (6.5%) |
| Total (Overall) | 5,275 (47.9%) | 5,733 (52.1%) |
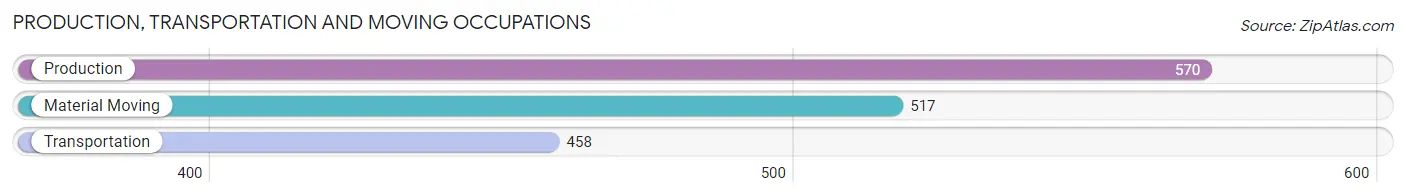
Production, Transportation and Moving Occupations
The most common Production, Transportation and Moving occupations in Bolivar County are Production (570 | 5.2%), Material Moving (517 | 4.7%), and Transportation (458 | 4.2%).
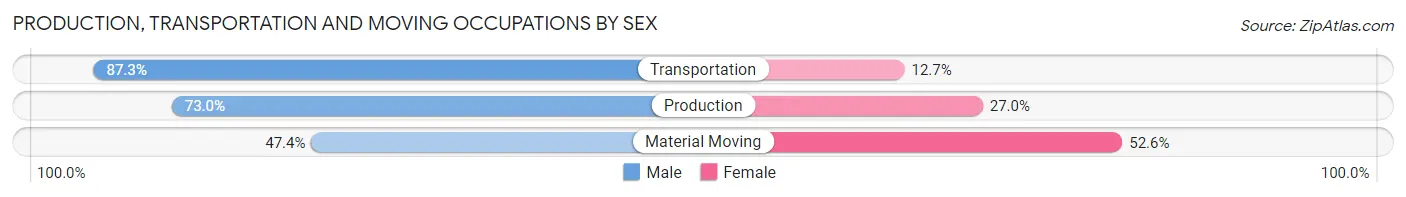
Production, Transportation and Moving Occupations by Sex
| Occupation | Male | Female |
| Production | 416 (73.0%) | 154 (27.0%) |
| Transportation | 400 (87.3%) | 58 (12.7%) |
| Material Moving | 245 (47.4%) | 272 (52.6%) |
| Total (Category) | 1,061 (68.7%) | 484 (31.3%) |
| Total (Overall) | 5,275 (47.9%) | 5,733 (52.1%) |
Employment Industries by Sex in Bolivar County
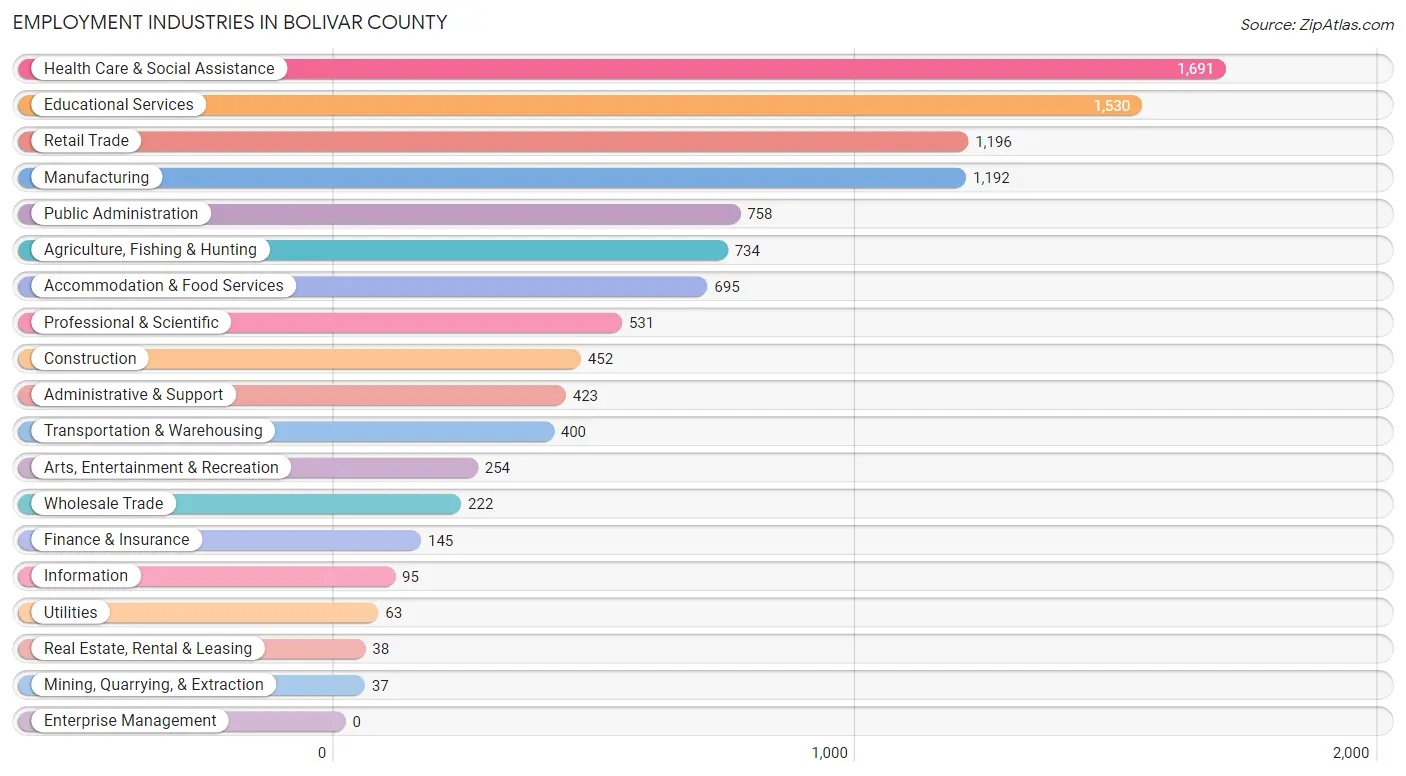
Employment Industries in Bolivar County
The major employment industries in Bolivar County include Health Care & Social Assistance (1,691 | 15.4%), Educational Services (1,530 | 13.9%), Retail Trade (1,196 | 10.9%), Manufacturing (1,192 | 10.8%), and Public Administration (758 | 6.9%).
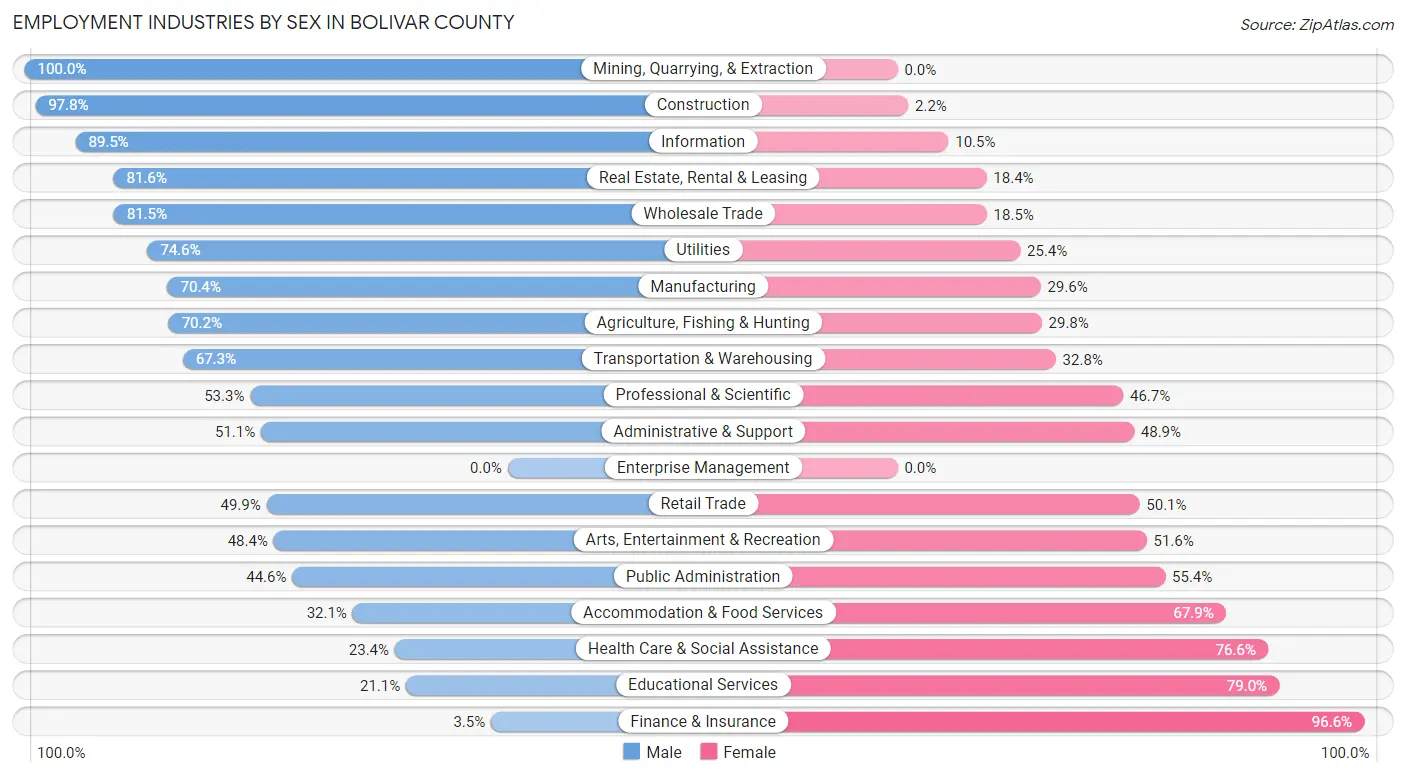
Employment Industries by Sex in Bolivar County
The Bolivar County industries that see more men than women are Mining, Quarrying, & Extraction (100.0%), Construction (97.8%), and Information (89.5%), whereas the industries that tend to have a higher number of women are Finance & Insurance (96.6%), Educational Services (78.9%), and Health Care & Social Assistance (76.6%).
| Industry | Male | Female |
| Agriculture, Fishing & Hunting | 515 (70.2%) | 219 (29.8%) |
| Mining, Quarrying, & Extraction | 37 (100.0%) | 0 (0.0%) |
| Construction | 442 (97.8%) | 10 (2.2%) |
| Manufacturing | 839 (70.4%) | 353 (29.6%) |
| Wholesale Trade | 181 (81.5%) | 41 (18.5%) |
| Retail Trade | 597 (49.9%) | 599 (50.1%) |
| Transportation & Warehousing | 269 (67.2%) | 131 (32.8%) |
| Utilities | 47 (74.6%) | 16 (25.4%) |
| Information | 85 (89.5%) | 10 (10.5%) |
| Finance & Insurance | 5 (3.5%) | 140 (96.6%) |
| Real Estate, Rental & Leasing | 31 (81.6%) | 7 (18.4%) |
| Professional & Scientific | 283 (53.3%) | 248 (46.7%) |
| Enterprise Management | 0 (0.0%) | 0 (0.0%) |
| Administrative & Support | 216 (51.1%) | 207 (48.9%) |
| Educational Services | 322 (21.0%) | 1,208 (78.9%) |
| Health Care & Social Assistance | 395 (23.4%) | 1,296 (76.6%) |
| Arts, Entertainment & Recreation | 123 (48.4%) | 131 (51.6%) |
| Accommodation & Food Services | 223 (32.1%) | 472 (67.9%) |
| Public Administration | 338 (44.6%) | 420 (55.4%) |
| Total | 5,275 (47.9%) | 5,733 (52.1%) |
Education in Bolivar County
School Enrollment in Bolivar County
The most common levels of schooling among the 8,998 students in Bolivar County are college / undergraduate (2,091 | 23.2%), middle school (1,882 | 20.9%), and elementary school (1,696 | 18.9%).
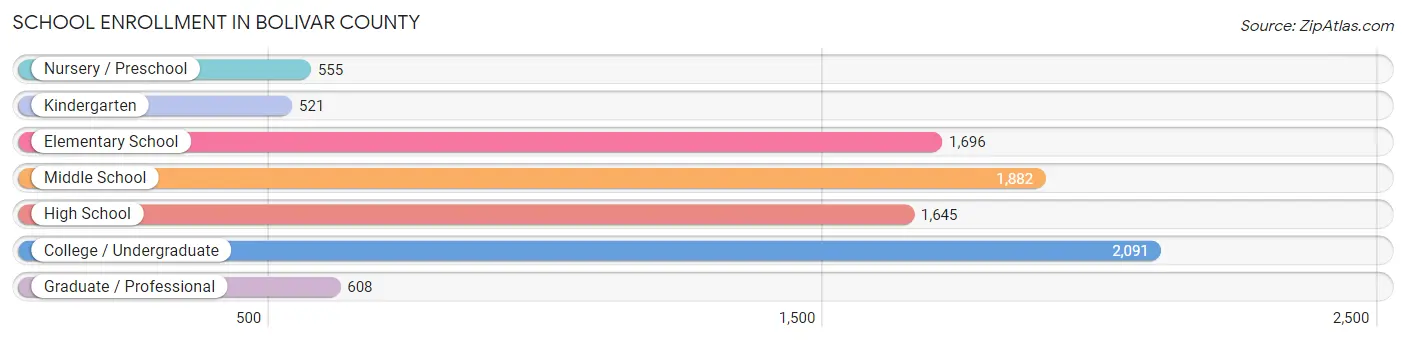
| School Level | # Students | % Students |
| Nursery / Preschool | 555 | 6.2% |
| Kindergarten | 521 | 5.8% |
| Elementary School | 1,696 | 18.9% |
| Middle School | 1,882 | 20.9% |
| High School | 1,645 | 18.3% |
| College / Undergraduate | 2,091 | 23.2% |
| Graduate / Professional | 608 | 6.8% |
| Total | 8,998 | 100.0% |
School Enrollment by Age by Funding Source in Bolivar County
Out of a total of 8,998 students who are enrolled in schools in Bolivar County, 810 (9.0%) attend a private institution, while the remaining 8,188 (91.0%) are enrolled in public schools. The age group of 35 years and over has the highest likelihood of being enrolled in private schools, with 102 (19.9% in the age bracket) enrolled. Conversely, the age group of 20 to 24 year olds has the lowest likelihood of being enrolled in a private school, with 1,059 (95.0% in the age bracket) attending a public institution.
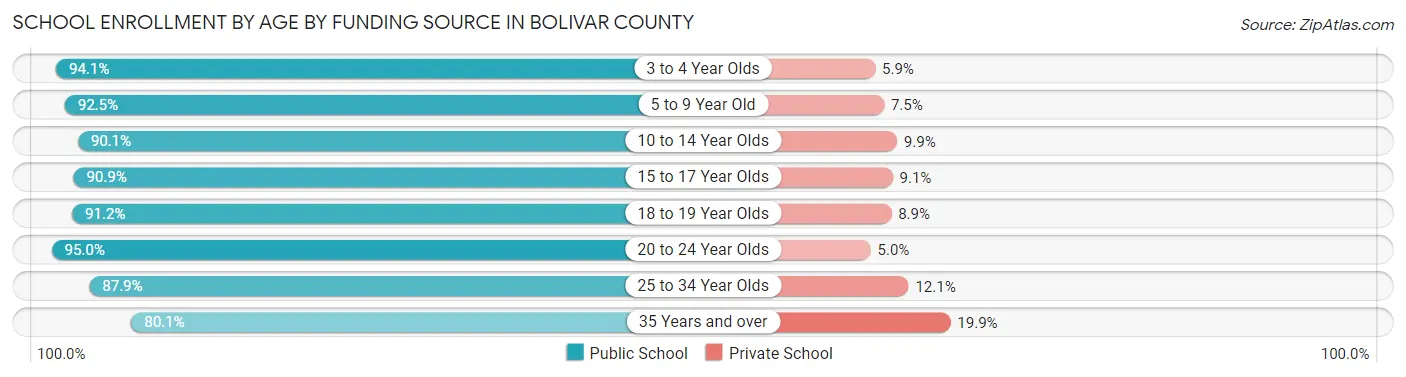
| Age Bracket | Public School | Private School |
| 3 to 4 Year Olds | 594 (94.1%) | 37 (5.9%) |
| 5 to 9 Year Old | 1,702 (92.5%) | 138 (7.5%) |
| 10 to 14 Year Olds | 2,142 (90.1%) | 236 (9.9%) |
| 15 to 17 Year Olds | 1,097 (90.9%) | 110 (9.1%) |
| 18 to 19 Year Olds | 752 (91.1%) | 73 (8.8%) |
| 20 to 24 Year Olds | 1,059 (95.0%) | 56 (5.0%) |
| 25 to 34 Year Olds | 430 (87.9%) | 59 (12.1%) |
| 35 Years and over | 411 (80.1%) | 102 (19.9%) |
| Total | 8,188 (91.0%) | 810 (9.0%) |
Educational Attainment by Field of Study in Bolivar County
Business (1,362 | 23.9%), education (1,340 | 23.5%), science & technology (650 | 11.4%), bio, nature & agricultural (485 | 8.5%), and arts & humanities (399 | 7.0%) are the most common fields of study among 5,691 individuals in Bolivar County who have obtained a bachelor's degree or higher.
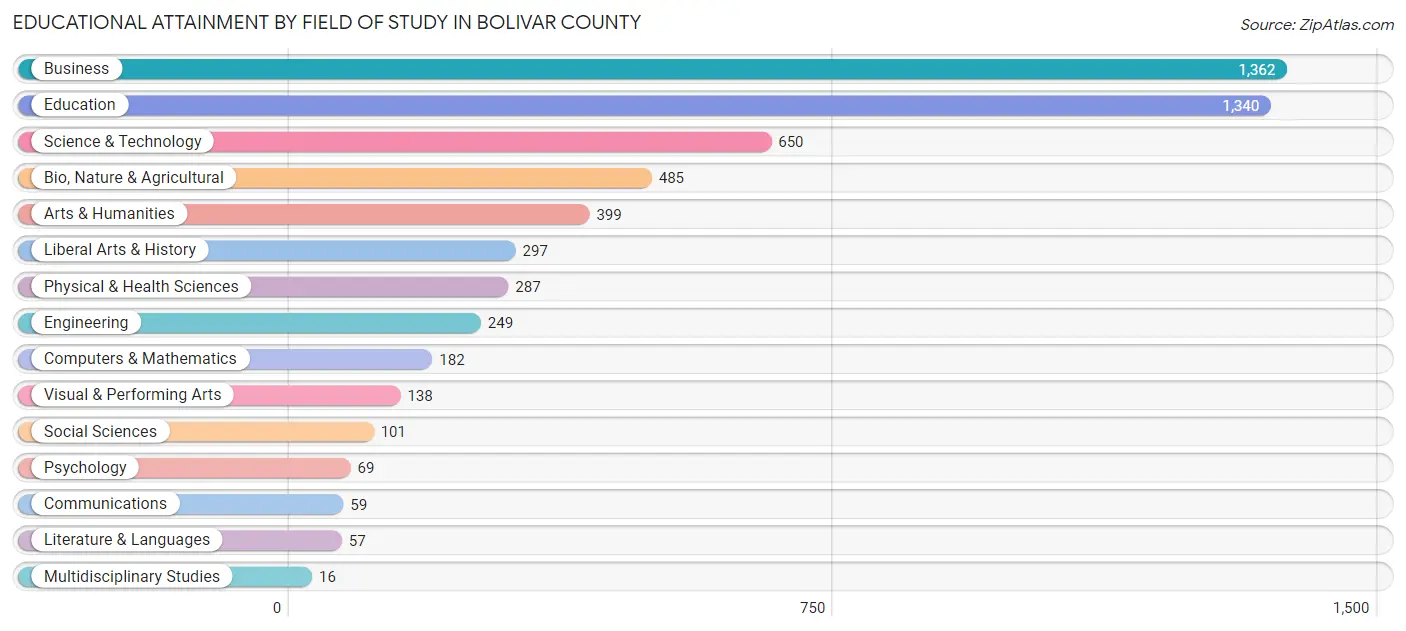
| Field of Study | # Graduates | % Graduates |
| Computers & Mathematics | 182 | 3.2% |
| Bio, Nature & Agricultural | 485 | 8.5% |
| Physical & Health Sciences | 287 | 5.0% |
| Psychology | 69 | 1.2% |
| Social Sciences | 101 | 1.8% |
| Engineering | 249 | 4.4% |
| Multidisciplinary Studies | 16 | 0.3% |
| Science & Technology | 650 | 11.4% |
| Business | 1,362 | 23.9% |
| Education | 1,340 | 23.5% |
| Literature & Languages | 57 | 1.0% |
| Liberal Arts & History | 297 | 5.2% |
| Visual & Performing Arts | 138 | 2.4% |
| Communications | 59 | 1.0% |
| Arts & Humanities | 399 | 7.0% |
| Total | 5,691 | 100.0% |
Transportation & Commute in Bolivar County
Vehicle Availability by Sex in Bolivar County
The most prevalent vehicle ownership categories in Bolivar County are males with 2 vehicles (2,334, accounting for 45.6%) and females with 2 vehicles (1,933, making up 44.8%).
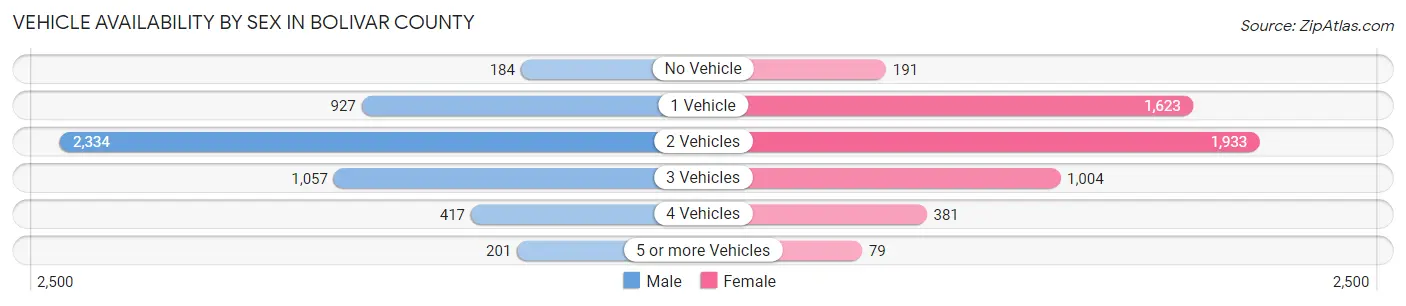
| Vehicles Available | Male | Female |
| No Vehicle | 184 (3.6%) | 191 (3.7%) |
| 1 Vehicle | 927 (18.1%) | 1,623 (31.1%) |
| 2 Vehicles | 2,334 (45.6%) | 1,933 (37.1%) |
| 3 Vehicles | 1,057 (20.6%) | 1,004 (19.3%) |
| 4 Vehicles | 417 (8.1%) | 381 (7.3%) |
| 5 or more Vehicles | 201 (3.9%) | 79 (1.5%) |
| Total | 5,120 (100.0%) | 5,211 (100.0%) |
Commute Time in Bolivar County
The most frequently occuring commute durations in Bolivar County are 5 to 9 minutes (2,382 commuters, 23.0%), 10 to 14 minutes (1,814 commuters, 17.5%), and 15 to 19 minutes (1,519 commuters, 14.7%).
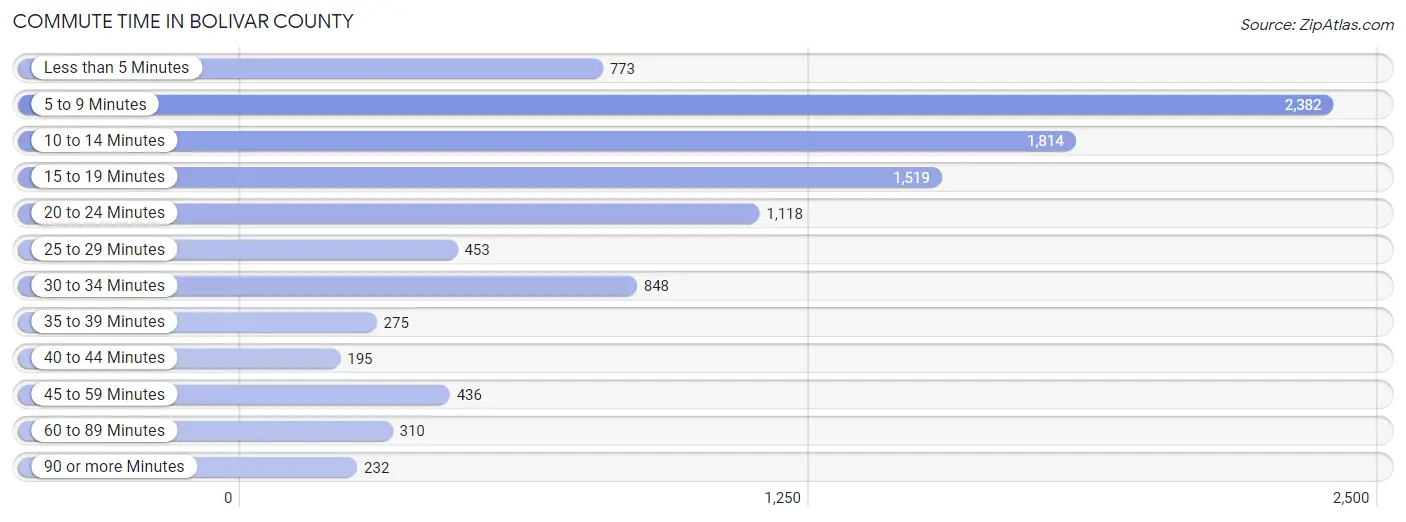
| Commute Time | # Commuters | % Commuters |
| Less than 5 Minutes | 773 | 7.5% |
| 5 to 9 Minutes | 2,382 | 23.0% |
| 10 to 14 Minutes | 1,814 | 17.5% |
| 15 to 19 Minutes | 1,519 | 14.7% |
| 20 to 24 Minutes | 1,118 | 10.8% |
| 25 to 29 Minutes | 453 | 4.4% |
| 30 to 34 Minutes | 848 | 8.2% |
| 35 to 39 Minutes | 275 | 2.7% |
| 40 to 44 Minutes | 195 | 1.9% |
| 45 to 59 Minutes | 436 | 4.2% |
| 60 to 89 Minutes | 310 | 3.0% |
| 90 or more Minutes | 232 | 2.2% |
Commute Time by Sex in Bolivar County
The most common commute times in Bolivar County are 5 to 9 minutes (1,266 commuters, 24.9%) for males and 5 to 9 minutes (1,116 commuters, 21.1%) for females.
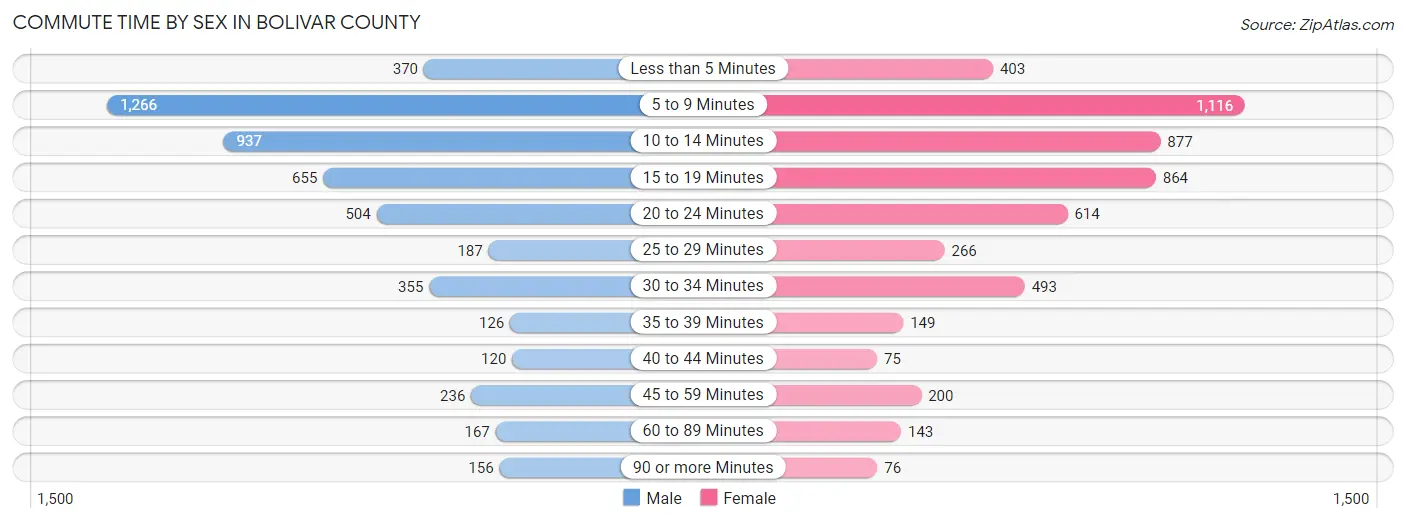
| Commute Time | Male | Female |
| Less than 5 Minutes | 370 (7.3%) | 403 (7.6%) |
| 5 to 9 Minutes | 1,266 (24.9%) | 1,116 (21.1%) |
| 10 to 14 Minutes | 937 (18.4%) | 877 (16.6%) |
| 15 to 19 Minutes | 655 (12.9%) | 864 (16.4%) |
| 20 to 24 Minutes | 504 (9.9%) | 614 (11.6%) |
| 25 to 29 Minutes | 187 (3.7%) | 266 (5.0%) |
| 30 to 34 Minutes | 355 (7.0%) | 493 (9.3%) |
| 35 to 39 Minutes | 126 (2.5%) | 149 (2.8%) |
| 40 to 44 Minutes | 120 (2.4%) | 75 (1.4%) |
| 45 to 59 Minutes | 236 (4.6%) | 200 (3.8%) |
| 60 to 89 Minutes | 167 (3.3%) | 143 (2.7%) |
| 90 or more Minutes | 156 (3.1%) | 76 (1.4%) |
Time of Departure to Work by Sex in Bolivar County
The most frequent times of departure to work in Bolivar County are 6:30 AM to 6:59 AM (1,078, 21.2%) for males and 7:00 AM to 7:29 AM (1,041, 19.7%) for females.
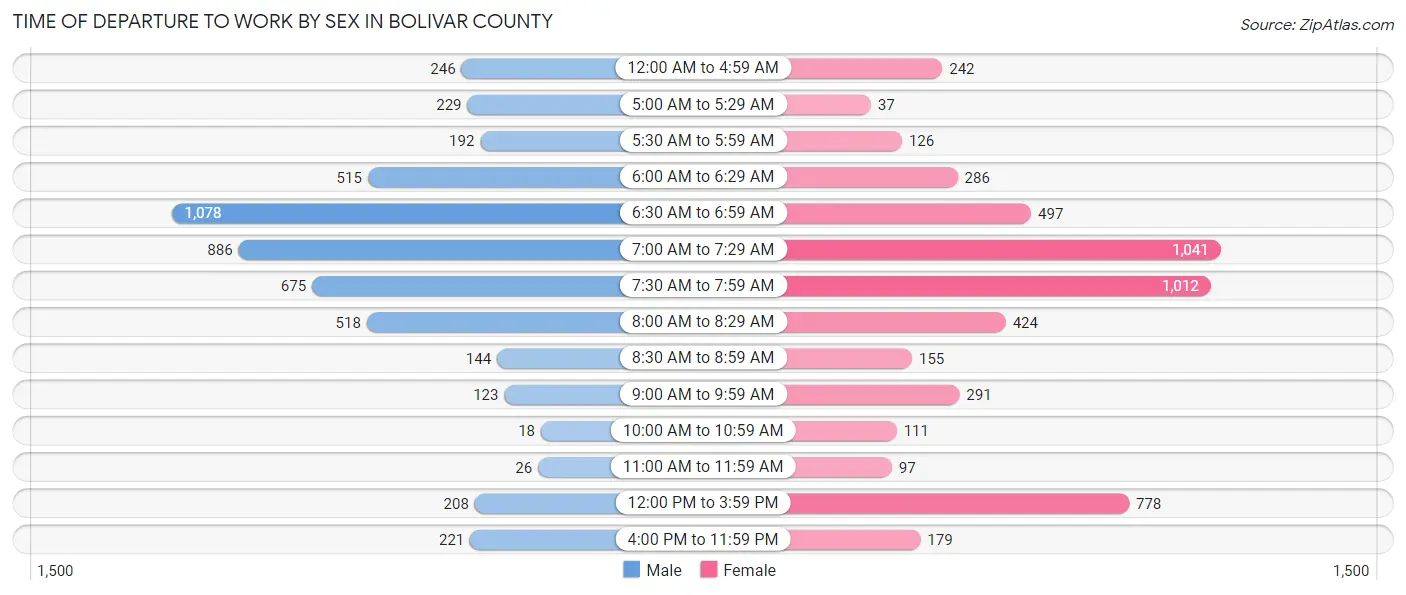
| Time of Departure | Male | Female |
| 12:00 AM to 4:59 AM | 246 (4.8%) | 242 (4.6%) |
| 5:00 AM to 5:29 AM | 229 (4.5%) | 37 (0.7%) |
| 5:30 AM to 5:59 AM | 192 (3.8%) | 126 (2.4%) |
| 6:00 AM to 6:29 AM | 515 (10.1%) | 286 (5.4%) |
| 6:30 AM to 6:59 AM | 1,078 (21.2%) | 497 (9.4%) |
| 7:00 AM to 7:29 AM | 886 (17.4%) | 1,041 (19.7%) |
| 7:30 AM to 7:59 AM | 675 (13.3%) | 1,012 (19.2%) |
| 8:00 AM to 8:29 AM | 518 (10.2%) | 424 (8.0%) |
| 8:30 AM to 8:59 AM | 144 (2.8%) | 155 (2.9%) |
| 9:00 AM to 9:59 AM | 123 (2.4%) | 291 (5.5%) |
| 10:00 AM to 10:59 AM | 18 (0.4%) | 111 (2.1%) |
| 11:00 AM to 11:59 AM | 26 (0.5%) | 97 (1.8%) |
| 12:00 PM to 3:59 PM | 208 (4.1%) | 778 (14.7%) |
| 4:00 PM to 11:59 PM | 221 (4.3%) | 179 (3.4%) |
| Total | 5,079 (100.0%) | 5,276 (100.0%) |
Housing Occupancy in Bolivar County
Occupancy by Ownership in Bolivar County
Of the total 11,704 dwellings in Bolivar County, owner-occupied units account for 6,976 (59.6%), while renter-occupied units make up 4,728 (40.4%).
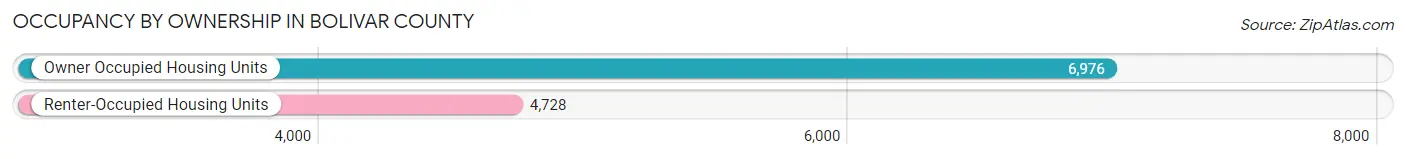
| Occupancy | # Housing Units | % Housing Units |
| Owner Occupied Housing Units | 6,976 | 59.6% |
| Renter-Occupied Housing Units | 4,728 | 40.4% |
| Total Occupied Housing Units | 11,704 | 100.0% |
Occupancy by Household Size in Bolivar County
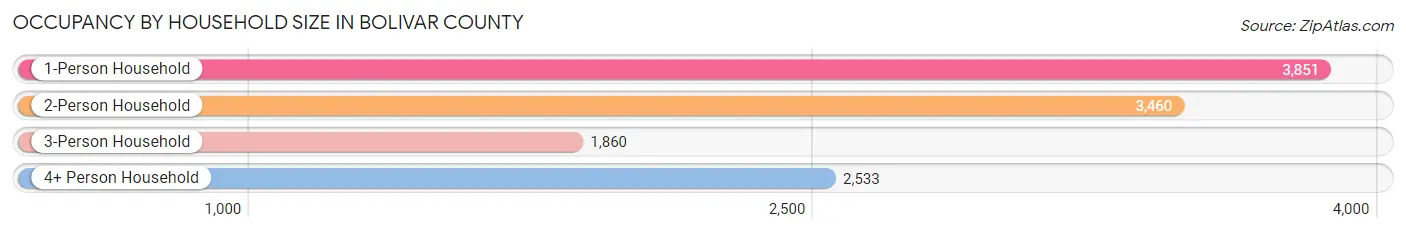
| Household Size | # Housing Units | % Housing Units |
| 1-Person Household | 3,851 | 32.9% |
| 2-Person Household | 3,460 | 29.6% |
| 3-Person Household | 1,860 | 15.9% |
| 4+ Person Household | 2,533 | 21.6% |
| Total Housing Units | 11,704 | 100.0% |
Occupancy by Ownership by Household Size in Bolivar County
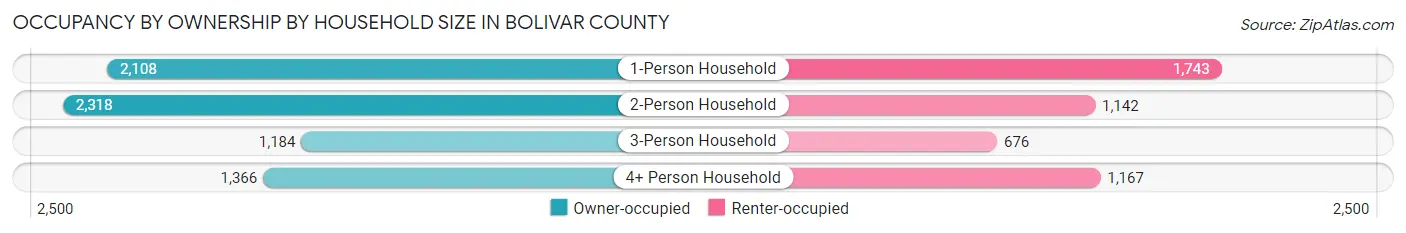
| Household Size | Owner-occupied | Renter-occupied |
| 1-Person Household | 2,108 (54.7%) | 1,743 (45.3%) |
| 2-Person Household | 2,318 (67.0%) | 1,142 (33.0%) |
| 3-Person Household | 1,184 (63.7%) | 676 (36.3%) |
| 4+ Person Household | 1,366 (53.9%) | 1,167 (46.1%) |
| Total Housing Units | 6,976 (59.6%) | 4,728 (40.4%) |
Occupancy by Educational Attainment in Bolivar County
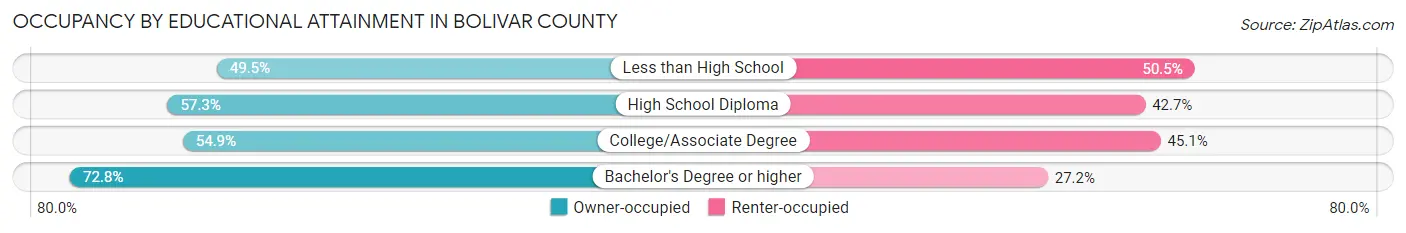
| Household Size | Owner-occupied | Renter-occupied |
| Less than High School | 960 (49.5%) | 979 (50.5%) |
| High School Diploma | 1,357 (57.3%) | 1,010 (42.7%) |
| College/Associate Degree | 2,226 (54.9%) | 1,829 (45.1%) |
| Bachelor's Degree or higher | 2,433 (72.8%) | 910 (27.2%) |
Occupancy by Age of Householder in Bolivar County
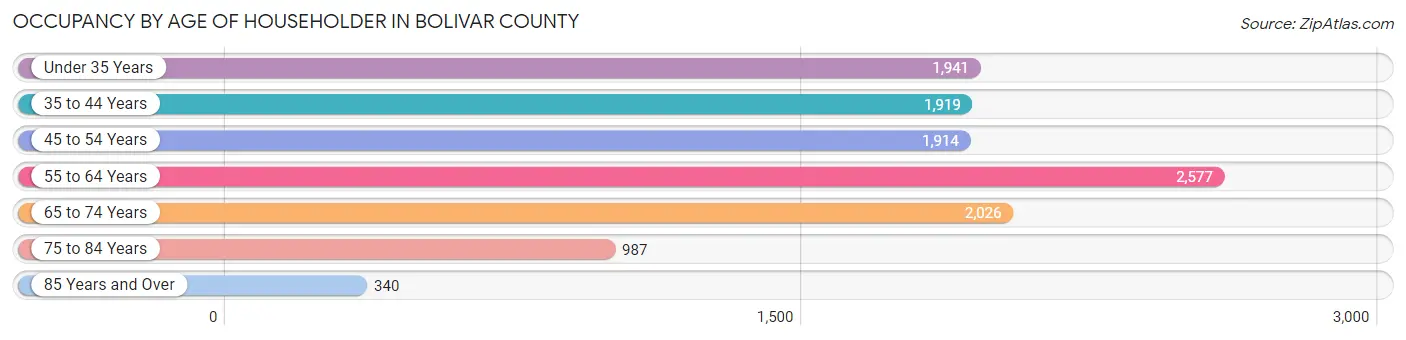
| Age Bracket | # Households | % Households |
| Under 35 Years | 1,941 | 16.6% |
| 35 to 44 Years | 1,919 | 16.4% |
| 45 to 54 Years | 1,914 | 16.4% |
| 55 to 64 Years | 2,577 | 22.0% |
| 65 to 74 Years | 2,026 | 17.3% |
| 75 to 84 Years | 987 | 8.4% |
| 85 Years and Over | 340 | 2.9% |
| Total | 11,704 | 100.0% |
Housing Finances in Bolivar County
Median Income by Occupancy in Bolivar County
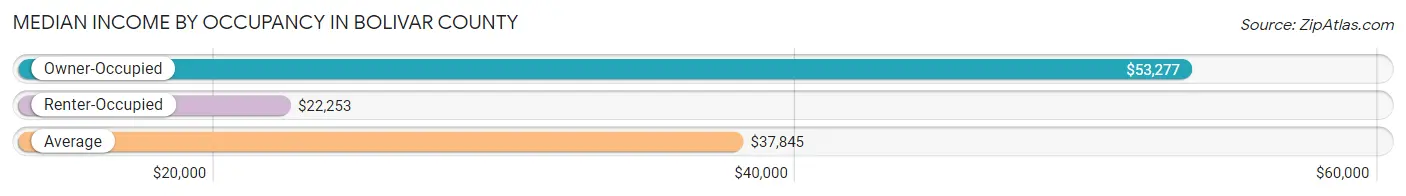
| Occupancy Type | # Households | Median Income |
| Owner-Occupied | 6,976 (59.6%) | $53,277 |
| Renter-Occupied | 4,728 (40.4%) | $22,253 |
| Average | 11,704 (100.0%) | $37,845 |
Occupancy by Householder Income Bracket in Bolivar County
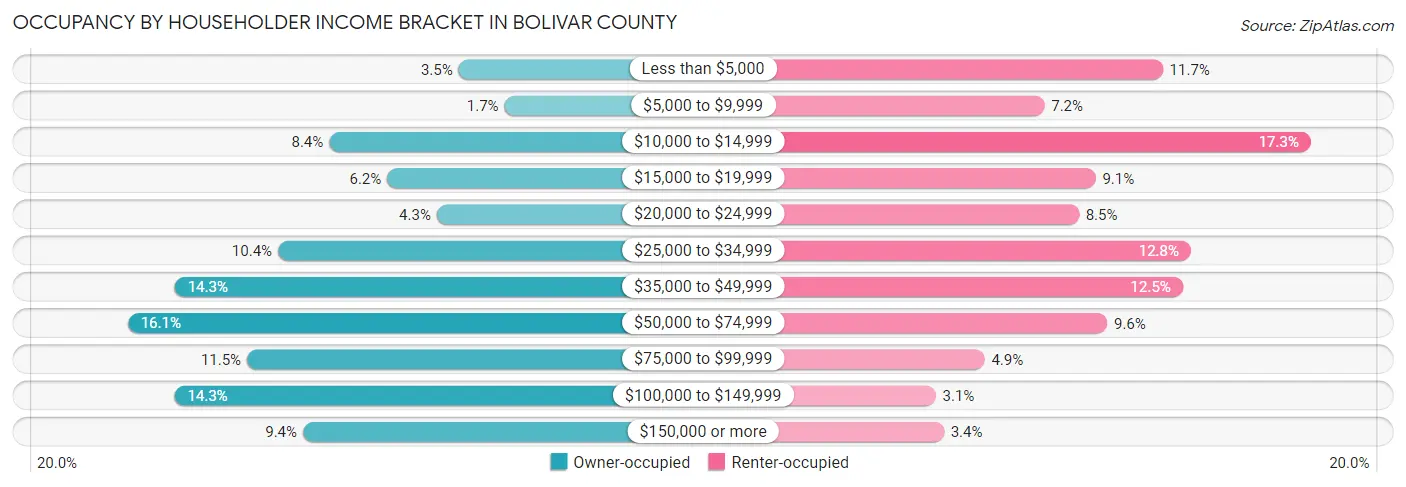
| Income Bracket | Owner-occupied | Renter-occupied |
| Less than $5,000 | 242 (3.5%) | 553 (11.7%) |
| $5,000 to $9,999 | 120 (1.7%) | 340 (7.2%) |
| $10,000 to $14,999 | 586 (8.4%) | 820 (17.3%) |
| $15,000 to $19,999 | 432 (6.2%) | 432 (9.1%) |
| $20,000 to $24,999 | 300 (4.3%) | 402 (8.5%) |
| $25,000 to $34,999 | 722 (10.3%) | 604 (12.8%) |
| $35,000 to $49,999 | 996 (14.3%) | 589 (12.5%) |
| $50,000 to $74,999 | 1,121 (16.1%) | 453 (9.6%) |
| $75,000 to $99,999 | 804 (11.5%) | 232 (4.9%) |
| $100,000 to $149,999 | 997 (14.3%) | 144 (3.0%) |
| $150,000 or more | 656 (9.4%) | 159 (3.4%) |
| Total | 6,976 (100.0%) | 4,728 (100.0%) |
Monthly Housing Cost Tiers in Bolivar County
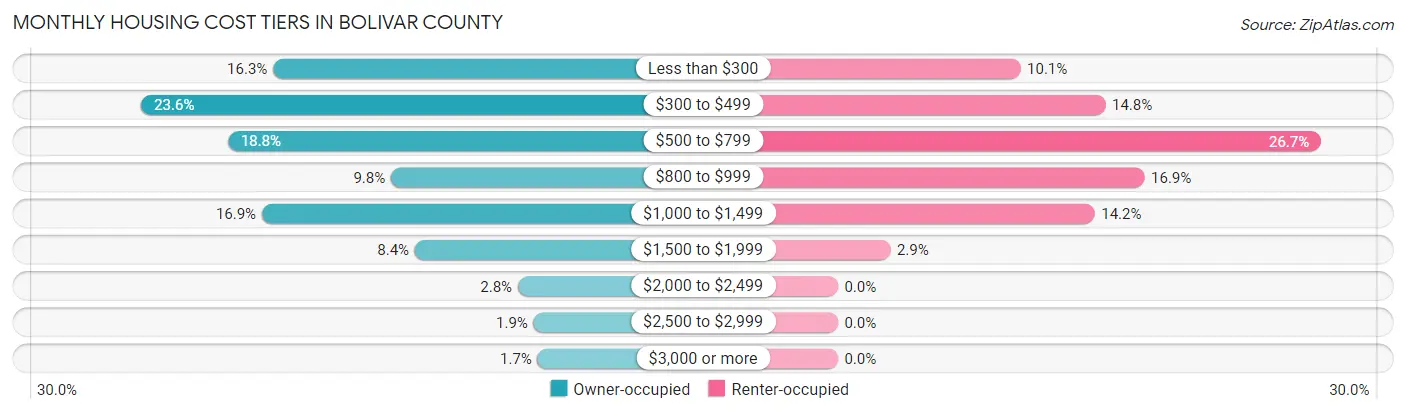
| Monthly Cost | Owner-occupied | Renter-occupied |
| Less than $300 | 1,135 (16.3%) | 477 (10.1%) |
| $300 to $499 | 1,644 (23.6%) | 699 (14.8%) |
| $500 to $799 | 1,310 (18.8%) | 1,263 (26.7%) |
| $800 to $999 | 681 (9.8%) | 801 (16.9%) |
| $1,000 to $1,499 | 1,178 (16.9%) | 671 (14.2%) |
| $1,500 to $1,999 | 589 (8.4%) | 137 (2.9%) |
| $2,000 to $2,499 | 192 (2.8%) | 0 (0.0%) |
| $2,500 to $2,999 | 131 (1.9%) | 0 (0.0%) |
| $3,000 or more | 116 (1.7%) | 0 (0.0%) |
| Total | 6,976 (100.0%) | 4,728 (100.0%) |
Physical Housing Characteristics in Bolivar County
Housing Structures in Bolivar County
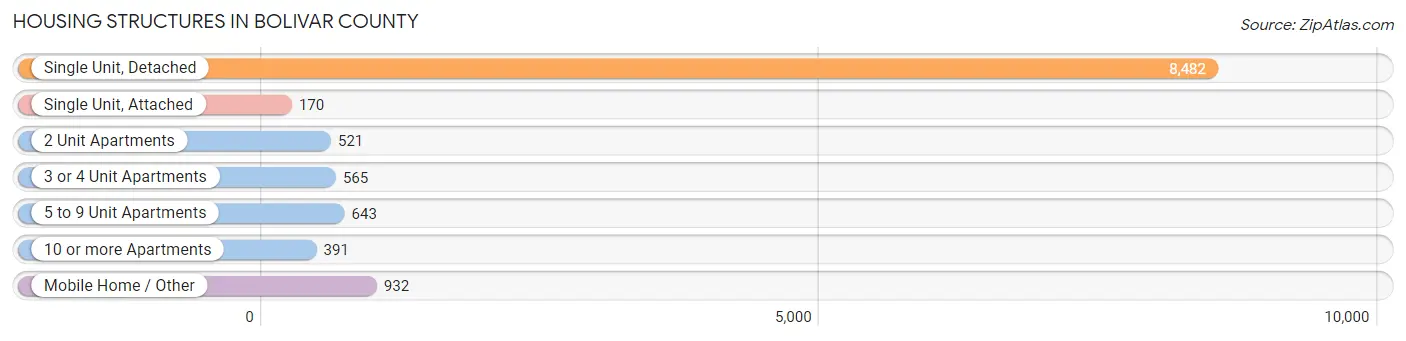
| Structure Type | # Housing Units | % Housing Units |
| Single Unit, Detached | 8,482 | 72.5% |
| Single Unit, Attached | 170 | 1.5% |
| 2 Unit Apartments | 521 | 4.4% |
| 3 or 4 Unit Apartments | 565 | 4.8% |
| 5 to 9 Unit Apartments | 643 | 5.5% |
| 10 or more Apartments | 391 | 3.3% |
| Mobile Home / Other | 932 | 8.0% |
| Total | 11,704 | 100.0% |
Housing Structures by Occupancy in Bolivar County
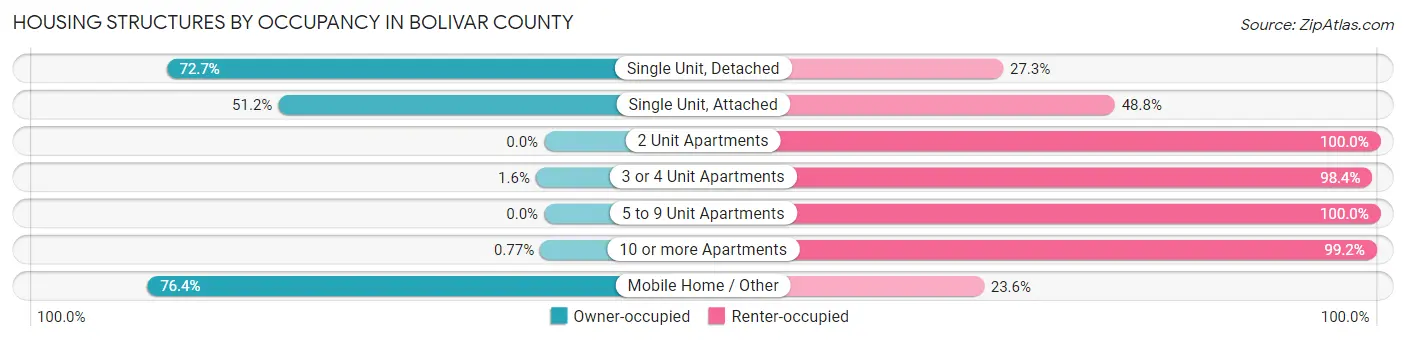
| Structure Type | Owner-occupied | Renter-occupied |
| Single Unit, Detached | 6,165 (72.7%) | 2,317 (27.3%) |
| Single Unit, Attached | 87 (51.2%) | 83 (48.8%) |
| 2 Unit Apartments | 0 (0.0%) | 521 (100.0%) |
| 3 or 4 Unit Apartments | 9 (1.6%) | 556 (98.4%) |
| 5 to 9 Unit Apartments | 0 (0.0%) | 643 (100.0%) |
| 10 or more Apartments | 3 (0.8%) | 388 (99.2%) |
| Mobile Home / Other | 712 (76.4%) | 220 (23.6%) |
| Total | 6,976 (59.6%) | 4,728 (40.4%) |
Housing Structures by Number of Rooms in Bolivar County
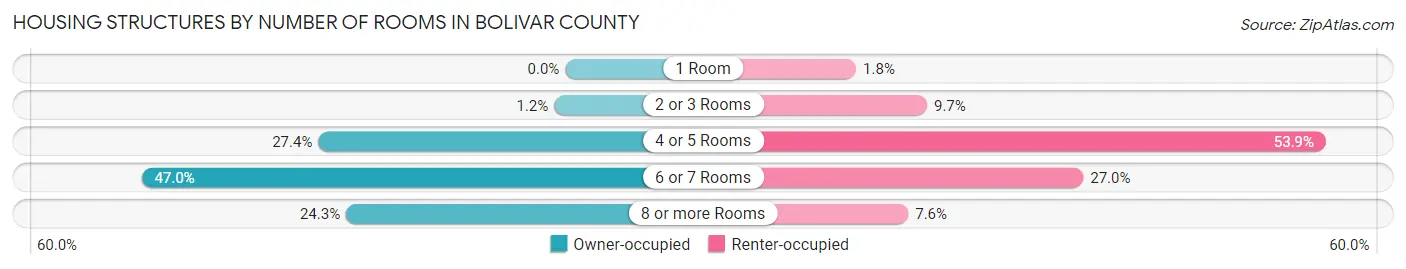
| Number of Rooms | Owner-occupied | Renter-occupied |
| 1 Room | 0 (0.0%) | 85 (1.8%) |
| 2 or 3 Rooms | 86 (1.2%) | 457 (9.7%) |
| 4 or 5 Rooms | 1,912 (27.4%) | 2,550 (53.9%) |
| 6 or 7 Rooms | 3,281 (47.0%) | 1,277 (27.0%) |
| 8 or more Rooms | 1,697 (24.3%) | 359 (7.6%) |
| Total | 6,976 (100.0%) | 4,728 (100.0%) |
Housing Structure by Heating Type in Bolivar County
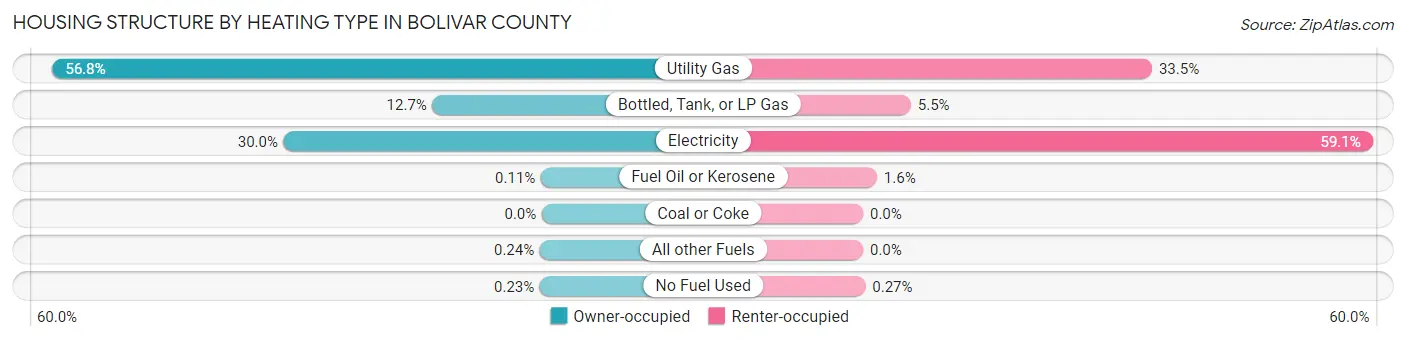
| Heating Type | Owner-occupied | Renter-occupied |
| Utility Gas | 3,961 (56.8%) | 1,584 (33.5%) |
| Bottled, Tank, or LP Gas | 885 (12.7%) | 262 (5.5%) |
| Electricity | 2,089 (29.9%) | 2,793 (59.1%) |
| Fuel Oil or Kerosene | 8 (0.1%) | 76 (1.6%) |
| Coal or Coke | 0 (0.0%) | 0 (0.0%) |
| All other Fuels | 17 (0.2%) | 0 (0.0%) |
| No Fuel Used | 16 (0.2%) | 13 (0.3%) |
| Total | 6,976 (100.0%) | 4,728 (100.0%) |
Household Vehicle Usage in Bolivar County
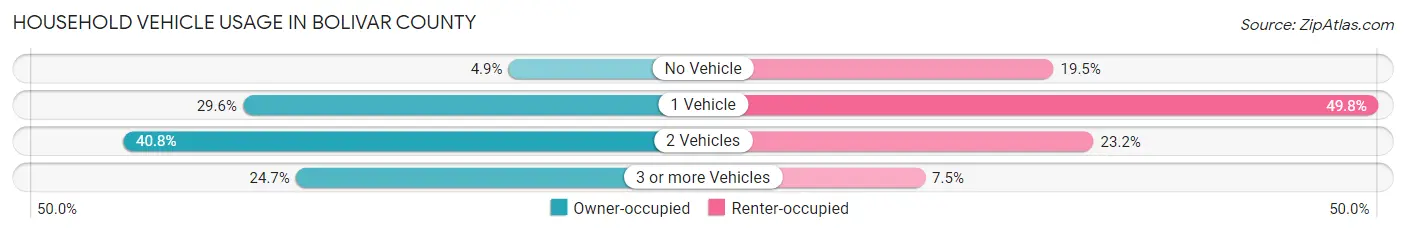
| Vehicles per Household | Owner-occupied | Renter-occupied |
| No Vehicle | 338 (4.9%) | 921 (19.5%) |
| 1 Vehicle | 2,068 (29.6%) | 2,355 (49.8%) |
| 2 Vehicles | 2,847 (40.8%) | 1,098 (23.2%) |
| 3 or more Vehicles | 1,723 (24.7%) | 354 (7.5%) |
| Total | 6,976 (100.0%) | 4,728 (100.0%) |
Real Estate & Mortgages in Bolivar County
Real Estate and Mortgage Overview in Bolivar County
| Characteristic | Without Mortgage | With Mortgage |
| Housing Units | 3,957 | 3,019 |
| Median Property Value | $94,300 | $159,300 |
| Median Household Income | $39,652 | $385 |
| Monthly Housing Costs | $425 | $116 |
| Real Estate Taxes | $617 | $317 |
Property Value by Mortgage Status in Bolivar County
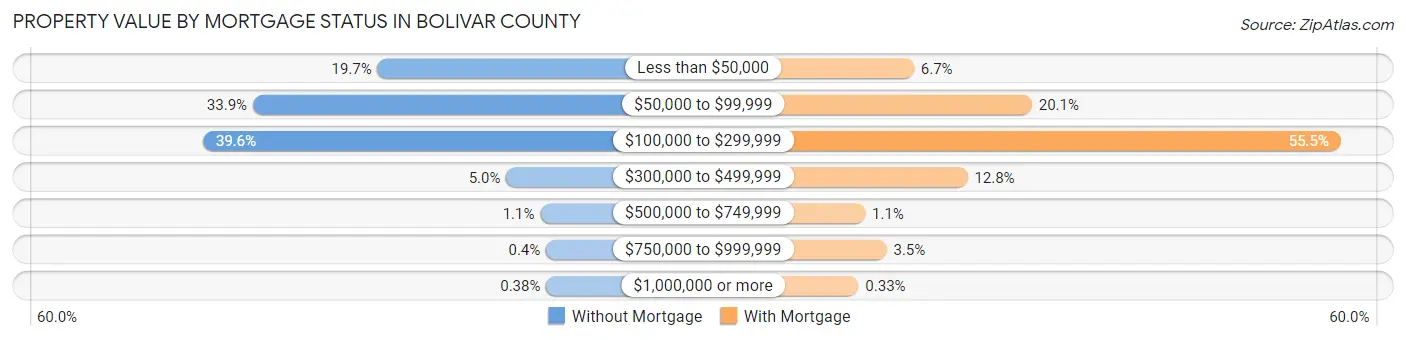
| Property Value | Without Mortgage | With Mortgage |
| Less than $50,000 | 778 (19.7%) | 201 (6.7%) |
| $50,000 to $99,999 | 1,342 (33.9%) | 608 (20.1%) |
| $100,000 to $299,999 | 1,568 (39.6%) | 1,674 (55.4%) |
| $300,000 to $499,999 | 196 (5.0%) | 386 (12.8%) |
| $500,000 to $749,999 | 42 (1.1%) | 33 (1.1%) |
| $750,000 to $999,999 | 16 (0.4%) | 107 (3.5%) |
| $1,000,000 or more | 15 (0.4%) | 10 (0.3%) |
| Total | 3,957 (100.0%) | 3,019 (100.0%) |
Household Income by Mortgage Status in Bolivar County
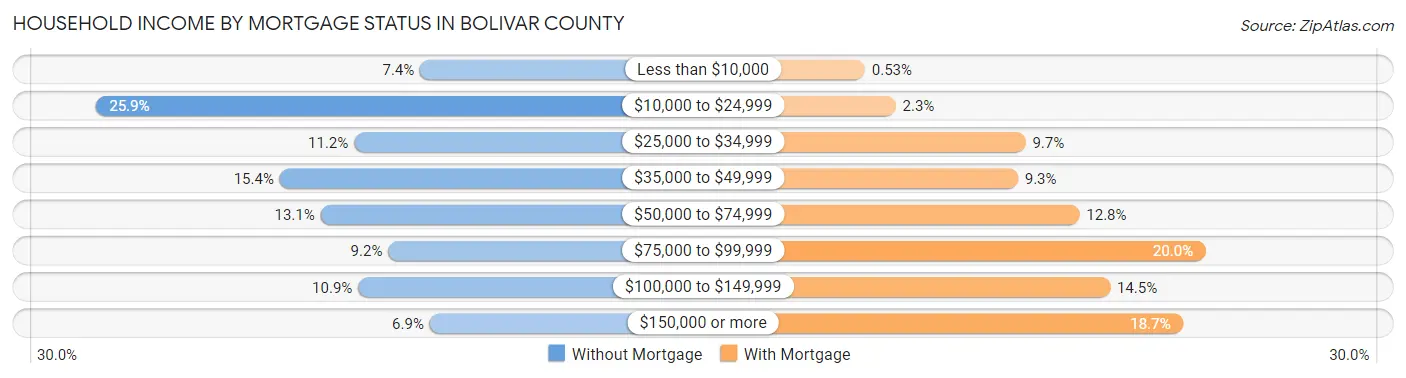
| Household Income | Without Mortgage | With Mortgage |
| Less than $10,000 | 293 (7.4%) | 16 (0.5%) |
| $10,000 to $24,999 | 1,025 (25.9%) | 69 (2.3%) |
| $25,000 to $34,999 | 442 (11.2%) | 293 (9.7%) |
| $35,000 to $49,999 | 610 (15.4%) | 280 (9.3%) |
| $50,000 to $74,999 | 518 (13.1%) | 386 (12.8%) |
| $75,000 to $99,999 | 365 (9.2%) | 603 (20.0%) |
| $100,000 to $149,999 | 433 (10.9%) | 439 (14.5%) |
| $150,000 or more | 271 (6.9%) | 564 (18.7%) |
| Total | 3,957 (100.0%) | 3,019 (100.0%) |
Property Value to Household Income Ratio in Bolivar County
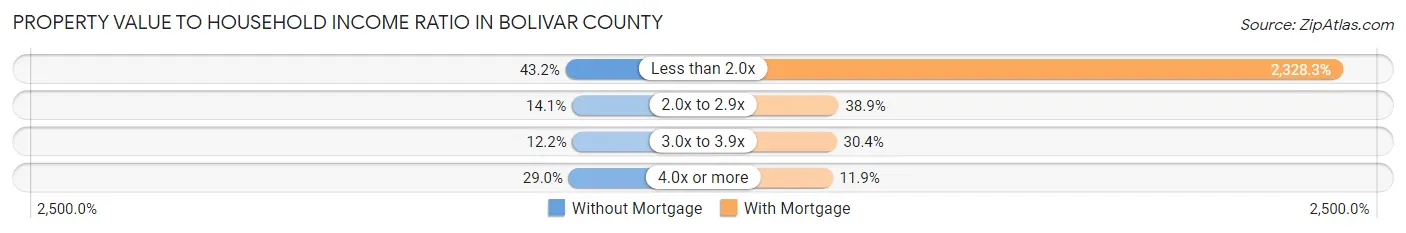
| Value-to-Income Ratio | Without Mortgage | With Mortgage |
| Less than 2.0x | 1,709 (43.2%) | 70,291 (2,328.3%) |
| 2.0x to 2.9x | 558 (14.1%) | 1,174 (38.9%) |
| 3.0x to 3.9x | 483 (12.2%) | 919 (30.4%) |
| 4.0x or more | 1,147 (29.0%) | 358 (11.9%) |
| Total | 3,957 (100.0%) | 3,019 (100.0%) |
Real Estate Taxes by Mortgage Status in Bolivar County
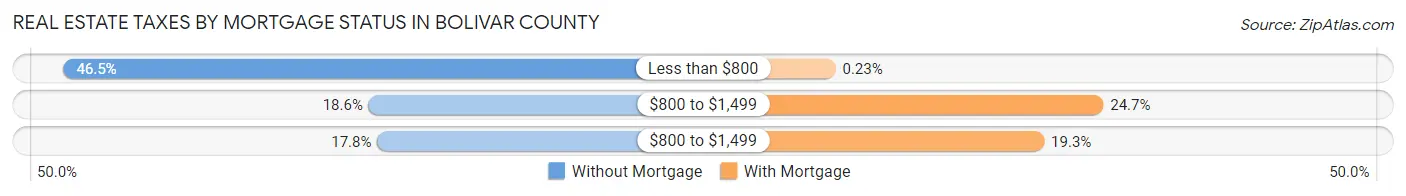
| Property Taxes | Without Mortgage | With Mortgage |
| Less than $800 | 1,838 (46.5%) | 7 (0.2%) |
| $800 to $1,499 | 735 (18.6%) | 745 (24.7%) |
| $800 to $1,499 | 704 (17.8%) | 582 (19.3%) |
| Total | 3,957 (100.0%) | 3,019 (100.0%) |
Health & Disability in Bolivar County
Health Insurance Coverage by Age in Bolivar County
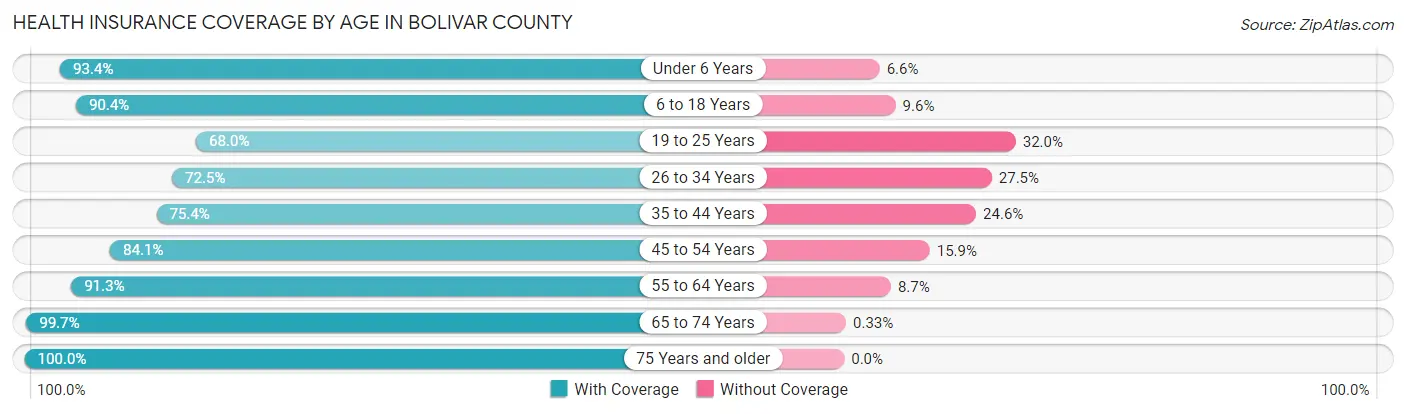
| Age Bracket | With Coverage | Without Coverage |
| Under 6 Years | 2,080 (93.4%) | 147 (6.6%) |
| 6 to 18 Years | 5,250 (90.4%) | 556 (9.6%) |
| 19 to 25 Years | 2,059 (68.0%) | 968 (32.0%) |
| 26 to 34 Years | 2,534 (72.5%) | 962 (27.5%) |
| 35 to 44 Years | 2,610 (75.4%) | 851 (24.6%) |
| 45 to 54 Years | 2,779 (84.1%) | 527 (15.9%) |
| 55 to 64 Years | 3,474 (91.3%) | 331 (8.7%) |
| 65 to 74 Years | 3,002 (99.7%) | 10 (0.3%) |
| 75 Years and older | 1,740 (100.0%) | 0 (0.0%) |
| Total | 25,528 (85.4%) | 4,352 (14.6%) |
Health Insurance Coverage by Citizenship Status in Bolivar County
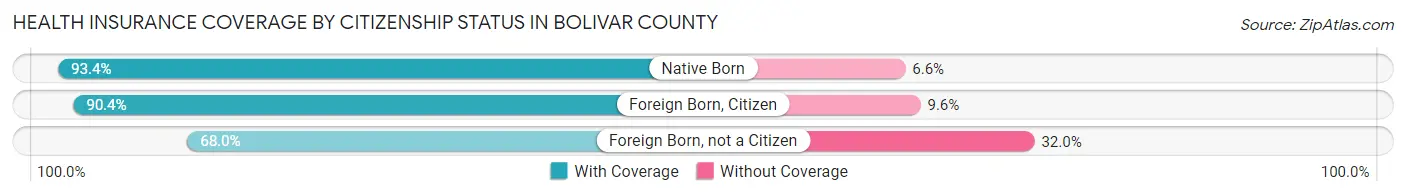
| Citizenship Status | With Coverage | Without Coverage |
| Native Born | 2,080 (93.4%) | 147 (6.6%) |
| Foreign Born, Citizen | 5,250 (90.4%) | 556 (9.6%) |
| Foreign Born, not a Citizen | 2,059 (68.0%) | 968 (32.0%) |
Health Insurance Coverage by Household Income in Bolivar County
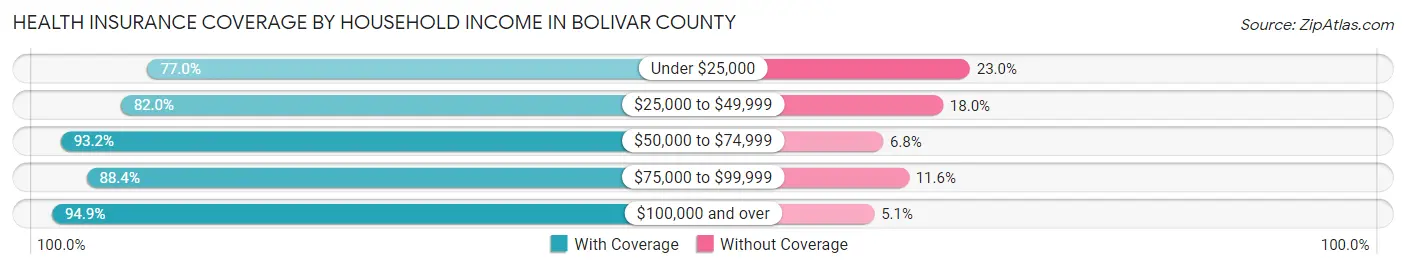
| Household Income | With Coverage | Without Coverage |
| Under $25,000 | 6,849 (77.0%) | 2,051 (23.0%) |
| $25,000 to $49,999 | 6,061 (82.0%) | 1,331 (18.0%) |
| $50,000 to $74,999 | 4,050 (93.2%) | 294 (6.8%) |
| $75,000 to $99,999 | 2,667 (88.4%) | 350 (11.6%) |
| $100,000 and over | 5,135 (94.9%) | 278 (5.1%) |
Public vs Private Health Insurance Coverage by Age in Bolivar County
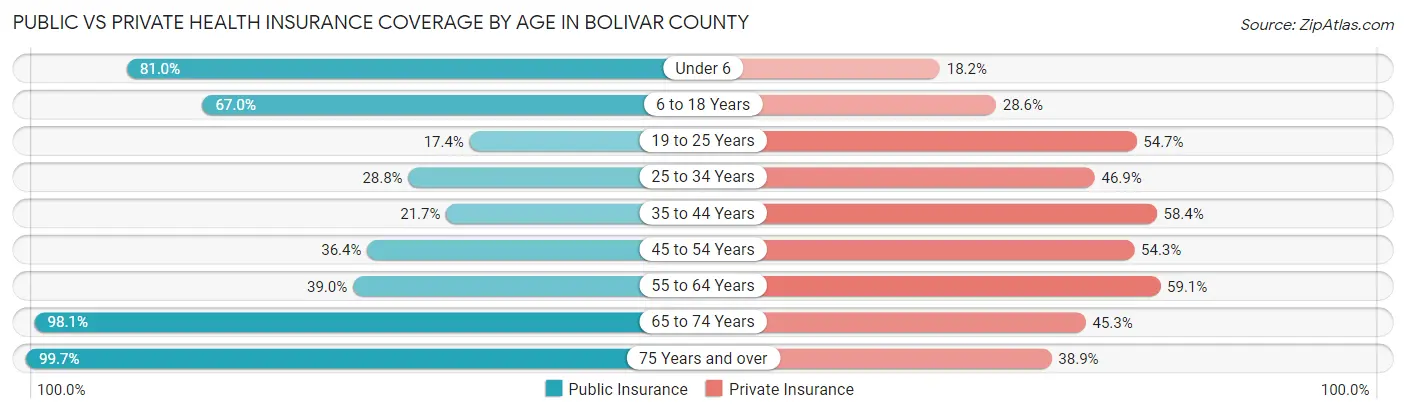
| Age Bracket | Public Insurance | Private Insurance |
| Under 6 | 1,804 (81.0%) | 405 (18.2%) |
| 6 to 18 Years | 3,889 (67.0%) | 1,660 (28.6%) |
| 19 to 25 Years | 526 (17.4%) | 1,655 (54.7%) |
| 25 to 34 Years | 1,005 (28.7%) | 1,640 (46.9%) |
| 35 to 44 Years | 752 (21.7%) | 2,022 (58.4%) |
| 45 to 54 Years | 1,203 (36.4%) | 1,794 (54.3%) |
| 55 to 64 Years | 1,485 (39.0%) | 2,248 (59.1%) |
| 65 to 74 Years | 2,956 (98.1%) | 1,363 (45.3%) |
| 75 Years and over | 1,735 (99.7%) | 677 (38.9%) |
| Total | 15,355 (51.4%) | 13,464 (45.1%) |
Disability Status by Sex by Age in Bolivar County
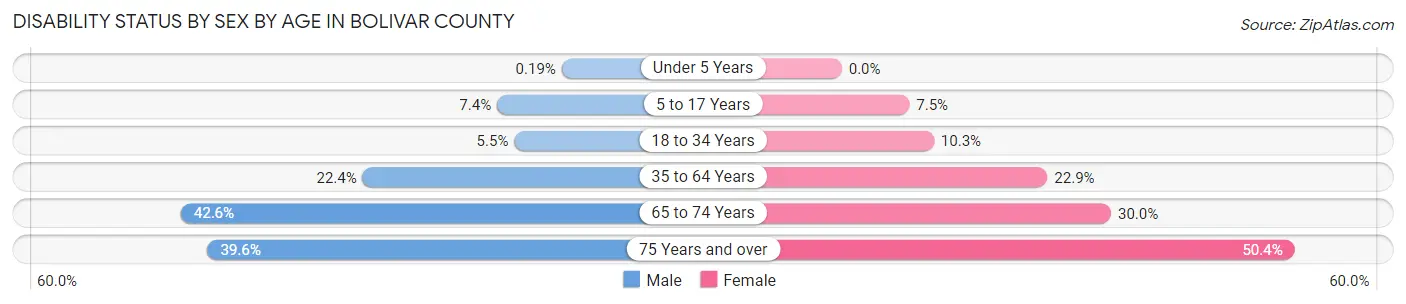
| Age Bracket | Male | Female |
| Under 5 Years | 2 (0.2%) | 0 (0.0%) |
| 5 to 17 Years | 204 (7.4%) | 209 (7.5%) |
| 18 to 34 Years | 185 (5.5%) | 375 (10.3%) |
| 35 to 64 Years | 1,070 (22.4%) | 1,325 (22.9%) |
| 65 to 74 Years | 523 (42.6%) | 535 (30.0%) |
| 75 Years and over | 254 (39.6%) | 554 (50.4%) |
Disability Class by Sex by Age in Bolivar County
Disability Class: Hearing Difficulty
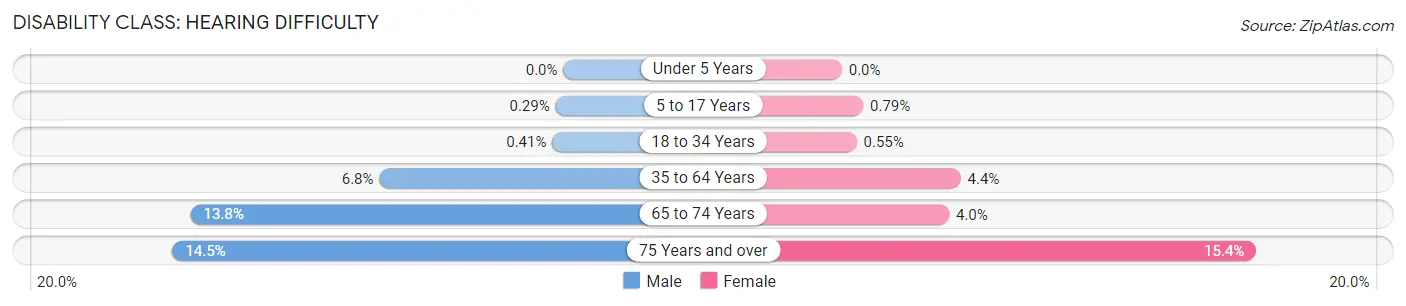
| Age Bracket | Male | Female |
| Under 5 Years | 0 (0.0%) | 0 (0.0%) |
| 5 to 17 Years | 8 (0.3%) | 22 (0.8%) |
| 18 to 34 Years | 14 (0.4%) | 20 (0.5%) |
| 35 to 64 Years | 327 (6.8%) | 255 (4.4%) |
| 65 to 74 Years | 170 (13.8%) | 71 (4.0%) |
| 75 Years and over | 93 (14.5%) | 169 (15.4%) |
Disability Class: Vision Difficulty
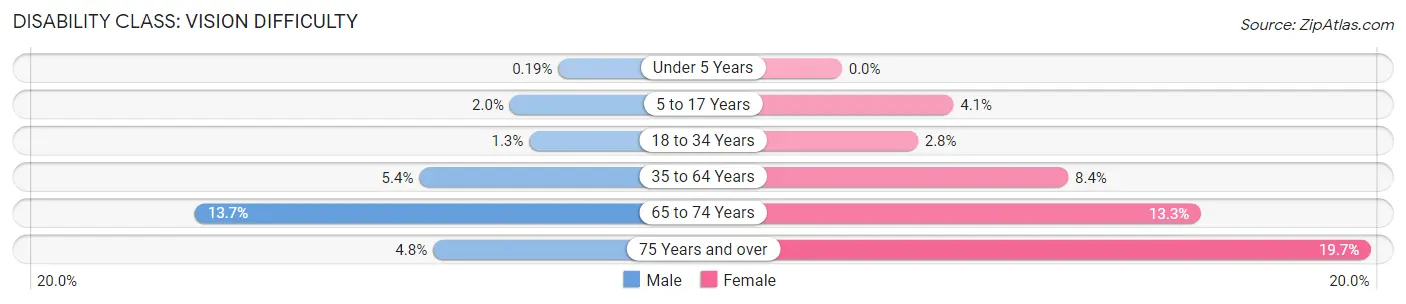
| Age Bracket | Male | Female |
| Under 5 Years | 2 (0.2%) | 0 (0.0%) |
| 5 to 17 Years | 55 (2.0%) | 115 (4.1%) |
| 18 to 34 Years | 43 (1.3%) | 103 (2.8%) |
| 35 to 64 Years | 256 (5.3%) | 486 (8.4%) |
| 65 to 74 Years | 168 (13.7%) | 238 (13.3%) |
| 75 Years and over | 31 (4.8%) | 216 (19.7%) |
Disability Class: Cognitive Difficulty
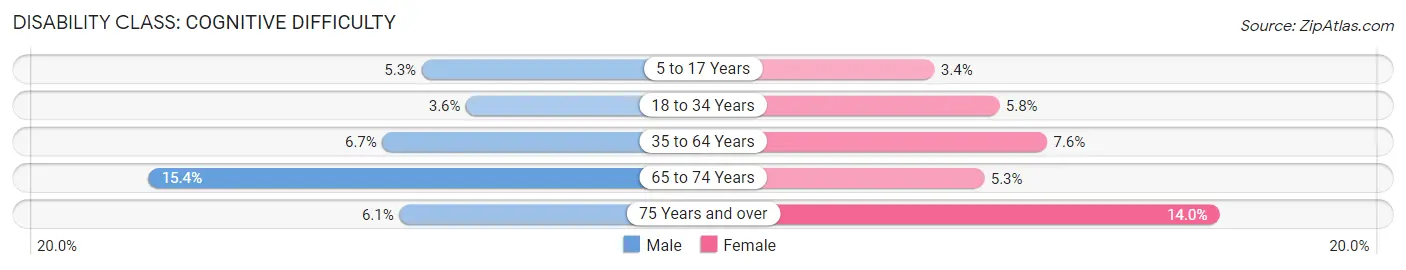
| Age Bracket | Male | Female |
| 5 to 17 Years | 145 (5.2%) | 95 (3.4%) |
| 18 to 34 Years | 122 (3.6%) | 213 (5.8%) |
| 35 to 64 Years | 321 (6.7%) | 440 (7.6%) |
| 65 to 74 Years | 189 (15.4%) | 94 (5.3%) |
| 75 Years and over | 39 (6.1%) | 154 (14.0%) |
Disability Class: Ambulatory Difficulty
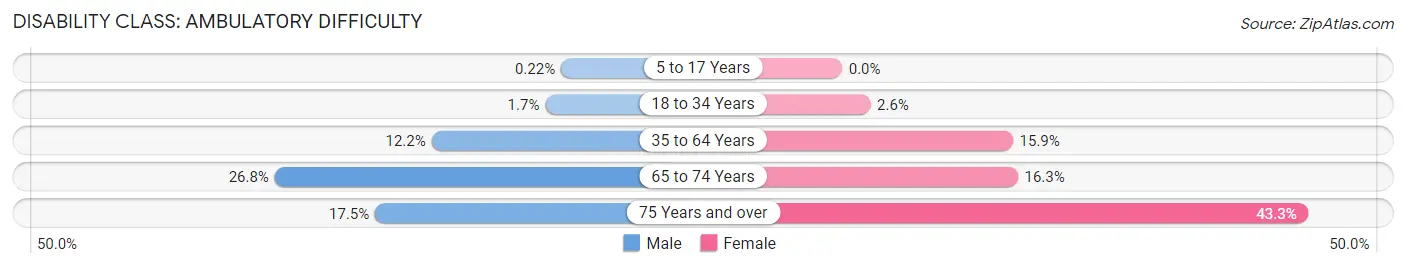
| Age Bracket | Male | Female |
| 5 to 17 Years | 6 (0.2%) | 0 (0.0%) |
| 18 to 34 Years | 57 (1.7%) | 96 (2.6%) |
| 35 to 64 Years | 585 (12.2%) | 917 (15.9%) |
| 65 to 74 Years | 329 (26.8%) | 291 (16.3%) |
| 75 Years and over | 112 (17.5%) | 476 (43.3%) |
Disability Class: Self-Care Difficulty
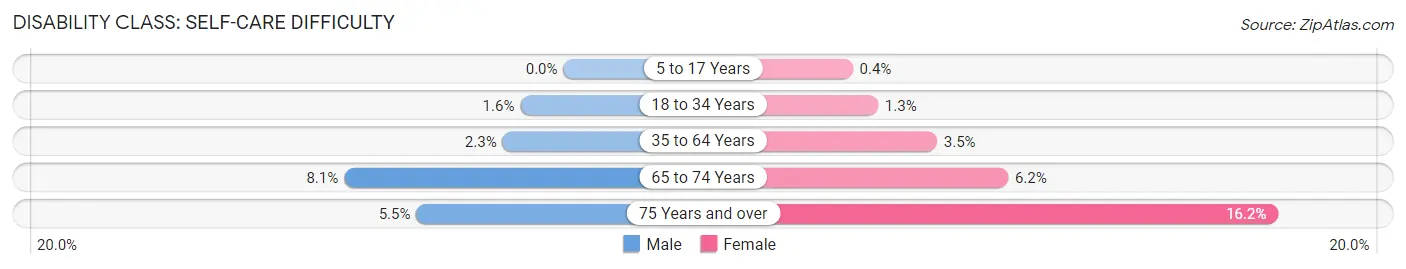
| Age Bracket | Male | Female |
| 5 to 17 Years | 0 (0.0%) | 11 (0.4%) |
| 18 to 34 Years | 54 (1.6%) | 49 (1.3%) |
| 35 to 64 Years | 108 (2.3%) | 204 (3.5%) |
| 65 to 74 Years | 100 (8.1%) | 110 (6.2%) |
| 75 Years and over | 35 (5.5%) | 178 (16.2%) |
Technology Access in Bolivar County
Computing Device Access in Bolivar County
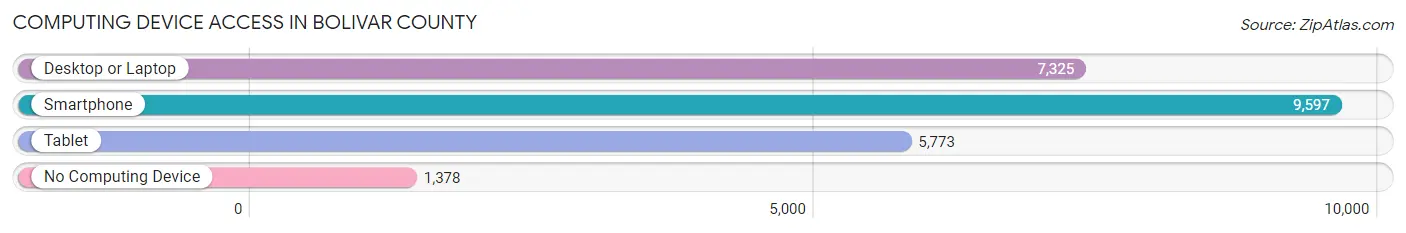
| Device Type | # Households | % Households |
| Desktop or Laptop | 7,325 | 62.6% |
| Smartphone | 9,597 | 82.0% |
| Tablet | 5,773 | 49.3% |
| No Computing Device | 1,378 | 11.8% |
| Total | 11,704 | 100.0% |
Internet Access in Bolivar County
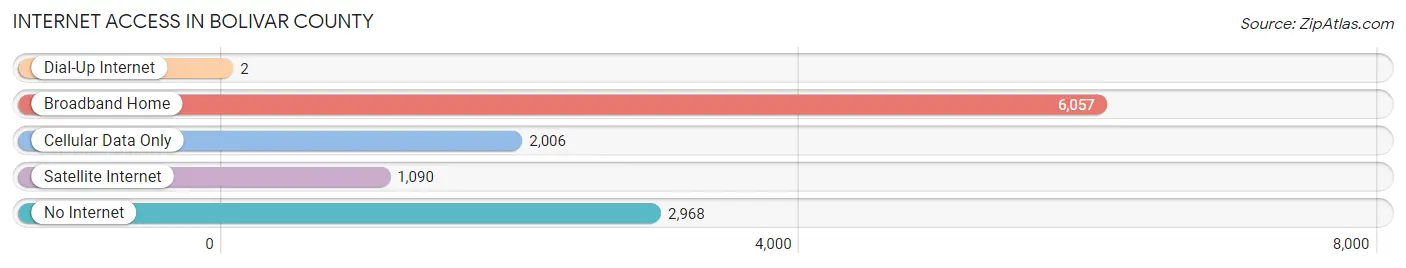
| Internet Type | # Households | % Households |
| Dial-Up Internet | 2 | 0.0% |
| Broadband Home | 6,057 | 51.7% |
| Cellular Data Only | 2,006 | 17.1% |
| Satellite Internet | 1,090 | 9.3% |
| No Internet | 2,968 | 25.4% |
| Total | 11,704 | 100.0% |
Bolivar County Summary
Bolivar County is located in the Mississippi Delta region of the United States. It is bordered by the Mississippi River to the west, the Yazoo River to the east, and the Sunflower River to the south. The county seat is Cleveland, and the largest city is Rosedale. As of the 2010 census, the population was 34,145, making it the fourth-most populous county in Mississippi.
History
Bolivar County was established in 1836 and named for Simón Bolívar, a Venezuelan military and political leader who led the struggle for independence in much of South America. The county was formed from portions of Washington, Issaquena, and Sharkey counties.
The county was developed for cotton plantations, and the labor force was composed of enslaved African Americans. After the Civil War, many freedmen worked as sharecroppers and tenant farmers.
Geography
Bolivar County is located in the Mississippi Delta region of the United States. It is bordered by the Mississippi River to the west, the Yazoo River to the east, and the Sunflower River to the south. The county has a total area of 876 square miles, of which 864 square miles is land and 12 square miles (1.4%) is water.
The terrain of Bolivar County is mostly flat, with some rolling hills in the northern part of the county. The soil is mostly sandy loam, with some clay in the northern part of the county.
Economy
Agriculture is the main economic activity in Bolivar County. The county is one of the leading producers of cotton in the United States. Other crops grown in the county include corn, soybeans, rice, and wheat.
The county also has a thriving timber industry, with pine and hardwood trees being harvested for lumber and paper products.
Demographics
As of the 2010 census, there were 34,145 people, 11,945 households, and 8,541 families residing in the county. The population density was 39.4 people per square mile. There were 13,845 housing units at an average density of 15.9 per square mile.
The racial makeup of the county was 57.2% African American, 40.2% White, 0.3% Native American, 0.2% Asian, 0.1% Pacific Islander, 0.7% from other races, and 1.3% from two or more races. Hispanic or Latino of any race were 1.7% of the population.
The median income for a household in the county was $25,945, and the median income for a family was $31,945. Males had a median income of $30,945 versus $21,945 for females. The per capita income for the county was $13,945. About 24.2% of families and 28.2% of the population were below the poverty line, including 39.2% of those under age 18 and 22.2% of those age 65 or over.
Common Questions
What is the Total Population of Bolivar County?
Total Population of Bolivar County is 30,688.
What is the Total Male Population of Bolivar County?
Total Male Population of Bolivar County is 14,462.
What is the Total Female Population of Bolivar County?
Total Female Population of Bolivar County is 16,226.
What is the Ratio of Males per 100 Females in Bolivar County?
There are 89.13 Males per 100 Females in Bolivar County.
What is the Ratio of Females per 100 Males in Bolivar County?
There are 112.20 Females per 100 Males in Bolivar County.
What is the Median Population Age in Bolivar County?
Median Population Age in Bolivar County is 36.6 Years.
What is the Average Family Size in Bolivar County
Average Family Size in Bolivar County is 3.1 People.
What is the Average Household Size in Bolivar County
Average Household Size in Bolivar County is 2.5 People.
What is Per Capita Income in Bolivar County?
Per Capita income in Bolivar County is $25,440.
What is the Median Family Income in Bolivar County?
Median Family Income in Bolivar County is $49,306.
What is the Median Household income in Bolivar County?
Median Household Income in Bolivar County is $37,845.
What is Income or Wage Gap in Bolivar County?
Income or Wage Gap in Bolivar County is 32.2%.
Women in Bolivar County earn 67.8 cents for every dollar earned by a man.
What is Family Income Deficit in Bolivar County?
Family Income Deficit in Bolivar County is $13,215.
Families that are below poverty line in Bolivar County earn $13,215 less on average than the poverty threshold level.
What is Inequality or Gini Index in Bolivar County?
Inequality or Gini Index in Bolivar County is 0.56.
How Large is the Labor Force in Bolivar County?
There are 11,921 People in the Labor Forcein in Bolivar County.
What is the Percentage of People in the Labor Force in Bolivar County?
49.7% of People are in the Labor Force in Bolivar County.
What is the Unemployment Rate in Bolivar County?
Unemployment Rate in Bolivar County is 7.4%.