Alcorn County, MS
Alcorn County Map
Alcorn County Overview
34,717
TOTAL POPULATION
16,911
MALE POPULATION
17,806
FEMALE POPULATION
94.97
MALES / 100 FEMALES
105.29
FEMALES / 100 MALES
40.1
MEDIAN AGE
3.0
AVG FAMILY SIZE
2.4
AVG HOUSEHOLD SIZE
$27,320
PER CAPITA INCOME
$60,382
AVG FAMILY INCOME
$47,716
AVG HOUSEHOLD INCOME
26.9%
WAGE / INCOME GAP [ % ]
73.1¢/ $1
WAGE / INCOME GAP [ $ ]
0.49
INEQUALITY / GINI INDEX
15,391
LABOR FORCE [ PEOPLE ]
55.2%
PERCENT IN LABOR FORCE
6.4%
UNEMPLOYMENT RATE
Alcorn County Area Codes
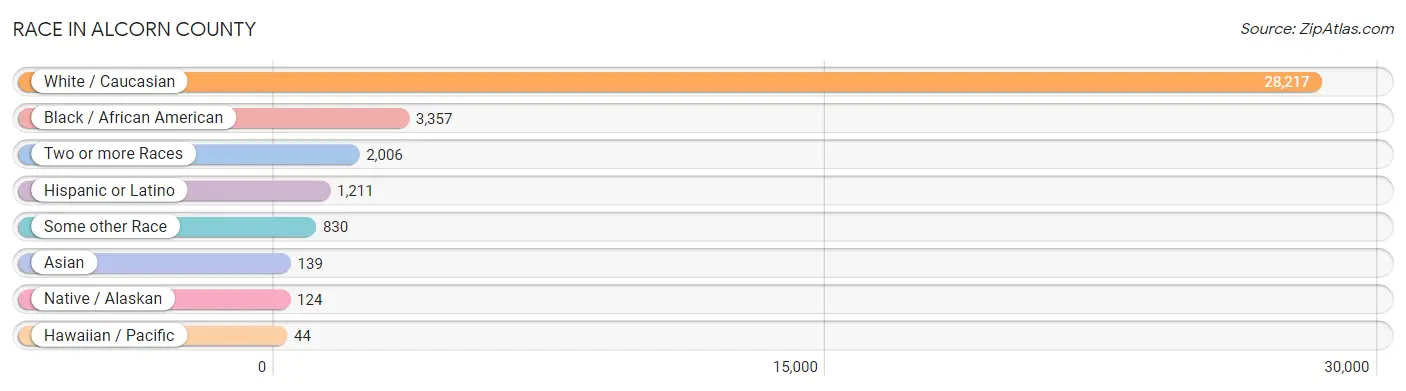
Race in Alcorn County
The most populous races in Alcorn County are White / Caucasian (28,217 | 81.3%), Black / African American (3,357 | 9.7%), and Two or more Races (2,006 | 5.8%).
| Race | # Population | % Population |
| Asian | 139 | 0.4% |
| Black / African American | 3,357 | 9.7% |
| Hawaiian / Pacific | 44 | 0.1% |
| Hispanic or Latino | 1,211 | 3.5% |
| Native / Alaskan | 124 | 0.4% |
| White / Caucasian | 28,217 | 81.3% |
| Two or more Races | 2,006 | 5.8% |
| Some other Race | 830 | 2.4% |
| Total | 34,717 | 100.0% |
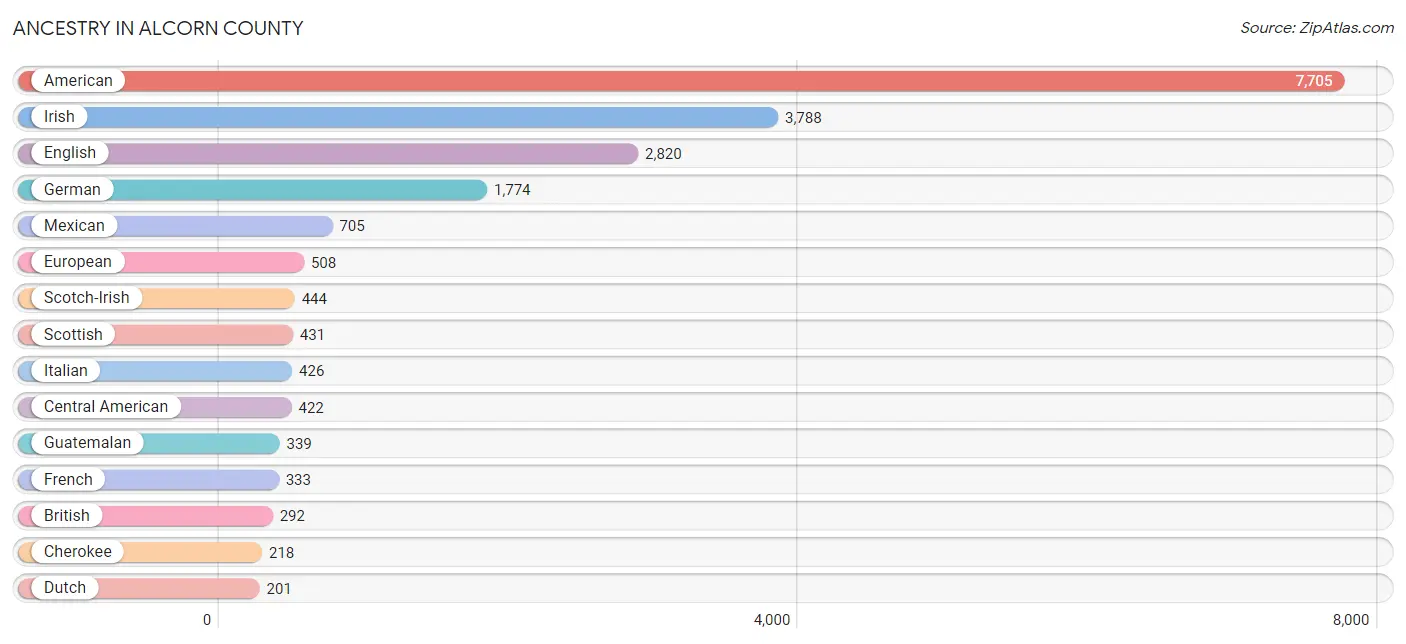
Ancestry in Alcorn County
The most populous ancestries reported in Alcorn County are American (7,705 | 22.2%), Irish (3,788 | 10.9%), English (2,820 | 8.1%), German (1,774 | 5.1%), and Mexican (705 | 2.0%), together accounting for 48.4% of all Alcorn County residents.
| Ancestry | # Population | % Population |
| African | 49 | 0.1% |
| American | 7,705 | 22.2% |
| Arab | 69 | 0.2% |
| Austrian | 12 | 0.0% |
| Blackfeet | 5 | 0.0% |
| Brazilian | 40 | 0.1% |
| British | 292 | 0.8% |
| Cajun | 1 | 0.0% |
| Central American | 422 | 1.2% |
| Central American Indian | 104 | 0.3% |
| Cherokee | 218 | 0.6% |
| Chippewa | 11 | 0.0% |
| Croatian | 43 | 0.1% |
| Cuban | 37 | 0.1% |
| Czech | 33 | 0.1% |
| Dutch | 201 | 0.6% |
| Eastern European | 12 | 0.0% |
| English | 2,820 | 8.1% |
| European | 508 | 1.5% |
| French | 333 | 1.0% |
| French American Indian | 3 | 0.0% |
| French Canadian | 52 | 0.2% |
| German | 1,774 | 5.1% |
| Greek | 49 | 0.1% |
| Guatemalan | 339 | 1.0% |
| Honduran | 83 | 0.2% |
| Houma | 2 | 0.0% |
| Indian (Asian) | 53 | 0.2% |
| Iranian | 4 | 0.0% |
| Irish | 3,788 | 10.9% |
| Italian | 426 | 1.2% |
| Korean | 143 | 0.4% |
| Lebanese | 54 | 0.2% |
| Lithuanian | 4 | 0.0% |
| Mexican | 705 | 2.0% |
| New Zealander | 7 | 0.0% |
| Nigerian | 15 | 0.0% |
| Northern European | 12 | 0.0% |
| Norwegian | 43 | 0.1% |
| Palestinian | 15 | 0.0% |
| Polish | 100 | 0.3% |
| Puerto Rican | 5 | 0.0% |
| Russian | 54 | 0.2% |
| Samoan | 44 | 0.1% |
| Scandinavian | 30 | 0.1% |
| Scotch-Irish | 444 | 1.3% |
| Scottish | 431 | 1.2% |
| Spanish | 42 | 0.1% |
| Sri Lankan | 39 | 0.1% |
| Subsaharan African | 64 | 0.2% |
| Swedish | 68 | 0.2% |
| Swiss | 2 | 0.0% |
| Welsh | 43 | 0.1% | View All 53 Rows |
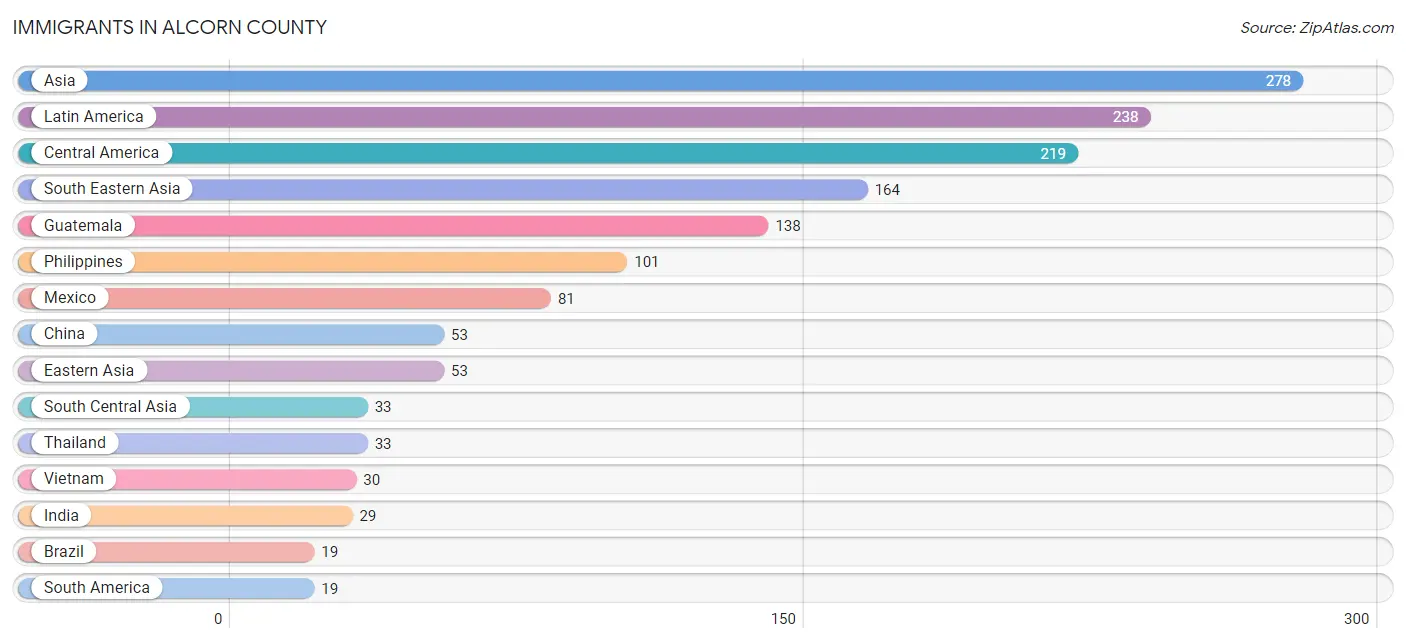
Immigrants in Alcorn County
The most numerous immigrant groups reported in Alcorn County came from Asia (278 | 0.8%), Latin America (238 | 0.7%), Central America (219 | 0.6%), South Eastern Asia (164 | 0.5%), and Guatemala (138 | 0.4%), together accounting for 3.0% of all Alcorn County residents.
| Immigration Origin | # Population | % Population |
| Africa | 3 | 0.0% |
| Asia | 278 | 0.8% |
| Brazil | 19 | 0.1% |
| Central America | 219 | 0.6% |
| China | 53 | 0.2% |
| Eastern Africa | 3 | 0.0% |
| Eastern Asia | 53 | 0.2% |
| England | 1 | 0.0% |
| Europe | 16 | 0.1% |
| Germany | 15 | 0.0% |
| Guatemala | 138 | 0.4% |
| India | 29 | 0.1% |
| Iran | 4 | 0.0% |
| Latin America | 238 | 0.7% |
| Mexico | 81 | 0.2% |
| Northern Europe | 1 | 0.0% |
| Philippines | 101 | 0.3% |
| South America | 19 | 0.1% |
| South Central Asia | 33 | 0.1% |
| South Eastern Asia | 164 | 0.5% |
| Thailand | 33 | 0.1% |
| Vietnam | 30 | 0.1% |
| Western Europe | 15 | 0.0% | View All 23 Rows |
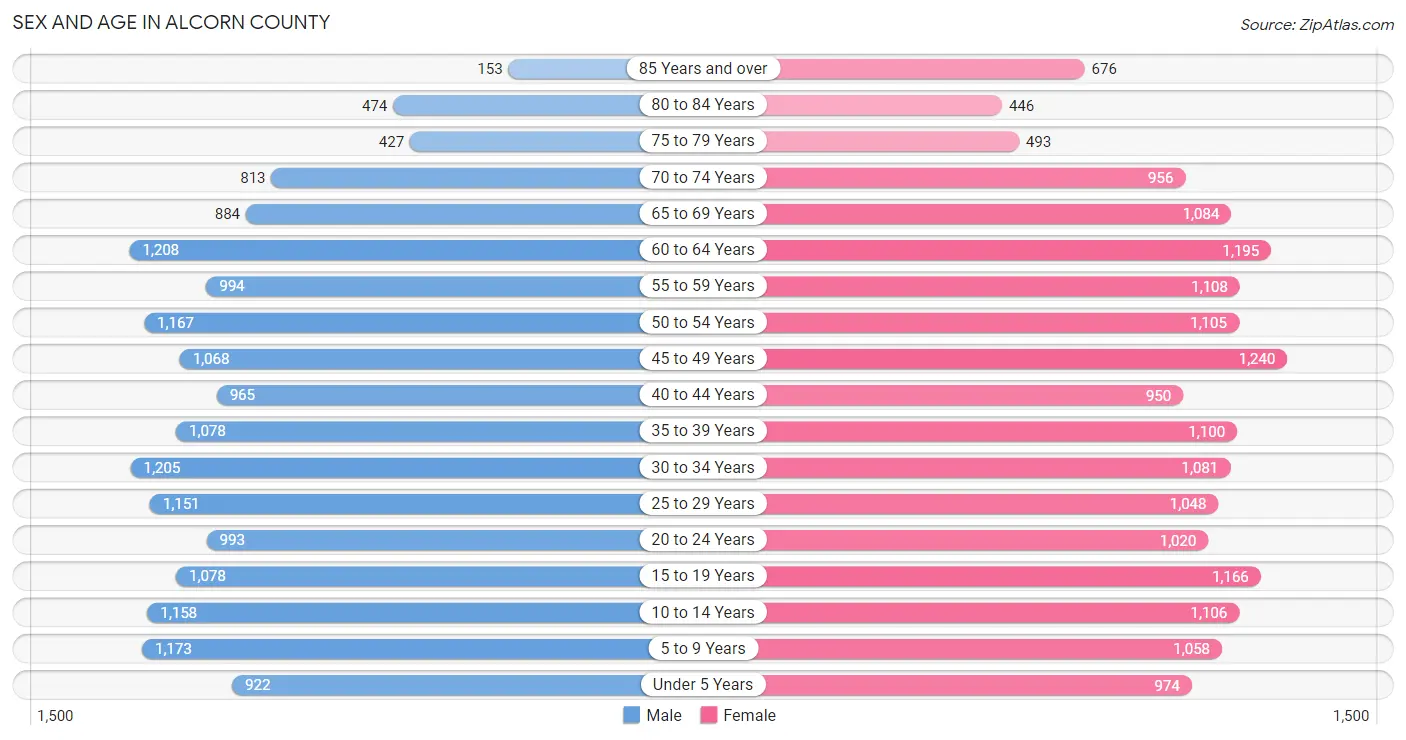
Sex and Age in Alcorn County
Sex and Age in Alcorn County
The most populous age groups in Alcorn County are 60 to 64 Years (1,208 | 7.1%) for men and 45 to 49 Years (1,240 | 7.0%) for women.
| Age Bracket | Male | Female |
| Under 5 Years | 922 (5.4%) | 974 (5.5%) |
| 5 to 9 Years | 1,173 (6.9%) | 1,058 (5.9%) |
| 10 to 14 Years | 1,158 (6.9%) | 1,106 (6.2%) |
| 15 to 19 Years | 1,078 (6.4%) | 1,166 (6.6%) |
| 20 to 24 Years | 993 (5.9%) | 1,020 (5.7%) |
| 25 to 29 Years | 1,151 (6.8%) | 1,048 (5.9%) |
| 30 to 34 Years | 1,205 (7.1%) | 1,081 (6.1%) |
| 35 to 39 Years | 1,078 (6.4%) | 1,100 (6.2%) |
| 40 to 44 Years | 965 (5.7%) | 950 (5.3%) |
| 45 to 49 Years | 1,068 (6.3%) | 1,240 (7.0%) |
| 50 to 54 Years | 1,167 (6.9%) | 1,105 (6.2%) |
| 55 to 59 Years | 994 (5.9%) | 1,108 (6.2%) |
| 60 to 64 Years | 1,208 (7.1%) | 1,195 (6.7%) |
| 65 to 69 Years | 884 (5.2%) | 1,084 (6.1%) |
| 70 to 74 Years | 813 (4.8%) | 956 (5.4%) |
| 75 to 79 Years | 427 (2.5%) | 493 (2.8%) |
| 80 to 84 Years | 474 (2.8%) | 446 (2.5%) |
| 85 Years and over | 153 (0.9%) | 676 (3.8%) |
| Total | 16,911 (100.0%) | 17,806 (100.0%) |
Families and Households in Alcorn County
Median Family Size in Alcorn County
The median family size in Alcorn County is 3.03 persons per family, with married-couple families (6,104 | 68.4%) accounting for the largest median family size of 3.1 persons per family. On the other hand, single male/father families (552 | 6.2%) represent the smallest median family size with 2.66 persons per family.
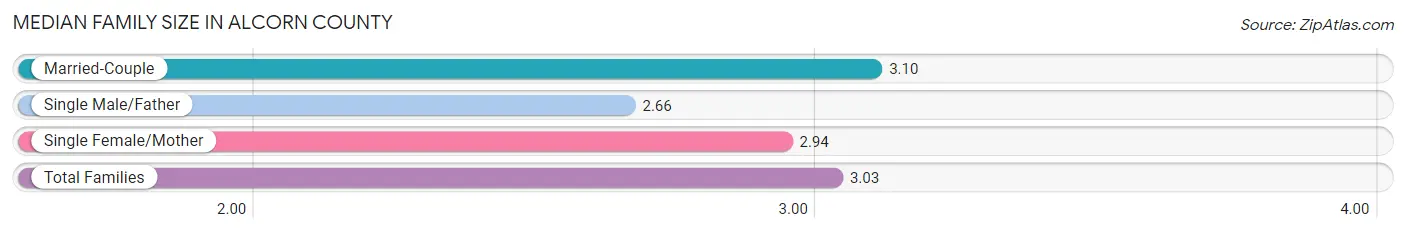
| Family Type | # Families | Family Size |
| Married-Couple | 6,104 (68.4%) | 3.10 |
| Single Male/Father | 552 (6.2%) | 2.66 |
| Single Female/Mother | 2,261 (25.4%) | 2.94 |
| Total Families | 8,917 (100.0%) | 3.03 |
Median Household Size in Alcorn County
The median household size in Alcorn County is 2.43 persons per household, with single female/mother households (2,261 | 16.2%) accounting for the largest median household size of 3.17 persons per household. non-family households (5,058 | 36.2%) represent the smallest median household size with 1.22 persons per household.
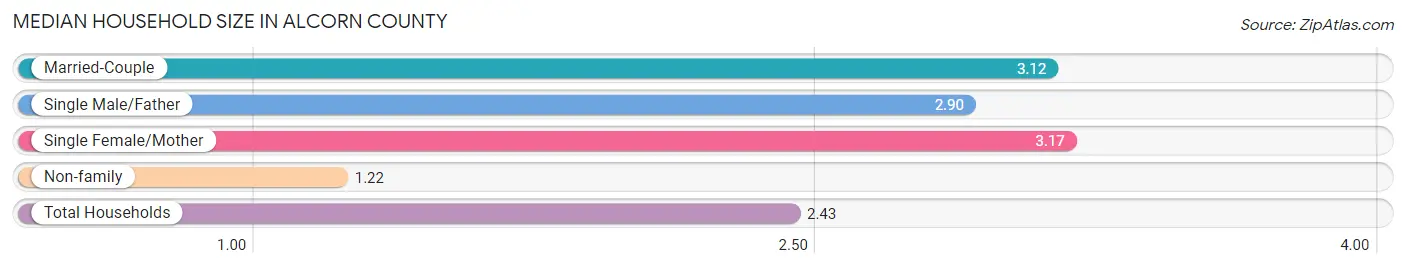
| Household Type | # Households | Household Size |
| Married-Couple | 6,104 (43.7%) | 3.12 |
| Single Male/Father | 552 (4.0%) | 2.90 |
| Single Female/Mother | 2,261 (16.2%) | 3.17 |
| Non-family | 5,058 (36.2%) | 1.22 |
| Total Households | 13,975 (100.0%) | 2.43 |
Household Size by Marriage Status in Alcorn County
Out of a total of 13,975 households in Alcorn County, 8,917 (63.8%) are family households, while 5,058 (36.2%) are nonfamily households. The most numerous type of family households are 2-person households, comprising 4,514, and the most common type of nonfamily households are 1-person households, comprising 4,402.
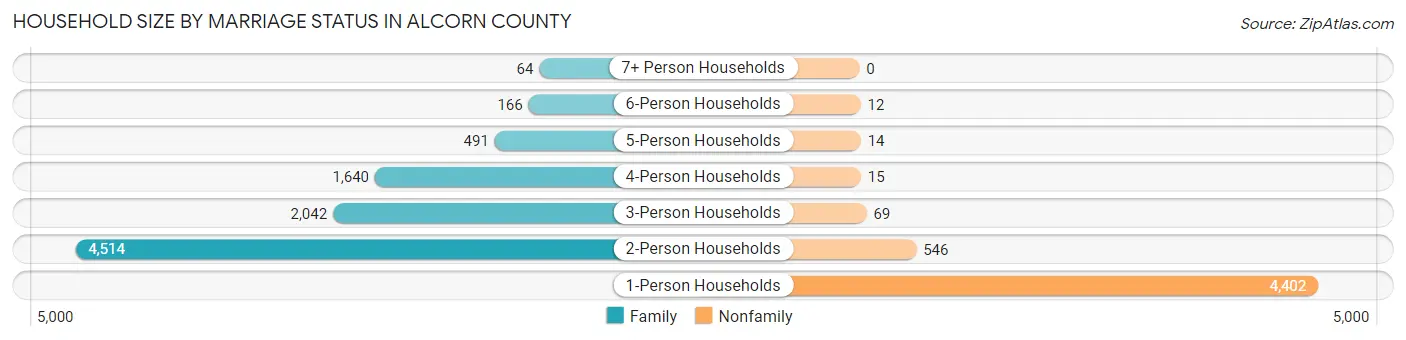
| Household Size | Family Households | Nonfamily Households |
| 1-Person Households | - | 4,402 (31.5%) |
| 2-Person Households | 4,514 (32.3%) | 546 (3.9%) |
| 3-Person Households | 2,042 (14.6%) | 69 (0.5%) |
| 4-Person Households | 1,640 (11.7%) | 15 (0.1%) |
| 5-Person Households | 491 (3.5%) | 14 (0.1%) |
| 6-Person Households | 166 (1.2%) | 12 (0.1%) |
| 7+ Person Households | 64 (0.5%) | 0 (0.0%) |
| Total | 8,917 (63.8%) | 5,058 (36.2%) |
Female Fertility in Alcorn County
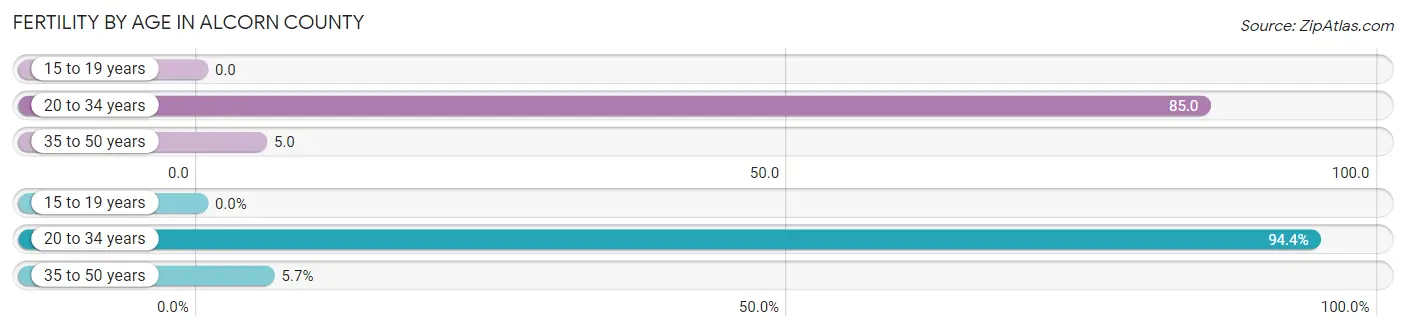
Fertility by Age in Alcorn County
Average fertility rate in Alcorn County is 36.0 births per 1,000 women. Women in the age bracket of 20 to 34 years have the highest fertility rate with 85.0 births per 1,000 women. Women in the age bracket of 20 to 34 years acount for 94.4% of all women with births.
| Age Bracket | Women with Births | Births / 1,000 Women |
| 15 to 19 years | 0 (0.0%) | 0.0 |
| 20 to 34 years | 267 (94.4%) | 85.0 |
| 35 to 50 years | 16 (5.7%) | 5.0 |
| Total | 283 (100.0%) | 36.0 |
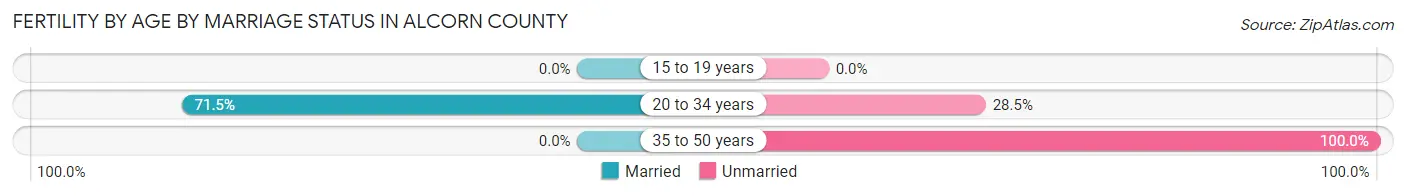
Fertility by Age by Marriage Status in Alcorn County
67.5% of women with births (283) in Alcorn County are married. The highest percentage of unmarried women with births falls into 35 to 50 years age bracket with 100.0% of them unmarried at the time of birth, while the lowest percentage of unmarried women with births belong to 20 to 34 years age bracket with 28.5% of them unmarried.
| Age Bracket | Married | Unmarried |
| 15 to 19 years | 0 (0.0%) | 0 (0.0%) |
| 20 to 34 years | 191 (71.5%) | 76 (28.5%) |
| 35 to 50 years | 0 (0.0%) | 16 (100.0%) |
| Total | 191 (67.5%) | 92 (32.5%) |
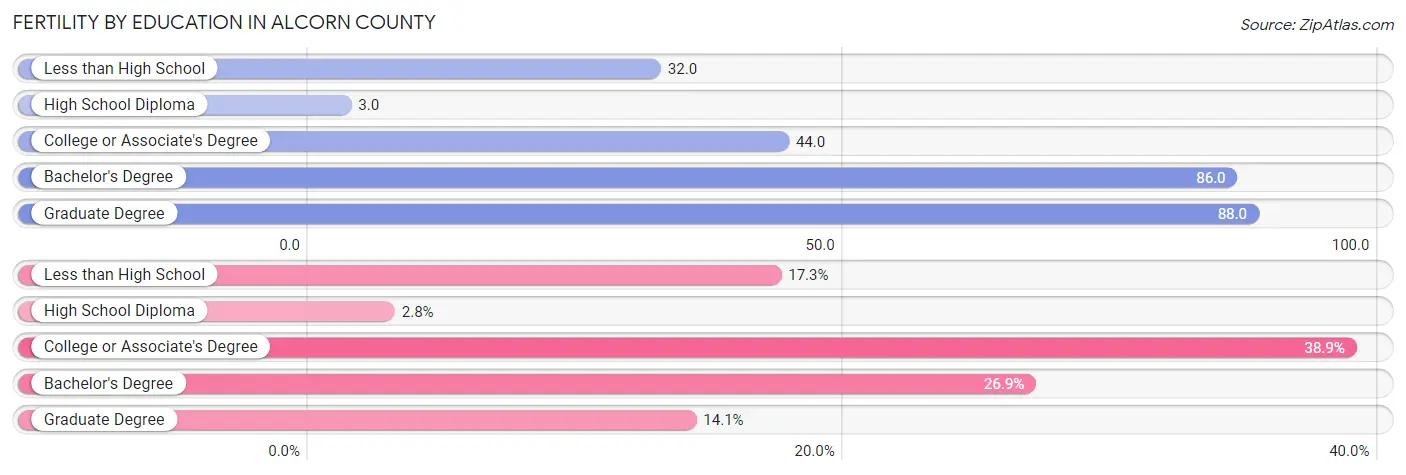
Fertility by Education in Alcorn County
Average fertility rate in Alcorn County is 36.0 births per 1,000 women. Women with the education attainment of graduate degree have the highest fertility rate of 88.0 births per 1,000 women, while women with the education attainment of high school diploma have the lowest fertility at 3.0 births per 1,000 women. Women with the education attainment of college or associate's degree represent 38.9% of all women with births.
| Educational Attainment | Women with Births | Births / 1,000 Women |
| Less than High School | 49 (17.3%) | 32.0 |
| High School Diploma | 8 (2.8%) | 3.0 |
| College or Associate's Degree | 110 (38.9%) | 44.0 |
| Bachelor's Degree | 76 (26.9%) | 86.0 |
| Graduate Degree | 40 (14.1%) | 88.0 |
| Total | 283 (100.0%) | 36.0 |
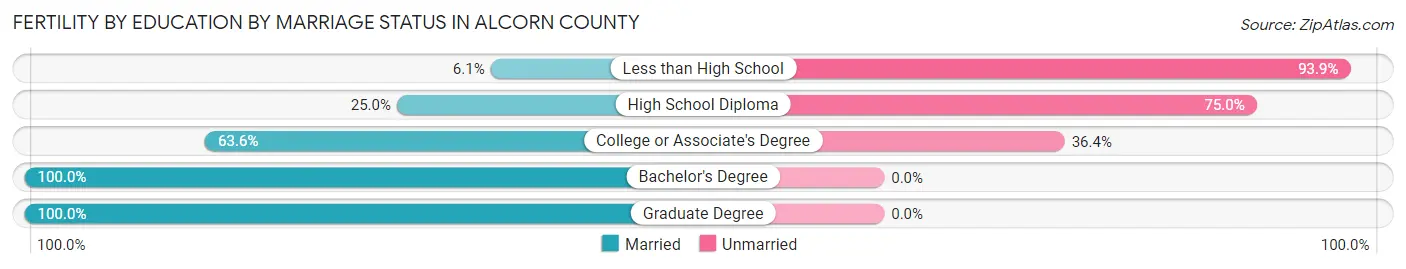
Fertility by Education by Marriage Status in Alcorn County
32.5% of women with births in Alcorn County are unmarried. Women with the educational attainment of bachelor's degree are most likely to be married with 100.0% of them married at childbirth, while women with the educational attainment of less than high school are least likely to be married with 93.9% of them unmarried at childbirth.
| Educational Attainment | Married | Unmarried |
| Less than High School | 3 (6.1%) | 46 (93.9%) |
| High School Diploma | 2 (25.0%) | 6 (75.0%) |
| College or Associate's Degree | 70 (63.6%) | 40 (36.4%) |
| Bachelor's Degree | 76 (100.0%) | 0 (0.0%) |
| Graduate Degree | 40 (100.0%) | 0 (0.0%) |
| Total | 191 (67.5%) | 92 (32.5%) |
Income in Alcorn County
Income Overview in Alcorn County
Per Capita Income in Alcorn County is $27,320, while median incomes of families and households are $60,382 and $47,716 respectively.
| Characteristic | Number | Measure |
| Per Capita Income | 34,717 | $27,320 |
| Median Family Income | 8,917 | $60,382 |
| Mean Family Income | 8,917 | $80,863 |
| Median Household Income | 13,975 | $47,716 |
| Mean Household Income | 13,975 | $65,607 |
| Income Deficit | 8,917 | $0 |
| Wage / Income Gap (%) | 34,717 | 26.90% |
| Wage / Income Gap ($) | 34,717 | 73.10¢ per $1 |
| Gini / Inequality Index | 34,717 | 0.49 |
Earnings by Sex in Alcorn County
Average Earnings in Alcorn County are $31,684, $38,156 for men and $27,891 for women, a difference of 26.9%.
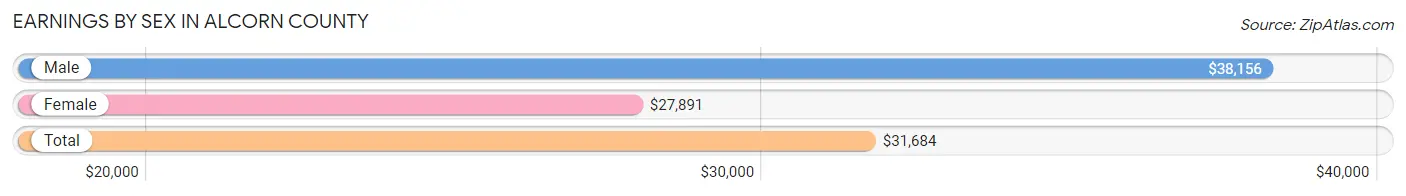
| Sex | Number | Average Earnings |
| Male | 7,900 (50.5%) | $38,156 |
| Female | 7,733 (49.5%) | $27,891 |
| Total | 15,633 (100.0%) | $31,684 |
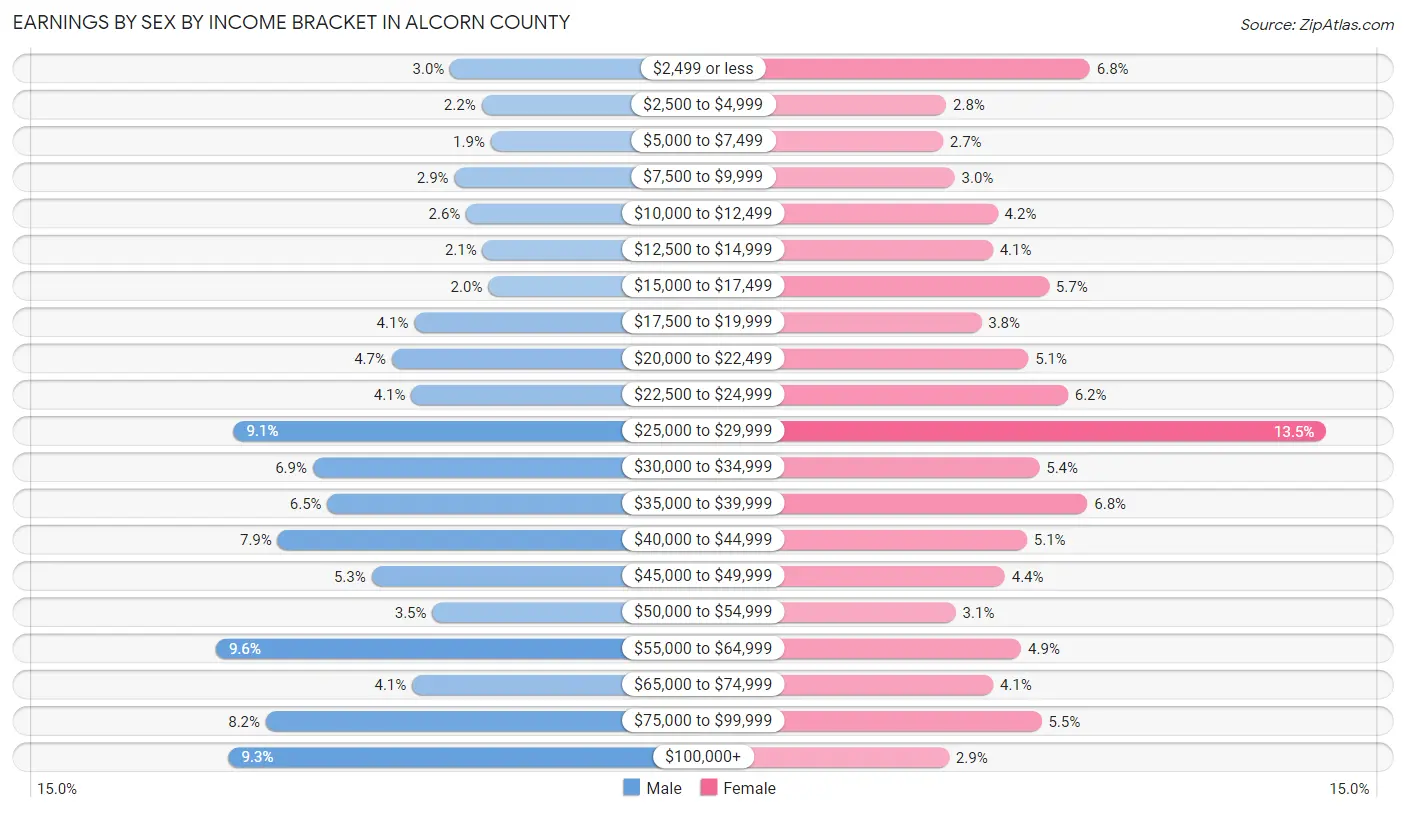
Earnings by Sex by Income Bracket in Alcorn County
The most common earnings brackets in Alcorn County are $55,000 to $64,999 for men (760 | 9.6%) and $25,000 to $29,999 for women (1,042 | 13.5%).
| Income | Male | Female |
| $2,499 or less | 240 (3.0%) | 528 (6.8%) |
| $2,500 to $4,999 | 171 (2.2%) | 216 (2.8%) |
| $5,000 to $7,499 | 150 (1.9%) | 209 (2.7%) |
| $7,500 to $9,999 | 231 (2.9%) | 234 (3.0%) |
| $10,000 to $12,499 | 205 (2.6%) | 328 (4.2%) |
| $12,500 to $14,999 | 168 (2.1%) | 317 (4.1%) |
| $15,000 to $17,499 | 156 (2.0%) | 439 (5.7%) |
| $17,500 to $19,999 | 320 (4.1%) | 292 (3.8%) |
| $20,000 to $22,499 | 370 (4.7%) | 394 (5.1%) |
| $22,500 to $24,999 | 326 (4.1%) | 480 (6.2%) |
| $25,000 to $29,999 | 721 (9.1%) | 1,042 (13.5%) |
| $30,000 to $34,999 | 545 (6.9%) | 418 (5.4%) |
| $35,000 to $39,999 | 513 (6.5%) | 523 (6.8%) |
| $40,000 to $44,999 | 623 (7.9%) | 391 (5.1%) |
| $45,000 to $49,999 | 415 (5.2%) | 343 (4.4%) |
| $50,000 to $54,999 | 280 (3.5%) | 237 (3.1%) |
| $55,000 to $64,999 | 760 (9.6%) | 379 (4.9%) |
| $65,000 to $74,999 | 325 (4.1%) | 318 (4.1%) |
| $75,000 to $99,999 | 649 (8.2%) | 423 (5.5%) |
| $100,000+ | 732 (9.3%) | 222 (2.9%) |
| Total | 7,900 (100.0%) | 7,733 (100.0%) |
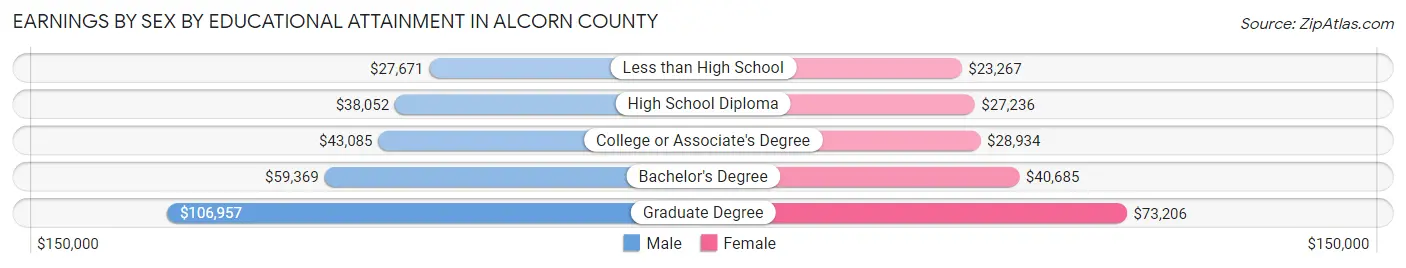
Earnings by Sex by Educational Attainment in Alcorn County
Average earnings in Alcorn County are $42,367 for men and $29,459 for women, a difference of 30.5%. Men with an educational attainment of graduate degree enjoy the highest average annual earnings of $106,957, while those with less than high school education earn the least with $27,671. Women with an educational attainment of graduate degree earn the most with the average annual earnings of $73,206, while those with less than high school education have the smallest earnings of $23,267.
| Educational Attainment | Male Income | Female Income |
| Less than High School | $27,671 | $23,267 |
| High School Diploma | $38,052 | $27,236 |
| College or Associate's Degree | $43,085 | $28,934 |
| Bachelor's Degree | $59,369 | $40,685 |
| Graduate Degree | $106,957 | $73,206 |
| Total | $42,367 | $29,459 |
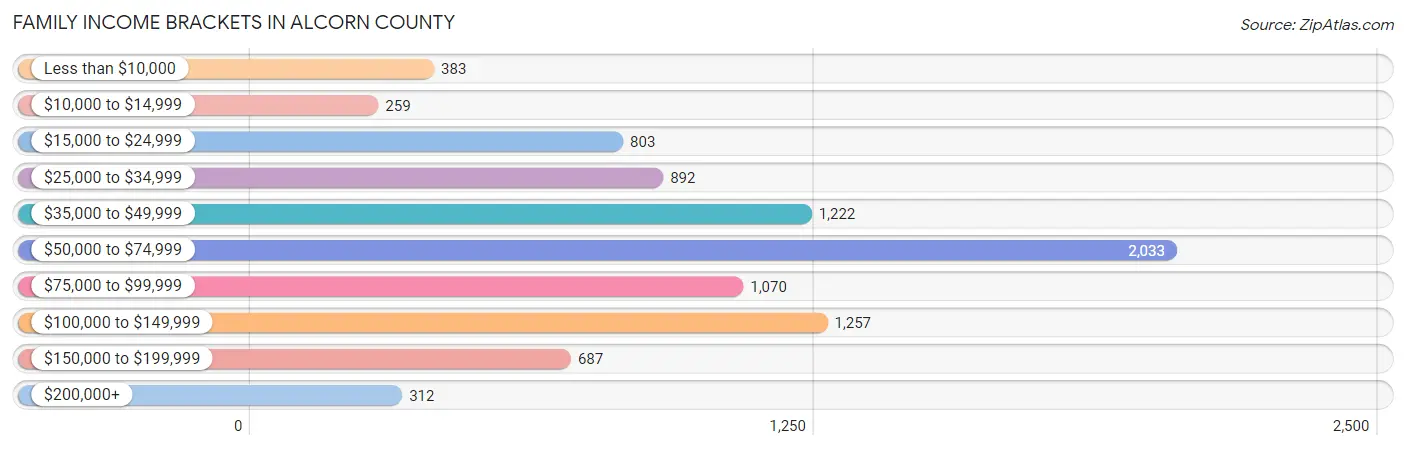
Family Income in Alcorn County
Family Income Brackets in Alcorn County
According to the Alcorn County family income data, there are 2,033 families falling into the $50,000 to $74,999 income range, which is the most common income bracket and makes up 22.8% of all families. Conversely, the $10,000 to $14,999 income bracket is the least frequent group with only 259 families (2.9%) belonging to this category.
| Income Bracket | # Families | % Families |
| Less than $10,000 | 383 | 4.3% |
| $10,000 to $14,999 | 259 | 2.9% |
| $15,000 to $24,999 | 803 | 9.0% |
| $25,000 to $34,999 | 892 | 10.0% |
| $35,000 to $49,999 | 1,222 | 13.7% |
| $50,000 to $74,999 | 2,033 | 22.8% |
| $75,000 to $99,999 | 1,070 | 12.0% |
| $100,000 to $149,999 | 1,257 | 14.1% |
| $150,000 to $199,999 | 687 | 7.7% |
| $200,000+ | 312 | 3.5% |
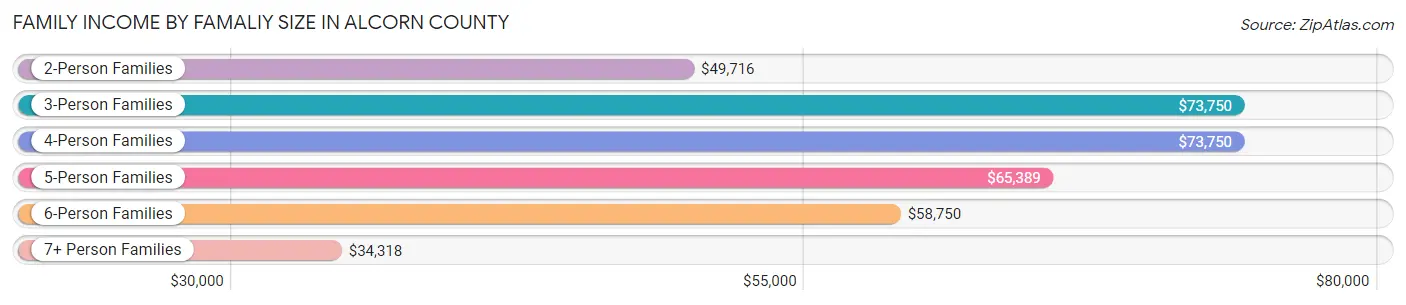
Family Income by Famaliy Size in Alcorn County
3-person families (2,054 | 23.0%) account for the highest median family income in Alcorn County with $73,750 per family, while 2-person families (4,787 | 53.7%) have the highest median income of $24,858 per family member.
| Income Bracket | # Families | Median Income |
| 2-Person Families | 4,787 (53.7%) | $49,716 |
| 3-Person Families | 2,054 (23.0%) | $73,750 |
| 4-Person Families | 1,419 (15.9%) | $73,750 |
| 5-Person Families | 484 (5.4%) | $65,389 |
| 6-Person Families | 109 (1.2%) | $58,750 |
| 7+ Person Families | 64 (0.7%) | $34,318 |
| Total | 8,917 (100.0%) | $60,382 |
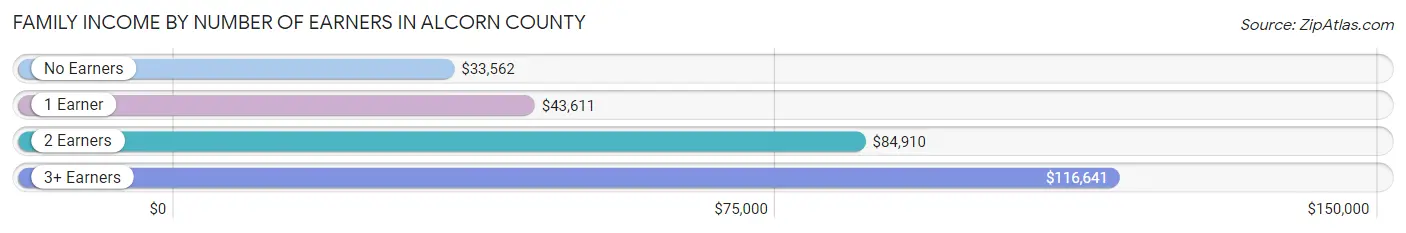
Family Income by Number of Earners in Alcorn County
The median family income in Alcorn County is $60,382, with families comprising 3+ earners (610) having the highest median family income of $116,641, while families with no earners (1,923) have the lowest median family income of $33,562, accounting for 6.8% and 21.6% of families, respectively.
| Number of Earners | # Families | Median Income |
| No Earners | 1,923 (21.6%) | $33,562 |
| 1 Earner | 2,710 (30.4%) | $43,611 |
| 2 Earners | 3,674 (41.2%) | $84,910 |
| 3+ Earners | 610 (6.8%) | $116,641 |
| Total | 8,917 (100.0%) | $60,382 |
Household Income in Alcorn County
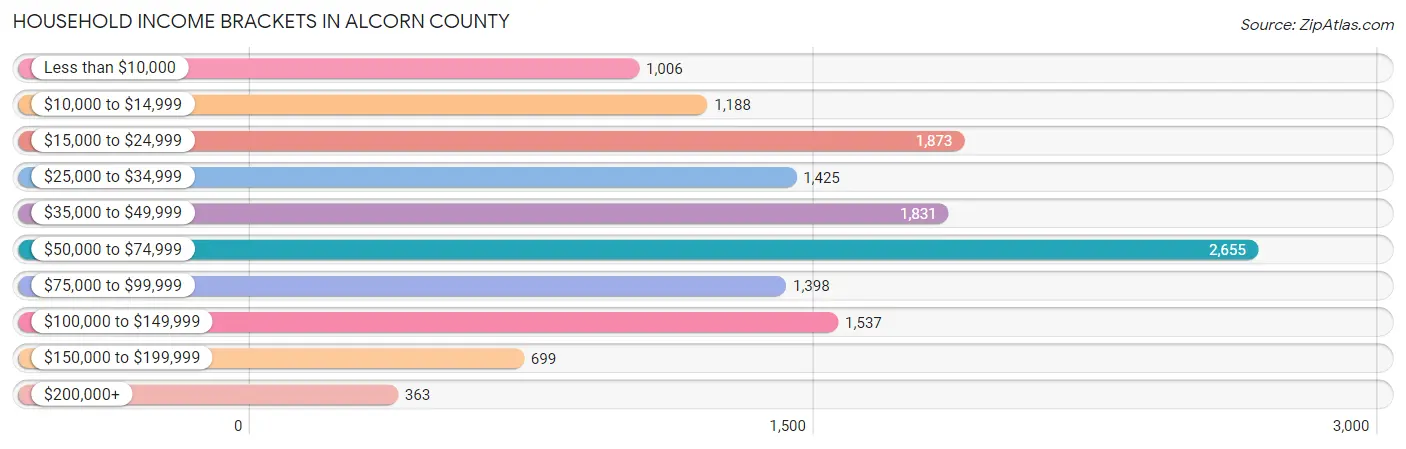
Household Income Brackets in Alcorn County
With 2,655 households falling in the category, the $50,000 to $74,999 income range is the most frequent in Alcorn County, accounting for 19.0% of all households. In contrast, only 363 households (2.6%) fall into the $200,000+ income bracket, making it the least populous group.
| Income Bracket | # Households | % Households |
| Less than $10,000 | 1,006 | 7.2% |
| $10,000 to $14,999 | 1,188 | 8.5% |
| $15,000 to $24,999 | 1,873 | 13.4% |
| $25,000 to $34,999 | 1,425 | 10.2% |
| $35,000 to $49,999 | 1,831 | 13.1% |
| $50,000 to $74,999 | 2,655 | 19.0% |
| $75,000 to $99,999 | 1,398 | 10.0% |
| $100,000 to $149,999 | 1,537 | 11.0% |
| $150,000 to $199,999 | 699 | 5.0% |
| $200,000+ | 363 | 2.6% |
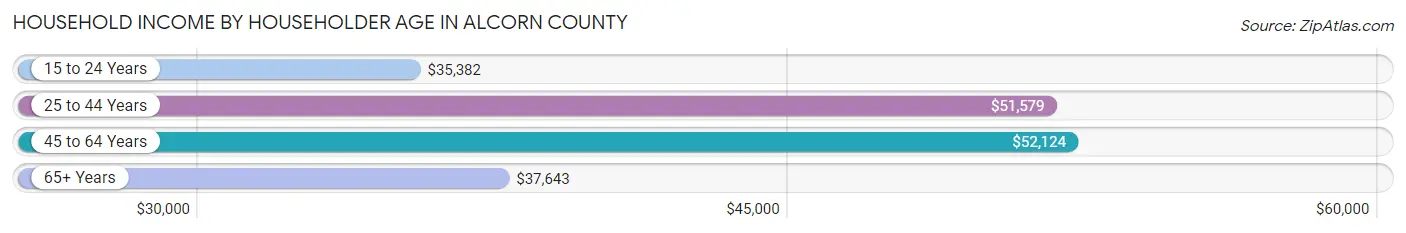
Household Income by Householder Age in Alcorn County
The median household income in Alcorn County is $47,716, with the highest median household income of $52,124 found in the 45 to 64 years age bracket for the primary householder. A total of 5,244 households (37.5%) fall into this category. Meanwhile, the 15 to 24 years age bracket for the primary householder has the lowest median household income of $35,382, with 593 households (4.2%) in this group.
| Income Bracket | # Households | Median Income |
| 15 to 24 Years | 593 (4.2%) | $35,382 |
| 25 to 44 Years | 3,953 (28.3%) | $51,579 |
| 45 to 64 Years | 5,244 (37.5%) | $52,124 |
| 65+ Years | 4,185 (29.9%) | $37,643 |
| Total | 13,975 (100.0%) | $47,716 |
Poverty in Alcorn County
Income Below Poverty by Sex and Age in Alcorn County
With 14.4% poverty level for males and 19.7% for females among the residents of Alcorn County, 6 to 11 year old males and under 5 year old females are the most vulnerable to poverty, with 505 males (32.6%) and 322 females (34.0%) in their respective age groups living below the poverty level.
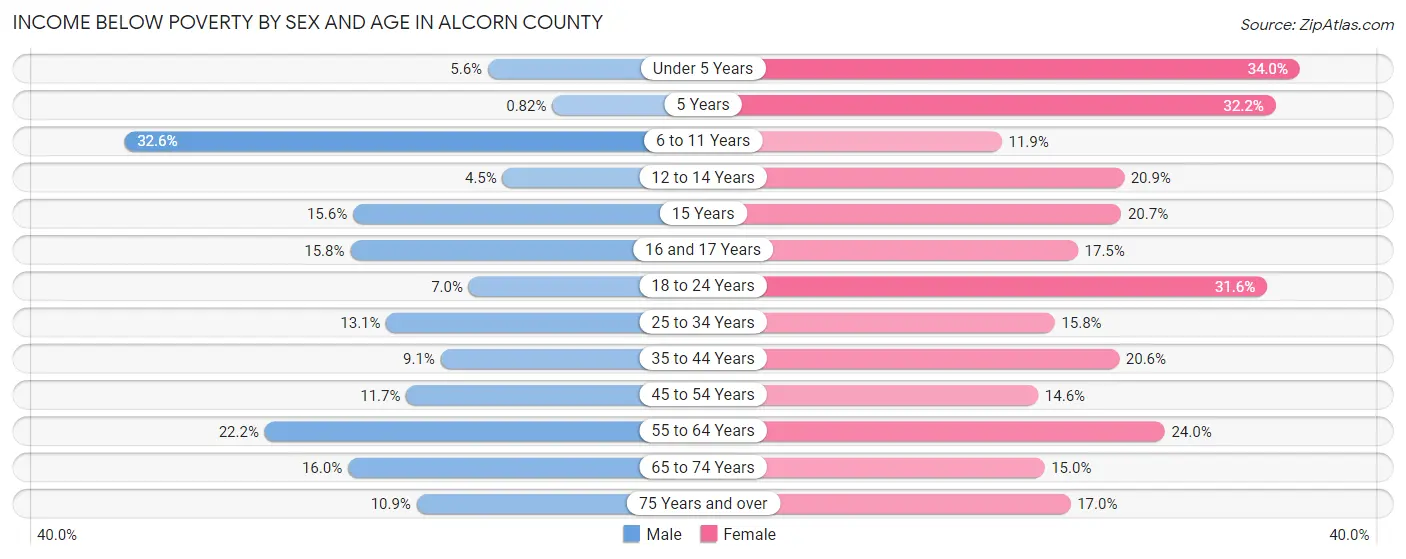
| Age Bracket | Male | Female |
| Under 5 Years | 47 (5.6%) | 322 (34.0%) |
| 5 Years | 2 (0.8%) | 48 (32.2%) |
| 6 to 11 Years | 505 (32.6%) | 152 (11.9%) |
| 12 to 14 Years | 23 (4.5%) | 148 (20.9%) |
| 15 Years | 30 (15.6%) | 51 (20.7%) |
| 16 and 17 Years | 78 (15.8%) | 97 (17.5%) |
| 18 to 24 Years | 96 (7.0%) | 435 (31.6%) |
| 25 to 34 Years | 298 (13.1%) | 330 (15.8%) |
| 35 to 44 Years | 178 (9.1%) | 418 (20.6%) |
| 45 to 54 Years | 250 (11.7%) | 341 (14.6%) |
| 55 to 64 Years | 475 (22.2%) | 546 (24.0%) |
| 65 to 74 Years | 265 (16.0%) | 294 (15.0%) |
| 75 Years and over | 112 (10.9%) | 250 (17.0%) |
| Total | 2,359 (14.4%) | 3,432 (19.7%) |
Income Above Poverty by Sex and Age in Alcorn County
According to the poverty statistics in Alcorn County, males aged 5 years and females aged 6 to 11 years are the age groups that are most secure financially, with 99.2% of males and 88.1% of females in these age groups living above the poverty line.
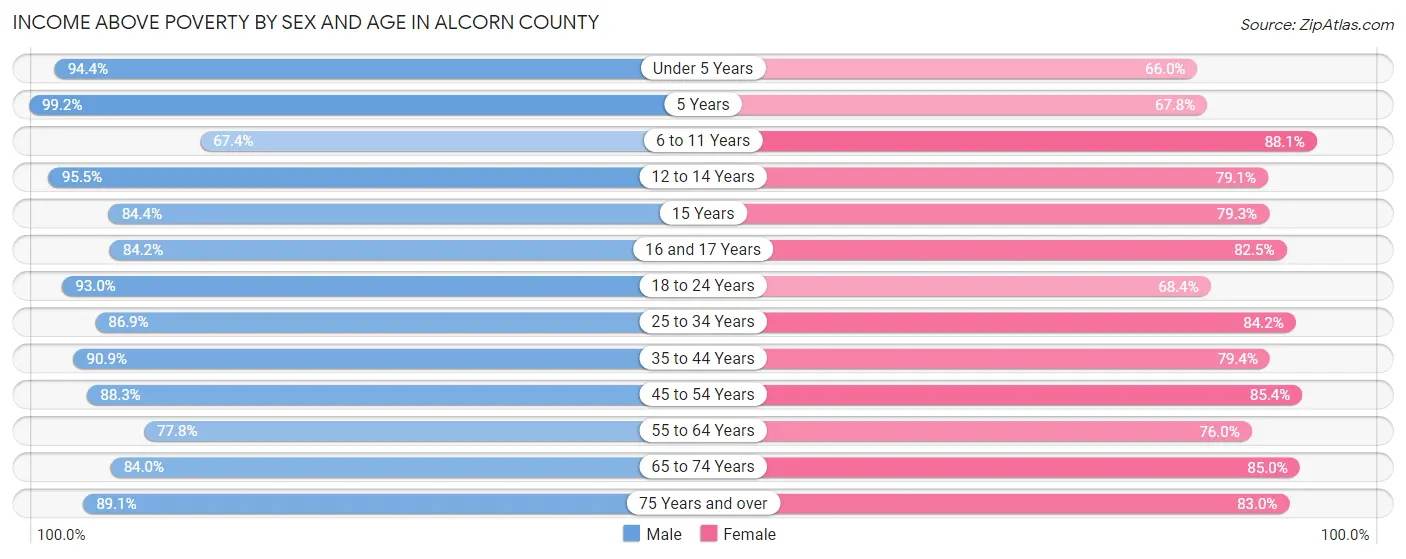
| Age Bracket | Male | Female |
| Under 5 Years | 793 (94.4%) | 625 (66.0%) |
| 5 Years | 242 (99.2%) | 101 (67.8%) |
| 6 to 11 Years | 1,044 (67.4%) | 1,130 (88.1%) |
| 12 to 14 Years | 487 (95.5%) | 559 (79.1%) |
| 15 Years | 162 (84.4%) | 195 (79.3%) |
| 16 and 17 Years | 415 (84.2%) | 457 (82.5%) |
| 18 to 24 Years | 1,271 (93.0%) | 943 (68.4%) |
| 25 to 34 Years | 1,970 (86.9%) | 1,760 (84.2%) |
| 35 to 44 Years | 1,776 (90.9%) | 1,614 (79.4%) |
| 45 to 54 Years | 1,894 (88.3%) | 2,001 (85.4%) |
| 55 to 64 Years | 1,668 (77.8%) | 1,733 (76.0%) |
| 65 to 74 Years | 1,392 (84.0%) | 1,662 (85.0%) |
| 75 Years and over | 916 (89.1%) | 1,224 (83.0%) |
| Total | 14,030 (85.6%) | 14,004 (80.3%) |
Income Below Poverty Among Married-Couple Families in Alcorn County
The poverty statistics for married-couple families in Alcorn County show that 6.2% or 380 of the total 6,104 families live below the poverty line. Families with 3 or 4 children have the highest poverty rate of 13.1%, comprising of 48 families. On the other hand, families with 5 or more children have the lowest poverty rate of 0.0%, which includes 0 families.

| Children | Above Poverty | Below Poverty |
| No Children | 3,371 (93.6%) | 230 (6.4%) |
| 1 or 2 Children | 2,023 (95.2%) | 102 (4.8%) |
| 3 or 4 Children | 318 (86.9%) | 48 (13.1%) |
| 5 or more Children | 12 (100.0%) | 0 (0.0%) |
| Total | 5,724 (93.8%) | 380 (6.2%) |
Income Below Poverty Among Single-Parent Households in Alcorn County
According to the poverty data in Alcorn County, 1.5% or 8 single-father households and 27.0% or 611 single-mother households are living below the poverty line. Among single-father households, those with 1 or 2 children have the highest poverty rate, with 8 households (4.6%) experiencing poverty. Likewise, among single-mother households, those with 3 or 4 children have the highest poverty rate, with 33 households (46.5%) falling below the poverty line.
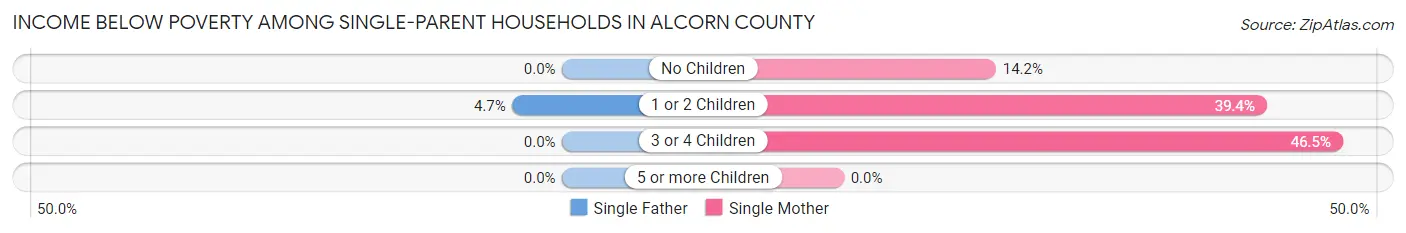
| Children | Single Father | Single Mother |
| No Children | 0 (0.0%) | 160 (14.2%) |
| 1 or 2 Children | 8 (4.6%) | 418 (39.4%) |
| 3 or 4 Children | 0 (0.0%) | 33 (46.5%) |
| 5 or more Children | 0 (0.0%) | 0 (0.0%) |
| Total | 8 (1.5%) | 611 (27.0%) |
Income Below Poverty Among Married-Couple vs Single-Parent Households in Alcorn County
The poverty data for Alcorn County shows that 380 of the married-couple family households (6.2%) and 619 of the single-parent households (22.0%) are living below the poverty level. Within the married-couple family households, those with 3 or 4 children have the highest poverty rate, with 48 households (13.1%) falling below the poverty line. Among the single-parent households, those with 3 or 4 children have the highest poverty rate, with 33 household (46.5%) living below poverty.
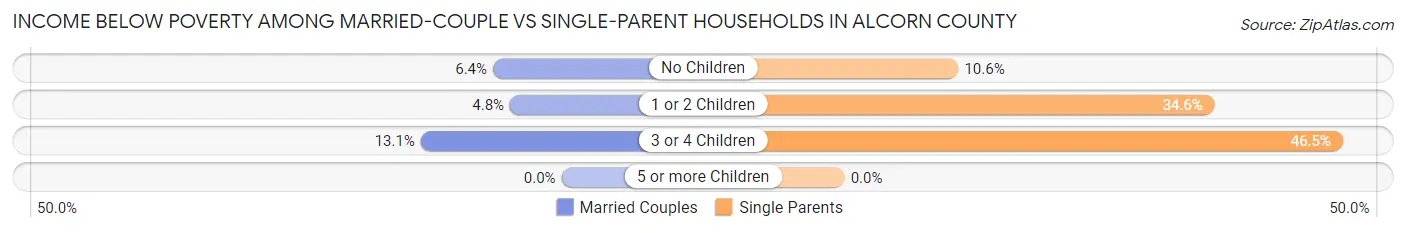
| Children | Married-Couple Families | Single-Parent Households |
| No Children | 230 (6.4%) | 160 (10.6%) |
| 1 or 2 Children | 102 (4.8%) | 426 (34.5%) |
| 3 or 4 Children | 48 (13.1%) | 33 (46.5%) |
| 5 or more Children | 0 (0.0%) | 0 (0.0%) |
| Total | 380 (6.2%) | 619 (22.0%) |
Employment Characteristics in Alcorn County
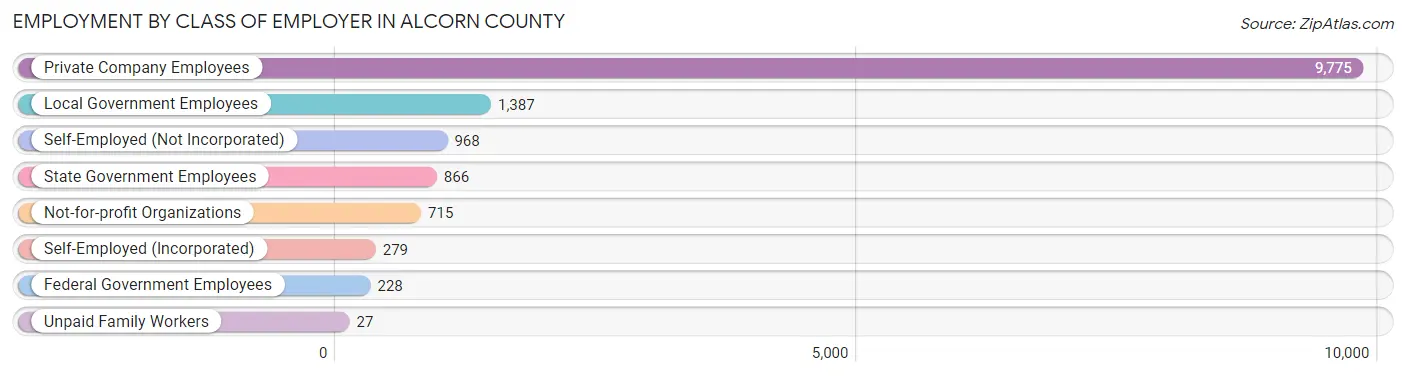
Employment by Class of Employer in Alcorn County
Among the 14,245 employed individuals in Alcorn County, private company employees (9,775 | 68.6%), local government employees (1,387 | 9.7%), and self-employed (not incorporated) (968 | 6.8%) make up the most common classes of employment.
| Employer Class | # Employees | % Employees |
| Private Company Employees | 9,775 | 68.6% |
| Self-Employed (Incorporated) | 279 | 2.0% |
| Self-Employed (Not Incorporated) | 968 | 6.8% |
| Not-for-profit Organizations | 715 | 5.0% |
| Local Government Employees | 1,387 | 9.7% |
| State Government Employees | 866 | 6.1% |
| Federal Government Employees | 228 | 1.6% |
| Unpaid Family Workers | 27 | 0.2% |
| Total | 14,245 | 100.0% |
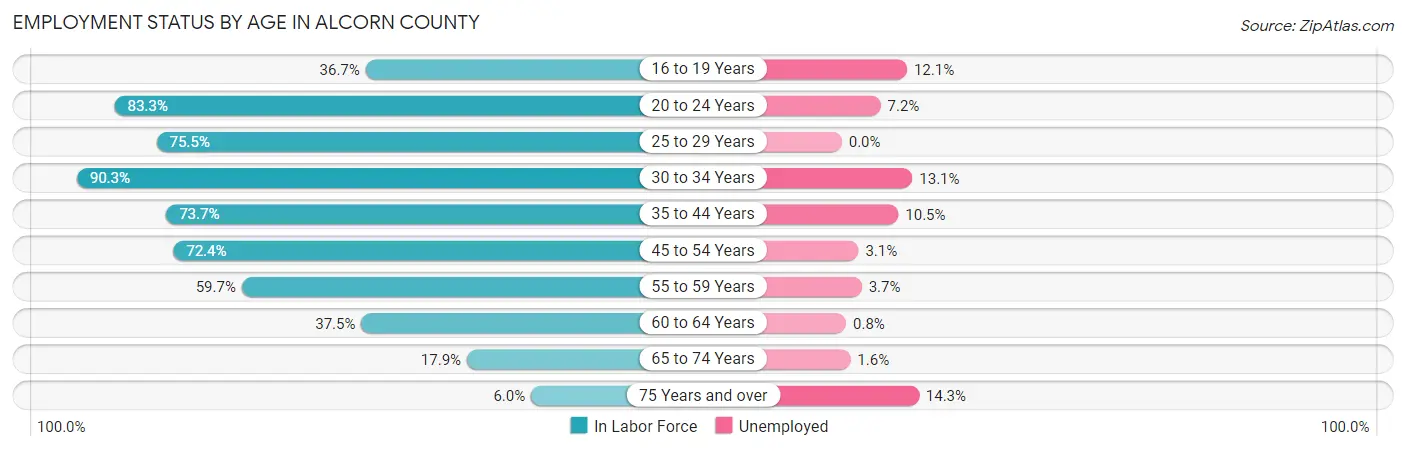
Employment Status by Age in Alcorn County
According to the labor force statistics for Alcorn County, out of the total population over 16 years of age (27,882), 55.2% or 15,391 individuals are in the labor force, with 6.4% or 985 of them unemployed. The age group with the highest labor force participation rate is 30 to 34 years, with 90.3% or 2,064 individuals in the labor force. Within the labor force, the 75 years and over age range has the highest percentage of unemployed individuals, with 14.3% or 23 of them being unemployed.
| Age Bracket | In Labor Force | Unemployed |
| 16 to 19 Years | 661 (36.7%) | 80 (12.1%) |
| 20 to 24 Years | 1,677 (83.3%) | 121 (7.2%) |
| 25 to 29 Years | 1,660 (75.5%) | 0 (0.0%) |
| 30 to 34 Years | 2,064 (90.3%) | 270 (13.1%) |
| 35 to 44 Years | 3,017 (73.7%) | 317 (10.5%) |
| 45 to 54 Years | 3,316 (72.4%) | 103 (3.1%) |
| 55 to 59 Years | 1,255 (59.7%) | 46 (3.7%) |
| 60 to 64 Years | 901 (37.5%) | 7 (0.8%) |
| 65 to 74 Years | 669 (17.9%) | 11 (1.6%) |
| 75 Years and over | 160 (6.0%) | 23 (14.3%) |
| Total | 15,391 (55.2%) | 985 (6.4%) |
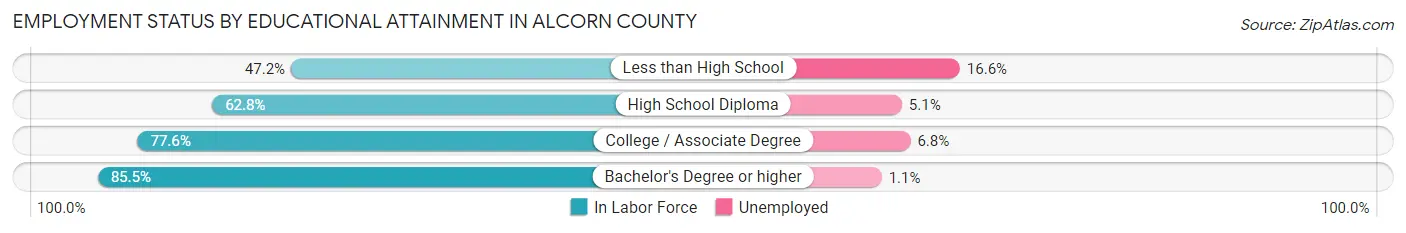
Employment Status by Educational Attainment in Alcorn County
According to labor force statistics for Alcorn County, 69.1% of individuals (12,205) out of the total population between 25 and 64 years of age (17,663) are in the labor force, with 6.1% or 745 of them being unemployed. The group with the highest labor force participation rate are those with the educational attainment of bachelor's degree or higher, with 85.5% or 2,742 individuals in the labor force. Within the labor force, individuals with less than high school education have the highest percentage of unemployment, with 16.6% or 226 of them being unemployed.
| Educational Attainment | In Labor Force | Unemployed |
| Less than High School | 1,361 (47.2%) | 479 (16.6%) |
| High School Diploma | 3,695 (62.8%) | 300 (5.1%) |
| College / Associate Degree | 4,415 (77.6%) | 387 (6.8%) |
| Bachelor's Degree or higher | 2,742 (85.5%) | 35 (1.1%) |
| Total | 12,205 (69.1%) | 1,077 (6.1%) |
Employment Occupations by Sex in Alcorn County
Management, Business, Science and Arts Occupations
The most common Management, Business, Science and Arts occupations in Alcorn County are Management (1,227 | 8.5%), Community & Social Service (1,161 | 8.1%), Health Diagnosing & Treating (1,049 | 7.3%), Education Instruction & Library (803 | 5.6%), and Health Technologists (662 | 4.6%).
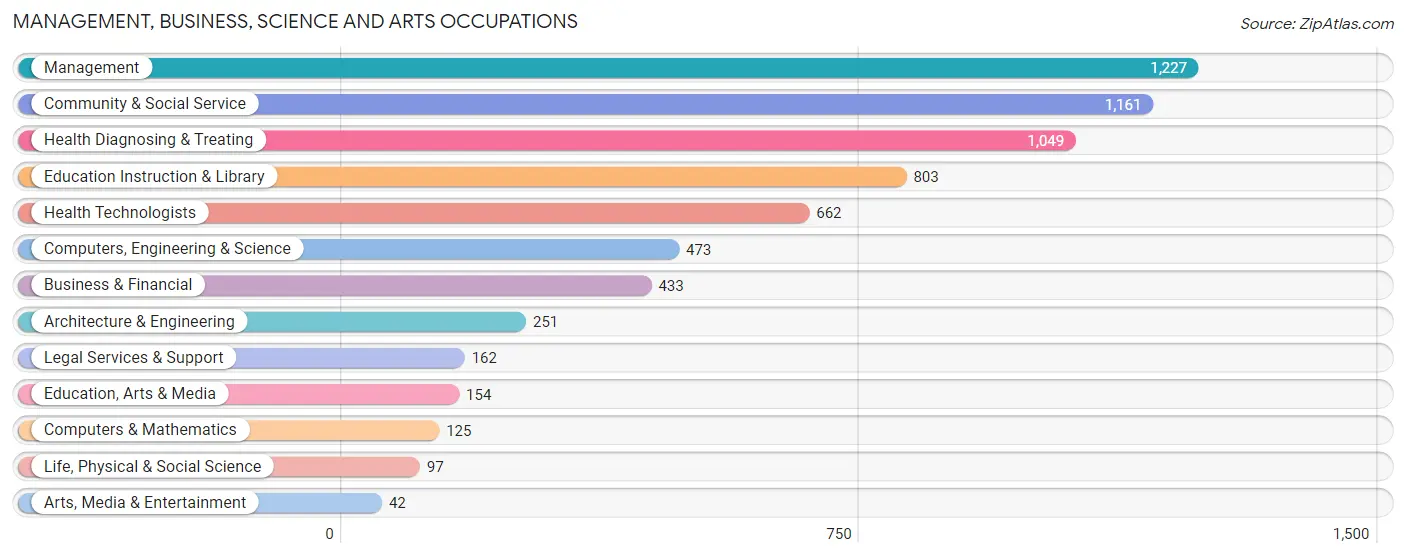
Management, Business, Science and Arts Occupations by Sex
Within the Management, Business, Science and Arts occupations in Alcorn County, the most male-oriented occupations are Arts, Media & Entertainment (100.0%), Architecture & Engineering (97.6%), and Computers, Engineering & Science (81.6%), while the most female-oriented occupations are Education Instruction & Library (94.5%), Legal Services & Support (83.3%), and Community & Social Service (81.8%).
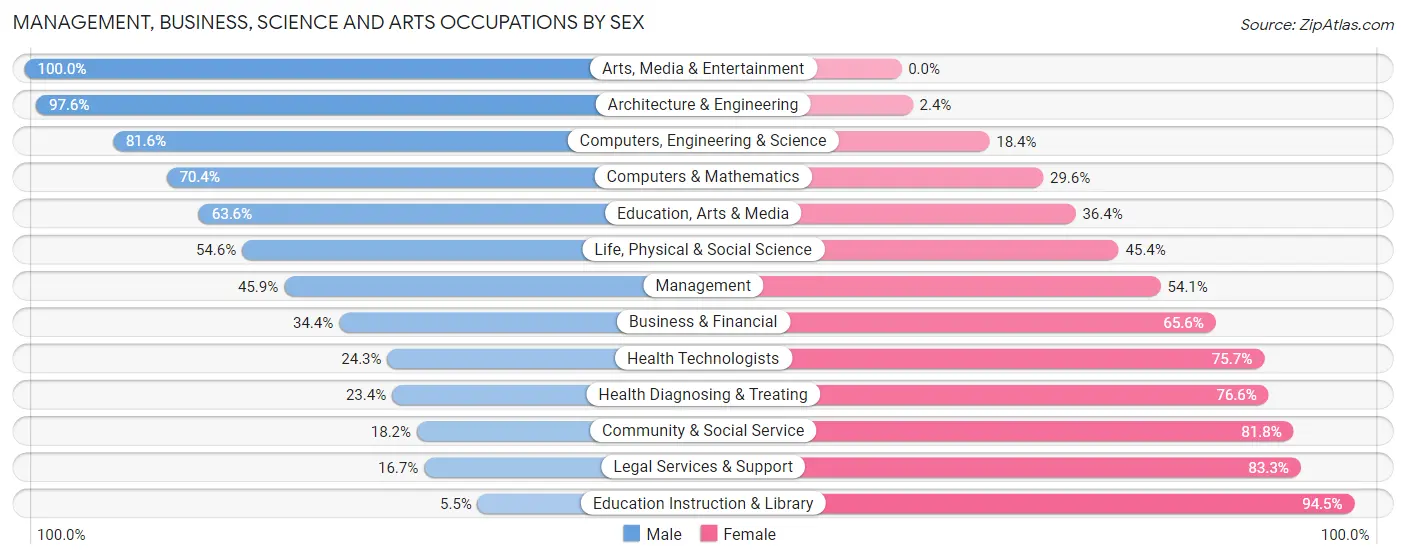
| Occupation | Male | Female |
| Management | 563 (45.9%) | 664 (54.1%) |
| Business & Financial | 149 (34.4%) | 284 (65.6%) |
| Computers, Engineering & Science | 386 (81.6%) | 87 (18.4%) |
| Computers & Mathematics | 88 (70.4%) | 37 (29.6%) |
| Architecture & Engineering | 245 (97.6%) | 6 (2.4%) |
| Life, Physical & Social Science | 53 (54.6%) | 44 (45.4%) |
| Community & Social Service | 211 (18.2%) | 950 (81.8%) |
| Education, Arts & Media | 98 (63.6%) | 56 (36.4%) |
| Legal Services & Support | 27 (16.7%) | 135 (83.3%) |
| Education Instruction & Library | 44 (5.5%) | 759 (94.5%) |
| Arts, Media & Entertainment | 42 (100.0%) | 0 (0.0%) |
| Health Diagnosing & Treating | 245 (23.4%) | 804 (76.6%) |
| Health Technologists | 161 (24.3%) | 501 (75.7%) |
| Total (Category) | 1,554 (35.8%) | 2,789 (64.2%) |
| Total (Overall) | 7,295 (50.8%) | 7,077 (49.2%) |
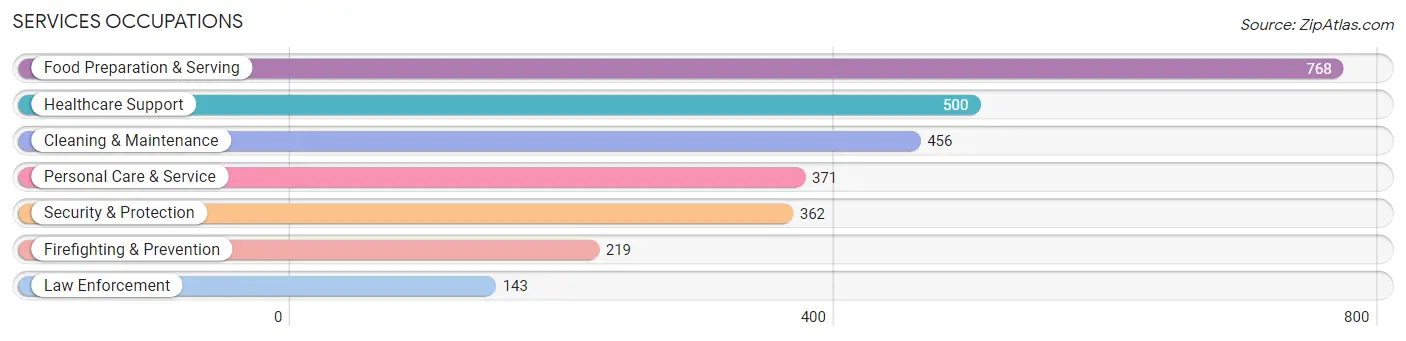
Services Occupations
The most common Services occupations in Alcorn County are Food Preparation & Serving (768 | 5.3%), Healthcare Support (500 | 3.5%), Cleaning & Maintenance (456 | 3.2%), Personal Care & Service (371 | 2.6%), and Security & Protection (362 | 2.5%).
Services Occupations by Sex
Within the Services occupations in Alcorn County, the most male-oriented occupations are Security & Protection (100.0%), Firefighting & Prevention (100.0%), and Law Enforcement (100.0%), while the most female-oriented occupations are Healthcare Support (94.4%), Personal Care & Service (83.3%), and Food Preparation & Serving (52.2%).
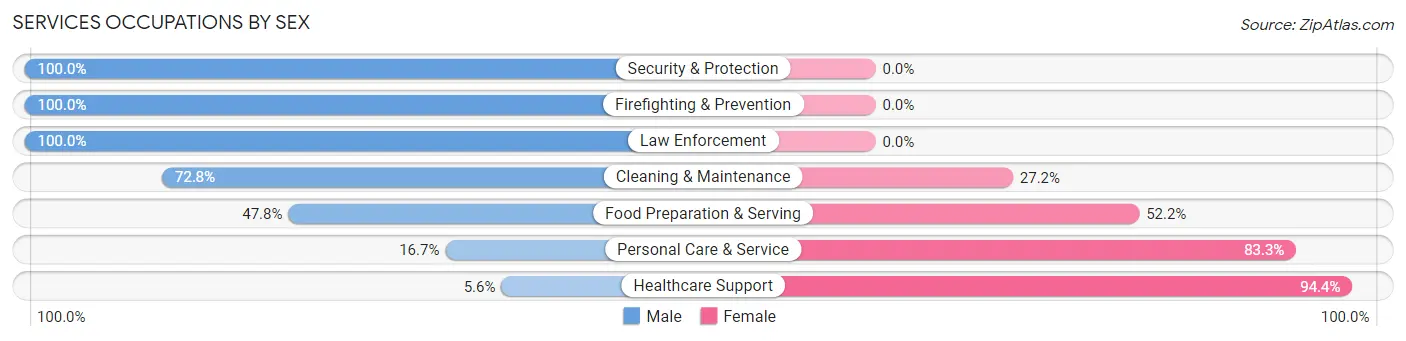
| Occupation | Male | Female |
| Healthcare Support | 28 (5.6%) | 472 (94.4%) |
| Security & Protection | 362 (100.0%) | 0 (0.0%) |
| Firefighting & Prevention | 219 (100.0%) | 0 (0.0%) |
| Law Enforcement | 143 (100.0%) | 0 (0.0%) |
| Food Preparation & Serving | 367 (47.8%) | 401 (52.2%) |
| Cleaning & Maintenance | 332 (72.8%) | 124 (27.2%) |
| Personal Care & Service | 62 (16.7%) | 309 (83.3%) |
| Total (Category) | 1,151 (46.9%) | 1,306 (53.1%) |
| Total (Overall) | 7,295 (50.8%) | 7,077 (49.2%) |
Sales and Office Occupations
The most common Sales and Office occupations in Alcorn County are Office & Administration (1,707 | 11.9%), and Sales & Related (1,317 | 9.2%).

Sales and Office Occupations by Sex

| Occupation | Male | Female |
| Sales & Related | 731 (55.5%) | 586 (44.5%) |
| Office & Administration | 338 (19.8%) | 1,369 (80.2%) |
| Total (Category) | 1,069 (35.3%) | 1,955 (64.6%) |
| Total (Overall) | 7,295 (50.8%) | 7,077 (49.2%) |
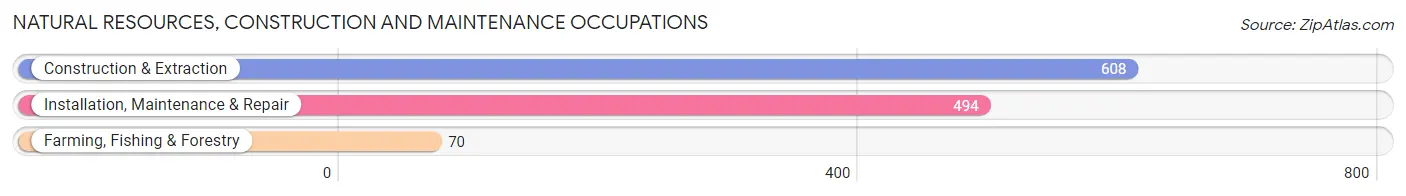
Natural Resources, Construction and Maintenance Occupations
The most common Natural Resources, Construction and Maintenance occupations in Alcorn County are Construction & Extraction (608 | 4.2%), Installation, Maintenance & Repair (494 | 3.4%), and Farming, Fishing & Forestry (70 | 0.5%).
Natural Resources, Construction and Maintenance Occupations by Sex
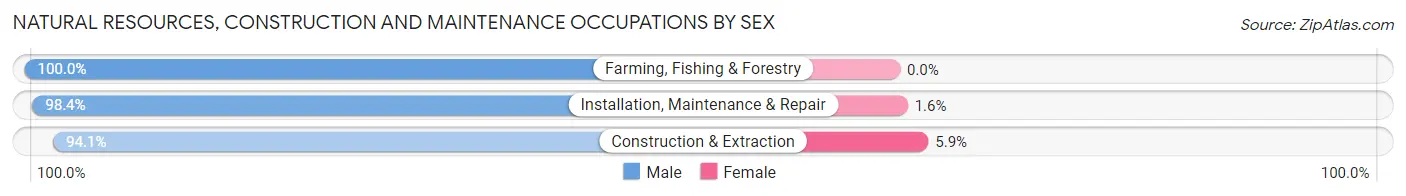
| Occupation | Male | Female |
| Farming, Fishing & Forestry | 70 (100.0%) | 0 (0.0%) |
| Construction & Extraction | 572 (94.1%) | 36 (5.9%) |
| Installation, Maintenance & Repair | 486 (98.4%) | 8 (1.6%) |
| Total (Category) | 1,128 (96.3%) | 44 (3.7%) |
| Total (Overall) | 7,295 (50.8%) | 7,077 (49.2%) |
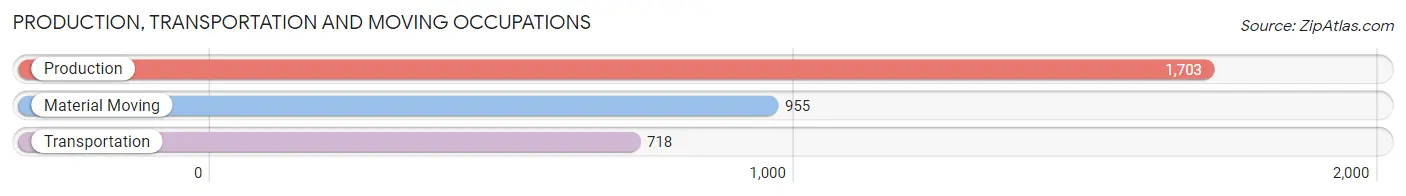
Production, Transportation and Moving Occupations
The most common Production, Transportation and Moving occupations in Alcorn County are Production (1,703 | 11.8%), Material Moving (955 | 6.6%), and Transportation (718 | 5.0%).
Production, Transportation and Moving Occupations by Sex
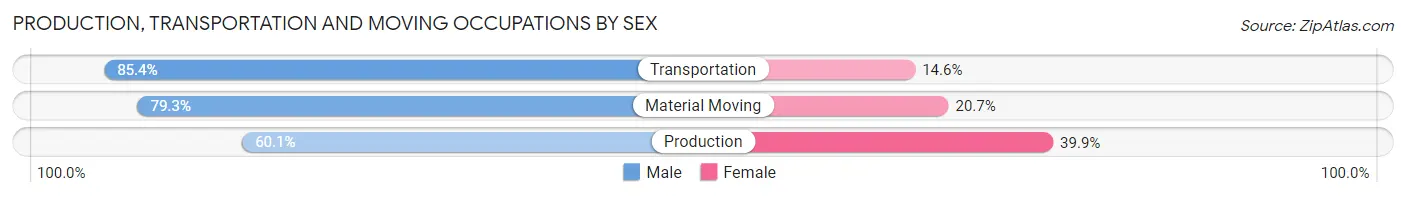
| Occupation | Male | Female |
| Production | 1,023 (60.1%) | 680 (39.9%) |
| Transportation | 613 (85.4%) | 105 (14.6%) |
| Material Moving | 757 (79.3%) | 198 (20.7%) |
| Total (Category) | 2,393 (70.9%) | 983 (29.1%) |
| Total (Overall) | 7,295 (50.8%) | 7,077 (49.2%) |
Employment Industries by Sex in Alcorn County
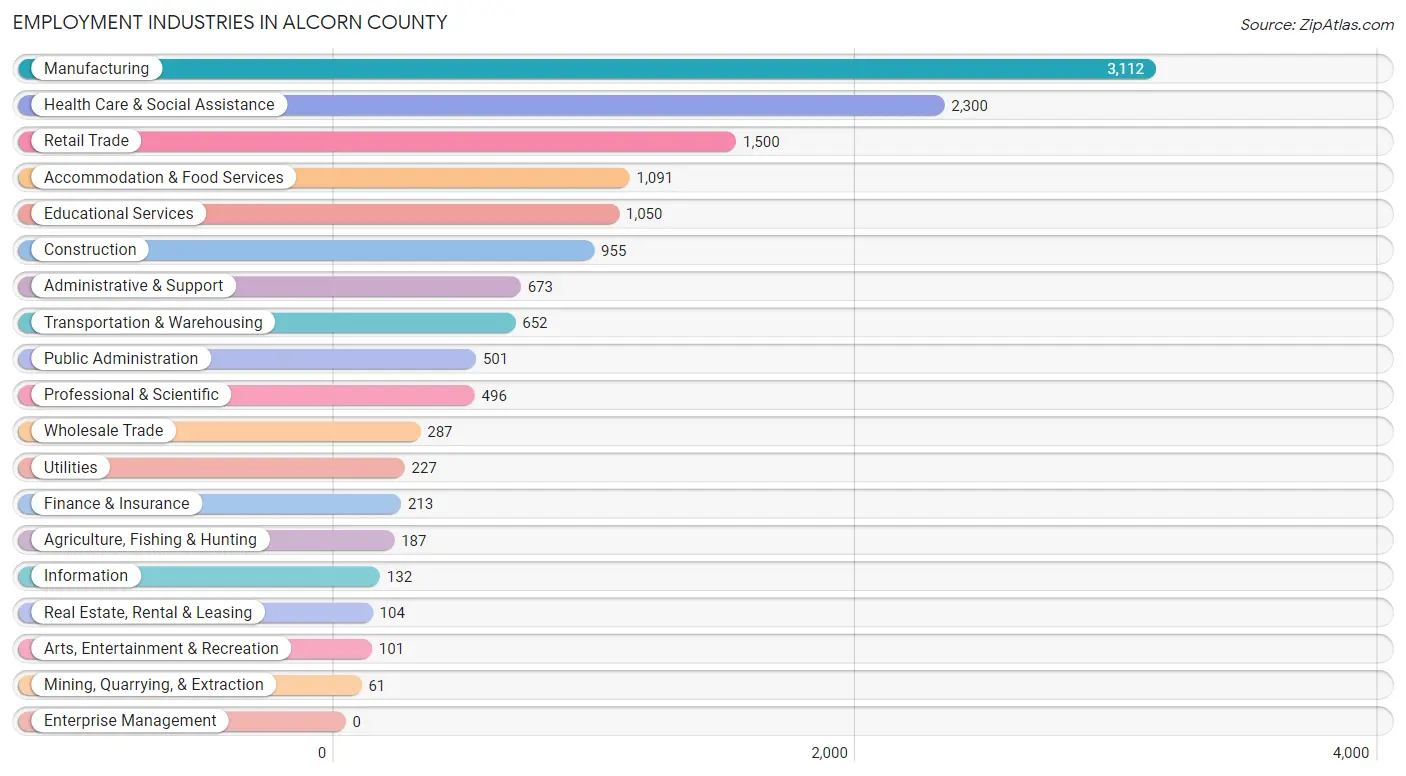
Employment Industries in Alcorn County
The major employment industries in Alcorn County include Manufacturing (3,112 | 21.6%), Health Care & Social Assistance (2,300 | 16.0%), Retail Trade (1,500 | 10.4%), Accommodation & Food Services (1,091 | 7.6%), and Educational Services (1,050 | 7.3%).
Employment Industries by Sex in Alcorn County
The Alcorn County industries that see more men than women are Mining, Quarrying, & Extraction (100.0%), Construction (91.5%), and Information (89.4%), whereas the industries that tend to have a higher number of women are Educational Services (86.3%), Health Care & Social Assistance (83.7%), and Arts, Entertainment & Recreation (68.3%).
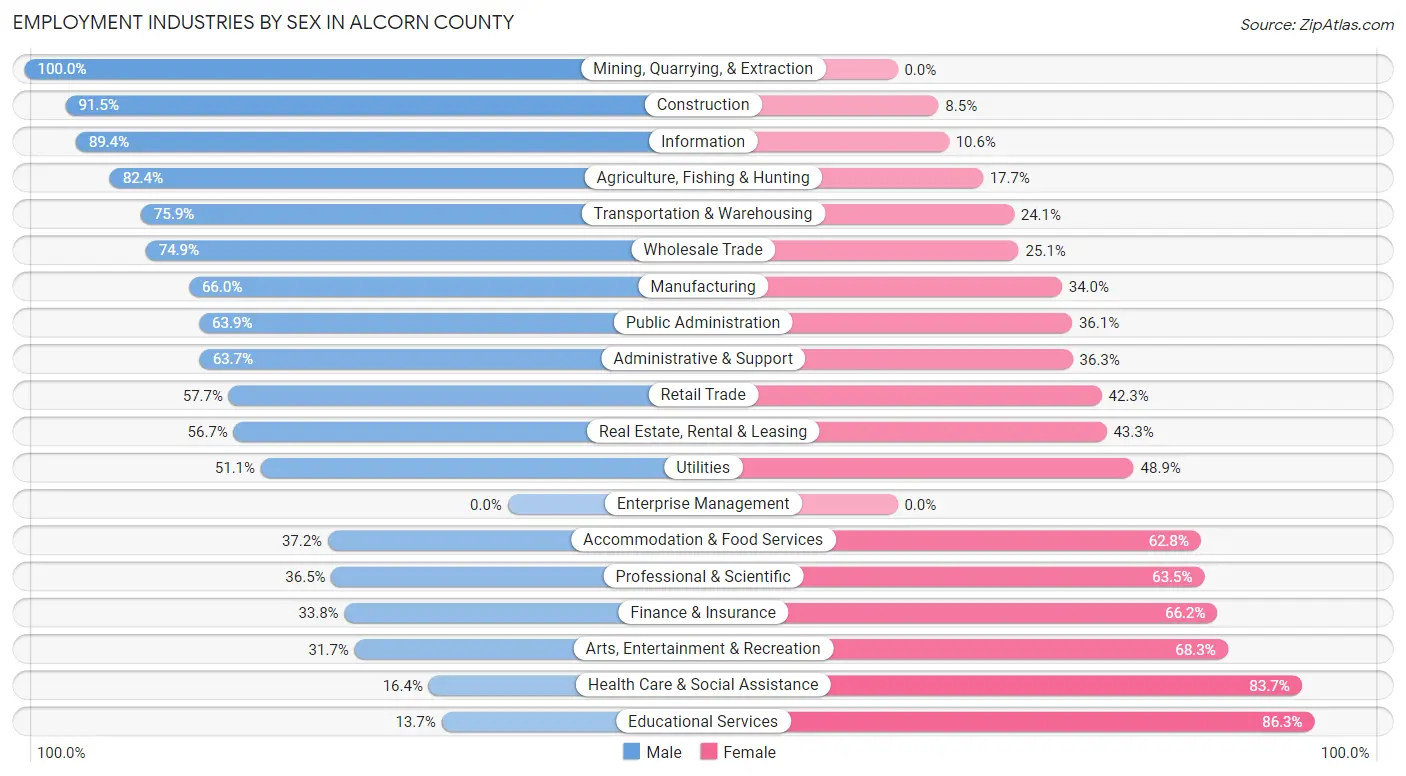
| Industry | Male | Female |
| Agriculture, Fishing & Hunting | 154 (82.4%) | 33 (17.6%) |
| Mining, Quarrying, & Extraction | 61 (100.0%) | 0 (0.0%) |
| Construction | 874 (91.5%) | 81 (8.5%) |
| Manufacturing | 2,053 (66.0%) | 1,059 (34.0%) |
| Wholesale Trade | 215 (74.9%) | 72 (25.1%) |
| Retail Trade | 866 (57.7%) | 634 (42.3%) |
| Transportation & Warehousing | 495 (75.9%) | 157 (24.1%) |
| Utilities | 116 (51.1%) | 111 (48.9%) |
| Information | 118 (89.4%) | 14 (10.6%) |
| Finance & Insurance | 72 (33.8%) | 141 (66.2%) |
| Real Estate, Rental & Leasing | 59 (56.7%) | 45 (43.3%) |
| Professional & Scientific | 181 (36.5%) | 315 (63.5%) |
| Enterprise Management | 0 (0.0%) | 0 (0.0%) |
| Administrative & Support | 429 (63.7%) | 244 (36.3%) |
| Educational Services | 144 (13.7%) | 906 (86.3%) |
| Health Care & Social Assistance | 376 (16.4%) | 1,924 (83.7%) |
| Arts, Entertainment & Recreation | 32 (31.7%) | 69 (68.3%) |
| Accommodation & Food Services | 406 (37.2%) | 685 (62.8%) |
| Public Administration | 320 (63.9%) | 181 (36.1%) |
| Total | 7,295 (50.8%) | 7,077 (49.2%) |
Education in Alcorn County
School Enrollment in Alcorn County
The most common levels of schooling among the 7,560 students in Alcorn County are elementary school (2,011 | 26.6%), middle school (1,722 | 22.8%), and high school (1,688 | 22.3%).
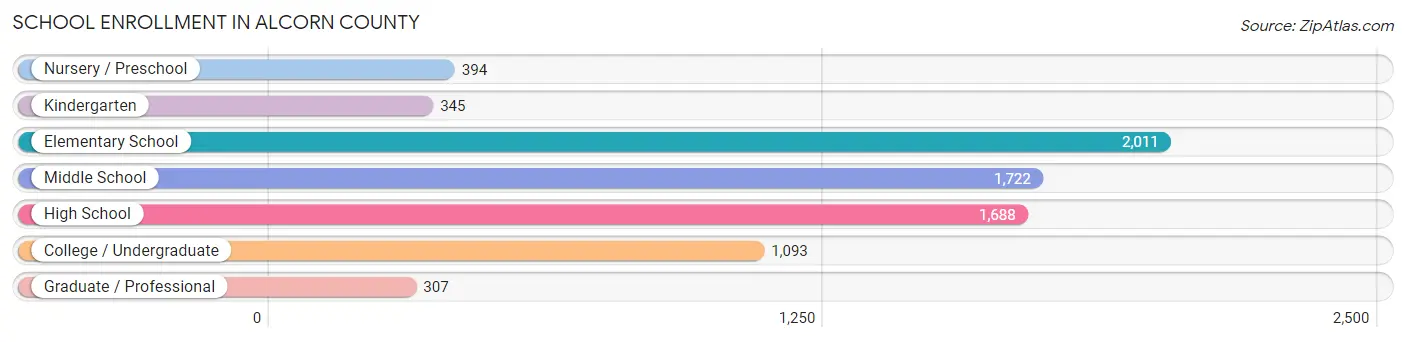
| School Level | # Students | % Students |
| Nursery / Preschool | 394 | 5.2% |
| Kindergarten | 345 | 4.6% |
| Elementary School | 2,011 | 26.6% |
| Middle School | 1,722 | 22.8% |
| High School | 1,688 | 22.3% |
| College / Undergraduate | 1,093 | 14.5% |
| Graduate / Professional | 307 | 4.1% |
| Total | 7,560 | 100.0% |
School Enrollment by Age by Funding Source in Alcorn County
Out of a total of 7,560 students who are enrolled in schools in Alcorn County, 597 (7.9%) attend a private institution, while the remaining 6,963 (92.1%) are enrolled in public schools. The age group of 35 years and over has the highest likelihood of being enrolled in private schools, with 91 (29.8% in the age bracket) enrolled. Conversely, the age group of 5 to 9 year old has the lowest likelihood of being enrolled in a private school, with 2,117 (96.2% in the age bracket) attending a public institution.
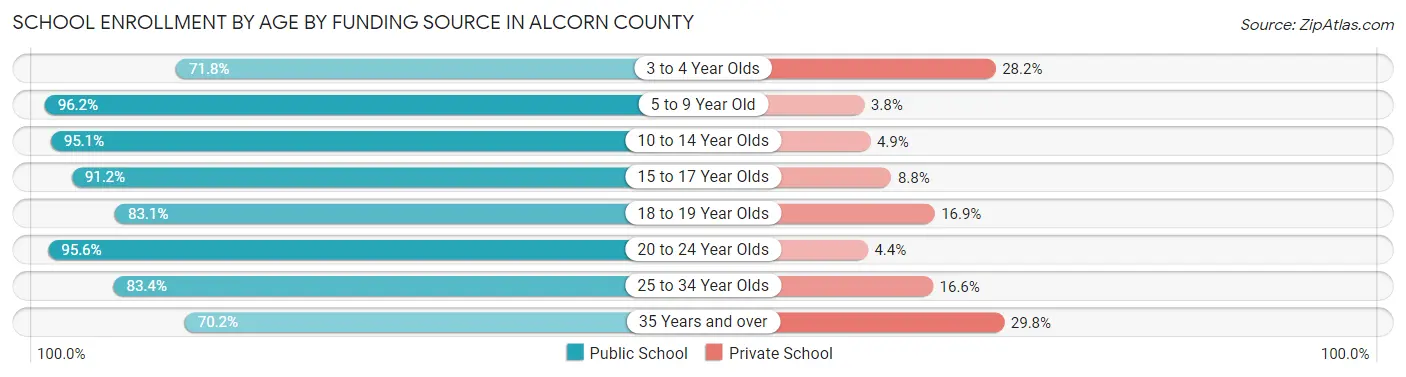
| Age Bracket | Public School | Private School |
| 3 to 4 Year Olds | 89 (71.8%) | 35 (28.2%) |
| 5 to 9 Year Old | 2,117 (96.2%) | 83 (3.8%) |
| 10 to 14 Year Olds | 2,140 (95.1%) | 110 (4.9%) |
| 15 to 17 Year Olds | 1,345 (91.2%) | 130 (8.8%) |
| 18 to 19 Year Olds | 355 (83.1%) | 72 (16.9%) |
| 20 to 24 Year Olds | 410 (95.6%) | 19 (4.4%) |
| 25 to 34 Year Olds | 292 (83.4%) | 58 (16.6%) |
| 35 Years and over | 214 (70.2%) | 91 (29.8%) |
| Total | 6,963 (92.1%) | 597 (7.9%) |
Educational Attainment by Field of Study in Alcorn County
Business (992 | 22.0%), education (937 | 20.8%), science & technology (632 | 14.0%), arts & humanities (337 | 7.5%), and literature & languages (290 | 6.4%) are the most common fields of study among 4,509 individuals in Alcorn County who have obtained a bachelor's degree or higher.
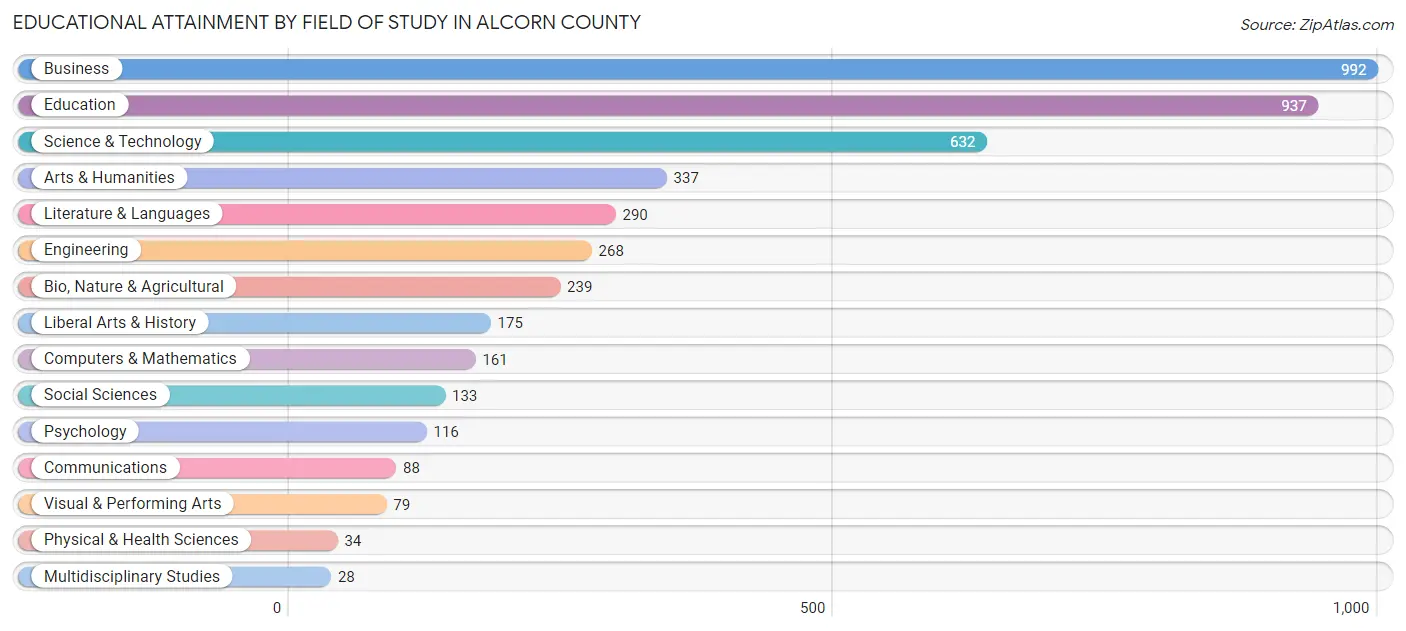
| Field of Study | # Graduates | % Graduates |
| Computers & Mathematics | 161 | 3.6% |
| Bio, Nature & Agricultural | 239 | 5.3% |
| Physical & Health Sciences | 34 | 0.7% |
| Psychology | 116 | 2.6% |
| Social Sciences | 133 | 2.9% |
| Engineering | 268 | 5.9% |
| Multidisciplinary Studies | 28 | 0.6% |
| Science & Technology | 632 | 14.0% |
| Business | 992 | 22.0% |
| Education | 937 | 20.8% |
| Literature & Languages | 290 | 6.4% |
| Liberal Arts & History | 175 | 3.9% |
| Visual & Performing Arts | 79 | 1.8% |
| Communications | 88 | 1.9% |
| Arts & Humanities | 337 | 7.5% |
| Total | 4,509 | 100.0% |
Transportation & Commute in Alcorn County
Vehicle Availability by Sex in Alcorn County
The most prevalent vehicle ownership categories in Alcorn County are males with 2 vehicles (2,987, accounting for 41.5%) and females with 2 vehicles (2,550, making up 42.4%).
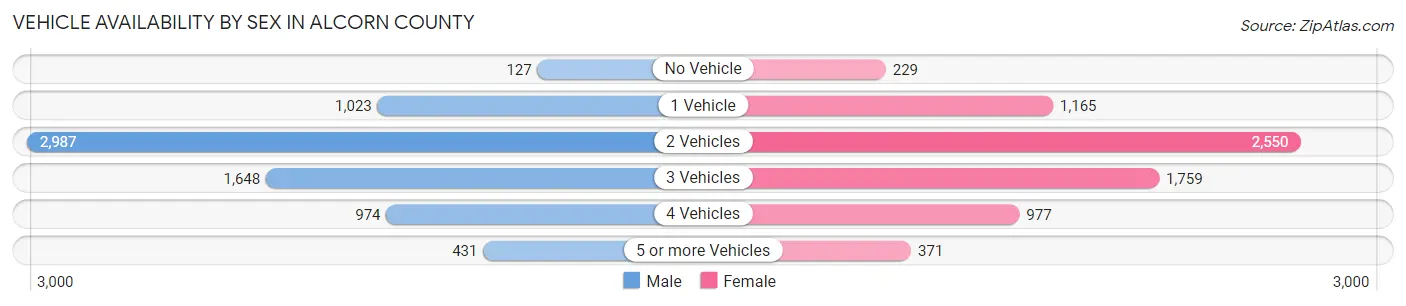
| Vehicles Available | Male | Female |
| No Vehicle | 127 (1.8%) | 229 (3.3%) |
| 1 Vehicle | 1,023 (14.2%) | 1,165 (16.5%) |
| 2 Vehicles | 2,987 (41.5%) | 2,550 (36.2%) |
| 3 Vehicles | 1,648 (22.9%) | 1,759 (24.9%) |
| 4 Vehicles | 974 (13.6%) | 977 (13.9%) |
| 5 or more Vehicles | 431 (6.0%) | 371 (5.3%) |
| Total | 7,190 (100.0%) | 7,051 (100.0%) |
Commute Time in Alcorn County
The most frequently occuring commute durations in Alcorn County are 15 to 19 minutes (2,727 commuters, 19.5%), 10 to 14 minutes (2,568 commuters, 18.3%), and 5 to 9 minutes (2,039 commuters, 14.6%).
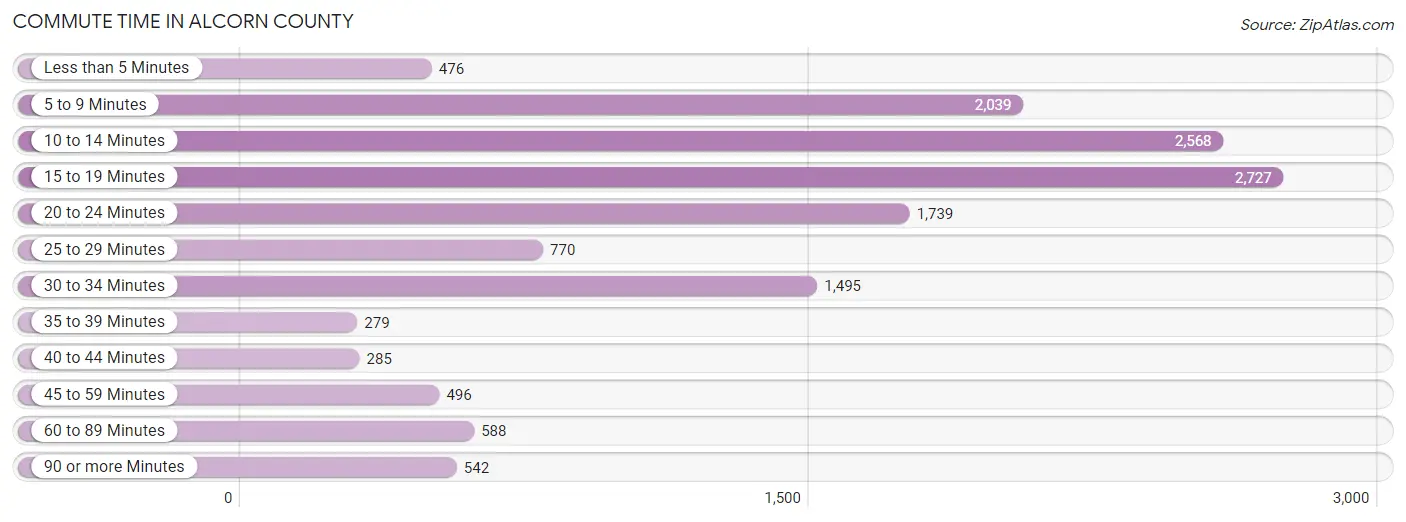
| Commute Time | # Commuters | % Commuters |
| Less than 5 Minutes | 476 | 3.4% |
| 5 to 9 Minutes | 2,039 | 14.6% |
| 10 to 14 Minutes | 2,568 | 18.3% |
| 15 to 19 Minutes | 2,727 | 19.5% |
| 20 to 24 Minutes | 1,739 | 12.4% |
| 25 to 29 Minutes | 770 | 5.5% |
| 30 to 34 Minutes | 1,495 | 10.7% |
| 35 to 39 Minutes | 279 | 2.0% |
| 40 to 44 Minutes | 285 | 2.0% |
| 45 to 59 Minutes | 496 | 3.5% |
| 60 to 89 Minutes | 588 | 4.2% |
| 90 or more Minutes | 542 | 3.9% |
Commute Time by Sex in Alcorn County
The most common commute times in Alcorn County are 15 to 19 minutes (1,411 commuters, 19.9%) for males and 10 to 14 minutes (1,496 commuters, 21.6%) for females.
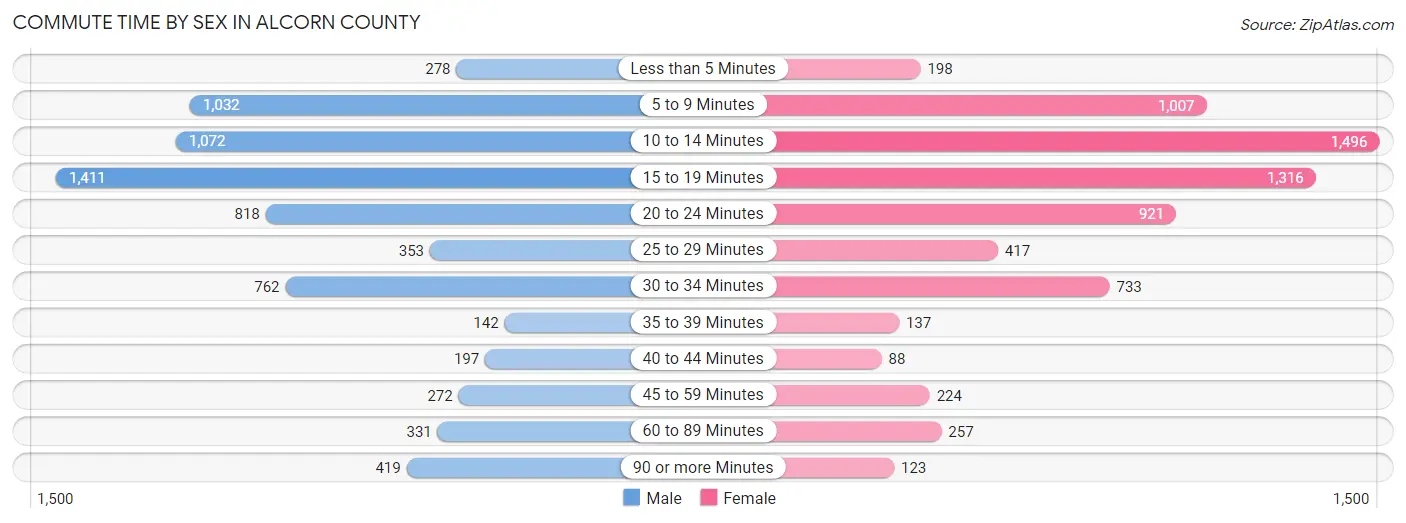
| Commute Time | Male | Female |
| Less than 5 Minutes | 278 (3.9%) | 198 (2.9%) |
| 5 to 9 Minutes | 1,032 (14.6%) | 1,007 (14.6%) |
| 10 to 14 Minutes | 1,072 (15.1%) | 1,496 (21.6%) |
| 15 to 19 Minutes | 1,411 (19.9%) | 1,316 (19.0%) |
| 20 to 24 Minutes | 818 (11.5%) | 921 (13.3%) |
| 25 to 29 Minutes | 353 (5.0%) | 417 (6.0%) |
| 30 to 34 Minutes | 762 (10.7%) | 733 (10.6%) |
| 35 to 39 Minutes | 142 (2.0%) | 137 (2.0%) |
| 40 to 44 Minutes | 197 (2.8%) | 88 (1.3%) |
| 45 to 59 Minutes | 272 (3.8%) | 224 (3.2%) |
| 60 to 89 Minutes | 331 (4.7%) | 257 (3.7%) |
| 90 or more Minutes | 419 (5.9%) | 123 (1.8%) |
Time of Departure to Work by Sex in Alcorn County
The most frequent times of departure to work in Alcorn County are 7:00 AM to 7:29 AM (1,254, 17.7%) for males and 7:00 AM to 7:29 AM (1,369, 19.8%) for females.
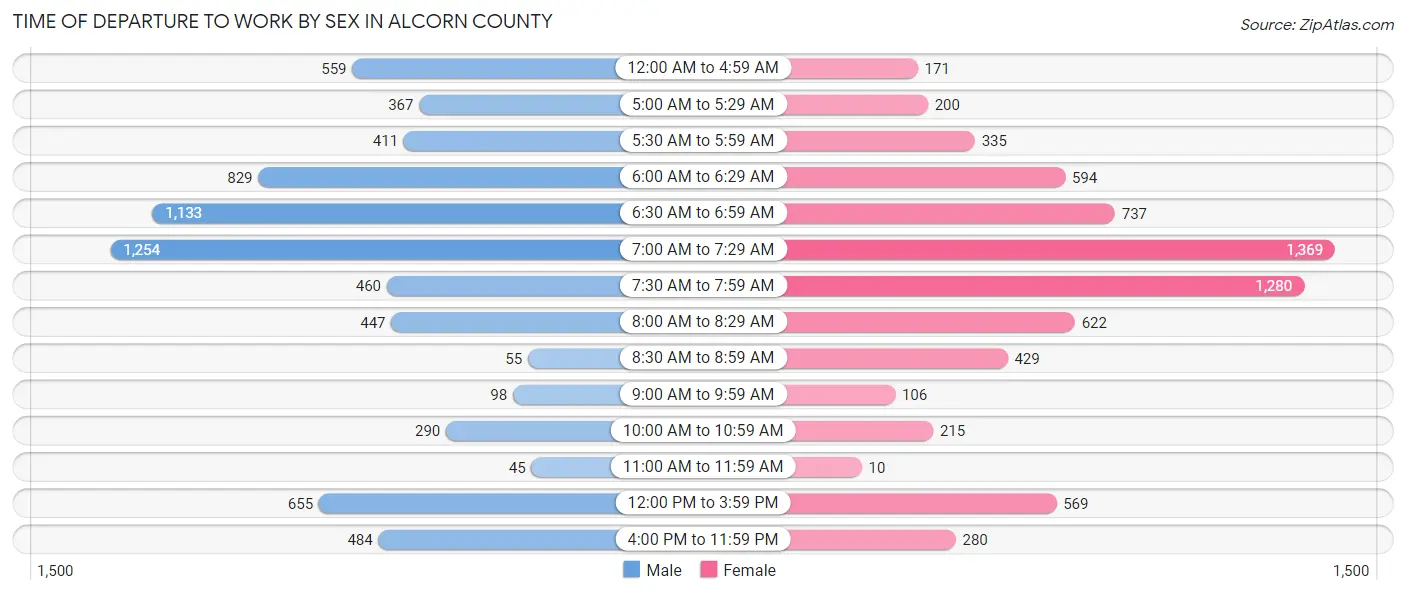
| Time of Departure | Male | Female |
| 12:00 AM to 4:59 AM | 559 (7.9%) | 171 (2.5%) |
| 5:00 AM to 5:29 AM | 367 (5.2%) | 200 (2.9%) |
| 5:30 AM to 5:59 AM | 411 (5.8%) | 335 (4.8%) |
| 6:00 AM to 6:29 AM | 829 (11.7%) | 594 (8.6%) |
| 6:30 AM to 6:59 AM | 1,133 (16.0%) | 737 (10.6%) |
| 7:00 AM to 7:29 AM | 1,254 (17.7%) | 1,369 (19.8%) |
| 7:30 AM to 7:59 AM | 460 (6.5%) | 1,280 (18.5%) |
| 8:00 AM to 8:29 AM | 447 (6.3%) | 622 (9.0%) |
| 8:30 AM to 8:59 AM | 55 (0.8%) | 429 (6.2%) |
| 9:00 AM to 9:59 AM | 98 (1.4%) | 106 (1.5%) |
| 10:00 AM to 10:59 AM | 290 (4.1%) | 215 (3.1%) |
| 11:00 AM to 11:59 AM | 45 (0.6%) | 10 (0.1%) |
| 12:00 PM to 3:59 PM | 655 (9.2%) | 569 (8.2%) |
| 4:00 PM to 11:59 PM | 484 (6.8%) | 280 (4.1%) |
| Total | 7,087 (100.0%) | 6,917 (100.0%) |
Housing Occupancy in Alcorn County
Occupancy by Ownership in Alcorn County
Of the total 13,975 dwellings in Alcorn County, owner-occupied units account for 9,211 (65.9%), while renter-occupied units make up 4,764 (34.1%).
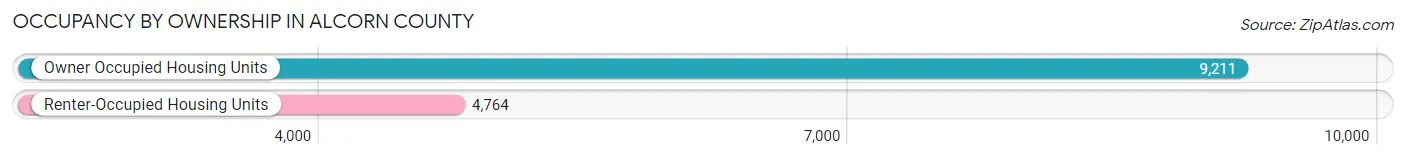
| Occupancy | # Housing Units | % Housing Units |
| Owner Occupied Housing Units | 9,211 | 65.9% |
| Renter-Occupied Housing Units | 4,764 | 34.1% |
| Total Occupied Housing Units | 13,975 | 100.0% |
Occupancy by Household Size in Alcorn County
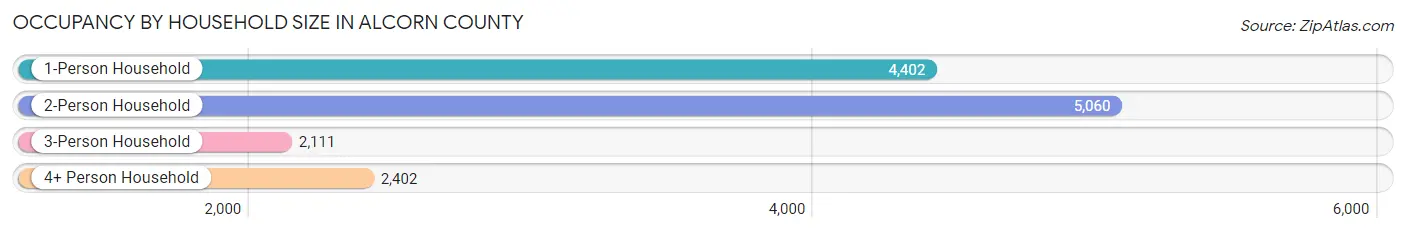
| Household Size | # Housing Units | % Housing Units |
| 1-Person Household | 4,402 | 31.5% |
| 2-Person Household | 5,060 | 36.2% |
| 3-Person Household | 2,111 | 15.1% |
| 4+ Person Household | 2,402 | 17.2% |
| Total Housing Units | 13,975 | 100.0% |
Occupancy by Ownership by Household Size in Alcorn County
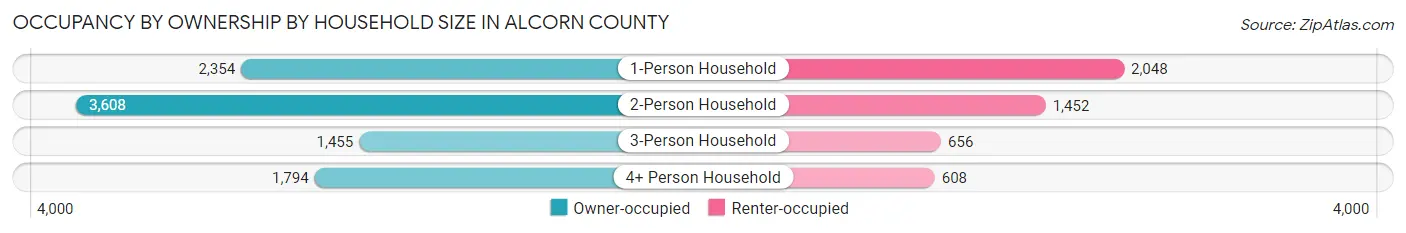
| Household Size | Owner-occupied | Renter-occupied |
| 1-Person Household | 2,354 (53.5%) | 2,048 (46.5%) |
| 2-Person Household | 3,608 (71.3%) | 1,452 (28.7%) |
| 3-Person Household | 1,455 (68.9%) | 656 (31.1%) |
| 4+ Person Household | 1,794 (74.7%) | 608 (25.3%) |
| Total Housing Units | 9,211 (65.9%) | 4,764 (34.1%) |
Occupancy by Educational Attainment in Alcorn County
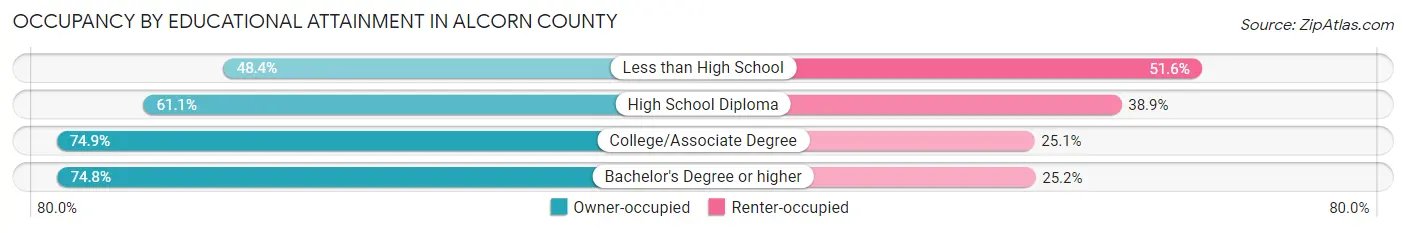
| Household Size | Owner-occupied | Renter-occupied |
| Less than High School | 1,132 (48.4%) | 1,207 (51.6%) |
| High School Diploma | 2,806 (61.1%) | 1,785 (38.9%) |
| College/Associate Degree | 3,294 (74.9%) | 1,104 (25.1%) |
| Bachelor's Degree or higher | 1,979 (74.8%) | 668 (25.2%) |
Occupancy by Age of Householder in Alcorn County
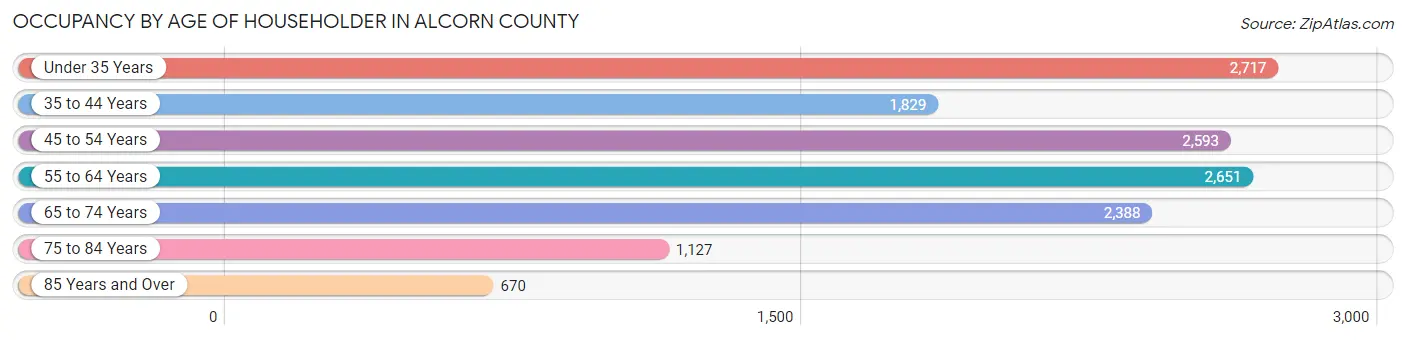
| Age Bracket | # Households | % Households |
| Under 35 Years | 2,717 | 19.4% |
| 35 to 44 Years | 1,829 | 13.1% |
| 45 to 54 Years | 2,593 | 18.5% |
| 55 to 64 Years | 2,651 | 19.0% |
| 65 to 74 Years | 2,388 | 17.1% |
| 75 to 84 Years | 1,127 | 8.1% |
| 85 Years and Over | 670 | 4.8% |
| Total | 13,975 | 100.0% |
Housing Finances in Alcorn County
Median Income by Occupancy in Alcorn County
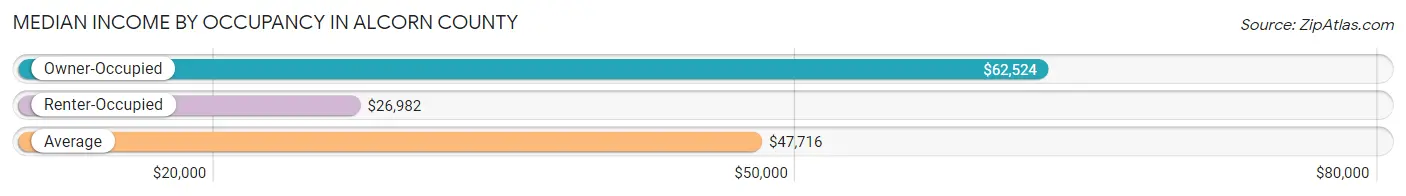
| Occupancy Type | # Households | Median Income |
| Owner-Occupied | 9,211 (65.9%) | $62,524 |
| Renter-Occupied | 4,764 (34.1%) | $26,982 |
| Average | 13,975 (100.0%) | $47,716 |
Occupancy by Householder Income Bracket in Alcorn County
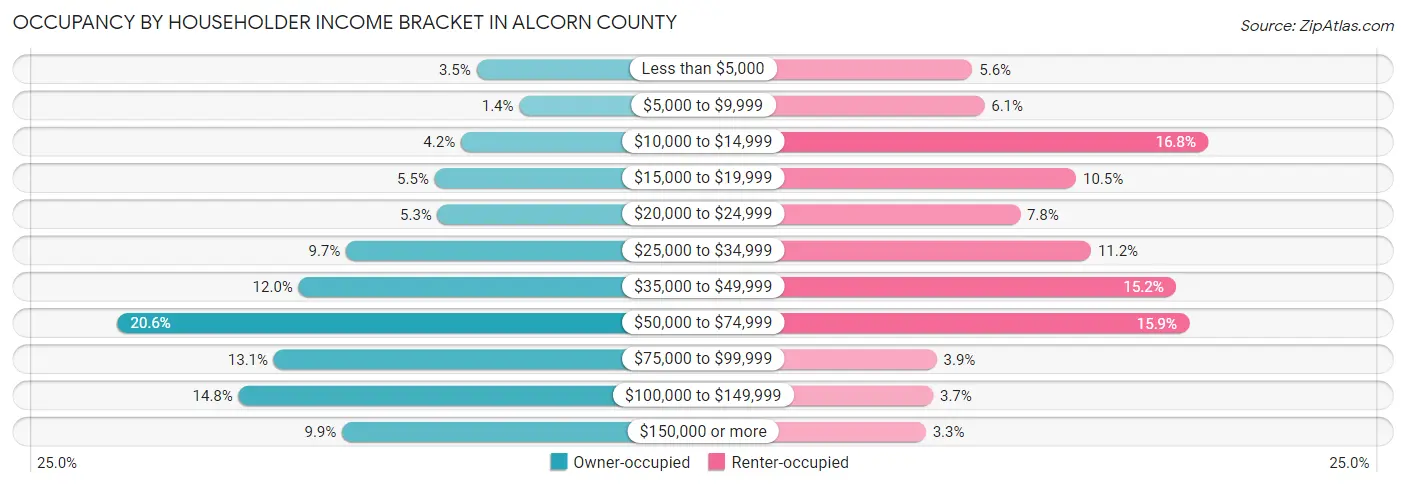
| Income Bracket | Owner-occupied | Renter-occupied |
| Less than $5,000 | 321 (3.5%) | 265 (5.6%) |
| $5,000 to $9,999 | 133 (1.4%) | 292 (6.1%) |
| $10,000 to $14,999 | 389 (4.2%) | 799 (16.8%) |
| $15,000 to $19,999 | 504 (5.5%) | 500 (10.5%) |
| $20,000 to $24,999 | 491 (5.3%) | 373 (7.8%) |
| $25,000 to $34,999 | 893 (9.7%) | 534 (11.2%) |
| $35,000 to $49,999 | 1,101 (11.9%) | 726 (15.2%) |
| $50,000 to $74,999 | 1,896 (20.6%) | 756 (15.9%) |
| $75,000 to $99,999 | 1,209 (13.1%) | 184 (3.9%) |
| $100,000 to $149,999 | 1,364 (14.8%) | 176 (3.7%) |
| $150,000 or more | 910 (9.9%) | 159 (3.3%) |
| Total | 9,211 (100.0%) | 4,764 (100.0%) |
Monthly Housing Cost Tiers in Alcorn County
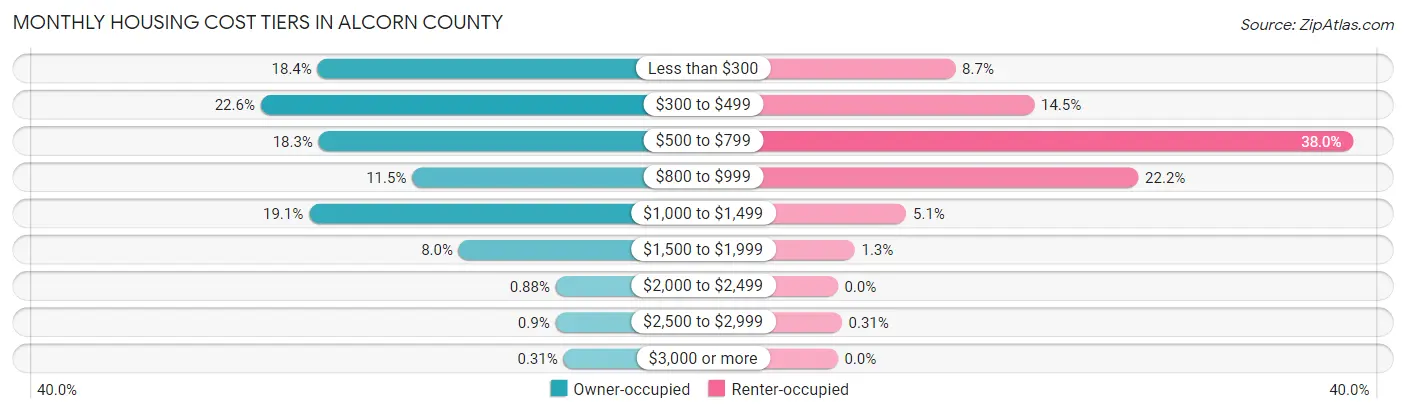
| Monthly Cost | Owner-occupied | Renter-occupied |
| Less than $300 | 1,697 (18.4%) | 413 (8.7%) |
| $300 to $499 | 2,083 (22.6%) | 690 (14.5%) |
| $500 to $799 | 1,689 (18.3%) | 1,810 (38.0%) |
| $800 to $999 | 1,055 (11.5%) | 1,055 (22.2%) |
| $1,000 to $1,499 | 1,755 (19.1%) | 241 (5.1%) |
| $1,500 to $1,999 | 739 (8.0%) | 60 (1.3%) |
| $2,000 to $2,499 | 81 (0.9%) | 0 (0.0%) |
| $2,500 to $2,999 | 83 (0.9%) | 15 (0.3%) |
| $3,000 or more | 29 (0.3%) | 0 (0.0%) |
| Total | 9,211 (100.0%) | 4,764 (100.0%) |
Physical Housing Characteristics in Alcorn County
Housing Structures in Alcorn County
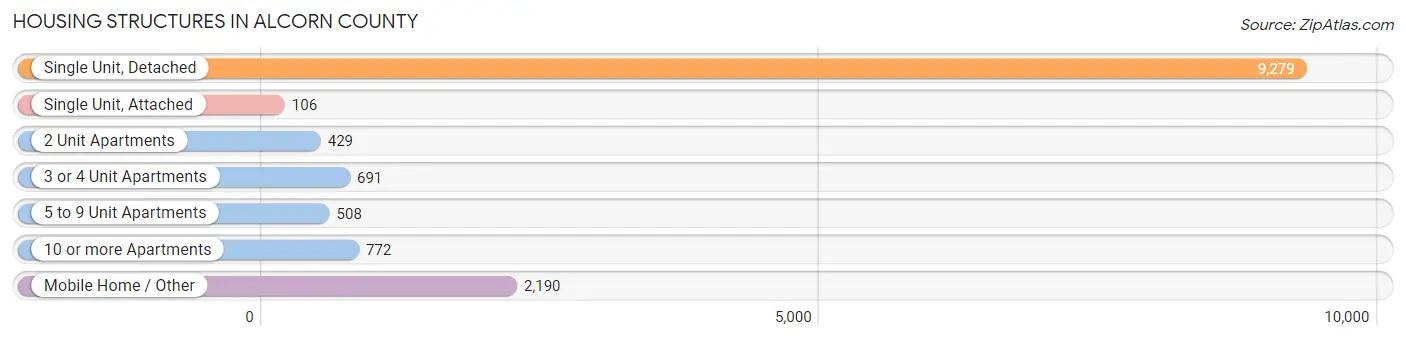
| Structure Type | # Housing Units | % Housing Units |
| Single Unit, Detached | 9,279 | 66.4% |
| Single Unit, Attached | 106 | 0.8% |
| 2 Unit Apartments | 429 | 3.1% |
| 3 or 4 Unit Apartments | 691 | 4.9% |
| 5 to 9 Unit Apartments | 508 | 3.6% |
| 10 or more Apartments | 772 | 5.5% |
| Mobile Home / Other | 2,190 | 15.7% |
| Total | 13,975 | 100.0% |
Housing Structures by Occupancy in Alcorn County
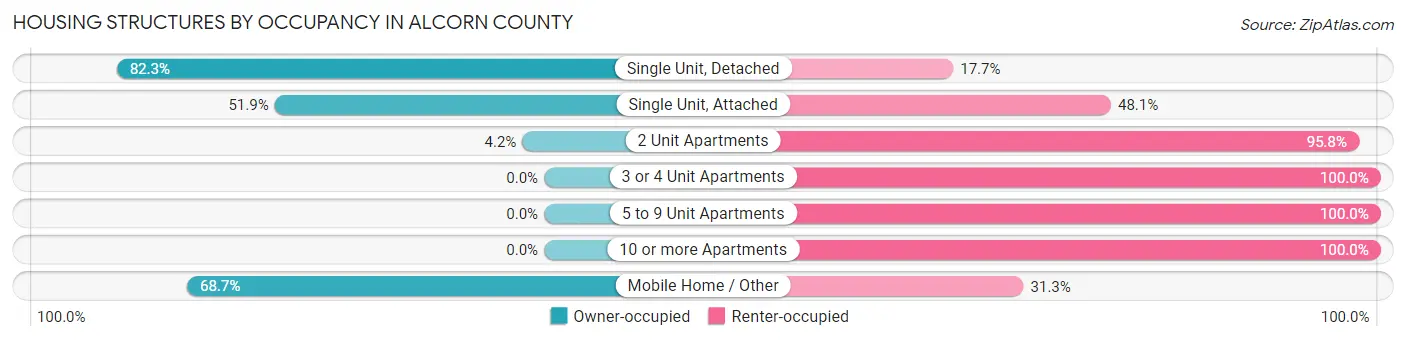
| Structure Type | Owner-occupied | Renter-occupied |
| Single Unit, Detached | 7,633 (82.3%) | 1,646 (17.7%) |
| Single Unit, Attached | 55 (51.9%) | 51 (48.1%) |
| 2 Unit Apartments | 18 (4.2%) | 411 (95.8%) |
| 3 or 4 Unit Apartments | 0 (0.0%) | 691 (100.0%) |
| 5 to 9 Unit Apartments | 0 (0.0%) | 508 (100.0%) |
| 10 or more Apartments | 0 (0.0%) | 772 (100.0%) |
| Mobile Home / Other | 1,505 (68.7%) | 685 (31.3%) |
| Total | 9,211 (65.9%) | 4,764 (34.1%) |
Housing Structures by Number of Rooms in Alcorn County
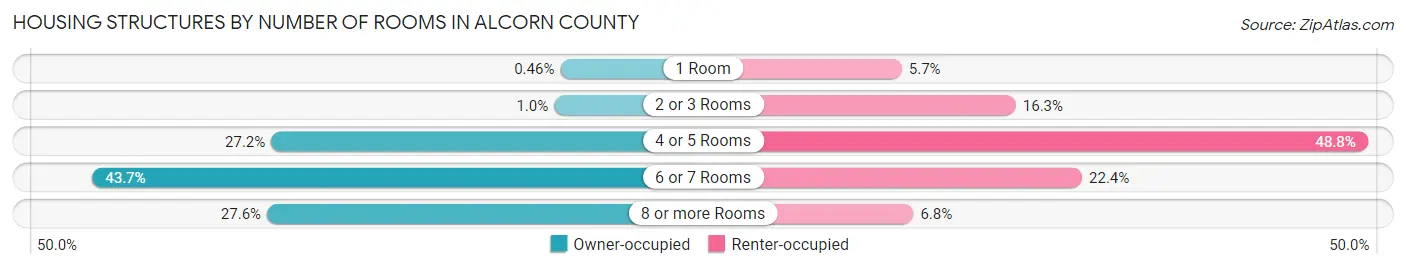
| Number of Rooms | Owner-occupied | Renter-occupied |
| 1 Room | 42 (0.5%) | 273 (5.7%) |
| 2 or 3 Rooms | 95 (1.0%) | 775 (16.3%) |
| 4 or 5 Rooms | 2,505 (27.2%) | 2,325 (48.8%) |
| 6 or 7 Rooms | 4,028 (43.7%) | 1,067 (22.4%) |
| 8 or more Rooms | 2,541 (27.6%) | 324 (6.8%) |
| Total | 9,211 (100.0%) | 4,764 (100.0%) |
Housing Structure by Heating Type in Alcorn County
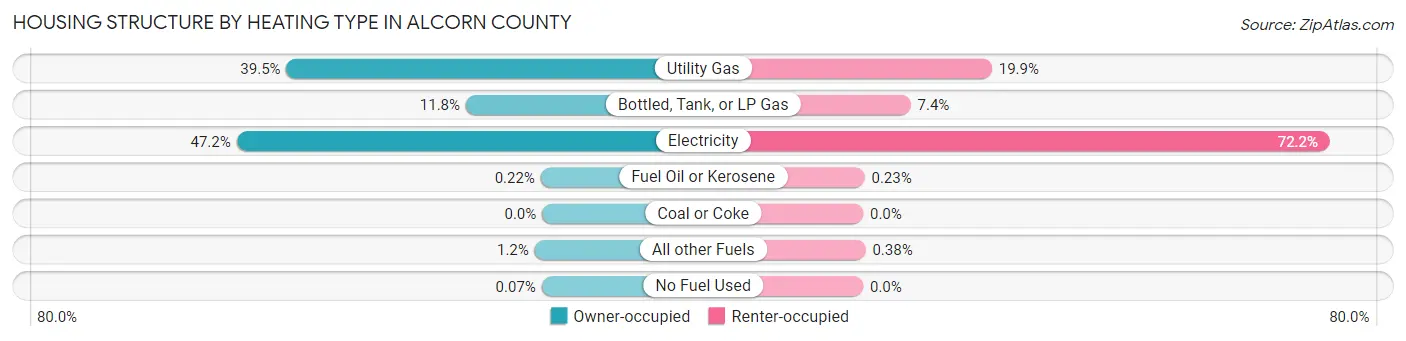
| Heating Type | Owner-occupied | Renter-occupied |
| Utility Gas | 3,641 (39.5%) | 948 (19.9%) |
| Bottled, Tank, or LP Gas | 1,086 (11.8%) | 350 (7.3%) |
| Electricity | 4,351 (47.2%) | 3,437 (72.2%) |
| Fuel Oil or Kerosene | 20 (0.2%) | 11 (0.2%) |
| Coal or Coke | 0 (0.0%) | 0 (0.0%) |
| All other Fuels | 107 (1.2%) | 18 (0.4%) |
| No Fuel Used | 6 (0.1%) | 0 (0.0%) |
| Total | 9,211 (100.0%) | 4,764 (100.0%) |
Household Vehicle Usage in Alcorn County
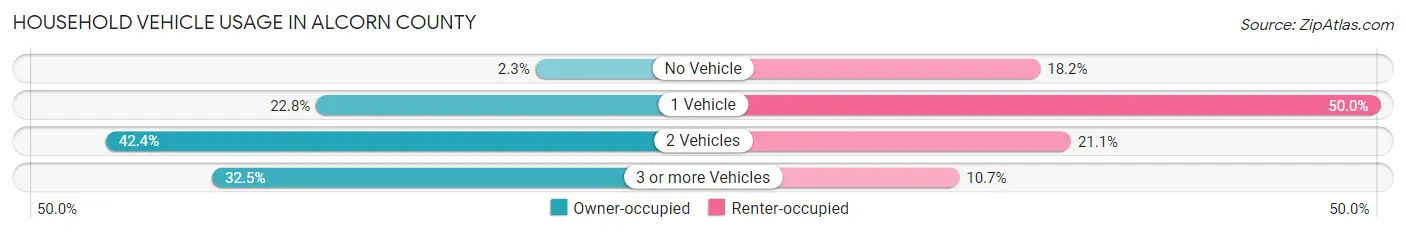
| Vehicles per Household | Owner-occupied | Renter-occupied |
| No Vehicle | 213 (2.3%) | 869 (18.2%) |
| 1 Vehicle | 2,098 (22.8%) | 2,381 (50.0%) |
| 2 Vehicles | 3,906 (42.4%) | 1,005 (21.1%) |
| 3 or more Vehicles | 2,994 (32.5%) | 509 (10.7%) |
| Total | 9,211 (100.0%) | 4,764 (100.0%) |
Real Estate & Mortgages in Alcorn County
Real Estate and Mortgage Overview in Alcorn County
| Characteristic | Without Mortgage | With Mortgage |
| Housing Units | 4,979 | 4,232 |
| Median Property Value | $104,000 | $149,500 |
| Median Household Income | $49,445 | $531 |
| Monthly Housing Costs | $374 | $29 |
| Real Estate Taxes | $634 | $939 |
Property Value by Mortgage Status in Alcorn County
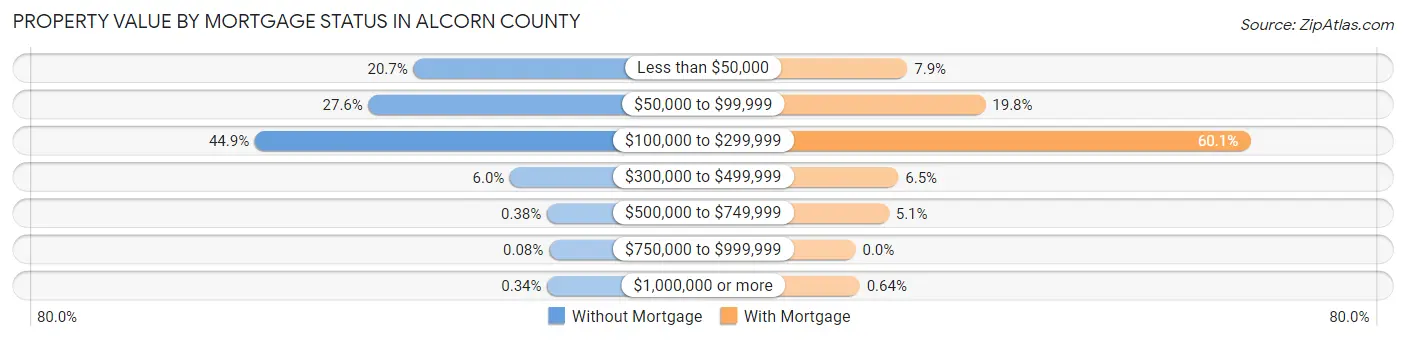
| Property Value | Without Mortgage | With Mortgage |
| Less than $50,000 | 1,032 (20.7%) | 334 (7.9%) |
| $50,000 to $99,999 | 1,373 (27.6%) | 837 (19.8%) |
| $100,000 to $299,999 | 2,235 (44.9%) | 2,544 (60.1%) |
| $300,000 to $499,999 | 299 (6.0%) | 276 (6.5%) |
| $500,000 to $749,999 | 19 (0.4%) | 214 (5.1%) |
| $750,000 to $999,999 | 4 (0.1%) | 0 (0.0%) |
| $1,000,000 or more | 17 (0.3%) | 27 (0.6%) |
| Total | 4,979 (100.0%) | 4,232 (100.0%) |
Household Income by Mortgage Status in Alcorn County
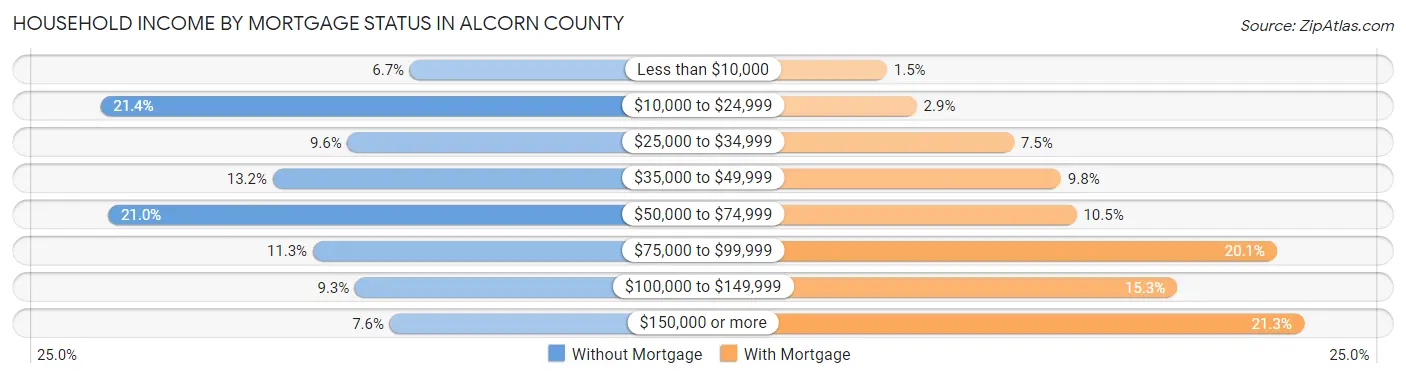
| Household Income | Without Mortgage | With Mortgage |
| Less than $10,000 | 331 (6.7%) | 63 (1.5%) |
| $10,000 to $24,999 | 1,065 (21.4%) | 123 (2.9%) |
| $25,000 to $34,999 | 479 (9.6%) | 319 (7.5%) |
| $35,000 to $49,999 | 656 (13.2%) | 414 (9.8%) |
| $50,000 to $74,999 | 1,047 (21.0%) | 445 (10.5%) |
| $75,000 to $99,999 | 561 (11.3%) | 849 (20.1%) |
| $100,000 to $149,999 | 461 (9.3%) | 648 (15.3%) |
| $150,000 or more | 379 (7.6%) | 903 (21.3%) |
| Total | 4,979 (100.0%) | 4,232 (100.0%) |
Property Value to Household Income Ratio in Alcorn County
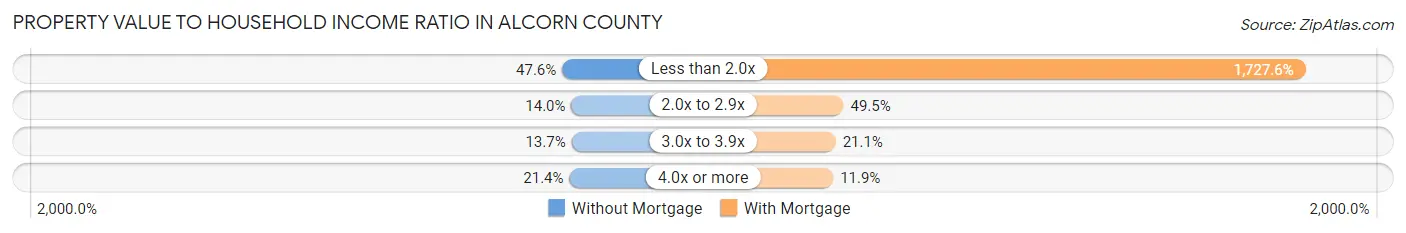
| Value-to-Income Ratio | Without Mortgage | With Mortgage |
| Less than 2.0x | 2,371 (47.6%) | 73,111 (1,727.6%) |
| 2.0x to 2.9x | 698 (14.0%) | 2,094 (49.5%) |
| 3.0x to 3.9x | 680 (13.7%) | 891 (21.0%) |
| 4.0x or more | 1,066 (21.4%) | 505 (11.9%) |
| Total | 4,979 (100.0%) | 4,232 (100.0%) |
Real Estate Taxes by Mortgage Status in Alcorn County
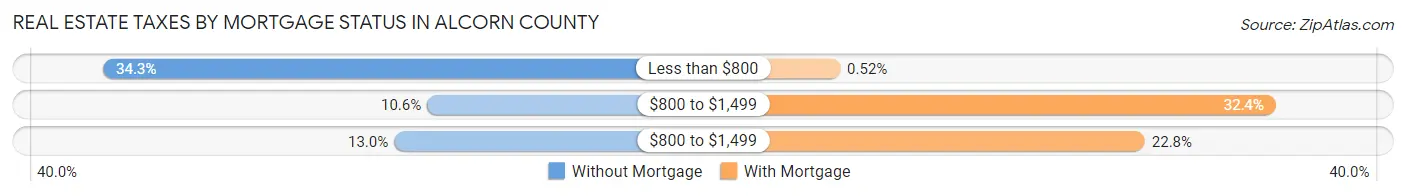
| Property Taxes | Without Mortgage | With Mortgage |
| Less than $800 | 1,706 (34.3%) | 22 (0.5%) |
| $800 to $1,499 | 528 (10.6%) | 1,369 (32.4%) |
| $800 to $1,499 | 648 (13.0%) | 964 (22.8%) |
| Total | 4,979 (100.0%) | 4,232 (100.0%) |
Health & Disability in Alcorn County
Health Insurance Coverage by Age in Alcorn County
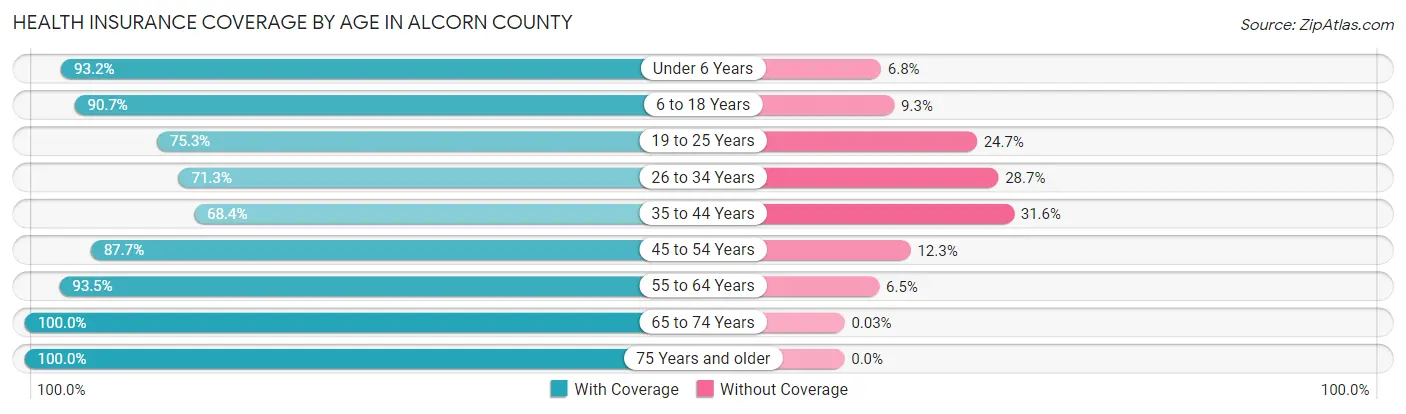
| Age Bracket | With Coverage | Without Coverage |
| Under 6 Years | 2,133 (93.2%) | 156 (6.8%) |
| 6 to 18 Years | 5,401 (90.7%) | 554 (9.3%) |
| 19 to 25 Years | 2,156 (75.3%) | 707 (24.7%) |
| 26 to 34 Years | 2,759 (71.3%) | 1,111 (28.7%) |
| 35 to 44 Years | 2,726 (68.4%) | 1,260 (31.6%) |
| 45 to 54 Years | 3,907 (87.7%) | 550 (12.3%) |
| 55 to 64 Years | 4,135 (93.5%) | 287 (6.5%) |
| 65 to 74 Years | 3,612 (100.0%) | 1 (0.0%) |
| 75 Years and older | 2,502 (100.0%) | 0 (0.0%) |
| Total | 29,331 (86.4%) | 4,626 (13.6%) |
Health Insurance Coverage by Citizenship Status in Alcorn County
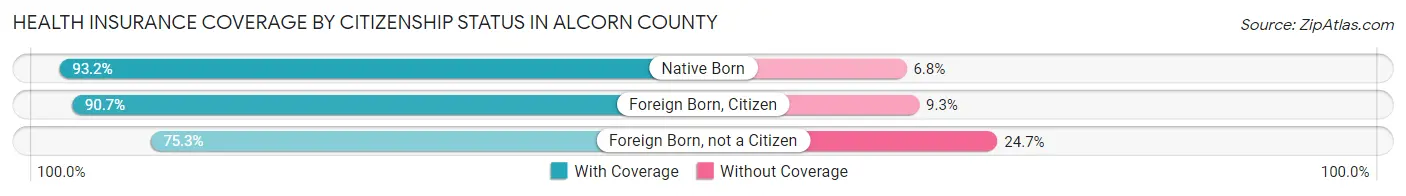
| Citizenship Status | With Coverage | Without Coverage |
| Native Born | 2,133 (93.2%) | 156 (6.8%) |
| Foreign Born, Citizen | 5,401 (90.7%) | 554 (9.3%) |
| Foreign Born, not a Citizen | 2,156 (75.3%) | 707 (24.7%) |
Health Insurance Coverage by Household Income in Alcorn County
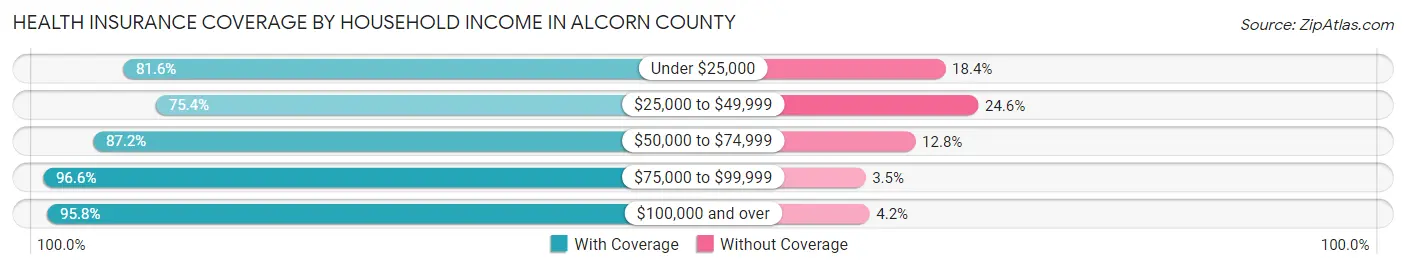
| Household Income | With Coverage | Without Coverage |
| Under $25,000 | 5,405 (81.6%) | 1,221 (18.4%) |
| $25,000 to $49,999 | 6,042 (75.4%) | 1,970 (24.6%) |
| $50,000 to $74,999 | 6,514 (87.2%) | 957 (12.8%) |
| $75,000 to $99,999 | 3,836 (96.6%) | 137 (3.5%) |
| $100,000 and over | 7,520 (95.8%) | 331 (4.2%) |
Public vs Private Health Insurance Coverage by Age in Alcorn County
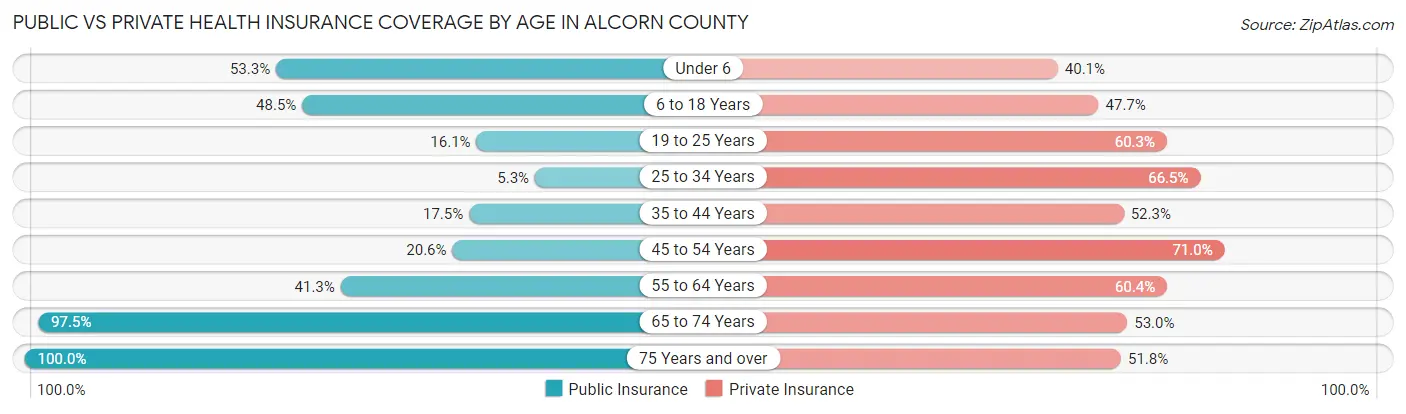
| Age Bracket | Public Insurance | Private Insurance |
| Under 6 | 1,221 (53.3%) | 918 (40.1%) |
| 6 to 18 Years | 2,887 (48.5%) | 2,839 (47.7%) |
| 19 to 25 Years | 462 (16.1%) | 1,727 (60.3%) |
| 25 to 34 Years | 204 (5.3%) | 2,575 (66.5%) |
| 35 to 44 Years | 698 (17.5%) | 2,086 (52.3%) |
| 45 to 54 Years | 918 (20.6%) | 3,166 (71.0%) |
| 55 to 64 Years | 1,828 (41.3%) | 2,670 (60.4%) |
| 65 to 74 Years | 3,523 (97.5%) | 1,915 (53.0%) |
| 75 Years and over | 2,502 (100.0%) | 1,297 (51.8%) |
| Total | 14,243 (41.9%) | 19,193 (56.5%) |
Disability Status by Sex by Age in Alcorn County
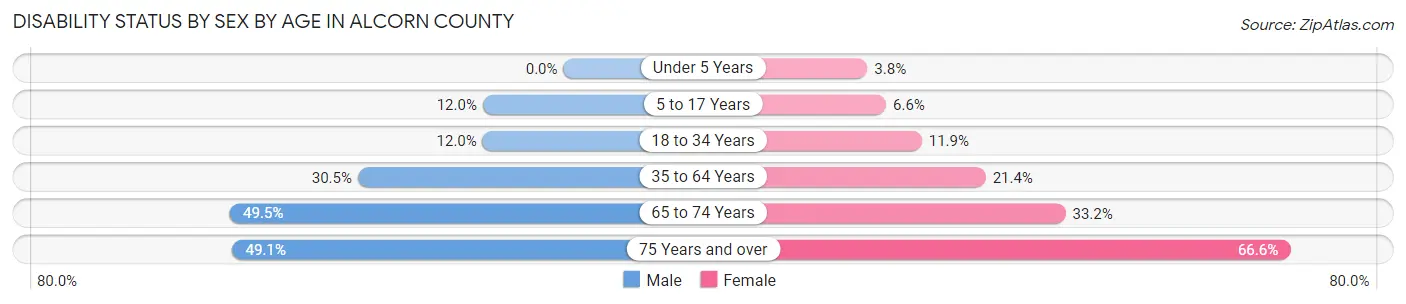
| Age Bracket | Male | Female |
| Under 5 Years | 0 (0.0%) | 37 (3.8%) |
| 5 to 17 Years | 361 (12.0%) | 195 (6.6%) |
| 18 to 34 Years | 436 (12.0%) | 412 (11.9%) |
| 35 to 64 Years | 1,896 (30.5%) | 1,422 (21.4%) |
| 65 to 74 Years | 820 (49.5%) | 650 (33.2%) |
| 75 Years and over | 505 (49.1%) | 981 (66.5%) |
Disability Class by Sex by Age in Alcorn County
Disability Class: Hearing Difficulty
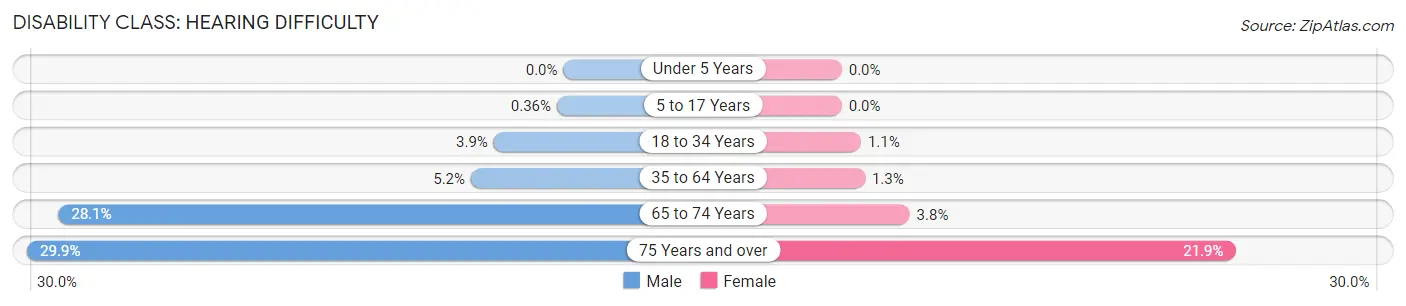
| Age Bracket | Male | Female |
| Under 5 Years | 0 (0.0%) | 0 (0.0%) |
| 5 to 17 Years | 11 (0.4%) | 0 (0.0%) |
| 18 to 34 Years | 141 (3.9%) | 37 (1.1%) |
| 35 to 64 Years | 320 (5.1%) | 86 (1.3%) |
| 65 to 74 Years | 466 (28.1%) | 74 (3.8%) |
| 75 Years and over | 307 (29.9%) | 323 (21.9%) |
Disability Class: Vision Difficulty
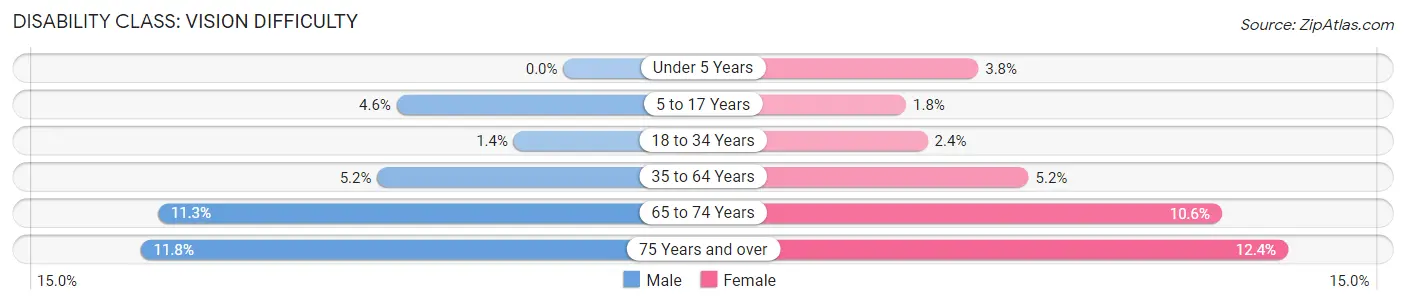
| Age Bracket | Male | Female |
| Under 5 Years | 0 (0.0%) | 37 (3.8%) |
| 5 to 17 Years | 140 (4.6%) | 53 (1.8%) |
| 18 to 34 Years | 50 (1.4%) | 83 (2.4%) |
| 35 to 64 Years | 322 (5.2%) | 346 (5.2%) |
| 65 to 74 Years | 187 (11.3%) | 207 (10.6%) |
| 75 Years and over | 121 (11.8%) | 183 (12.4%) |
Disability Class: Cognitive Difficulty
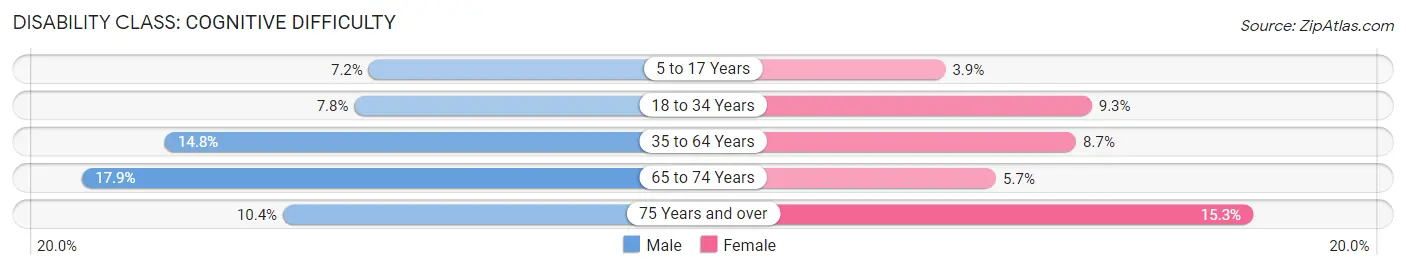
| Age Bracket | Male | Female |
| 5 to 17 Years | 218 (7.2%) | 114 (3.8%) |
| 18 to 34 Years | 282 (7.8%) | 322 (9.3%) |
| 35 to 64 Years | 919 (14.8%) | 579 (8.7%) |
| 65 to 74 Years | 296 (17.9%) | 112 (5.7%) |
| 75 Years and over | 107 (10.4%) | 225 (15.3%) |
Disability Class: Ambulatory Difficulty
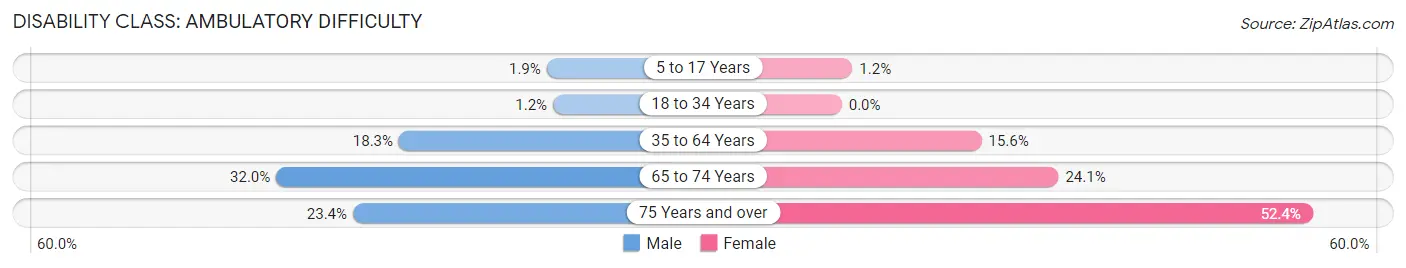
| Age Bracket | Male | Female |
| 5 to 17 Years | 56 (1.9%) | 35 (1.2%) |
| 18 to 34 Years | 42 (1.2%) | 0 (0.0%) |
| 35 to 64 Years | 1,138 (18.3%) | 1,035 (15.6%) |
| 65 to 74 Years | 530 (32.0%) | 472 (24.1%) |
| 75 Years and over | 241 (23.4%) | 773 (52.4%) |
Disability Class: Self-Care Difficulty
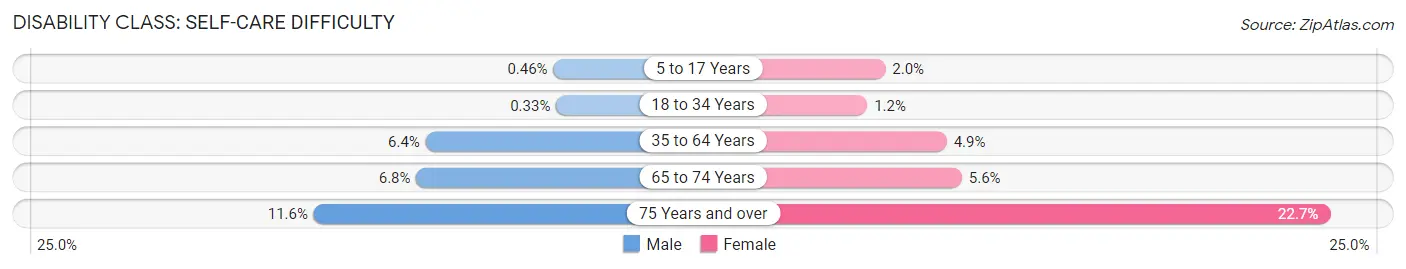
| Age Bracket | Male | Female |
| 5 to 17 Years | 14 (0.5%) | 60 (2.0%) |
| 18 to 34 Years | 12 (0.3%) | 41 (1.2%) |
| 35 to 64 Years | 397 (6.4%) | 324 (4.9%) |
| 65 to 74 Years | 113 (6.8%) | 109 (5.6%) |
| 75 Years and over | 119 (11.6%) | 334 (22.7%) |
Technology Access in Alcorn County
Computing Device Access in Alcorn County
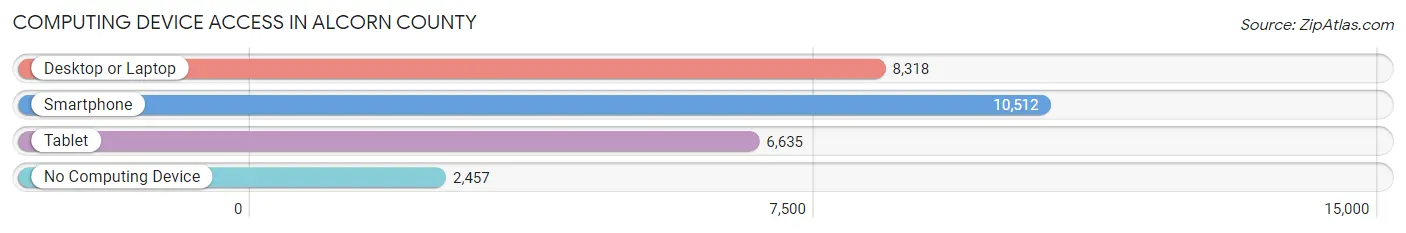
| Device Type | # Households | % Households |
| Desktop or Laptop | 8,318 | 59.5% |
| Smartphone | 10,512 | 75.2% |
| Tablet | 6,635 | 47.5% |
| No Computing Device | 2,457 | 17.6% |
| Total | 13,975 | 100.0% |
Internet Access in Alcorn County
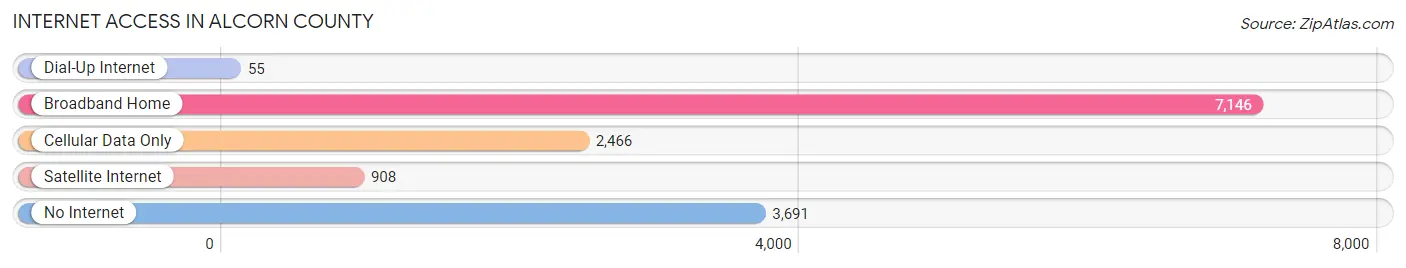
| Internet Type | # Households | % Households |
| Dial-Up Internet | 55 | 0.4% |
| Broadband Home | 7,146 | 51.1% |
| Cellular Data Only | 2,466 | 17.6% |
| Satellite Internet | 908 | 6.5% |
| No Internet | 3,691 | 26.4% |
| Total | 13,975 | 100.0% |
Alcorn County Summary
Alcorn County is located in the northeastern corner of Mississippi, bordered by Tennessee to the north and the Mississippi River to the east. It is part of the Golden Triangle region of Mississippi, which includes the counties of Alcorn, Prentiss, and Tishomingo. The county seat is Corinth, and the county has a population of 37,057 as of the 2020 census.
History
Alcorn County was established in 1870, and was named for Governor James L. Alcorn. It was formed from parts of Tishomingo, Prentiss, and Tippah counties. The county was originally part of the Chickasaw Nation, and was home to many Native American tribes, including the Chickasaw, Choctaw, and Cherokee.
The county was home to many Civil War battles, including the Battle of Corinth, which was fought in October 1862. The battle was a major victory for the Union forces, and resulted in the Confederate retreat from the area.
Geography
Alcorn County is located in the northeastern corner of Mississippi, and is bordered by Tennessee to the north and the Mississippi River to the east. The county is part of the Golden Triangle region of Mississippi, which includes the counties of Alcorn, Prentiss, and Tishomingo. The county has a total area of 545 square miles, of which 543 square miles is land and 2 square miles is water.
The county is mostly flat, with some rolling hills in the northern part of the county. The terrain is mostly forested, with some agricultural land in the southern part of the county. The county is home to several rivers, including the Hatchie River, which forms the county's eastern border.
Economy
Alcorn County has a diverse economy, with a mix of agriculture, manufacturing, and services. The county is home to several large employers, including the Corinth Coca-Cola Bottling Company, the Corinth-Alcorn County Airport, and the Corinth-Alcorn County Hospital.
Agriculture is a major part of the county's economy, with corn, soybeans, cotton, and hay being the main crops. The county is also home to several poultry farms, and is a major producer of eggs.
Manufacturing is also an important part of the county's economy, with several factories producing furniture, textiles, and automotive parts. The county is also home to several technology companies, including a software development firm and a medical device manufacturer.
Demographics
As of the 2020 census, Alcorn County had a population of 37,057. The population is mostly white (83.3%), with African Americans making up 14.2% of the population. The median household income is $41,945, and the median age is 38.7.
The county is home to several colleges and universities, including the University of Mississippi at Corinth, Mississippi State University at Corinth, and Northeast Mississippi Community College. The county is also home to several museums, including the Corinth Civil War Interpretive Center and the Alcorn County Historical Museum.
Conclusion
Alcorn County is a diverse county located in the northeastern corner of Mississippi. It is part of the Golden Triangle region of Mississippi, and is home to many Civil War sites. The county has a diverse economy, with a mix of agriculture, manufacturing, and services. The population is mostly white, with African Americans making up 14.2% of the population. The county is home to several colleges and universities, and is a major producer of eggs and other agricultural products.
Common Questions
What is the Total Population of Alcorn County?
Total Population of Alcorn County is 34,717.
What is the Total Male Population of Alcorn County?
Total Male Population of Alcorn County is 16,911.
What is the Total Female Population of Alcorn County?
Total Female Population of Alcorn County is 17,806.
What is the Ratio of Males per 100 Females in Alcorn County?
There are 94.97 Males per 100 Females in Alcorn County.
What is the Ratio of Females per 100 Males in Alcorn County?
There are 105.29 Females per 100 Males in Alcorn County.
What is the Median Population Age in Alcorn County?
Median Population Age in Alcorn County is 40.1 Years.
What is the Average Family Size in Alcorn County
Average Family Size in Alcorn County is 3.0 People.
What is the Average Household Size in Alcorn County
Average Household Size in Alcorn County is 2.4 People.
What is Per Capita Income in Alcorn County?
Per Capita income in Alcorn County is $27,320.
What is the Median Family Income in Alcorn County?
Median Family Income in Alcorn County is $60,382.
What is the Median Household income in Alcorn County?
Median Household Income in Alcorn County is $47,716.
What is Income or Wage Gap in Alcorn County?
Income or Wage Gap in Alcorn County is 26.9%.
Women in Alcorn County earn 73.1 cents for every dollar earned by a man.
What is Inequality or Gini Index in Alcorn County?
Inequality or Gini Index in Alcorn County is 0.49.
How Large is the Labor Force in Alcorn County?
There are 15,391 People in the Labor Forcein in Alcorn County.
What is the Percentage of People in the Labor Force in Alcorn County?
55.2% of People are in the Labor Force in Alcorn County.
What is the Unemployment Rate in Alcorn County?
Unemployment Rate in Alcorn County is 6.4%.