Zip Codes with the Highest Percentage of Population Employed in Architecture & Engineering in Biloxi, MS
RELATED REPORTS & OPTIONS
Architecture & Engineering
Biloxi
Compare Zip Codes
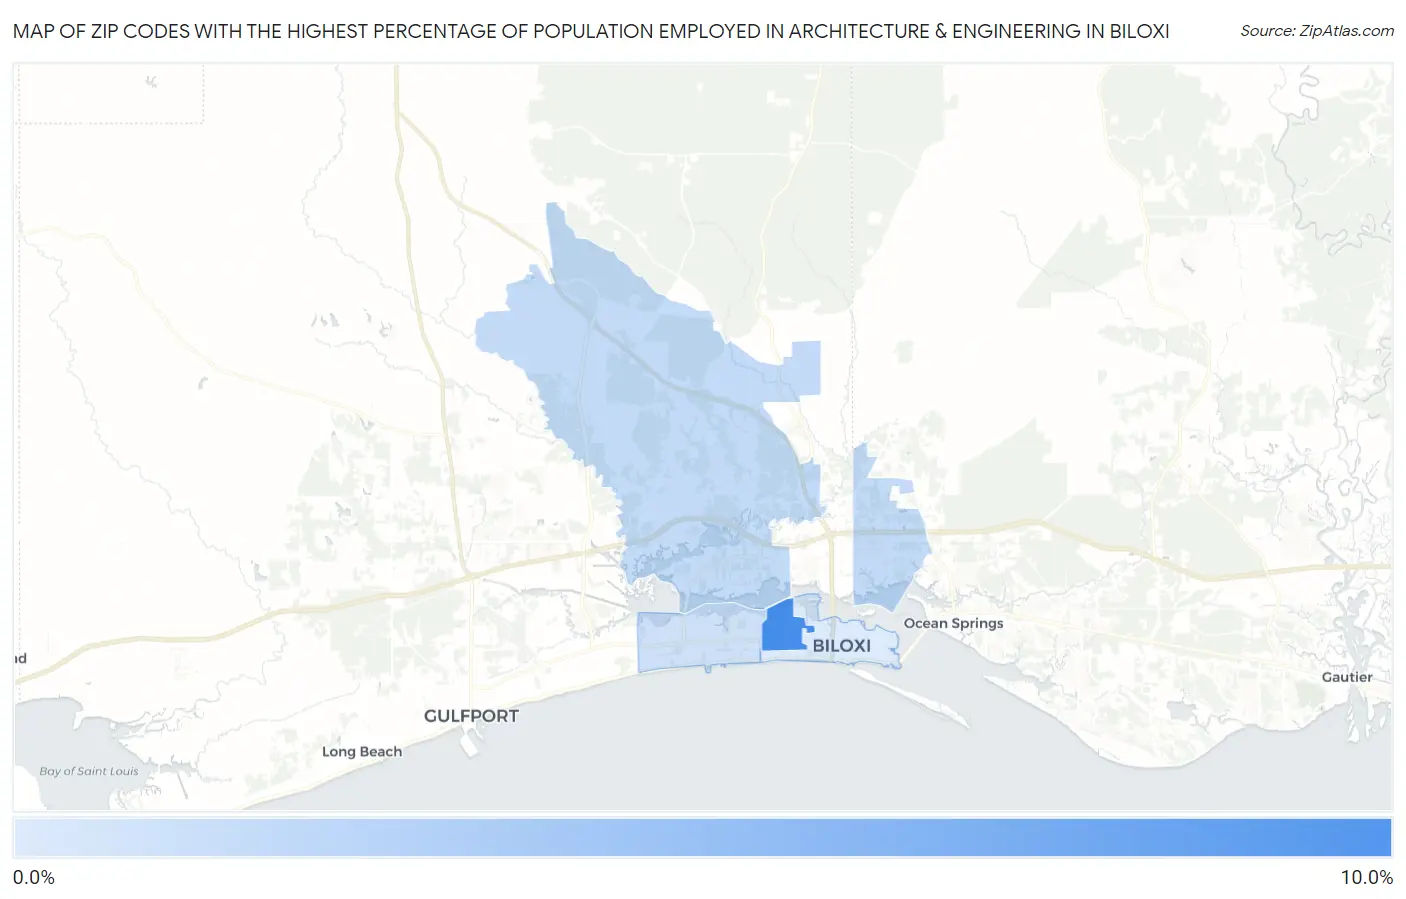
Map of Zip Codes with the Highest Percentage of Population Employed in Architecture & Engineering in Biloxi
0.0%
10.0%
Zip Codes with the Highest Percentage of Population Employed in Architecture & Engineering in Biloxi, MS
| Zip Code | % Employed | vs State | vs National | |
| 1. | 39534 | 8.7% | 1.5%(+7.26)#7 | 2.1%(+6.60)#450 |
| 2. | 39532 | 1.9% | 1.5%(+0.407)#82 | 2.1%(-0.255)#10,288 |
| 3. | 39531 | 1.3% | 1.5%(-0.198)#129 | 2.1%(-0.860)#14,379 |
| 4. | 39530 | 0.60% | 1.5%(-0.882)#192 | 2.1%(-1.54)#19,587 |
1
Common Questions
What are the Top 3 Zip Codes with the Highest Percentage of Population Employed in Architecture & Engineering in Biloxi, MS?
Top 3 Zip Codes with the Highest Percentage of Population Employed in Architecture & Engineering in Biloxi, MS are:
What zip code has the Highest Percentage of Population Employed in Architecture & Engineering in Biloxi, MS?
39534 has the Highest Percentage of Population Employed in Architecture & Engineering in Biloxi, MS with 8.7%.
What is the Percentage of Population Employed in Architecture & Engineering in Biloxi, MS?
Percentage of Population Employed in Architecture & Engineering in Biloxi is 1.3%.
What is the Percentage of Population Employed in Architecture & Engineering in Mississippi?
Percentage of Population Employed in Architecture & Engineering in Mississippi is 1.5%.
What is the Percentage of Population Employed in Architecture & Engineering in the United States?
Percentage of Population Employed in Architecture & Engineering in the United States is 2.1%.