Zip Codes with the Highest Percentage of Population Employed in Architecture & Engineering in Tupelo, MS
RELATED REPORTS & OPTIONS
Architecture & Engineering
Tupelo
Compare Zip Codes
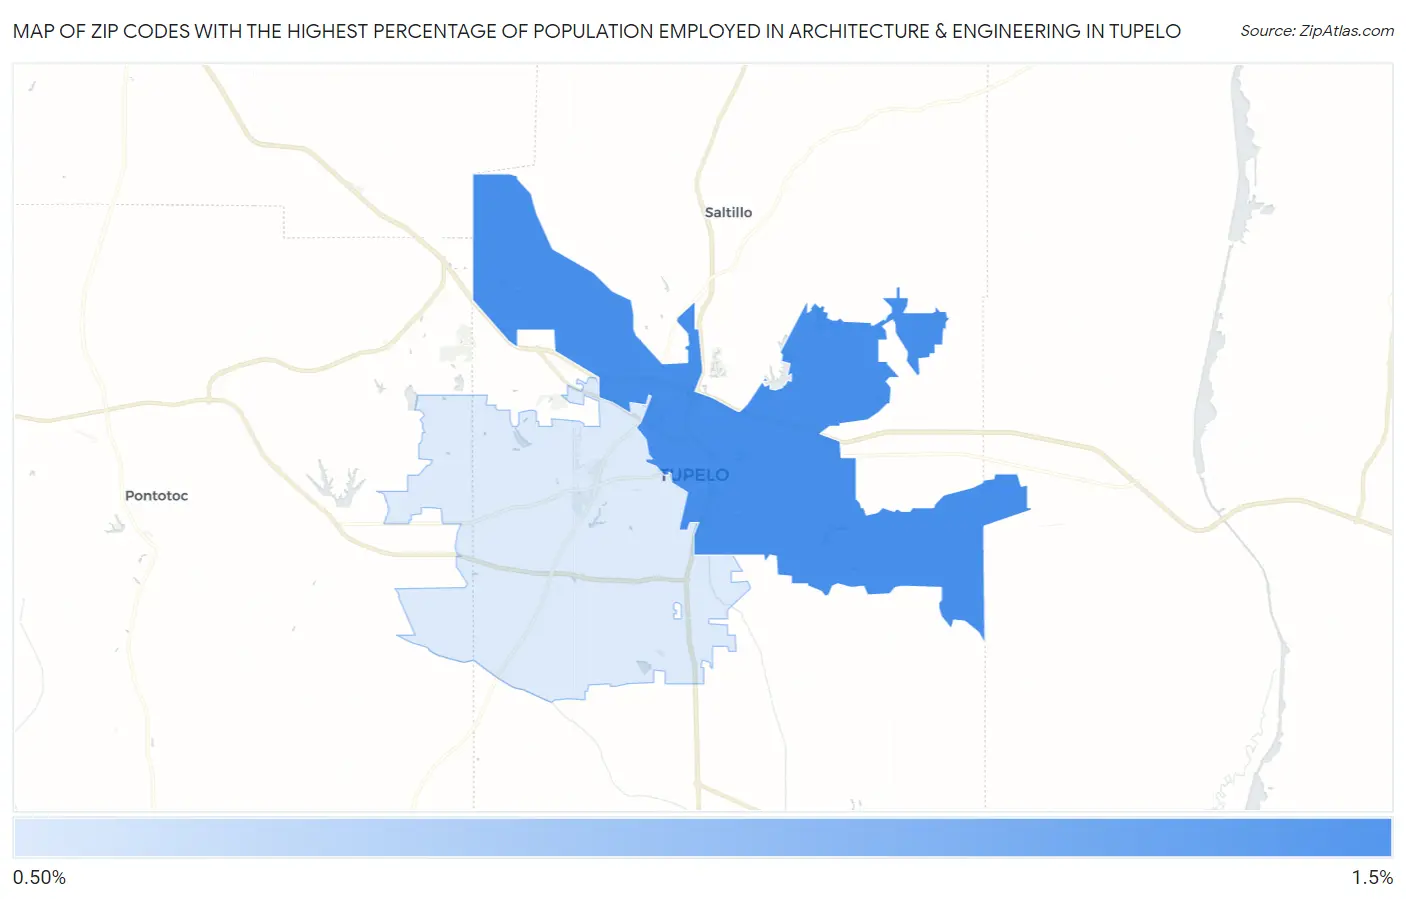
Map of Zip Codes with the Highest Percentage of Population Employed in Architecture & Engineering in Tupelo
0.0%
1.5%
Zip Codes with the Highest Percentage of Population Employed in Architecture & Engineering in Tupelo, MS
| Zip Code | % Employed | vs State | vs National | |
| 1. | 38804 | 1.5% | 1.5%(-0.023)#116 | 2.1%(-0.685)#13,134 |
| 2. | 38801 | 0.61% | 1.5%(-0.882)#191 | 2.1%(-1.54)#19,585 |
1
Common Questions
What are the Top Zip Codes with the Highest Percentage of Population Employed in Architecture & Engineering in Tupelo, MS?
Top Zip Codes with the Highest Percentage of Population Employed in Architecture & Engineering in Tupelo, MS are:
What zip code has the Highest Percentage of Population Employed in Architecture & Engineering in Tupelo, MS?
38804 has the Highest Percentage of Population Employed in Architecture & Engineering in Tupelo, MS with 1.5%.
What is the Percentage of Population Employed in Architecture & Engineering in Tupelo, MS?
Percentage of Population Employed in Architecture & Engineering in Tupelo is 1.1%.
What is the Percentage of Population Employed in Architecture & Engineering in Mississippi?
Percentage of Population Employed in Architecture & Engineering in Mississippi is 1.5%.
What is the Percentage of Population Employed in Architecture & Engineering in the United States?
Percentage of Population Employed in Architecture & Engineering in the United States is 2.1%.