Zip Codes with the Highest Percentage of Immigrants from Eastern Asia in Biloxi, MS
RELATED REPORTS & OPTIONS
Eastern Asia
Biloxi
Compare Zip Codes
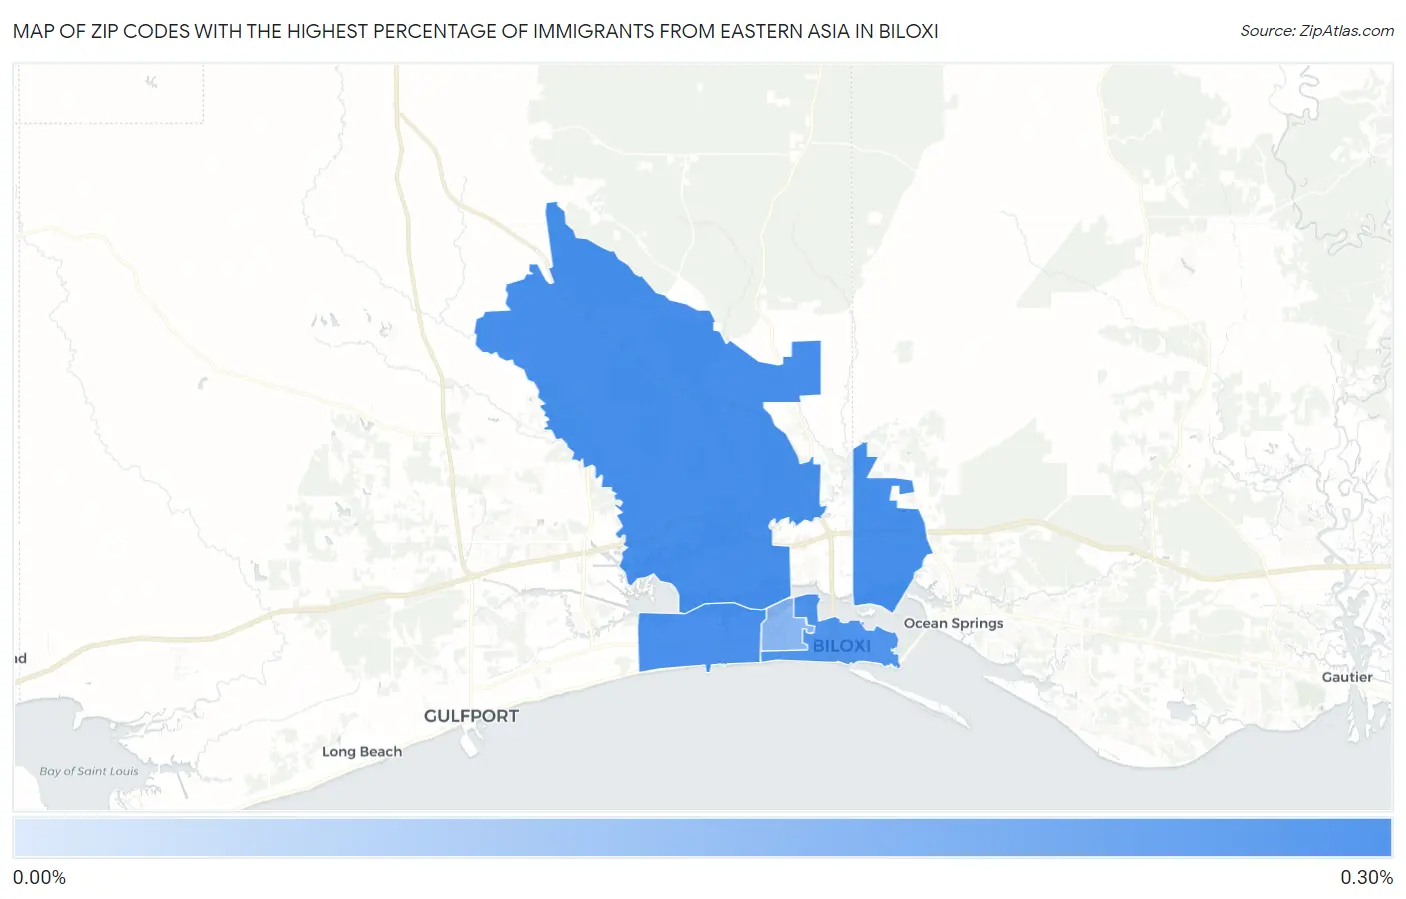
Map of Zip Codes with the Highest Percentage of Immigrants from Eastern Asia in Biloxi
0.00%
0.30%
Zip Codes with the Highest Percentage of Immigrants from Eastern Asia in Biloxi, MS
| Zip Code | Eastern Asia | vs State | vs National | |
| 1. | 39532 | 0.29% | 0.17%(+0.115)#34 | 1.28%(-0.990)#8,964 |
| 2. | 39531 | 0.28% | 0.17%(+0.112)#35 | 1.28%(-0.993)#8,996 |
| 3. | 39530 | 0.27% | 0.17%(+0.098)#38 | 1.28%(-1.01)#9,177 |
| 4. | 39534 | 0.16% | 0.17%(-0.013)#54 | 1.28%(-1.12)#11,042 |
1
Common Questions
What are the Top 3 Zip Codes with the Highest Percentage of Immigrants from Eastern Asia in Biloxi, MS?
Top 3 Zip Codes with the Highest Percentage of Immigrants from Eastern Asia in Biloxi, MS are:
What zip code has the Highest Percentage of Immigrants from Eastern Asia in Biloxi, MS?
39532 has the Highest Percentage of Immigrants from Eastern Asia in Biloxi, MS with 0.29%.
What is the Percentage of Immigrants from Eastern Asia in Biloxi, MS?
Percentage of Immigrants from Eastern Asia in Biloxi is 0.35%.
What is the Percentage of Immigrants from Eastern Asia in Mississippi?
Percentage of Immigrants from Eastern Asia in Mississippi is 0.17%.
What is the Percentage of Immigrants from Eastern Asia in the United States?
Percentage of Immigrants from Eastern Asia in the United States is 1.28%.