Zip Codes with the Highest Percentage of Population Employed in Legal Services & Support in Inver Grove Heights, MN
RELATED REPORTS & OPTIONS
Legal Services & Support
Inver Grove Heights
Compare Zip Codes
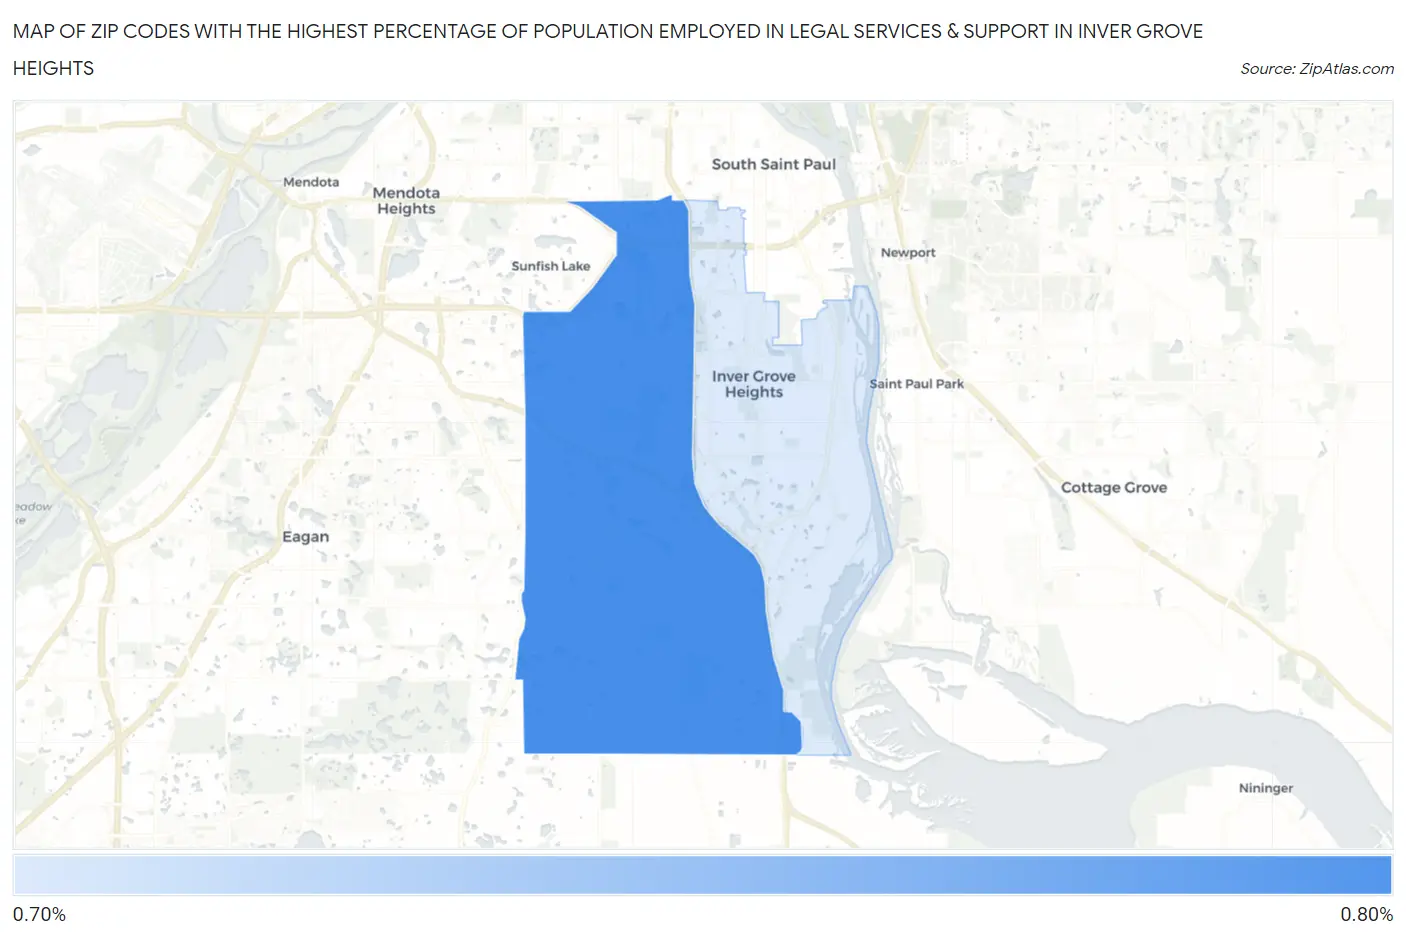
Map of Zip Codes with the Highest Percentage of Population Employed in Legal Services & Support in Inver Grove Heights
0.0%
0.80%
Zip Codes with the Highest Percentage of Population Employed in Legal Services & Support in Inver Grove Heights, MN
| Zip Code | % Employed | vs State | vs National | |
| 1. | 55077 | 0.77% | 1.0%(-0.258)#214 | 1.2%(-0.410)#9,709 |
| 2. | 55076 | 0.75% | 1.0%(-0.277)#226 | 1.2%(-0.430)#9,883 |
1
Common Questions
What are the Top Zip Codes with the Highest Percentage of Population Employed in Legal Services & Support in Inver Grove Heights, MN?
Top Zip Codes with the Highest Percentage of Population Employed in Legal Services & Support in Inver Grove Heights, MN are:
What zip code has the Highest Percentage of Population Employed in Legal Services & Support in Inver Grove Heights, MN?
55077 has the Highest Percentage of Population Employed in Legal Services & Support in Inver Grove Heights, MN with 0.77%.
What is the Percentage of Population Employed in Legal Services & Support in Inver Grove Heights, MN?
Percentage of Population Employed in Legal Services & Support in Inver Grove Heights is 0.75%.
What is the Percentage of Population Employed in Legal Services & Support in Minnesota?
Percentage of Population Employed in Legal Services & Support in Minnesota is 1.0%.
What is the Percentage of Population Employed in Legal Services & Support in the United States?
Percentage of Population Employed in Legal Services & Support in the United States is 1.2%.