Zip Codes with the Highest Percentage of Population Employed in Administrative & Support Services in Burnsville, MN
RELATED REPORTS & OPTIONS
Administrative & Support Services
Burnsville
Compare Zip Codes
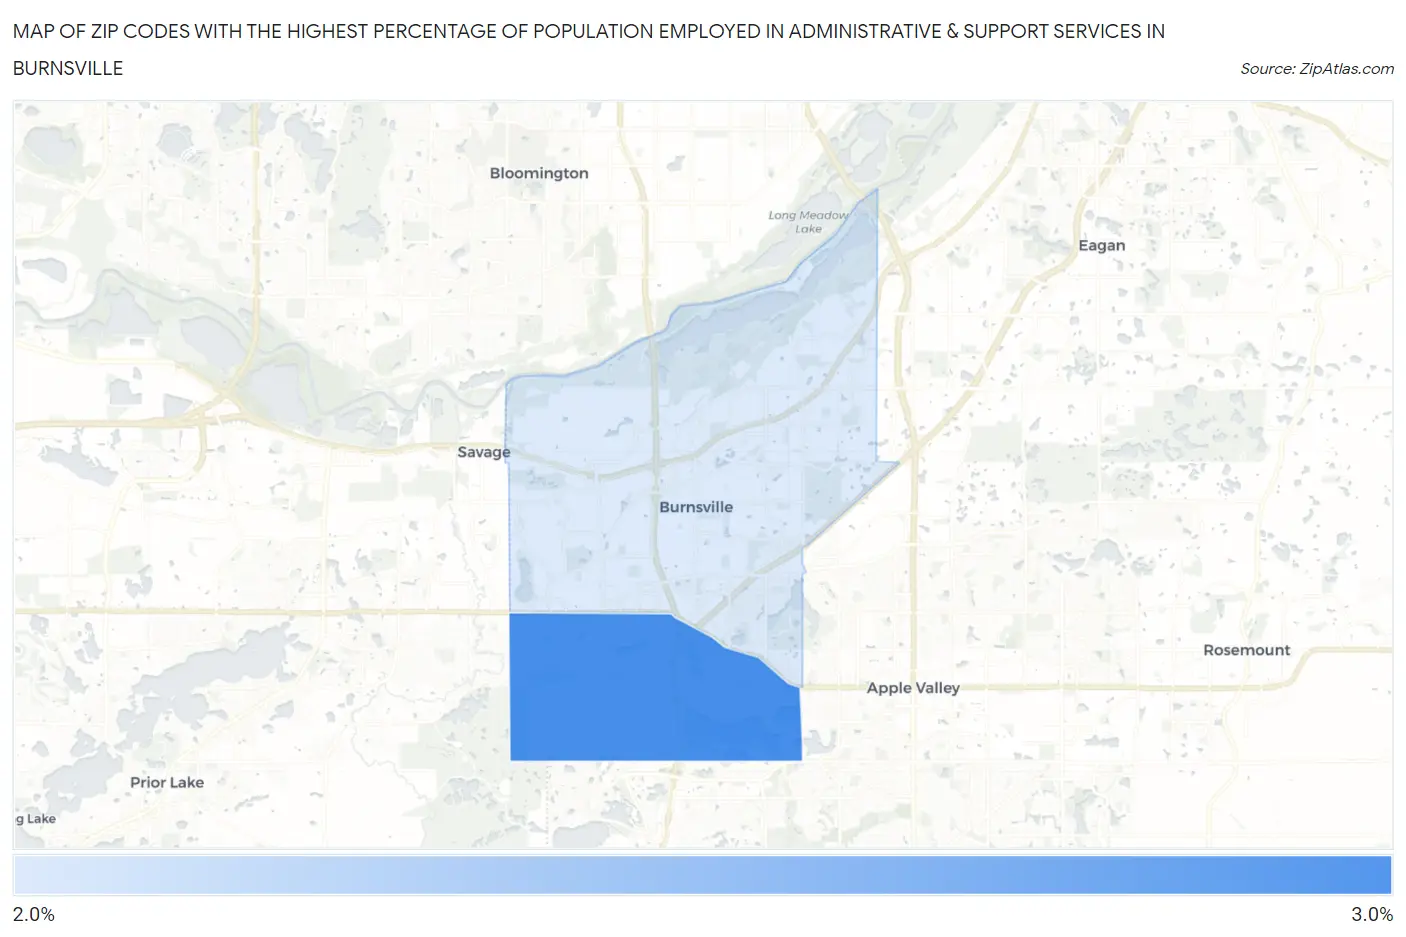
Map of Zip Codes with the Highest Percentage of Population Employed in Administrative & Support Services in Burnsville
0.0%
3.0%
Zip Codes with the Highest Percentage of Population Employed in Administrative & Support Services in Burnsville, MN
| Zip Code | % Employed | vs State | vs National | |
| 1. | 55306 | 2.8% | 3.0%(-0.201)#314 | 4.1%(-1.31)#16,306 |
| 2. | 55337 | 2.6% | 3.0%(-0.467)#364 | 4.1%(-1.57)#17,734 |
1
Common Questions
What are the Top Zip Codes with the Highest Percentage of Population Employed in Administrative & Support Services in Burnsville, MN?
Top Zip Codes with the Highest Percentage of Population Employed in Administrative & Support Services in Burnsville, MN are:
What zip code has the Highest Percentage of Population Employed in Administrative & Support Services in Burnsville, MN?
55306 has the Highest Percentage of Population Employed in Administrative & Support Services in Burnsville, MN with 2.8%.
What is the Percentage of Population Employed in Administrative & Support Services in Burnsville, MN?
Percentage of Population Employed in Administrative & Support Services in Burnsville is 2.6%.
What is the Percentage of Population Employed in Administrative & Support Services in Minnesota?
Percentage of Population Employed in Administrative & Support Services in Minnesota is 3.0%.
What is the Percentage of Population Employed in Administrative & Support Services in the United States?
Percentage of Population Employed in Administrative & Support Services in the United States is 4.1%.