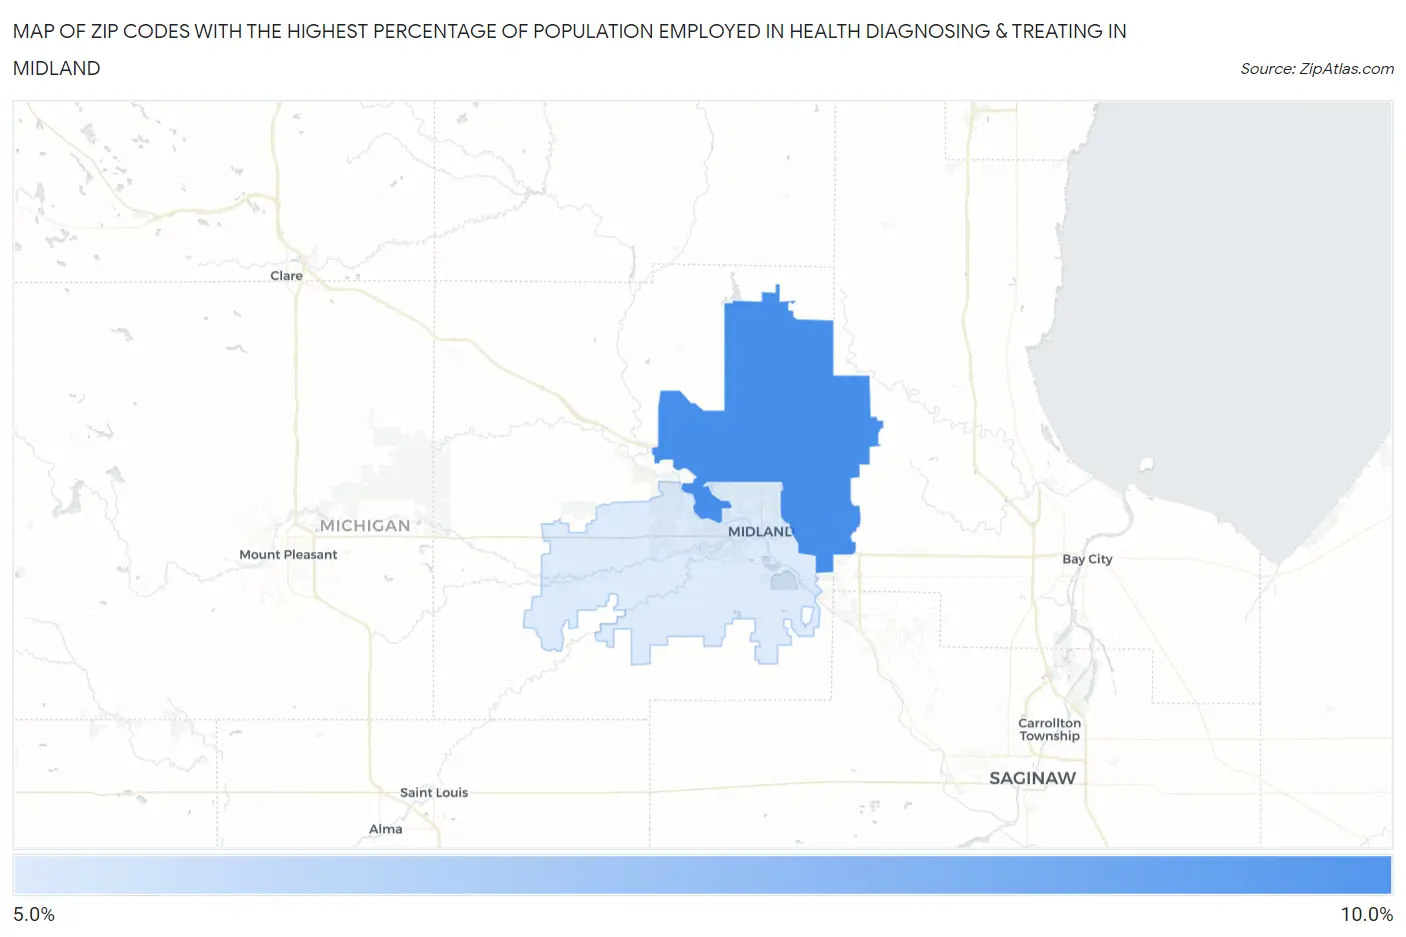
Zip Codes with the Highest Percentage of Population Employed in Health Diagnosing & Treating in Midland, MI
RELATED REPORTS & OPTIONS
Health Diagnosing & Treating
Midland
Compare Zip Codes
Map of Zip Codes with the Highest Percentage of Population Employed in Health Diagnosing & Treating in Midland
0.0%
10.0%
Zip Codes with the Highest Percentage of Population Employed in Health Diagnosing & Treating in Midland, MI
| Zip Code | % Employed | vs State | vs National | |
| 1. | 48642 | 9.3% | 6.6%(+2.69)#119 | 6.2%(+3.09)#4,791 |
| 2. | 48640 | 5.9% | 6.6%(-0.781)#462 | 6.2%(-0.380)#14,359 |
1
Common Questions
What are the Top Zip Codes with the Highest Percentage of Population Employed in Health Diagnosing & Treating in Midland, MI?
Top Zip Codes with the Highest Percentage of Population Employed in Health Diagnosing & Treating in Midland, MI are:
What zip code has the Highest Percentage of Population Employed in Health Diagnosing & Treating in Midland, MI?
48642 has the Highest Percentage of Population Employed in Health Diagnosing & Treating in Midland, MI with 9.3%.
What is the Percentage of Population Employed in Health Diagnosing & Treating in Midland, MI?
Percentage of Population Employed in Health Diagnosing & Treating in Midland is 6.1%.
What is the Percentage of Population Employed in Health Diagnosing & Treating in Michigan?
Percentage of Population Employed in Health Diagnosing & Treating in Michigan is 6.6%.
What is the Percentage of Population Employed in Health Diagnosing & Treating in the United States?
Percentage of Population Employed in Health Diagnosing & Treating in the United States is 6.2%.