Zip Codes with the Highest Percentage of Population Employed in Computer & Mathematics in Westland, MI
RELATED REPORTS & OPTIONS
Computer & Mathematics
Westland
Compare Zip Codes
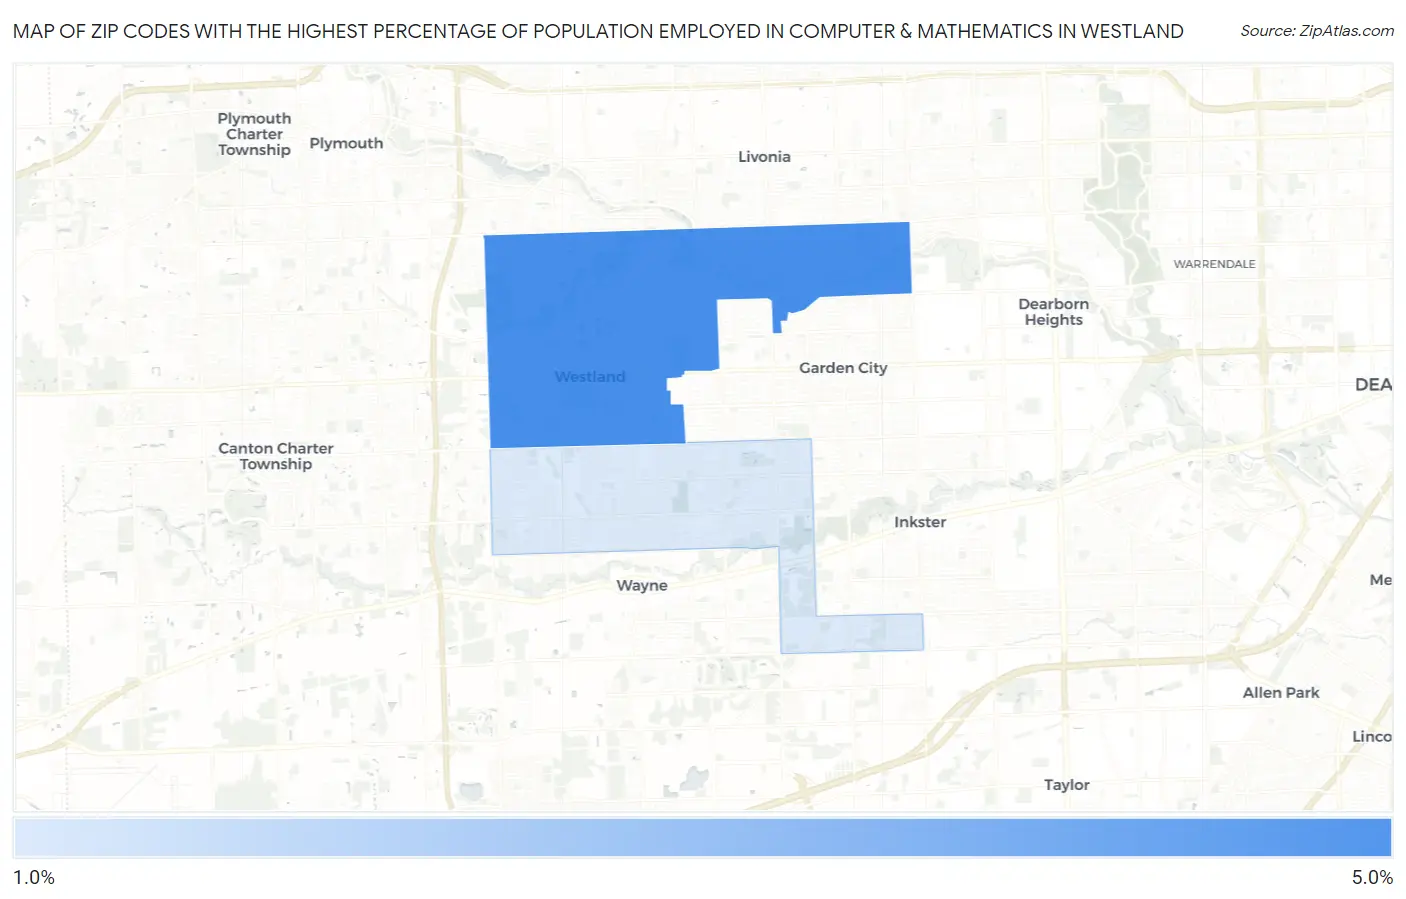
Map of Zip Codes with the Highest Percentage of Population Employed in Computer & Mathematics in Westland
0.0%
5.0%
Zip Codes with the Highest Percentage of Population Employed in Computer & Mathematics in Westland, MI
| Zip Code | % Employed | vs State | vs National | |
| 1. | 48185 | 4.2% | 2.9%(+1.28)#104 | 3.5%(+0.685)#4,594 |
| 2. | 48186 | 1.9% | 2.9%(-1.04)#394 | 3.5%(-1.64)#12,358 |
1
Common Questions
What are the Top Zip Codes with the Highest Percentage of Population Employed in Computer & Mathematics in Westland, MI?
Top Zip Codes with the Highest Percentage of Population Employed in Computer & Mathematics in Westland, MI are:
What zip code has the Highest Percentage of Population Employed in Computer & Mathematics in Westland, MI?
48185 has the Highest Percentage of Population Employed in Computer & Mathematics in Westland, MI with 4.2%.
What is the Percentage of Population Employed in Computer & Mathematics in Westland, MI?
Percentage of Population Employed in Computer & Mathematics in Westland is 3.2%.
What is the Percentage of Population Employed in Computer & Mathematics in Michigan?
Percentage of Population Employed in Computer & Mathematics in Michigan is 2.9%.
What is the Percentage of Population Employed in Computer & Mathematics in the United States?
Percentage of Population Employed in Computer & Mathematics in the United States is 3.5%.