Zip Codes with the Highest Percentage of Population Employed in Security & Protection in Dearborn, MI
RELATED REPORTS & OPTIONS
Security & Protection
Dearborn
Compare Zip Codes
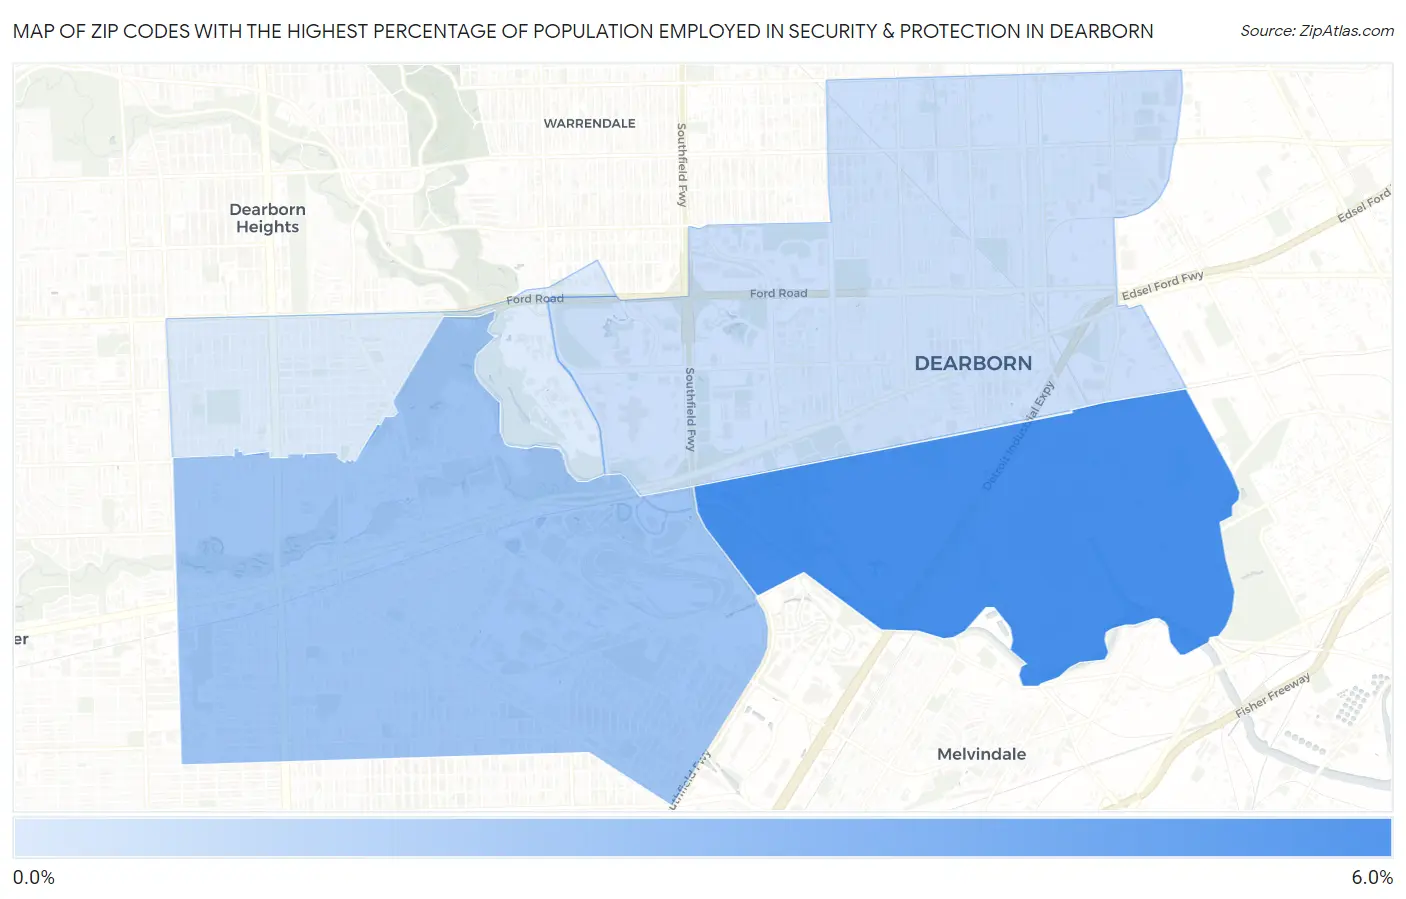
Map of Zip Codes with the Highest Percentage of Population Employed in Security & Protection in Dearborn
0.0%
6.0%
Zip Codes with the Highest Percentage of Population Employed in Security & Protection in Dearborn, MI
| Zip Code | % Employed | vs State | vs National | |
| 1. | 48120 | 5.4% | 1.6%(+3.75)#33 | 2.1%(+3.24)#2,547 |
| 2. | 48124 | 2.6% | 1.6%(+0.976)#176 | 2.1%(+0.469)#8,919 |
| 3. | 48126 | 1.3% | 1.6%(-0.339)#517 | 2.1%(-0.846)#17,709 |
| 4. | 48128 | 0.74% | 1.6%(-0.900)#699 | 2.1%(-1.41)#21,797 |
1
Common Questions
What are the Top 3 Zip Codes with the Highest Percentage of Population Employed in Security & Protection in Dearborn, MI?
Top 3 Zip Codes with the Highest Percentage of Population Employed in Security & Protection in Dearborn, MI are:
What zip code has the Highest Percentage of Population Employed in Security & Protection in Dearborn, MI?
48120 has the Highest Percentage of Population Employed in Security & Protection in Dearborn, MI with 5.4%.
What is the Percentage of Population Employed in Security & Protection in Dearborn, MI?
Percentage of Population Employed in Security & Protection in Dearborn is 2.0%.
What is the Percentage of Population Employed in Security & Protection in Michigan?
Percentage of Population Employed in Security & Protection in Michigan is 1.6%.
What is the Percentage of Population Employed in Security & Protection in the United States?
Percentage of Population Employed in Security & Protection in the United States is 2.1%.